

Abstract
To best interact with the external world, humans are often required to consider the quality of their actions. Sometimes the environment furnishes rewards or punishments to signal action efficacy. However, when such feedback is absent or only partial, we must rely on internally generated signals to evaluate our performance (i.e., metacognition). Yet, very little is known about how humans form such judgements of sensorimotor confidence. Do they monitor their actual performance or do they rely on cues to sensorimotor uncertainty? We investigated sensorimotor metacognition in two visuomotor tracking experiments, where participants followed an unpredictably moving dot cloud with a mouse cursor as it followed a random horizontal trajectory. Their goal was to infer the underlying target generating the dots, track it for several seconds, and then report their confidence in their tracking as better or worse than their average. In Experiment 1, we manipulated task difficulty with two methods: varying the size of the dot cloud and varying the stability of the target’s velocity. In Experiment 2, the stimulus statistics were fixed and duration of the stimulus presentation was varied. We found similar levels of metacognitive sensitivity in all experiments, which was evidence against the cue-based strategy. The temporal analysis of metacognitive sensitivity revealed a recency effect, where error later in the trial had a greater influence on the sensorimotor confidence, consistent with a performance-monitoring strategy. From these results, we conclude that humans predominantly monitored their tracking performance, albeit inefficiently, to build a sense of sensorimotor confidence.
Keywords: Sensorimotor, Confidence, Metacognition, Perception, Action, Tracking
1. Introduction
Sensorimotor decision-making is fundamental for humans and animals when interacting with their environment. It determines where we look, how we move our limbs through space, or what actions we select to intercept or avoid objects. In return, we may receive decision feedback from the environment, such as resources, knowledge, social standing, injury, or embarrassment. The outcomes of an action are often crucial for determining subsequent sensorimotor decision-making, particularly in dynamic scenarios where a series of actions are chained together to achieve a sensorimotor goal (e.g., dancing or tracking a target). But what happens if external feedback is absent, partial, or significantly delayed? How then do we judge if an action has been performed well? One possible solution is for the person to form their own subjective evaluation of sensorimotor performance using whatever sensory or motor signals are available. These metacognitive judgements reflect the person’s confidence that their action or series of actions were correct or well-suited to their sensorimotor goal. Yet, despite such judgements being a familiar and everyday occurrence, they have received relatively little direct scientific scrutiny.
Before surveying the scientific context for the current study, it is imperative we clearly define sensorimotor confidence. We consider three components necessary for the formation of sensorimotor confidence, illustrated in Fig. 1. First, there must be sensory inputs relevant for action selection and a consideration of the perceptual uncertainty or error of these inputs when assigning confidence. That is, sensory signals weakened by external or internal noise (e.g., foggy day, low attentional resources) should negatively affect confidence. However, it is important to note that observers may hold false beliefs about their sensory observations, which should be reflected in their subjective evaluations. The second crucial element is the performed action, with a consideration of the specific action taken (i.e., motor awareness) and an estimate of uncertainty or error in the action execution. Decreased motor awareness or experience of large motor noise should decrease sensorimotor confidence, unless the actor holds false beliefs. Evaluations of motor performance can come from various sources of information, from motor commands, proprioception, or self-observation of the action with one of the senses (e.g., seeing one’s own hand during a reach). Finally, there must be a consideration of the sensorimotor goal, the objective for purposeful action, which defines the landscape of success and failure for the individual. First, the consequences of error may be asymmetric or lead to varying outcomes (e.g., stopping short of an intersection versus going too far; for an example of the effect of an asymmetric loss function, see Mamassian & Landy, 2010), so sensorimotor goals should be selected by appropriately factoring in the consequences of different potential outcomes (Trommershäuser et al., 2008). Alternatively, an entirely wrong goal can be selected, leading to errors even when actions are well-executed under ideal viewing conditions (e.g., mistakenly trying to unlock a car that is not yours but looks similar). From a more subjective perspective, individuals may differ in terms of what is considered success or failure, such as the goals of novice sports players versus professionals, which colour their evaluations of performance. Thus, evaluating the sensorimotor goal itself should be considered part of sensorimotor confidence. We propose that subjective reports in the absence of any one of these three elements do not constitute sensorimotor confidence but rather different forms of confidence (e.g., perceptual confidence, motor-awareness confidence, etc.).
Fig. 1.
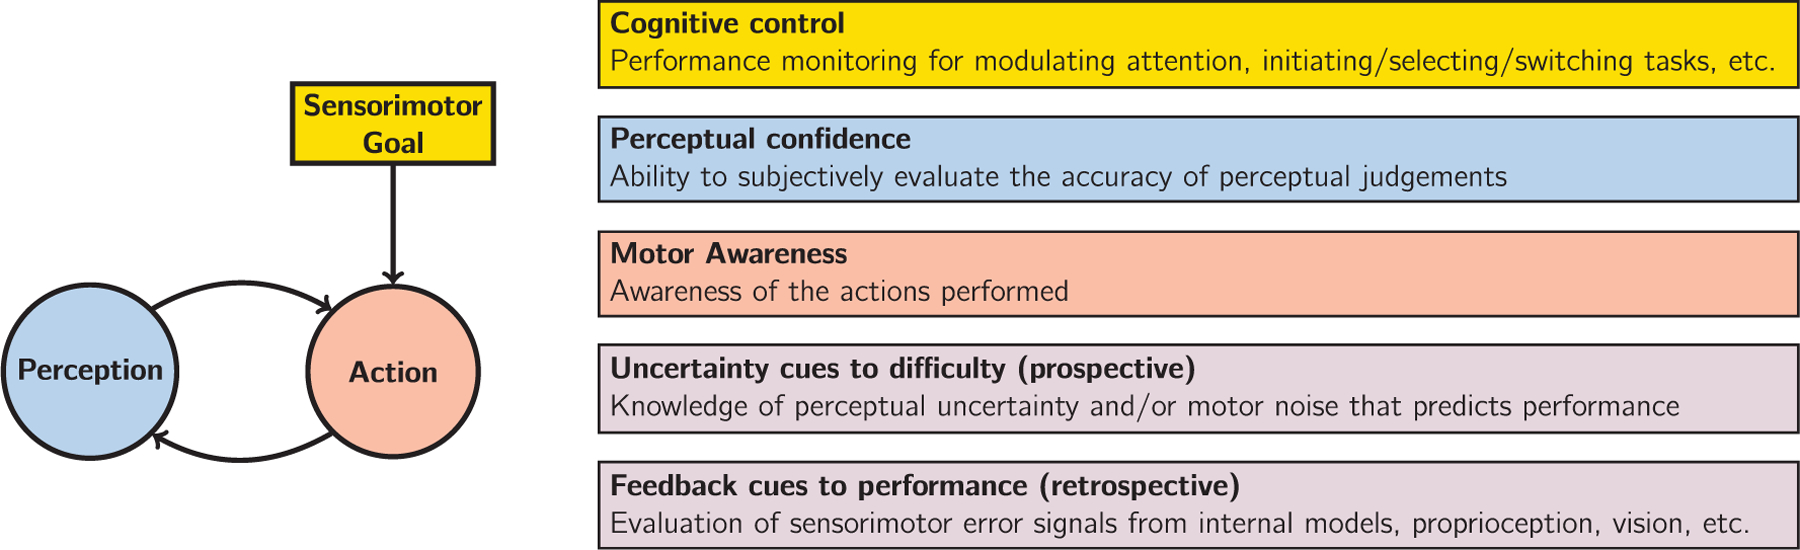
Components of sensorimotor control (left) and related topics in the literature (right). Sensorimotor confidence is a subjective evaluation of how well behaviour fulfilled the sensorimotor goal, considering both sensory and motor factors. The topic of sensorimotor confidence is complementary to the discussions of cognitive control, perceptual confidence, motor awareness, uncertainty, and self-generated feedback. It is likely that cues to difficulty and performance, that are responsible for the computation of sensorimotor confidence, originate both from sensory and motor sources. The former cues are prospective as they are related to how well the acting agent can potentially perform, whereas the latter are retrospective, they become available only after the action has occurred.
Elements of sensorimotor confidence have been touched upon in a variety of domains, highlighting many of brain’s sophisticated monitoring and control processes that operate on internally-gathered information (see Fig. 1 for a summary). For the highest level of processing, there is the study of cognitive control, which describes how the goals or plans translate into actual behaviour. It is thought that cognitive control is responsible for the appropriate deployment of attention, as well as voluntary selection, initiation, switching, or termination of tasks (Alexander & Brown, 2010; Botvinick et al., 2001; Norman & Shallice, 1986). At the lowest level of processing, there is the study of sensorimotor control. Usually, research questions focus on how the brain senses discrepancies between the intended outcome of motor commands, as specified by an internal model, and the actual action outcomes, that are processed as a feedback signal, to correct and update subsequent motor control signals (Todorov, 2004; Wolpert et al., 1995). While the understanding of sensorimotor processes is quite advanced, both at the behavioural and neural levels, very little is known about our ability to consciously monitor sensorimotor performance.
If the action is reduced to a simple report of what is perceived, the monitoring of sensorimotor performance reduces to the study of perceptual confidence (Fleming & Dolan, 2012; Mamassian, 2016; Pleskac & Busemeyer, 2010). Perceptual confidence is a metacognitive process that corresponds to the subjective sense of the correctness of our perceptual decisions (Galvin et al., 2003; Pouget et al., 2016). Human observers exhibit considerable sensitivity to the quality of the processing of sensory information and the resulting ability to predict the correctness of a perceptual choice (Adler & Ma, 2018; Barthelmé & Mamassian, 2010; Kiani et al., 2014). However this so-called Type-2 judgement often incurs additional noise, on top of the sensory noise that impairs perceptual performance (Type-1 decisions) (Maniscalco & Lau, 2016). More recently, researchers have considered the contribution of motor factors in perceptual confidence (Fleming & Daw, 2017; Kiani et al., 2014; Yeung & Summerfield, 2012). Such elements are crucial, for example, for the observer to respond “low confidence” on lapse trials where they are sure they mistakenly pressed the wrong key. In other examples, motor behaviour is used as an index of perceptual confidence by tracking hand kinematics while observers report their perceptual judgement (Dotan et al., 2018; Patel et al., 2012; Resulaj et al., 2009). However, these noted contributions are often restricted to simple motor behaviours, and do not take into account sources of response variability from action execution.
Motor awareness, the degree to which we are conscious of the actions we take (Blakemore et al., 2002; Blakemore & Frith, 2003), is also likely to contribute to sensorimotor confidence. Not all actions are consciously monitored, and it is a common experience to act without conscious control. For example, when we are walking, we are not always thinking of exactly how to place one foot in front of the other. Yet, for other actions, we must consciously attend to them, such as threading a sewing needle. A seminal study on motor awareness by Fourneret and Jeannerod (1998) found poor introspective ability for the action made when an unseen hand movement is perturbed by a horizontal displacement in the visual feedback signal. Participants discount their compensatory actions and instead indicated that their hand position followed a trajectory much like the perturbed cursor. Follow-up studies have modified the response to be a binary motor-awareness decision (e.g., “Was feedback perturbed or not?”) followed by a confidence rating (Bègue et al., 2018; Sinanaj et al., 2015). Another motor-awareness study measured confidence ratings following a judgement of whether a visual dot was flashed ahead or behind their finger position during up-down movement (Charles et al., 2020). However, none of these measurements of confidence correspond to sensorimotor confidence as we have defined it. Motor-awareness confidence reflects the knowledge held about the executed actions but lacks the sensory and goal components of sensorimotor confidence. To our knowledge, the only study to ask participants to explicitly reflect on their sensorimotor performance was by Mole et al. (2018), who had participants perform a virtual driving task. Green lines were placed on the road to indicate a good-performance zone, and after completing the trial, they were asked to report the percentage of time they spent in the green zone (i.e., a continuous measure of sensorimotor confidence). They found that correspondence between objective performance and sensorimotor confidence roughly followed difficulty of the task but was otherwise limited.
The study of sensorimotor confidence should also be contrasted with the mere knowledge of sensorimotor uncertainty in the absence of any particular instance of sensorimotor control (Augustyn & Rosenbaum, 2005). In theory, this can be studied by examining how knowledge of variability from sensory, motor, and task sources influences the action-selection process in motor decision-making (Wolpert & Landy, 2012). The majority of studies support the hypothesis that humans plan actions consistent with accurate knowledge of their sensorimotor uncertainty (e.g., Augustyn & Rosenbaum, 2005; Bonnen et al., 2015; Stevenson et al., 2009; Trommershäuser et al., 2008), with some exceptions (e.g., Mamassian, 2008; Zhang et al., 2013). However, the degree to which this knowledge is consciously available to the person is highly debatable (Augustyn & Rosenbaum, 2005). Furthermore, judgements of one’s uncertainty in a planned action only allow one to predict the probability of a successful outcome. In this sense, they can act as prospective confidence judgements before the action is taken, but do not constitute retrospective confidence judgements made by reflecting on sensorimotor behaviour from performance monitoring. For example, one would typically have more prospective confidence for riding a bicycle than a unicycle. This belief is not derived from performance monitoring but rather from experience-informed expectation. In other areas of metacognitive research, such use of uncertainty information or other predictions of task difficulty are considered heuristics that can even impair the relationship between objective performance and confidence (e.g., Charles et al., 2020; De Gardelle & Mamassian, 2015; Mole et al., 2018; Spence et al., 2015). Thus, it is desirable to identify the degree to which sensorimotor confidence is based on conscious monitoring of performance from feedback cues versus prospective judgements of performance based on uncertainty cues.
Here, we report on two experiments explicitly measuring sensorimotor confidence in a visuomotor tracking task using a computer display and mouse. In both experiments, participants manually tracked an invisible target that moved horizontally by inferring its location from a noisy sample of evidence in the form of a twinkling dot cloud. The trajectory of the target was unpredictable as its velocity profile was generated by a random-walk algorithm. A dynamic task was selected to mirror the sensorimotor goals typically encountered in the real world.
After tracking, participants reported their sensorimotor confidence by subjectively evaluating their tracking performance with a relative judgement of “better” or “worse” than their average. This confidence measure differs from that typically used in perceptual confidence (Mamassian, 2020). For a perceptual judgement in a typical psychophysical experiment, there are only two choice outcomes, correct or incorrect, and the confidence report solicited by the experimenter reflects the belief in the correctness (Pouget et al., 2016). If given a full-scale confidence measure ranging from 0% to 100% (Weber & Brewer, 2003), participants can use the low end of the scale to report they are sure to be incorrect. In contrast, when given a half-scale ranging from 50% to 100%, the low end of the scale collapses both the “correct-unsure” and “incorrect-sure” responses. Sensorimotor decisions, however, do not produce binary outcomes (correct/incorrect). Rather, they produce continuous outcomes (e.g., 1 deg of error, 2 deg, etc.) and will almost always have some amount of error. Knowing that interpreting calibration judgements is not very straightforward (Fleming & Lau, 2014), we did not ask participants to report perceived error on a continuous scale. Instead, we opted for the simpler request that participants perform a median split of better/worse performance, turning the confidence judgement into a binary judgement. How does this map onto low-error/high-error (like correct and incorrect for perceptual decisions) and sure/unsure? If they are sure of lower-than-average error or higher-than-average error they would just report “worse” or “better”. In the case they were unsure, they should essentially flip a coin, because they do not know. Thus, our measure is more akin to a full-scale judgement with only two choice categories, and not the half scale you would get for a high/low confidence judgement. Our measure allowed us to assess the correspondence between true performance and subjective performance.
In Experiment 1, trials differed in terms of the uncertainty in target location. We used two manipulations to achieve this: varying the size of the dot cloud (i.e., dot-sample noise), and varying the stability of the target’s velocity (i.e., random-walk noise). In Experiment 2, we manipulated only the stimulus-presentation duration to introduce uncertainty about when the confidence response would be required. We had several goals in this study: 1) to test whether humans are able to make reasonable sensorimotor confidence judgements from monitoring performance-error signals rather than relying only on uncertainty-based expectations; 2) to quantify how well sensorimotor confidence reflected objective performance; and 3) to examine how error information at different moments in time contributes to the final sensorimotor confidence judgement.
2. Experiment 1
Experiment 1 sought to measure sensorimotor confidence in a visuomotor tracking task and establish a metric of metacognitive sensitivity that quantified how well the confidence judgements corresponded to objective tracking performance. Difficulty in the task was manipulated in the cloud-size session by varying the external noise of the sensory evidence indicating the target location. In the velocity-stability session, we varied the degree of noise in the target’s horizontal trajectory. To investigate the error evidence contributing to the sensorimotor confidence, we investigated the temporal pattern of meta-cognitive sensitivity, applying our metric to 1 s time bins within the trial.
2.1. Methods
2.1.1. Participants
Thirteen naive participants (23–35 years old, two left-handed, four female) took part in the study. All had normal or corrected-to-normal vision and self-reported normal motor functioning. They received details of the experimental procedures and gave informed consent prior to the experiment. Participants were tested in accordance with the ethics requirements of the École Normale Supérieure and the Declaration of Helsinki.
2.1.2. Apparatus
Stimuli were displayed on a V3D245 LCD monitor (Viewsonic, Brea, CA; 52 × 29.5 cm, 1920 × 1080 pixels, 60 Hz). Participants sat 46.5 cm from the monitor with their head stabilised by a chin rest. Manual tracking was performed using a Logitech M325 wireless optical mouse (60 Hz sampling rate, standard acceleration profile for Mac OS X), operated by the participant’s right hand. Subjective assessments of performance were reported on a standard computer keyboard with the left hand. The experiment was conducted using custom-written code in MATLAB version R2014a (The MathWorks, Natick, MA), using Psychtoolbox version 3.0.12 (Brainard, 1997; Kleiner et al., 2007; Pelli, 1997).
2.1.3. Dot-cloud stimulus
On every frame, the horizontal and vertical coordinates of two white dots were drawn from a 2D circularly symmetric Gaussian generating distribution with standard deviation σcloud. The mean of the distribution was the tracking target, which was invisible to observers and must be inferred from the dot cloud. Each dot had a one frame lifetime and two new dots were drawn every frame. Due to the persistence of vision, participants had the impression of seeing up to 10 dots at any one time (Fig. 2A). Dots had a diameter of 0.25 deg and were presented on a mid-grey background. Dots were generated using Psychtoolbox functions that rendered them with sub-pixel dot placement and high-quality anti-aliasing. The horizontal position of the target changed every frame according to a random walk in velocity space (Fig. 2B): vt+1 = vt + ϵ and deg/s. This gave the target momentum, making it more akin to a real-world moving target (Fig. 2C). Both the target and the black cursor dot (diam.: 0.19 deg) were always centred vertically on the screen. The cursor could not deviate vertically during tracking (i.e., any vertical movements of the mouse were ignored in the rendering of the cursor icon) and participants were informed of this during training. Trajectories that caused the target to move closer than 2 × max (σcloud) from the screen edge were discarded and resampled prior to presentation.
Fig. 2.
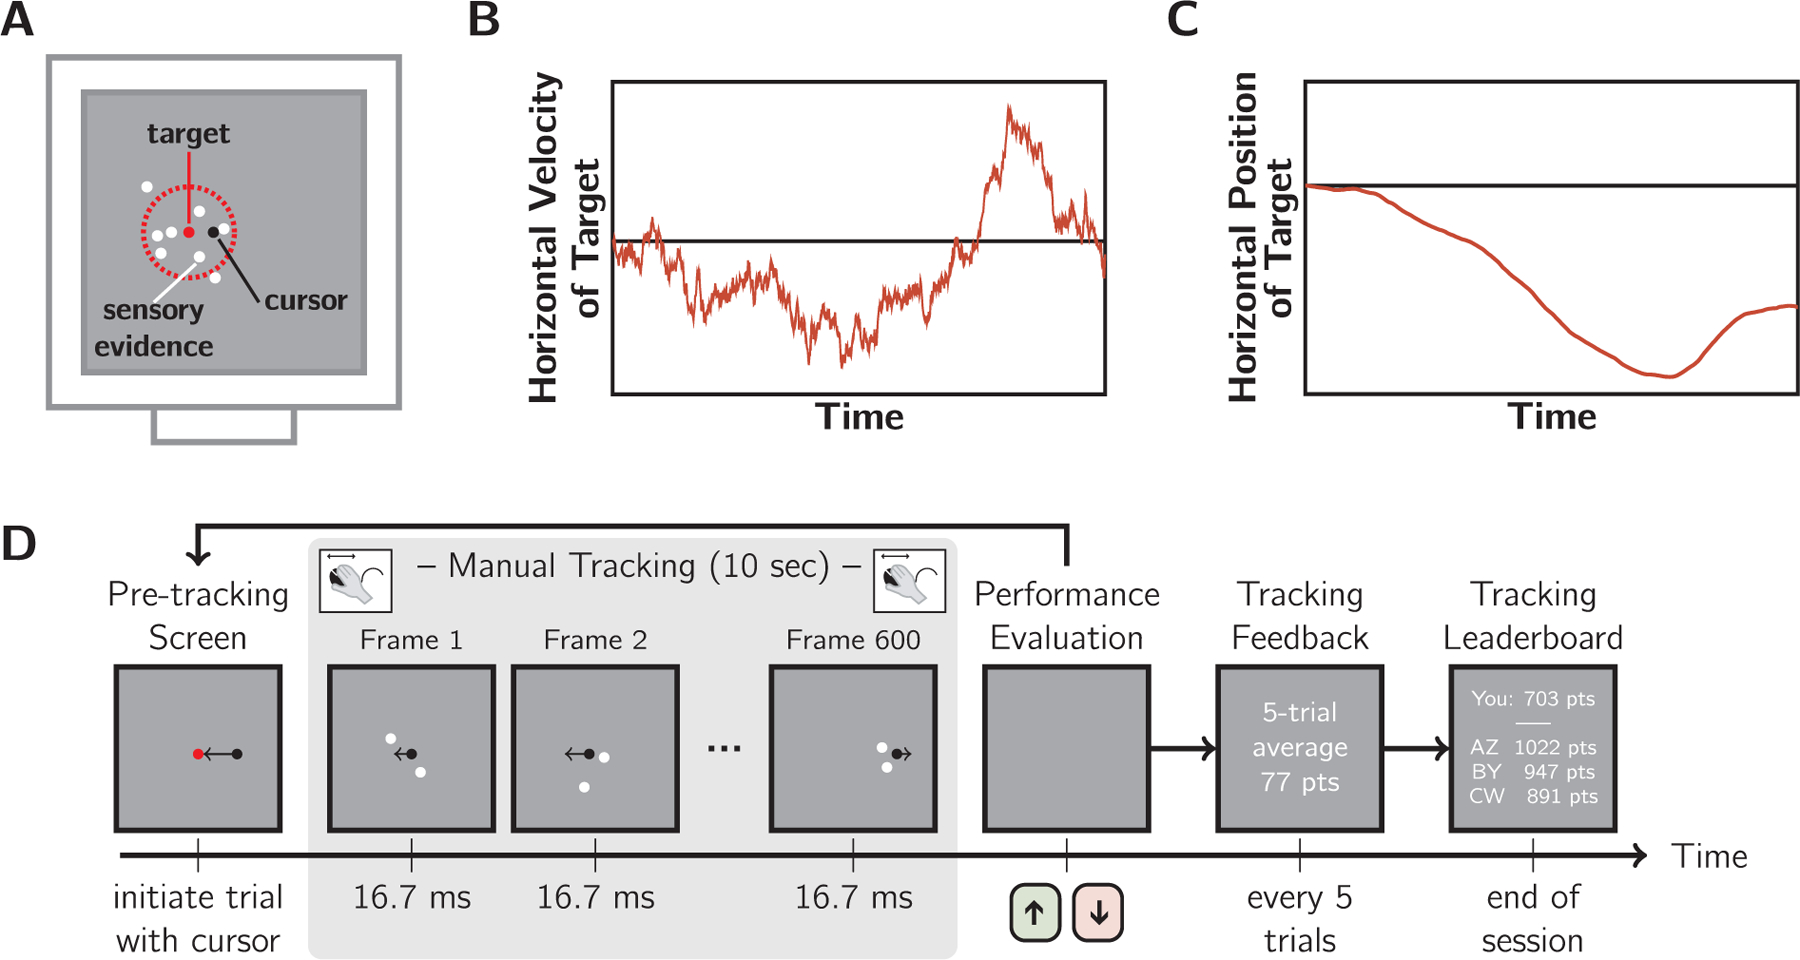
Visuomotor tracking task. A: The “twinkling” dot cloud stimulus (white), generated by drawing two dots per frame from a 2D Gaussian generating distribution. Red: mean and 1 SD circle, which were not displayed. Black: mouse cursor. The dots provided sensory evidence of target location (generating distribution mean). As illustrated, more than two dots were perceived at any moment due to temporal averaging in the visual system. B: Example target random-walk trajectory in velocity space. C: The corresponding horizontal trajectory of the target. D: Trial sequence. Trials were initiated by the observer, followed by 10 s of manual tracking of the inferred target with a computer mouse. Then, participants reported their sensorimotor confidence by indicating whether their performance on that trial was better or worse than their average. Objective performance feedback was provided intermittently including average points awarded and a final leaderboard. Difficulty manipulations: cloud size and velocity stability were varied in separate sessions.
2.1.4. Task
The trial sequence (Fig. 2D) began with a red dot at the centre of the screen. Participants initiated the tracking portion of the trial by moving the black cursor dot to this red dot, causing the red dot to disappear. The dot-cloud stimulus appeared immediately, with the target centred horizontally. The target followed its horizontal random walk for 10 s. Then, the participant made a subjective assessment of tracking performance while viewing a blank grey screen, reporting by keypress whether they believed their tracking performance was better or worse than their session average.
The experiment was conducted in two 1-hour sessions on separate days. In the “cloud size” session, the standard deviation of the dot cloud, σcloud, was varied from trial to trial (5 levels: 1, 1.5, 2, 2.5, and 3 deg) and the standard deviation of the random walk, σwalk, was fixed at 0.15 deg/s. In the “velocity stability” session, σwalk was varied (5 levels: 0.05, 0.10, 0.15, 0.20, and 0.25 deg/s) and σcloud was fixed at 2 deg. Examples of the stimuli for both sessions are provided as Supplementary media files. The order of sessions was counterbalanced across participants to the best extent possible. Each session began with a training block (20 trials, 4 per stimulus level in random order), where only tracking responses were required. The training trials allowed participants to become familiar with the stimulus and set-up, and to form an estimate of their average performance. The main testing session followed (250 trials, 50 per stimulus level in random order). For the second session, participants were instructed to form a new estimate of average performance, and not to rely on their previous estimate.
2.1.5. Grading objective performance
For our analyses, we used root-mean-squared-error (RMSE) in deg as our measure of tracking error, calculated from the horizontal distance between the target (i.e., the current distribution mean) and the cursor. For the purposes of feedback, the tracking performance on each trial was converted to a score according to the formula points = 100 − 30 × RMSE. Typical scores ranged from 60 to 80 points. Every 5 trials, the average score for the previous 5 trials was reported. This feedback was provided for both training and test trials. Presenting the average score served several purposes. The primary purpose of the feedback was to focus the efforts of participants on their tracking, thus discouraging them choosing ahead of time whether the trial was to be “better” or “worse” and executing tracking to match their metacognitive rating. Feedback also could have encouraged consistent performance across the session and helped participants to maintain a calibrated internal estimate of average performance. At the end of a session, participants were shown their cumulative score for that session and ranking on a performance leaderboard.
2.1.6. Metacognitive sensitivity metric
To examine sensorimotor confidence, we sought a metacognitive sensitivity metric that reflected how well the confidence reports discriminated good from bad tracking performance (i.e., low versus high RMSE). This concept is similar to the one used in perceptual confidence, where metacognitive sensitivity refers to a person’s ability to distinguish correct from incorrect decisions (Fleming & Lau, 2014). As the outcome of tracking was not binary (e.g., correct vs. incorrect), we considered the objective tracking performance within a trial relative to all trials within the session performed by that participant. We constructed two objective-performance probability distributions conditioned on the sensorimotor confidence: one distribution for trials followed by a “better than average” response and one for “worse than average” responses (Fig. 3A–B). A high overlap in these conditional distributions would reflect low metacognitive sensitivity as this means objective performance is a poor predictor of the participant’s evaluation of their performance. Conversely, low overlap indicates high meta-cognitive sensitivity. We used an empirical Receiver Operating Characteristic (ROC) curve, also known as a quantile-quantile plot (Fig. 3C), for a non-parametric measure of metacognitive sensitivity that reflected the separation of these distributions, independent of any specific criterion for average performance. As shown in Fig. 3D, completely overlapping distributions would fall along the equality line in a ROC plot, resulting in an Area Under the ROC curve (AUROC) of 0.5. In contrast, complete separation would yield an AUROC of 1. An advantage of this technique over methods that rely on averaging (e.g., classification images) is that this method is suitable for continuous performance distributions of any shape (e.g., skewed). There are two things worth noting about the interpretation of this metric. First, this is not the ROC method other researchers typically use to measure perceptual confidence (Barrett et al., 2013; Fleming & Lau, 2014). AUROC has, however, been used previously to explore the relationship between choice correctness and continuous confidence ratings as well as reaction times (Faivre et al., 2018). Second, our AUROC measure has the following interpretation: if the experimenter was given the RMSE of two trials and was told one was rated “worse” and the other “better”, the AUROC would reflect the probability of correctly inferring that the objectively better trial of the two was rated as “better” by the participant.
Fig. 3.
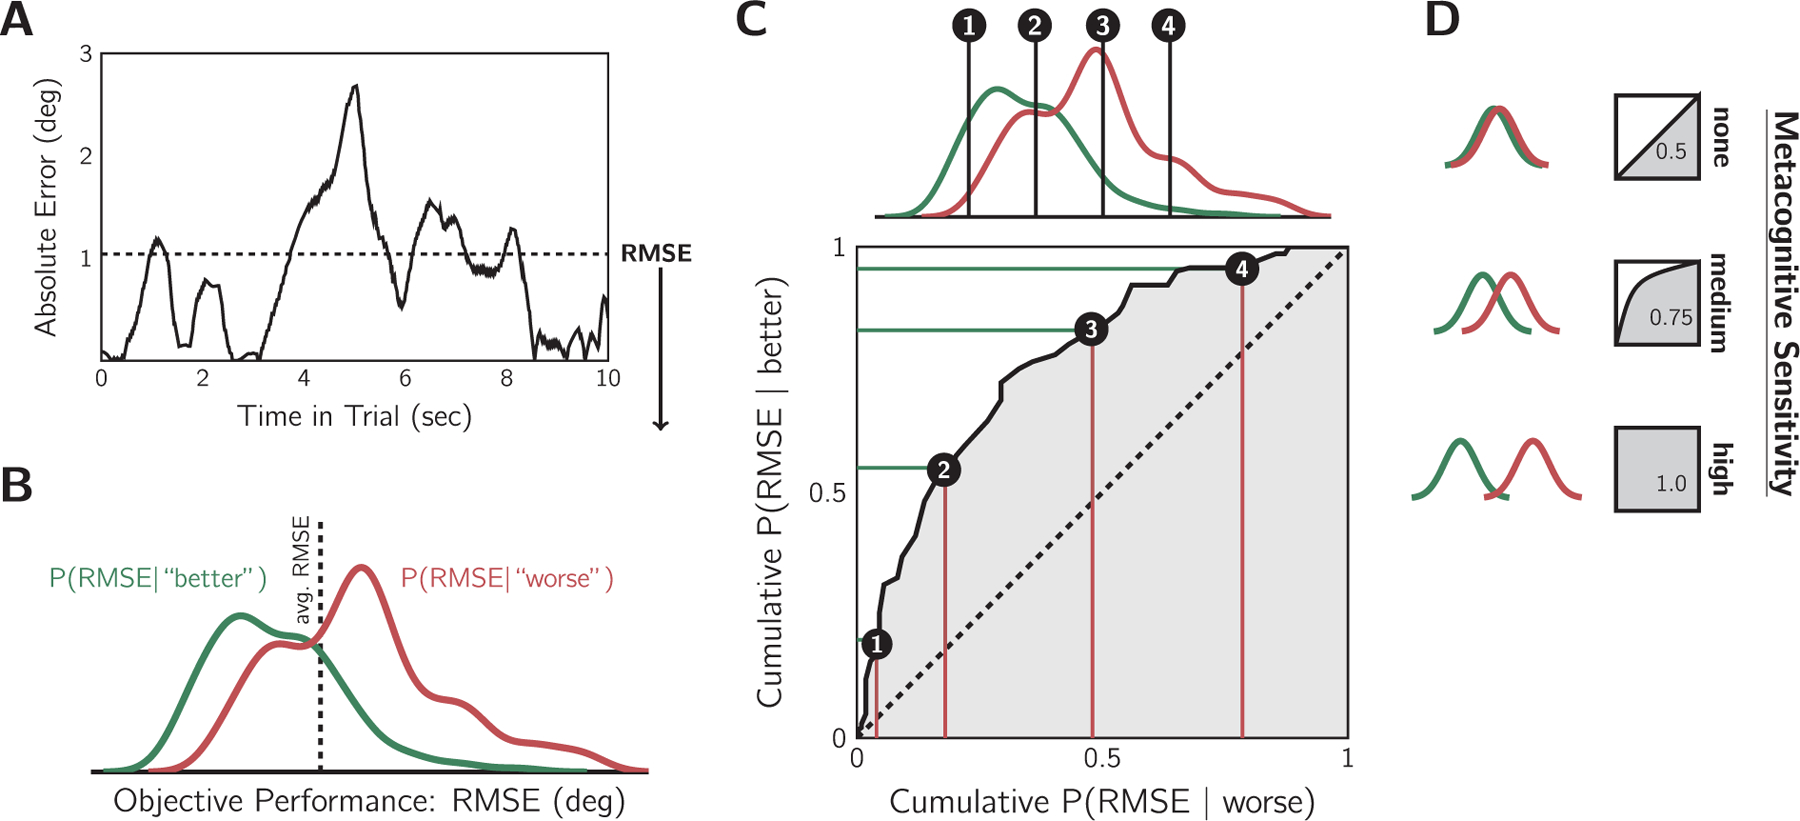
A metacognitive sensitivity metric. A: Example of tracking error within a trial. Root-mean-squared-error (RMSE, dashed line) was the objective performance measure. B: Example participant’s objective-error distributions, conditioned on sensorimotor confidence, for all trials in the variable cloud-size session. True average performance (dashed line) indicates the ideal criterion. Smaller RMSE tended to elicit “better” reports, and larger RMSE “worse”. C: Metacognitive sensitivity was quantified by the separation of the conditional objective-error distributions with a non-parametric calculation of the Area Under the ROC (AUROC) using a quantile-quantile plot. At every point along the objective-performance axis, the cumulative probability of each conditional error distribution was contrasted. D: The area under the resulting curve is the AUROC statistic, with 0.5 indicating no meta-cognitive sensitivity and 1 indicating maximum sensitivity. The greater the separation of the conditional distributions, the more the objective tracking performance was predictive of sensorimotor confidence, and thus the higher the metacognitive sensitivity.
2.2. Results
2.2.1. Confirming the difficulty manipulation
We first examined whether the difficulty manipulation affected objective tracking performance. Fig. 4A shows the mean RMSE for each stimulus level for the two difficulty manipulations. Qualitatively, the difficulty levels appear matched for most participants: performance curves follow the equality line. To check this result, we fit a linear mixed-effects model (LMM) to the RMSE values of each trial. The fixed effects in the model were difficulty manipulation (cloud-size or velocity-stability), stimulus difficulty (five levels), trial number, and an intercept term. The random effect was the participant affecting only the intercept term. Trial number was included to test whether learning occurred during the experiment. An analysis of deviance was performed using Type II Wald chi-square tests, revealing several significant effects. As expected, difficulty level had a significant effect on tracking performance (χ2 = 3044.40, p < 0.05), with larger RMSE for more difficult trials. This confirms that the difficulty manipulations had the desired effect on tracking performance. We also found that the cloud-size difficulty manipulation had significantly higher tracking error than velocity-stability (χ2 = 15.34, p < 0.05), indicating that tracking in the velocity-stability session was easier than in the cloud-size session. There was no significant interaction between difficulty manipulation and stimulus level (p > 0.05). Trial number also had a significant effect on performance (χ2 = 5.25, p < 0.05), with later trials having larger error. This suggests training trials were likely sufficient for performance to stabilise prior to the main task, but fatigue likely affected performance later in the session.
Fig. 4.
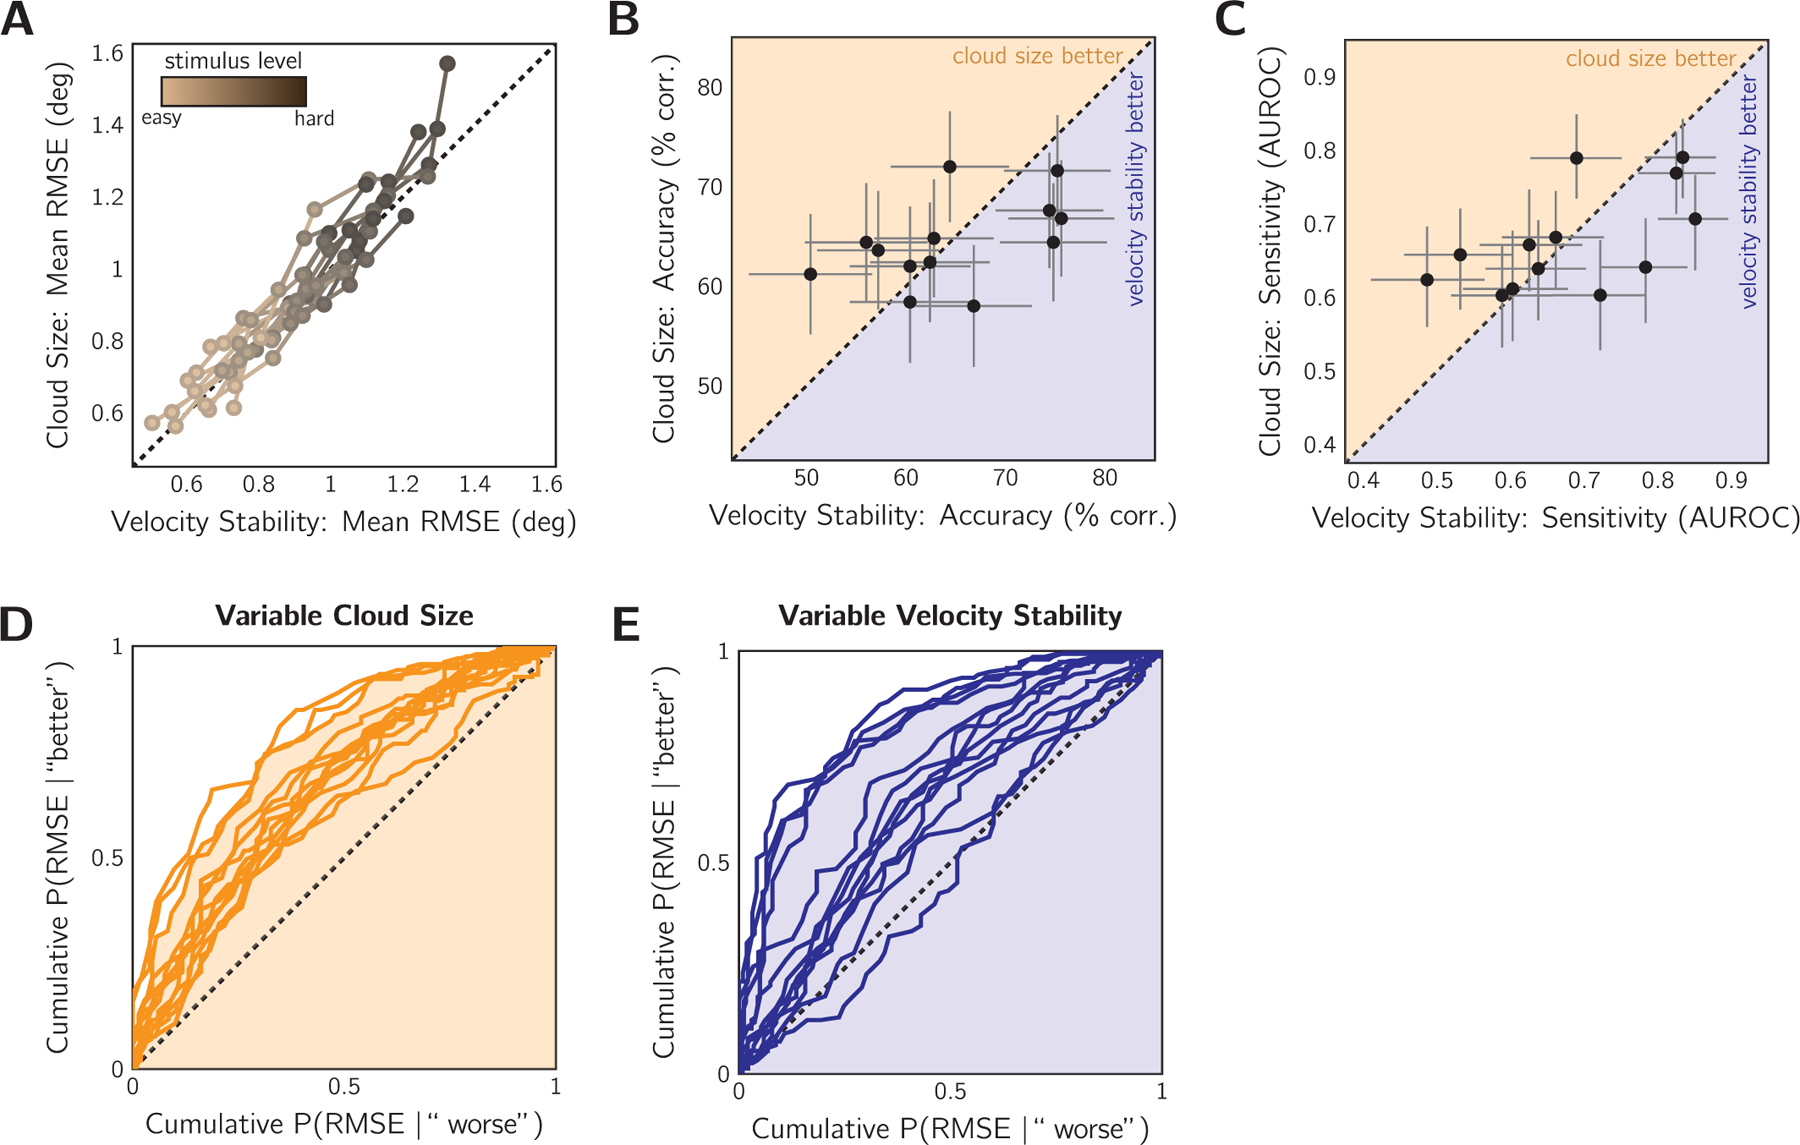
Comparable above-chance metacognitive sensitivity for cloud-size and velocity-stability difficulty manipulations in Experiment 1 (n = 13). A: Effect of difficulty manipulation on tracking error. Mean RMSE contrasted for equivalent difficulty levels in the variable cloud-size session and the variable velocity-stability session. Colour: difficulty level. Curves: individual participants. Dashed line: equivalent difficulty. B: Comparison of metacognitive accuracy for the two difficulty-manipulation techniques, pooled across difficulty levels. Data points: individual subjects. Dashed line: equivalent accuracy. Error bars: 95% binomial SE. Shaded regions indicate whether metacognitive accuracy was better for the cloud-size or velocity-stability session. C: Same as in (B) but comparing the sensitivity of the sensorimotor confidence judgement. Dashed line: equivalent sensitivity. Error bars: 95% confidence intervals by non-parametric bootstrap. D: ROC-style curves for individual participants in the cloud-size session, pooled across difficulty levels. Shading: AUROC of example observer. Dashed line: the no-sensitivity lower bound. E: Same as (D) for the velocity-stability session. Shading corresponds to the same example observer.
2.2.2. Overall metacognitive accuracy
Next, we examine metacognitive accuracy, which is the percentage of trials correctly judged as better or worse than average. Performance in both sessions was significantly better than chance (cloud-size session: 64.4 ± 1.2% correct; velocity-stability session: 64.7 ± 2.3%). The accuracy results for each session are contrasted in Fig. 4B. Four participants had significantly higher accuracy in the cloud-size session, according to the 95% binomial error confidence intervals, and four participants were significantly more accurate in the velocity-stability session. Overall, evaluation of tracking performance was similar in the two conditions. However, this accuracy metric may be subject to response bias. Therefore, we examined meta-cognitive sensitivity.
2.2.3. Overall metacognitive sensitivity
The pattern of results for metacognitive sensitivity (AUROC, see Methods) was similar to the one found for metacognitive accuracy. Metacognitive sensitivity is contrasted between the sessions in Fig. 4C and the individual ROC-style curves for the cloud-size and velocity-stability sessions are shown in Fig. 4D and E, respectively. Almost all participants displayed some degree of metacognitive sensitivity in both sessions (i.e., have ROC-style curves above the equality line). On average, the AUROC in the cloud-size session was 0.68 ± 0.02 (mean ± SEM) and was 0.68 ± 0.03 for the velocity-stability session. At the group level, a Wilcoxon’s Matched-Pairs Signed-Ranks Test revealed no significant difference between AUROCs from the two sessions (n = 13, T = 45, p > 0.05). To examine the sensitivity at the individual subject level, we performed a bootstrap procedure in which the AUROC was computed for each participant 1000 times, sampling from their trial set with replacement, allowing us to calculate 95% confidence intervals for our estimates (Fig. 4C). Four participants were significantly more sensitive in the velocity-stability session, three were significantly more sensitive in the cloud-size session, and the remaining six showed no significant difference between the two conditions. It is unlikely that these results are due to a learning effect across sessions: four of the seven significant results come from greater meta-cognitive accuracy in the first session completed. Another consideration is the amount of variability in performance for each individual and session. A highly variable participant may have a higher metacognitive sensitivity score because distinguishing better from worse performance is easier if a better trial differs more, on average, from a worse trial (Rahnev & Fleming, 2019). Also, variance could have differed between the two difficulty manipulations, affecting within-participant comparisons of metacognitive sensitivity. To examine this we fit a GLMM of the AUROC with participant as the random effect (intercept term only), and fixed effects of RMSE variance (pooled across difficulty levels), difficulty manipulation, and an intercept term. We found no significant effect of any of our predictors. To check the strength of the non-significant relationship between variance and metacognitive sensitivity, we calculated the Bayesian Information Criterion (BIC) for this linear model and compared it to the same model without trial variance as a predictor. This simplified model had a lower BIC score (ΔBIC = 5.35), supporting the claim that performance variance has little influence on metacognitive sensitivity.
2.2.4. Temporal profile of metacognitive sensitivity
We conducted an analysis of metacognitive sensitivity for each 1 s time bin within the 10 s trial to examine the degree to which each second of tracking contributed to the final sensorimotor confidence judgement. An AUROC of 0.5 indicates that error in that 1 s time bin has no predictive power for the metacognitive judgement; an AUROC of 1 indicates perfect predictive power. Fig. 5A shows the results of this analysis. In both the cloud-size and the velocity-stability sessions there was a noticeable recency effect: error late in the trial was more predictive of sensorimotor confidence than error early in the trial. There was no discernible difference between the two difficulty manipulations, except for the first few seconds where early error was more predictive for the velocity-stability session.
Fig. 5.
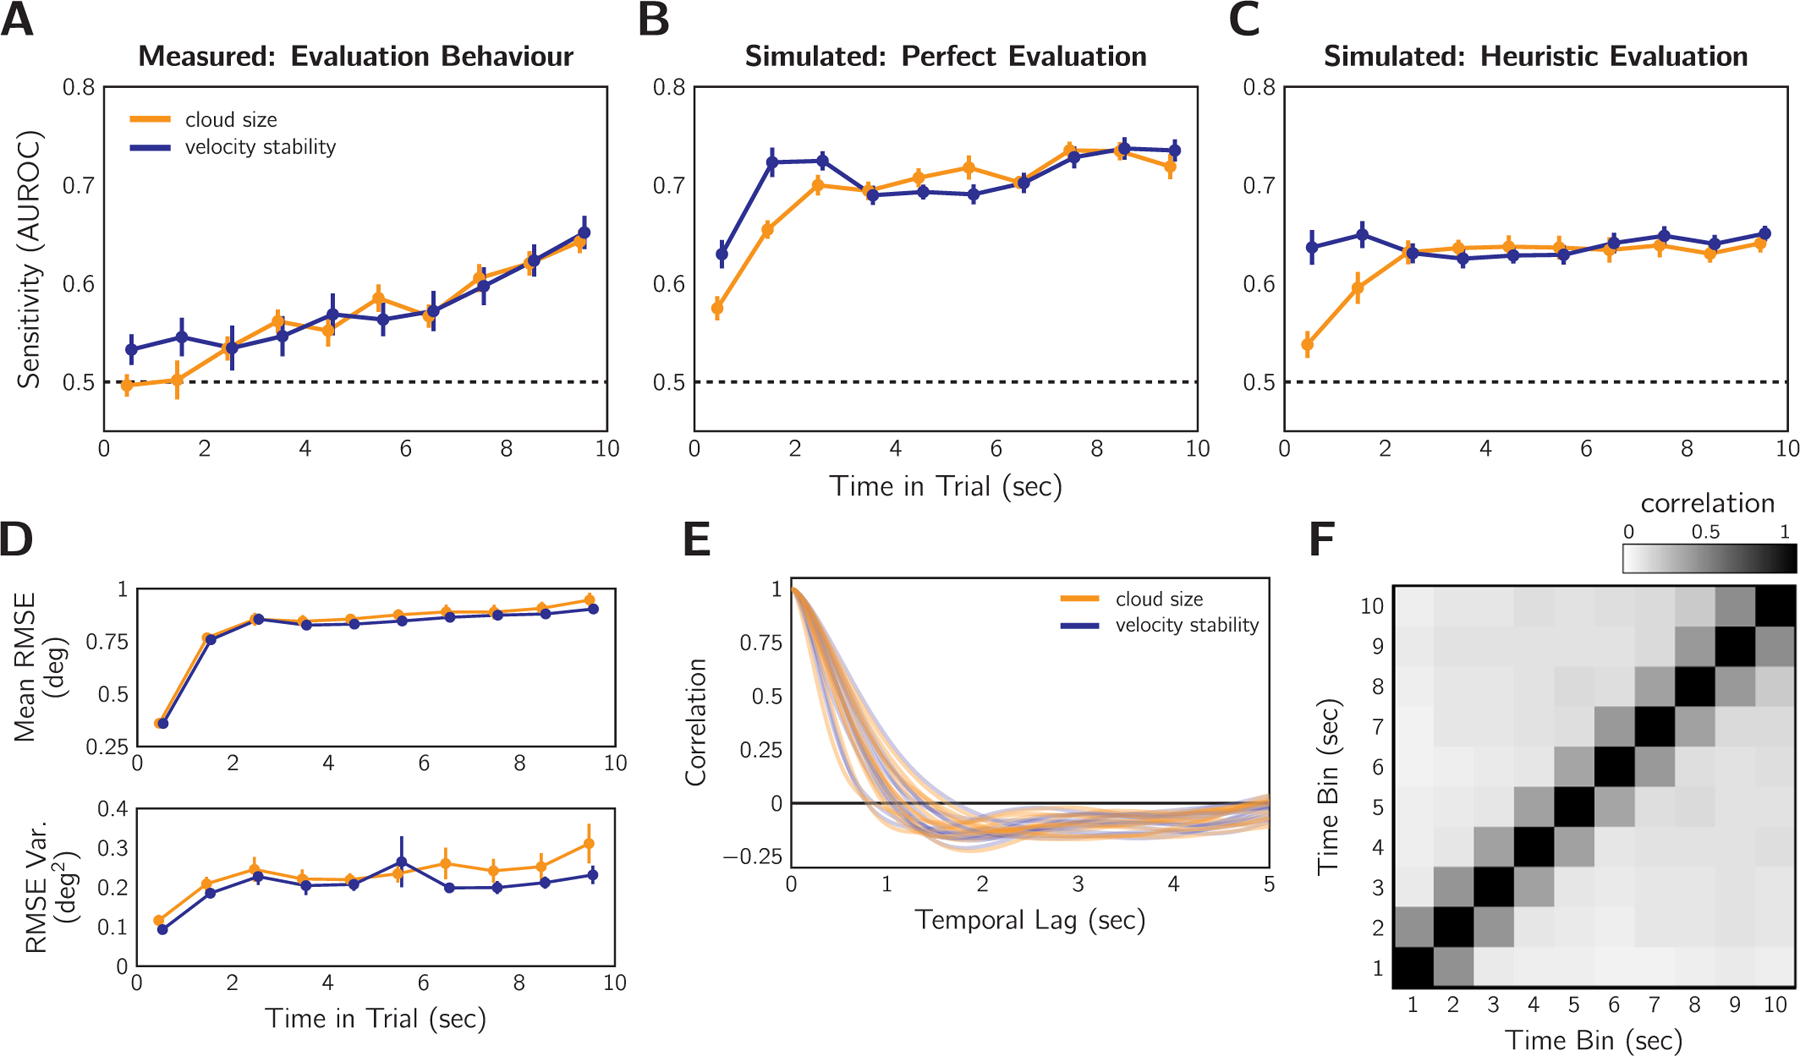
Performance weighting over time for sensorimotor confidence in Experiment 1 (n = 13). A: AUROC analysis performed based on each 1-s time bin in the tracking period. Error bars: SEM across participants. Error later in the trial is more predictive of sensorimotor confidence as indicated by the higher AUROC. B: The same analysis as in (A) for an ideal observer that has perfect knowledge of the error and compares the RMSE to the average RMSE. C: Temporal analysis performed with simulated responses based on expected performance according to the heuristic of difficulty level for each difficulty manipulation (see text). D: Mean and variance of the RMSE between target and cursor. Mean RMSE plateaus between 1 and 2 s and remains stable for the remainder of the trial. Variance is also quite stable after 2 s. Error bars: SEM across participants. E: Autocorrelation of the tracking error signal for each subject and each session. F: Autocorrelation matrix of the 1 s binned RMSE. Data pooled over trials, conditions, and participants. The correlation between time-bins is relatively low after 1 s.
For comparison, we also computed the temporal AUROCs, replacing the participant’s responses with simulated sensorimotor confidence judgements under two strategy extremes. Fig. 5B shows the AUROC time course for an ideal observer that had perfect knowledge of performance (RMSE) and based the confidence judgement on whether the RMSE was truly better or worse than average (i.e., weighted all time points equally). After the first two seconds of tracking, the temporal AUROC is relatively level. Note that no time bin was perfectly predictive of the confidence judgement because the error within one second is not equivalent to the total error across the entire trial. Fig. 5C shows the AUROC time course for an observer that perfectly uses uncertainty cues (i.e., cloud-size, velocity-stability) to judge the difficulty level of the trial and computes prospective confidence rather than basing the confidence judgement on performance monitoring. Again, no single time bin should be particularly informative if one is assessing a cue that does not disproportionately occur at or affect performance for one particular portion of the trial; such is the case with our difficulty manipulations. Note that for the cue-based heuristic-evaluation simulation, confidence was coded as “worse” for the two hardest difficulty levels, “better” for the two easiest, and flipping a 50–50 coin for the middle difficulty level. Again, both temporal profiles are flat after the first 2 s. Neither perfect monitoring nor prospective confidence based on uncertainty cues produced the recency effect in measured meta-cognitive behaviour. This result, however, is not trivial due to the complex correlation structure of the error signal, which we investigated next.
Weighing all time points equally is only an optimal strategy if all time bins are equally predictive of trial-averaged performance. Error variability is one factor that can affect that: periods of low error volatility have less impact on the predictive validity of a time bin for overall RMSE. Thus, a recency effect might be an optimal strategy if there is higher error volatility late in the trial. We found that error is overall lower and less variable before 2 s (Fig. 5D). This is because participants begin the trial by placing their cursor at the centre of the screen, where the target is located. After this initial 2 s, however, tracking error variability is relatively constant, indicating that all these time points are similarly informative about the final RMSE. Thus, error variance may explain why metacognitive sensitivity was reduced for the initial 2 s for the measured and simulated sensorimotor confidence, but it cannot explain the observed recency effect. Fig. 5E shows the autocorrelation of the signed error signal for each participant averaged across difficulty levels. This graph reveals that error is correlated up to ± 1 s and is slightly anti-correlated thereafter. Errors are necessarily related from moment to moment, due to the continuous nature of tracking. To resolve a tracking error, one needs to make a corrective action to compensate. The anticorrelation is likely a result of such corrective actions. Fig. 5F shows that this salient autocorrelation up to ± 1 s is also present between the RMSE of neighbouring 1 s time bins. These results indicate that some of the predictive power of error in one time bin may be attributed to weighting of error in a neighbouring bin. Thus, if we ask for what additional variance is accounted for, starting with. the last bin, the recency effect would appear even stronger.
2.2.5. Other performance metrics
Our modelling thus far has been based on the error between the location of the target and the cursor placement. However, this is not a realistic model of how the participant perceives their error as they imperfectly infer target location from the dot cloud, which is predominately affected by the external noise σcloud. To model this perceptual process (Fig. 6A), we opted for a simple exponential filtering of the centroid signal (i.e., the mid-point of the two dots presented on each frame). The true centroid position is a reasonable input, given that humans perform well at static centroid estimation (Juni et al., 2010; McGowan et al., 1998). The smoothing aims to capture both the temporal averaging in the visual system, which causes a cloud of 10 or so dots to be perceived, as well as the averaging across time for strategic decision-making (Bonnen et al., 2015; Kleinman, 1969). The current estimate of target position , is obtained by computing the weighted average at time t of the horizontal component of the current centroid, ct, with the previous estimate, :
| (1) |
Fig. 6.
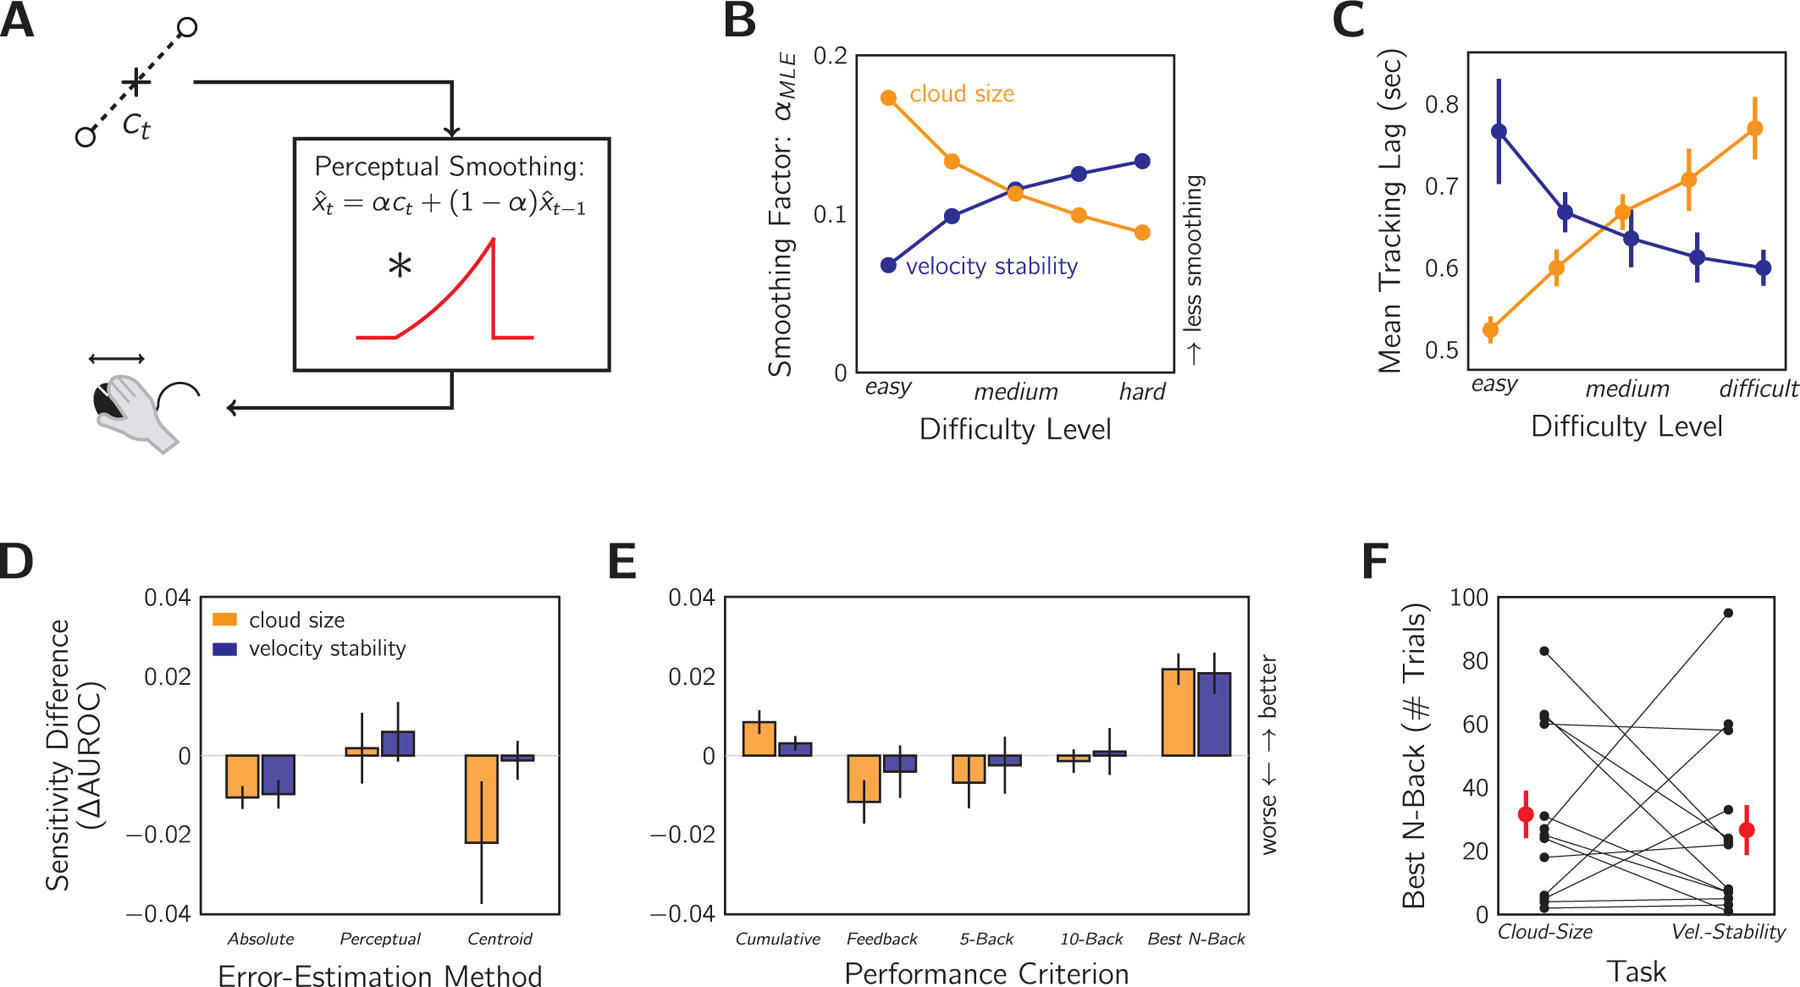
Comparing metacognitive sensitivity with different error-estimation methods and performance criteria. A: Diagram of the exponentially-smoothed perceptual model. Input: horizontal position of the dot-cloud centroid, ct (i.e., dot midpoint on a single frame). The perceptual system smooths the signal by convolving with an exponential to produce the target estimate . This is equivalent to the weighted sum of current input and previous estimate, , according to the smoothing parameter, α. Output: perceived error determines the motor response. B: Setting of α that minimises the difference between true and perceived target location for each difficulty level and condition. C: Tracking lag as a measure of perceptual smoothing. As per the expected effects of difficulty level on perceptual smoothing (B), we found the corresponding X pattern in average tracking lags measured by a cross-correlation analysis (see text for details). Note that a larger α means greater weight on the current estimate and therefore less tracking lag. D: Metacognitive sensitivity AUROC as measured under several error-estimation methods compared to the standard RMSE method reported throughout. Absolute: mean absolute error between target and cursor. Perceptual: error according to the perceptual model in (A) with α values from (B). Centroid: RMSE calculated using dot-cloud centroid rather than true target location. Positive values indicate that this method yields higher sensitivity than the standard method. E: Same as in (D) but testing different performance criteria, comparing to the true-average criterion reported throughout. Cumulative: average error on a per-trial basis ignoring future performance. Feedback: last 5-trial performance feedback as criterion. N-back: windowed average of last N trials. Optimal calculated as N between 1 and 100 that maximises the AUROC. F: Computed optimal N for each condition. Black: individual participants. Red: group mean ± SEM.
The smoothing parameter, α, controls the steepness of the exponential. Larger α mean that current sensory evidence is weighted more than previous target estimates, and vice versa. The weighting is a trade-off that has to be balanced: averaging improves the amount of information contributing to the estimate, but too much averaging into the past leads to biased estimates.
We selected the value of α that minimised the sum of squared errors between true target location and the model’s estimate as a stand-in for the observer’s estimate of the current location of the target. This was calculated separately for each stimulus level and condition (Fig. 6B). As expected, there is less smoothing (larger α) for the easy, small dot clouds than the more difficult, large dot clouds (smaller α). This is because accepting some history bias only makes sense when dealing with the noisier large dot clouds. The opposite pattern is true for the velocity-stability condition. If velocity stability is high (easy), it is safer to average further into the past to improve the estimate than if velocity stability is low (difficult). It is not simple to use the tracking time series to estimate the true perceptual smoothing performed by the observer as tracking actions are not smooth and continuous (Miall et al., 1993). However, we did find evidence of such a pattern of perceptual smoothing in the tracking lags by difficulty level (Fig. 6C). Tracking lag was computed per observer by finding the lag that maximised the cross-correlation between the velocity signal of the target and cursor. The pattern is the reverse of that seen in Fig. 6B: larger α means greater weight on the current estimate and therefore shorter tracking lags, as the estimate is less dependent on the history of the stimulus.
When the AUROC was calculated from the trial RMSE according to the perceptual model, however, the results are only marginally improved by at most 0.01 in the AUROC (Fig. 6D). In fact, using the RMSE based on the raw centroid signal or absolute tracking error also produced similar AUROC estimates, only slightly worse than the RMSE method. The relatively unchanging AUROC across these performance metrics is likely due to the high correlation between all of these error measures. As compared to the RMSE method, the correlations for the cloud-size condition are r = 0.98, 0.94, and 0.79 for absolute error, perceptual error, and centroid error respectively. For the velocity-stability condition, these are r = 0.98, 0.94, and 0.95. This is because all methods are measures of the mean performance, which will change little with unbiased noise if given sufficient samples (i.e., 10 s of tracking). Thus, we conclude that our AUROC statistic was a robust measure and that the overlap in the confidence-conditioned distributions is unlikely due to the selection of RMSE as the objective-performance metric.
Another assumption we made in our analysis of metacognitive sensitivity was that the average-performance criterion used by the participant was fixed. However, the participant may have used a different strategy for judging sensorimotor confidence, such as keeping a cumulative average, or relying on the most recent feedback, or considering only some recent history of trials. To investigate this possibility, we tested whether the participant’s categorisation of “better” and “worse” trials was more consistent (i.e., less overlap of the confidence-conditioned distributions) if the error in the trial was compared only to the RMSE of previous trials and not simply the fixed sessional average of RMSE. Considering only the RMSE of previous trials necessarily leads to a fluctuating average, in contrast to considering both past and future performance, which leads to a fixed average RMSE. To be clear, computing the relative RMSE of each trial according to a fluctuating average would change the shape of the confidence-conditioned distributions (Fig. 3B), but the AUROC calculation would still be performed in the same manner (Fig. 3C). If the participant’s sensorimotor confidence response used a criterion that tracked the real fluctuations in objective tracking performance, then the AUROC should be larger than our reported main results (Fig. 4C). We considered several potential strategies for computing relative performance: a trial’s RMSE could be compared to an average of all previous trials (“Cumulative”), to the average RMSE used to calculate the score in the most recent 5-trial performance feedback (“Feedback”), or to the RMSE average of only the most recent 5, 10 or best N trials (“5-Back”, “10-Back”, “Best N-Back”). The value of N for the Best N-back model was computed separately for each participant and session by finding the size of temporal-averaging window that maximised the AUROC. The metacognitive sensitivity according to each strategy was then compared to the results reported as the main finding. As shown in Fig. 6E, only the Cumulative and Best N-back models improved the estimated AUROCs for both sessions. On average, the number of trials in this latter model was 31.5 ± 7.5 trials for the cloud-size session and 26.6 ± 7.9 trials for the velocity-stability session (Fig. 6F). Overall, the improvement in the AUROC was only marginal (a maximum of 2% for any model), indicating that accounting for performance fluctuations, as a proxy for fluctuations in the average-performance criterion, did little to improve the understanding of the sensorimotor confidence computation.
2.2.6. Summary
In Experiment 1, we measured sensorimotor confidence for visuomotor tracking, under both cloud-size and velocity-stability manipulations of difficulty, to address the three goals of this study. A robust AUROC statistic, that quantified the ability of the confidence judgements to distinguish objectively good from bad tracking, indicated that confidence judgements were made with comparable above-chance metacognitive sensitivity for both difficulty manipulations. Furthermore, a temporal analysis revealed a recency effect, where tracking error later in the trial was found to disproportionately influence sensorimotor confidence. We propose that this is due to imperfect performance monitoring and not prospective confidence based on heuristic cues to difficulty (i.e., cloud size, velocity stability).
3. Experiment 2
The goal of Experiment 2 was to further investigate the recency effect. To this end, we repeated the task keeping the stimulus statistics fixed (σcloud and σwalk) and instead varied the duration of the stimulus presentation in an interleaved design. This made the time when the sensorimotor-confidence judgement was required less predictable. Thus, participants would be encouraged to sample error evidence for their confidence throughout the trial instead of waiting until the final portion of the stimulus duration. If a response-expectation strategy was the cause of the recency effect, we would expect to see flatter temporal AUROCs for this mixed-duration design. Otherwise, if the recency effect is due to a processing limitation of sensorimotor confidence, we would expect error in the last few seconds to largely determine sensorimotor confidence regardless of the duration condition. Additionally, this experiment allowed us to investigate sensorimotor confidence in the context of a fixed difficulty setting that encourages participants to monitor their performance. This is because prospective judgements of confidence, based on cues to sensorimotor uncertainty, are uninformative when the stimulus statistics are unchanging.
3.1. Methods
3.1.1. Participants
There were seven new participants in Experiment 2 (21–31 years old, one left-handed, four female). All participants had normal or corrected-to-normal vision and no self-reported motor abnormalities. Participants were naive to the purpose of the studies except one author. Prior to the experiment, the task was described to the participants and consent forms were collected. Participants were tested in accordance with the ethics requirements of the Institutional Review Board at New York University.
3.1.2. Apparatus
All experiments were conducted on a Mac LCD monitor (Apple, Cupertino, CA; late 2013 version, 60 × 34 cm, 1920 × 1080 pixels, 60 Hz), with participants seated 57 cm from the monitor. Participants operated a Kensington M01215 wired optical mouse (60 Hz sampling rate, standard acceleration profile for Mac OS X) with their right hand when manually tracking the stimulus. Subjective performance evaluations were collected on a standard computer keyboard. Experiments were conducted using custom-written code in MATLAB version R2014a (The MathWorks, Natick, MA), using Psychtoolbox version 3.0.12 (Brainard, 1997; Kleiner et al., 2007; Pelli, 1997).
3.1.3. Task
Stimulus presentation duration was manipulated with an inter leaved design and three levels (6, 10, and 14 s) while the stimulus statistics remained fixed at σcloud = 2 deg and σwalk = 0.15 deg/s. Data were collected over three 1-hour sessions, with each session composed of 15 training trials (5 per duration, randomised order) followed by 225 test trials (75 per duration, randomised order). Again, after each stimulus presentation, participants rated their subjective sense of their tracking performance as either “better” or “worse” than their session average. As shown in Experiment 1, tracking before 2 s in this task has a different error profile, due to the target and cursor both starting at the same location from stationary (Fig. 4D). We opted to not count these initial 2 s of tracking in the final score so that trial duration could not serve as a difficulty manipulator in this experiment (e.g., a 6 s trial is more likely to have lower RMSE than a 14 s trial). In order to signal when the tracking contributed to the final score, the cursor was initially red (not contributing) and switched to green (contributing to the score) after 2 s. Furthermore, to ensure that all trials had the same stimulus statistics (e.g., position on screen, velocity), all trajectories were initially sampled as a 14 s stimulus and accepted or rejected before being temporally truncated to 6 or 10 s if the duration condition required. For example, this prevented an over-representation in shorter-duration trials of the target approaching the screen boundaries quickly or rapidly accelerating after trial onset. Note that, as in Experiment 1, the criterion for rejecting trajectories was based on proximity of the target to the screen edge; any trajectory was resampled if at any point during the 14 s the target moved closer than 2 × σcloud to the edge. Tracking performance was scored and feedback given in the same manner as the previous experiment.
3.2. Results
In Experiment 2, we manipulated the duration of stimulus presentation with three interleaved conditions of 6, 10, or 14 s. The consequence of duration on objective tracking performance was a small increase in RMSE for longer durations (Fig. 7A). The sensorimotor confidence judgements also showed slightly lower metacognitive accuracy (Fig. 7B) and sensitivity (Fig. 7C) for longer durations. Overall, the average AUROC from pooling data across durations was 0.68 ± 0.04 SEM (Fig. 7D) and all participants had above chance metacognitive sensitivity according to bootstrapped confidence intervals calculated as per the same procedure as Experiment 1. When split by session, the AUROCs were 0.68 ± 0.04, 0.68 ± 0.03, and 0.71 ± 0.02, suggesting that metacognitive performance was relatively unchanging across the sessions. Note that for these analyses we discarded the initial 2 s of tracking that the participants were instructed to ignore.
Fig. 7.
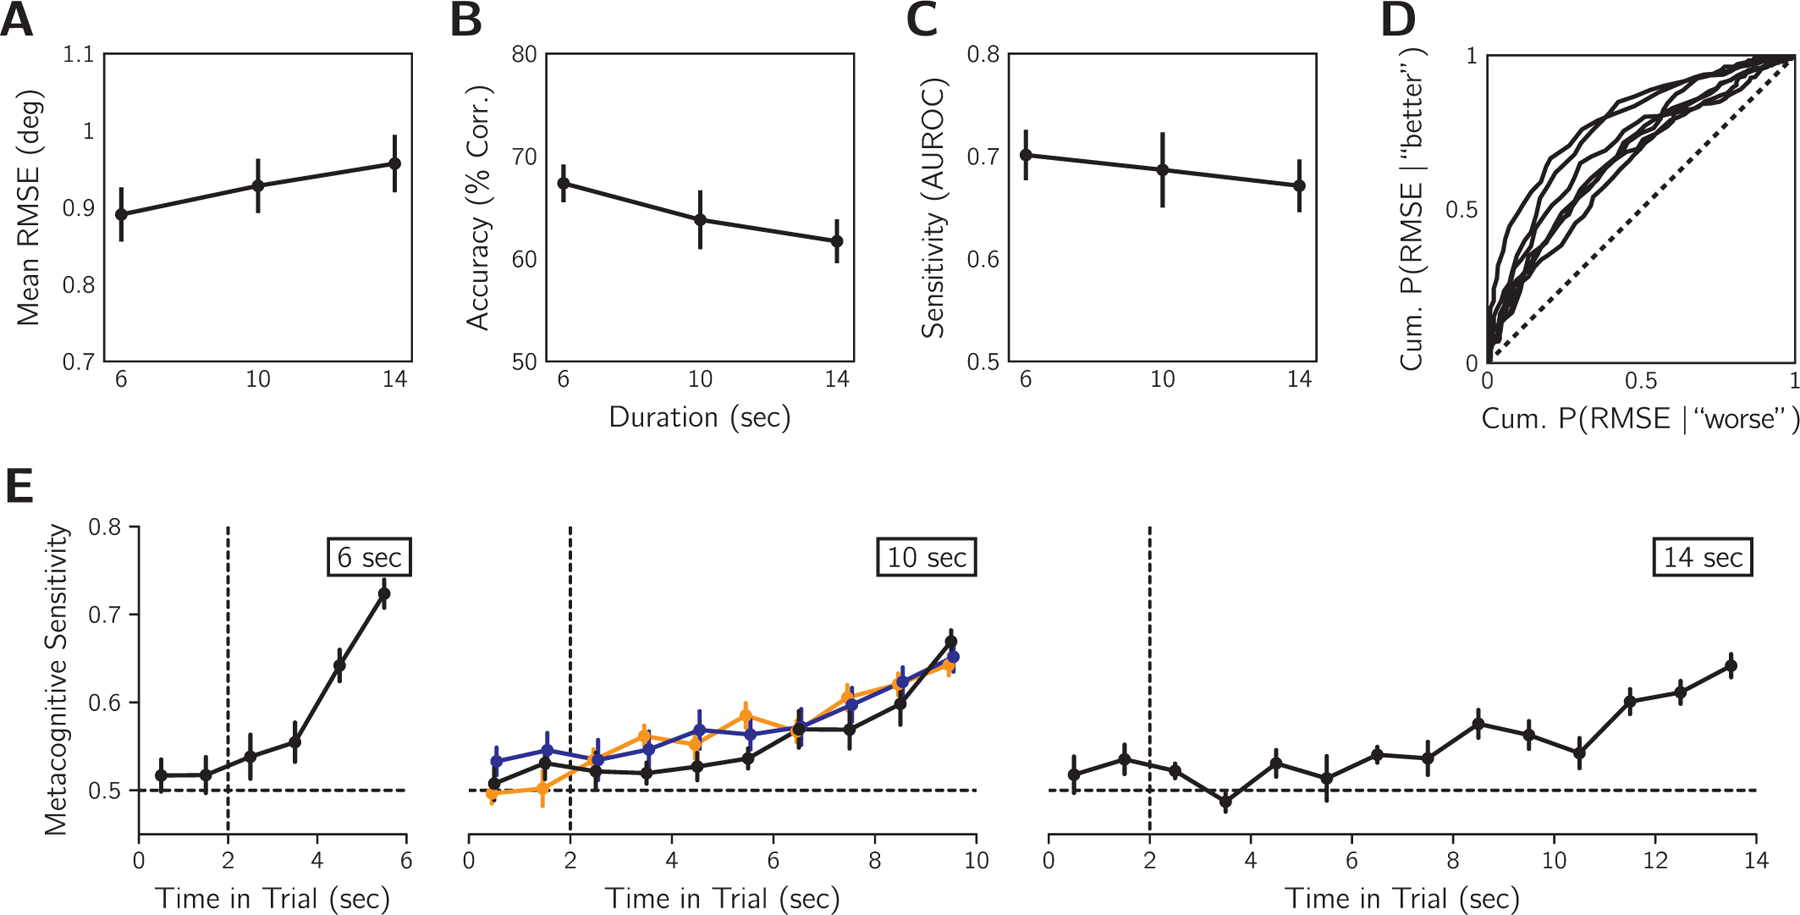
Effect of variable stimulus-presentation duration on tracking error and sensorimotor confidence in Experiment 2 (n = 7). A: Mean objective tracking performance for each duration condition averaged across observers. B: Sensorimotor-confidence accuracy for each duration condition. C: Metacognitive sensitivity for each duration condition. D: ROC-style curves for individual participants for AUROC pooled across durations. Dashed line: the no-sensitivity lower bound. Error before 2 s was excluded from the calculations in panels A-D. E: Temporal AUROCs calculated for 1 s time bins for each duration condition averaged across participants for Experiment 2 (black). For comparison, the results in Fig. 4A are replotted (orange: cloud-size session; blue: velocity-stability session). The recency effect found in Experiment 1 is replicated here for Experiment 2. Vertical dashed line at 2 s indicates the timing of cursor colour-change cue to begin evaluating tracking. Horizontal dashed line: the no-sensitivity line. Error bars in all graphs are SEM.
Fig. 7E shows the temporal profile of metacognitive sensitivity for each duration as well as the results from Experiment 1. Participants were instructed to ignore tracking error occurring before 2 s, when the cursor changed colour, for estimating sensorimotor confidence, and we observed low metacognitive sensitivity for these time points. Due to RMSE being partially correlated between adjacent time bins (Fig. 4F), slightly elevated sensitivity for the time bin at 2 s does not necessarily indicate non-compliance with task instructions. For the remainder of the trial, later time points tend to have higher metacognitive sensitivity, consistent with the recency effect observed in Experiment 1. The steepness of the temporal AUROC was also greater for shorter trial durations. This is to be expected as the contribution of a 1 s time bin to the final RMSE is greater when the trial is short. A recency effect is also consistent with the observed lower overall metacognitive performance for longer durations, because a smaller percentage of the total error signal contributes to sensorimotor confidence.
We attempted to compare the temporal AUROCs quantitatively with mixed success (see Supplementary Information). We found evidence for a stronger recency effect for Experiment 2 than Experiment 1. Furthermore, in our supplementary analyses, accounting for the recency effect and/or external noise via our perceptual model in Fig. 5A gave little benefit when attempting to predict sensorimotor confidence for either experiment (at most ~2% increase in predictive accuracy). However, we caution against strong conclusions from these supplementary analyses as certain properties of the obtained data set were not ideal for these quantitative model fits.
In sum, we replicated the recency effect of Experiment 1 for all stimulus durations. Thus the final few seconds of tracking had the greatest influence on sensorimotor confidence regardless of whether the participant knew when the stimulus presentation would terminate. This suggests that response expectation is unlikely to be the source of the recency effect.
4. Discussion
In two experiments, participants completed a visuomotor tracking task where trials were followed by a sensorimotor confidence judgement of “better” or “worse” than average tracking performance. We calculated the degree to which these judgements predicted objective tracking for manipulations of task difficulty (Experiment 1) and trial duration (Experiment 2), with an AUROC metacognitive-sensitivity statistic that ranged from no sensitivity at 0.5 and perfect sensitivity at 1. In both experiments we found above-chance metacognitive sensitivity and a temporal profile that suggested that error later in the trial contributed more to sensorimotor confidence.
4.1. Performance monitoring
Our primary aim was to establish if humans would actively monitor their own performance to judge sensorimotor confidence. An alternate strategy would have been to use cues to uncertainty (e.g., cloud size) to predict task difficulty and thus the likelihood of performing well. From our experiments, we found several indicators of performance monitoring. First, in Experiment 1, we manipulated task difficulty systematically with two methods, varying either the cloud-size parameter (σcloud) or the velocity stability parameter (σwalk) of the procedure to generate our dynamic stimulus. The manipulation of σcloud was very noticeable, with all participants reporting the stimulus manipulation in their debriefing interviews, whereas varying σwalk was more subtle and participants had difficulty identifying the manipulation (supplementary media files are provided to illustrate the difficulty manipulations). Thus, if the strategy was to rely exclusively on cues to uncertainty, and given that the manipulations had sizeable and comparable effects on tracking performance, we would expect higher metacognitive sensitivity for the cloud-size session than the velocity-stability session. We did not find supporting evidence for this hypothesis as there was no significant difference in sensitivity between the sessions.
Stronger supporting evidence for performance monitoring was found in Experiment 2, where task difficulty was kept the same for all trials by fixing the stimulus statistics. In this scenario, there are no explicit uncertainty cues for the participant to use. Yet, metacognitive sensitivity was slightly better than that observed in Experiment 1 (AUROC of 0.68 in Experiment 2 versus 0.64 for cloud-size and 0.64 for velocity-stability in Experiment 1). However, several factors complicate direct comparisons. Variability in tracking performance is not the same for fixed- and variable-difficulty designs; RMSE differences are likely to be lower for a fixed-difficulty design, complicating the comparison. Furthermore, the difficulty manipulation in Experiment 1 may have permitted a mixed strategy, combining performance monitoring and uncertainty heuristics. Thus, our results from Experiment 2 supporting the performance-monitoring hypothesis are a better indicator of how well performance monitoring captures true tracking performance than the results of Experiment 1.
The best evidence for performance monitoring is the recency effect we observed in both experiments. We found that sensorimotor confidence was most influenced by the error in last few seconds of the trial. Such a result is unlikely from the prospective use of uncertainty cues because it shows that the error occurring during the trial matters, with some moments being treated differently from others. That is, for the cloud-size session, all time points equally signal the uncertainty from cloud size, so there is no reason that the final seconds should be privileged. Similarly, for the velocity-stability session, the behaviour of the target would have to be observed for some period of time to assess velocity stability, but this could be done at any point during the trial. One possibility is that participants were waiting until the end of the trial to make these assessments, but the results of Experiment 2 argue against this, as the recency effect was still found when stimulus- presentation duration was randomised. If instead participants were using some other heuristic strategy (e.g., average velocity, amount of leftward motion, etc.), this would also not produce a recency effect unless it predicted performance later in the trial but not early performance. From an information-processing standpoint, performance monitoring is likely to exhibit temporal sub-optimalities due to either leaky accumulation of the error signal during tracking (Busemeyer & Townsend, 1993; Smith & Ratcliff, 2004) or the temporal limitations of memory for retrospective judgements (Atkinson & Shiffrin, 1968; Davelaar et al., 2005).
Before we examine the recency effect, we first comment on the possibility of a mixed strategy of performance monitoring and uncertainty-cue heuristics. Metacognitive judgements based on a mixed strategy combining actual performance and cues to uncertainty have been reported for sensorimotor confidence (Mole et al., 2018), motor-awareness confidence (Charles et al., 2020), and perceptual confidence (De Gardelle & Mamassian, 2015; Spence et al., 2015), with some exceptions (e.g., Barthelmé & Mamassian, 2010). Yet, it is unclear if a mixed strategy was used in Experiment 1 of the present study. The anecdotal differences in detecting the difficulty manipulations (cloud-size obvious, velocity-stability subtle) coupled with comparable meta-cognitive performance in these sessions lends support to a performance-monitoring strategy, but are weak evidence as difficulty detectability was not rigorously tested. An ideal test for use of a mixed strategy would involve keeping performance constant by fixing the difficulty while also varying likely uncertainty cues (e.g., titrating the mean and variability of the sensory signal; De Gardelle & Mamassian, 2015; Spence et al., 2015). This is more difficult in sensorimotor tasks as motor variability will introduce noise into the error signal, hindering any attempt to match performance. One way around this problem would be to have participants judge sensorimotor confidence for replays of previously completed tracking and artificially adjust uncertainty cues. However, this would rely on metacognition acting similarly for active tracking and passive viewing, which has only been confirmed for motor-awareness confidence (Charles et al., 2020).
Finally, we acknowledge that the current study is limited in that it is unable to answer how participants are achieving performance monitoring. We cannot separate the contribution of visual information, knowledge of motor commands, and proprioception to the confidence judgements. This is because motor uncertainty could be directly assessed in our task by visually inspecting the movements of the cursor, making it possible that visual information was actually the primary cue used in our task. The contribution of visual information could be addressed to some extent if we replicated the experiments under poor viewing conditions, or by asking participants to track a stimulus in a different sensory modality, or after removing the cursor altogether. However, changing these experimental conditions would entail taking into account the potential increase in attentional resources required to perform well, the lower sensitivity to other sensory modalities, and the role of the sense of agency. While all these issues are important to understand how individual cues to sensorimotor performance influence confidence, they are beyond the scope of the present study.
4.2. The recency effect
In the sensorimotor feedback process, incoming error signals inform upcoming action plans and quickly become irrelevant (Bonnen et al., 2015; Todorov, 2004). In contrast, the goal of performance monitoring for sensorimotor confidence is to accumulate error signals across time, much like the accumulation of sensory evidence for perceptual decisions with a fixed viewing time. In fact, in the accumulation-of-evidence framework, considerable effort has been made to incorporate a recency bias termed “leaky accumulation” (Brunton et al., 2013; Busemeyer & Townsend, 1993; Matsumori et al., 2018; Usher & McClelland, 2001). The main arguments for including a temporal-decay component is to account for memory limitations of the observer (e.g., from neural limits of recurrent excitation) or intentional forgetting for adaptation in volatile environments (Nassar et al., 2010; Norton et al., 2019; Usher & McClelland, 2001). For our task, memory constraints are a more likely explanation of the recency effect than intentional forgetting, because we have long trials of 6–14 s with no changes of stimulus statistics during a trial. One contributor to the error signal we have no control over, however, is the participant’s motivation to do the task. Even though tracking performance was constant when averaged across trials, fluctuations in motivation during a trial could lead to fluctuations in sensorimotor performance that do cause volatility in the error signal. Thus, alternating between bouts of good and poor performance could bias the participant to be more forgetful.
Previous efforts to characterise the time course of a metacognitive judgement have been limited to the perceptual domain. Using the reverse-correlation technique, Zylberberg et al. (2012) measured the temporal weighting function for confidence in two perceptual tasks and found a primacy effect: the initial hundreds of milliseconds of stimulus presentation had the greatest influence on perceptual confidence. Their finding and associated modelling suggests evidence accumulation for the metacognitive judgement stops once an internal bound for decision commitment has been reached. Our results suggest that sensorimotor confidence does not follow the same accumulation-to-bound structure, otherwise early error would have been more predictive of confidence than late error. One reason we may not have found a primacy effect is that the participant interacts with the stimulus to produce the errors that determine performance, allowing them a sense of agency that they can change or modify performance. As a result, there is no reason to settle on a confidence judgement based on initial performance. A contradictory finding to Zylberberg et al. (2012) is that sensory evidence late in the trial, during the period between the sensory decision and the metacognitive decision, can influence perceptual confidence in what is termed post-accumulation of evidence (Pleskac & Busemeyer, 2010), but this finding is hard to apply to our visuomotor task. Evaluating tracking is different from a single perceptual decision, because tracking is a series of motor-planning decisions (Wolpert & Landy, 2012). The error signal used to plan the next tracking movement is also the feedback of the error from the last moment of tracking. Additionally, subsequent estimates of target location could theoretically provide additional information about previous locations of the target. Identifying the source of the error signal for sensorimotor confidence, either by computational modelling or brain imaging, would help clarify the nature of the accumulation process.
So far we have considered an online computation of sensorimotor confidence that accompanies sensorimotor decision making. Another alternative is that the evaluation of performance is computed retrospectively. Baranski and Petrusic (1998) showed that reaction times for confidence responses differed for speeded and unspeeded perceptual decisions, leading to the conclusion that perceptual confidence is computed online unless time pressure forces it to be evaluated retrospectively. It is reasonable to assume that the continual demand of cursor adjustment to track an unpredictable stimulus is taxing, leaving participants no choice but to introspect on their performance upon termination of the trial. If this were the case, we would likely see temporal biases consistent with memory retrieval. In the memory literature, there has been extensive evidence of both primacy and recency effects, which are thought to be associated with long-term and short-term memory processes respectively (Atkinson and Shiffrin, 1968; Innocenti et al., 2013). Thus, the observed recency effect in our experiment could be interpreted as short-term memory limitations constraining the time constant. Another reason observers may delay performance evaluation until after the trial is because tracking is typically a goal-directed behaviour, which can be evaluated by its success (e.g., catching the prey after a chase, hitting the target in a first-person shooter game, or correctly intercepting a hand in a handshake). Still, one may want to introspect about performance while tracking to decide whether the tracking was in vain. We did not incentivise participants to adopt a particular strategy in the task, so they may have treated error towards the end of the trial as their success in “catching” the target.
4.3. Metacognitive efficiency
We quantified metacognitive sensitivity for sensorimotor tracking with an AUROC metric that reflected the separation of the objective-performance distributions conditioned on sensorimotor confidence. This approach superficially shares some similarities with the metacognitive metric meta-d′ in perceptual confidence. For meta-d′, an ROC curve, relating the probability of a confidence rating conditioned on whether the observer was correct vs. incorrect, is computed as part of the analysis to obtain a bias-free sensitivity metric that reflects the observer’s ability to distinguish between correct and incorrect perceptual responses (Fleming & Lau, 2014; Mamassian, 2016). However, the area under this ROC curve (AUROC) has little meaning, as it is highly dependent on the sensitivity of the primary perceptual judgement (Galvin et al., 2003). Instead, the appropriate comparison is between the perceptual sensitivity, d′, and the metacognitive sensitivity, meta-d′. Typically, a ratio of these sensitivities is computed, with a value of 1 being considered ideal metacognitive efficiency (i.e., the best the observer can do given the identical sensory evidence available for the metacognitive judgement as the perceptual judgement). Empirically, ratios less than 1 are most often observed, indicating less efficient, more noisy decision-making at the metacognitive level (Maniscalco & Lau, 2012, 2016).
The purpose of our AUROC metric is not to quantify how well the sensory information is used for the sensorimotor control versus sensorimotor confidence, but as a non-parametric way of quantifying how sensitive an observer is to their true performance. The metric ranges from no sensitivity (i.e., chance performance) at 0.5 to perfect classification performance at 1. As with perceptual confidence, we do expect that the AUROC will depend to some degree on the variance in the performance of the primary task (e.g., tracking), even if it wasn’t observed in our task. For example, if there is little variance, then it should be difficult to identify well executed from poorly executed trials, whereas a large variance means performance could be more easily categorised. A second use of the AUROC metric was to quantify the degree to which a model of metacognitive behaviour could predict sensorimotor confidence (see Supplementary Information). By replacing the objective-performance axis with an internal decision-variable axis according to a model, a model’s explanatory power can be measured on a scale from none at 0.5 to perfect at 1. While we were unsuccessful at improving performance more than 2% in any of our experiments, which we did by accounting for both the recency effect and the effect of external sensory noise instead of simply computing RMSE using the true target location, the method of analysis nicely complemented our goal of quantifying how well sensorimotor confidence reflected objective performance.
We examined metacognitive efficiency by determining what error information contributed to sensorimotor confidence. The recency effect we observed constitutes an inefficiency in that not all information used for the primary sensorimotor decision-making was used for the meta-cognitive judgement as was instructed. Based on the similarity in shape of the recency effect for the duration conditions of Experiment 2, we can conclude that efficiency is inversely proportional to the duration of tracking. However, given long, multi-action sequences, it is not that surprising to find that some part of the perceptual information about error is lost. Some amount of forgetting is likely advantageous in real-world scenarios. For future metacognitive studies of action, it would be informative to examine estimates of sensorimotor confidence during action and how sensorimotor confidence interacts with goal planning, explicit learning, and expertise. For example, it would be worthwhile to investigate how sensorimotor confidence relates to cognitive control functions such as switching or abandoning motor tasks (Alexander & Brown, 2010), or how athletes and novices judge sensorimotor confidence (MacIntyre et al., 2014).
4.4. Conclusion
In sum, we found considerable evidence that humans are able to compute sensorimotor confidence, that is, they are able to monitor their sensorimotor performance in relationship to a goal. However, they do so inefficiently, disproportionately weighting the tracking error at the end of the trial to judge whether their performance was better than average. We replicated this recency effect with unpredictable stimulus presentation durations to confirm that it was not the result of a response-preparation strategy. In our analyses, we have introduced the AUROC statistic, which we found useful for two purposes. First, it allowed us to quantify the relationship between sensorimotor confidence and objective tracking performance, and second, it provided a model-fit metric for elaborated decision models. Our results, obtained from a relatively simple goal of visuomotor tracking, raise many questions for future studies on sensorimotor confidence. For example, is the recency effect a key characteristic of sensorimotor confidence? And, does it result from leaky online evidence accumulation or biased retrospective memory retrieval? What factors determine the strength of the recency effect for sensorimotor confidence (i.e., attention, sensorimotor goals, etc.)? Further work will help provide a clearer link between models of sensorimotor behaviour and models of sensorimotor metacognition.
Supplementary Material
Acknowledgements
We thank Eero Simoncelli for fruitful discussions that contributed to this project. This work was supported by the US National Institutes of Health Grant EY08266 (SML, MSL) and the US National Science Foundation Collaborative Research in Computational Neuroscience Grant 1420262, a post-doctoral fellowship from the Fyssen Foundation in France (SML), as well as the French Agence Nationale de la Recherche grants ANR-18CE28-0015-01 “VICONTE” and ANR-17-EURE-0017 “FrontCog” (SML, PM).
Footnotes
Appendix A. Supplementary data
Supplementary data to this article can be found online at https://doi.org/10.1016/j.cognition.2020.104396.
References
- Adler WT, & Ma WJ (2018). Comparing Bayesian and non-Bayesian accounts of human confidence reports. PLoS Computational Biology, 14(11), Article e1006572. [DOI] [PMC free article] [PubMed] [Google Scholar]
- Alexander WH, & Brown JW (2010). Computational models of performance monitoring and cognitive control. Topics in Cognitive Science, 2(4), 658–677. [DOI] [PMC free article] [PubMed] [Google Scholar]
- Atkinson RC, & Shiffrin RM (1968). Human memory: A proposed system and its control processes. Psychology of Learning and Motivation, 2, 89–195. [Google Scholar]
- Augustyn JS, & Rosenbaum DA (2005). Metacognitive control of action: Preparation for aiming reflects knowledge of Fitts’s law. Psychonomic Bulletin and Review, 12(5), 911–916. [DOI] [PubMed] [Google Scholar]
- Baranski JV, & Petrusic WM (1998). Probing the locus of confidence judgments: Experiments on the time to determine confidence. Journal of Experimental Psychology: Human Perception and Performance, 24(3), 929–945. [DOI] [PubMed] [Google Scholar]
- Barrett AB, Dienes Z, & Seth AK (2013). Measures of metacognition on signal-detection theoretic models. Psychological Methods, 18(4), 535–552. [DOI] [PubMed] [Google Scholar]
- Barthelmé S, & Mamassian P (2010). Flexible mechanisms underlie the evaluation of visual confidence. Proceedings of the National Academy of Sciences, 107(48), 20834–20839. [DOI] [PMC free article] [PubMed] [Google Scholar]
- Bègue I, Blakemore R, Klug J, Cojan Y, Galli S, Berney A, Aybek S, & Vuilleumier P (2018). Metacognition of visuomotor decisions in conversion disorder. Neuropsychologia, 114, 251–265. [DOI] [PubMed] [Google Scholar]
- Blakemore S-J, & Frith C (2003). Self-awareness and action. Current Opinion in Neurobiology, 13(2), 219–224. [DOI] [PubMed] [Google Scholar]
- Blakemore SJ, Wolpert DM, & Frith CD (2002). Abnormalities in the awareness of action. Trends in Cognitive Sciences, 6(2), 237–242. [DOI] [PubMed] [Google Scholar]
- Bonnen K, Yates J, Burge J, Pillow J, & Cormack LK (2015). Continuous psychophysics: Target-tracking to measure visual sensitivity. Journal of Vision, 15(3), 14. [DOI] [PMC free article] [PubMed] [Google Scholar]
- Botvinick MM, Braver TS, Barch DM, Carter CS, & Cohen JD (2001). Conflict monitoring and cognitive control. Psychological Review, 108(3), 624–652. [DOI] [PubMed] [Google Scholar]
- Brainard DH (1997). The psychophysics toolbox. Spatial Vision, 10(4), 433–436. [PubMed] [Google Scholar]
- Brunton BW, Botvinick MM, & Brody CD (2013). Rats and humans can optimally accumulate evidence for decision-making. Science, 340(6128), 95–98. [DOI] [PubMed] [Google Scholar]
- Busemeyer JR, & Townsend JT (1993). Decision field theory: A dynamic-cognitive approach to decision making in an uncertain environment. Psychological Review, 100(3), 432–459. [DOI] [PubMed] [Google Scholar]
- Charles L, Chardin C, & Haggard P (2020). Evidence for metacognitive bias in perception of voluntary action. Cognition, 194, 104041. [DOI] [PubMed] [Google Scholar]
- Davelaar EJ, Goshen-Gottstein Y, Ashkenazi A, Haarmann HJ, & Usher M (2005). The demise of short-term memory revisited: Empirical and computational investigations of recency effects. Psychological Review, 112(1), 3–42. [DOI] [PubMed] [Google Scholar]
- De Gardelle V, & Mamassian P (2015). Weighting mean and variability during confidence judgments. PLoS One, 10(3), Article e0120870. [DOI] [PMC free article] [PubMed] [Google Scholar]
- Dotan D, Meyniel F, & Dehaene S (2018). On-line confidence monitoring during decision making. Cognition, 171, 112–121. [DOI] [PubMed] [Google Scholar]
- Faivre N, Filevich E, Solovey G, Kühn S, & Blanke O (2018). Behavioral, modeling, and electrophysiological evidence for supramodality in human metacognition. Journal of Neuroscience, 38(2), 263–277. [DOI] [PMC free article] [PubMed] [Google Scholar]
- Fleming SM, & Daw ND (2017). Self-evaluation of decision-making: A general Bayesian framework for metacognitive computation. Psychological Review, 124(1), 91–114. [DOI] [PMC free article] [PubMed] [Google Scholar]
- Fleming SM, & Dolan RJ (2012). The neural basis of metacognitive ability. Philosophical Transactions of the Royal Society B: Biological Sciences, 367(1594), 1338–1349. [DOI] [PMC free article] [PubMed] [Google Scholar]
- Fleming SM, & Lau HC (2014). How to measure metacognition. Frontiers in Human Neuroscience, 8, 443. [DOI] [PMC free article] [PubMed] [Google Scholar]
- Fourneret P, & Jeannerod M (1998). Limited conscious monitoring of motor performance in normal subjects. Neuropsychologia, 36(11), 1133–1140. [DOI] [PubMed] [Google Scholar]
- Galvin SJ, Podd JV, Drga V, & Whitmore J (2003). Type 2 tasks in the theory of signal detectability: Discrimination between correct and incorrect decisions. Psychonomic Bulletin & Review, 10(4), 843–876. [DOI] [PubMed] [Google Scholar]
- Innocenti I, Cappa SF, Feurra M, Giovannelli F, Santarnecchi E, Bianco G, … Rossi S (2013). TMS interference with primacy and recency mechanisms reveals bimodal episodic encoding in the human brain. Journal of Cognitive Neuroscience, 25(1), 109–116. [DOI] [PubMed] [Google Scholar]
- Juni MZ, Singh M, & Maloney LT (2010). Robust visual estimation as source separation. Journal of Vision, 10(14), 2. [DOI] [PMC free article] [PubMed] [Google Scholar]
- Kiani R, Corthell L, & Shadlen MN (2014). Choice certainty is informed by both evidence and decision time. Neuron, 84(6), 1329–1342. [DOI] [PMC free article] [PubMed] [Google Scholar]
- Kleiner M, Brainard D, Pelli D, Ingling A, Murray R, & Broussard C (2007). What’s new in psychtoolbox-3. Perception, 36(14), 1–16. [Google Scholar]
- Kleinman D (1969). Optimal control of linear systems with time-delay and observation noise. IEEE Transactions on Automatic Control, 14(5), 524–527. [Google Scholar]
- MacIntyre TE, Igou ER, Campbell MJ, Moran AP, & Matthews J (2014). Metacognition and action: A new pathway to understanding social and cognitive aspects of expertise in sport. Frontiers in Psychology, 5, 1155. [DOI] [PMC free article] [PubMed] [Google Scholar]
- Mamassian P (2008). Overconfidence in an objective anticipatory motor task. Psychological Science, 19, 601–606. [DOI] [PubMed] [Google Scholar]
- Mamassian P (2016). Visual confidence. Annual Review of Vision Science, 2(1), 459–481. [DOI] [PubMed] [Google Scholar]
- Mamassian P (2020). Confidence forced-choice and other metaperceptual tasks. Perception, 49(6), 616–635. [DOI] [PubMed] [Google Scholar]
- Mamassian P, & Landy MS (2010). It’s that time again. Nature Neuroscience, 13, 914–916. [DOI] [PMC free article] [PubMed] [Google Scholar]
- Maniscalco B, & Lau H (2016). The signal processing architecture underlying subjective reports of sensory awareness. Neuroscience of Consciousness, 2016(1), 1–17. [DOI] [PMC free article] [PubMed] [Google Scholar]
- Maniscalco B, & Lau HC (2012). A signal detection theoretic approach for estimating metacognitive sensitivity from confidence ratings. Consciousness and Cognition, 21, 422–430. [DOI] [PubMed] [Google Scholar]
- Matsumori K, Koike Y, & Matsumoto K (2018). A biased Bayesian inference for decision-making and cognitive control. Frontiers in Neuroscience, 12, 734. [DOI] [PMC free article] [PubMed] [Google Scholar]
- McGowan JW, Kowler E, Sharma A, & Chubb C (1998). Saccadic localization of random dot targets. Vision Research, 38(6), 895–909. [DOI] [PubMed] [Google Scholar]
- Miall RC, Weir DJ, & Stein JF (1993). Intermittency in human manual tracking tasks. Journal of Motor Behavior, 25(1), 53–63. [DOI] [PubMed] [Google Scholar]
- Mole CD, Jersakova R, Kountouriotis GK, Moulin CJA, & Wilkie RM (2018). Metacognitive judgements of perceptual-motor steering performance. Quarterly Journal of Experimental Psychology, 71(10), 2223–2234. [DOI] [PubMed] [Google Scholar]
- Nassar MR, Wilson RC, Heasly B, & Gold JI (2010). An approximately Bayesian Delta-rule model explains the dynamics of belief updating in a changing environment. Journal of Neuroscience, 30(37), 12366–12378. [DOI] [PMC free article] [PubMed] [Google Scholar]
- Norman DA, & Shallice T (1986). Attention to action In Davidson RJ, Schwartz GE, & Shapiro D (Eds.). Consciousness and self-regulation (pp. 1–18). New York, NY: Springer. [Google Scholar]
- Norton EH, Acerbi L, Ma WJ, & Landy MS (2019). Human online adaptation to changes in prior probability. PLoS Computational Biology, 15(7), Article e1006681. [DOI] [PMC free article] [PubMed] [Google Scholar]
- Patel D, Fleming SM, & Kilner JM (2012). Inferring subjective states through the observation of actions. Proceedings of the Royal Society B: Biological Sciences, 279(1748), 4853–4860. [DOI] [PMC free article] [PubMed] [Google Scholar]
- Pelli DG (1997). The video toolbox software for visual psychophysics: Transforming numbers into movies. Spatial Vision, 10, 437–442. [PubMed] [Google Scholar]
- Pleskac TJ, & Busemeyer JR (2010). Two-stage dynamic signal detection: A theory of choice, decision time, and confidence. Psychological Review, 117(3), 864–901. [DOI] [PubMed] [Google Scholar]
- Pouget A, Drugowitsch J, & Kepecs A (2016). Confidence and certainty: Distinct probabilistic quantities for different goals. Nature Neuroscience, 19(3), 366–374. [DOI] [PMC free article] [PubMed] [Google Scholar]
- Rahnev D, & Fleming SM (2019). How experimental procedures influence estimates of metacognitive ability. Neuroscience of Consciousness, 5(1), niz009. [DOI] [PMC free article] [PubMed] [Google Scholar]
- Resulaj A, Kiani R, Wolpert DM, & Shadlen MN (2009). Changes of mind in decision-making. Nature, 461(7261), 263–266. [DOI] [PMC free article] [PubMed] [Google Scholar]
- Sinanaj I, Cojan Y, & Vuilleumier P (2015). Inter-individual variability in metacognitive ability for visuomotor performance and underlying brain structures. Consciousness and Cognition, 36, 327–337. [DOI] [PubMed] [Google Scholar]
- Smith PL, & Ratcliff R (2004). Psychology and neurobiology of simple decisions. Trends in Neurosciences, 27(3), 161–168. [DOI] [PubMed] [Google Scholar]
- Spence ML, Dux PE, & Arnold DH (2015). Computations underlying confidence in visual perception. Journal of Experimental Psychology: Human Perception and Performance, 42(5), 671–682. [DOI] [PubMed] [Google Scholar]
- Stevenson IH, Fernandes HL, Vilares I, Wei K, & Körding KP (2009). Bayesian integration and non-linear feedback control in a full-body motor task. PLoS Computational Biology, 5(12), Article e1000629. [DOI] [PMC free article] [PubMed] [Google Scholar]
- Todorov E (2004). Optimality principles in sensorimotor control. Nature Neuroscience, 7(9), 907–915. [DOI] [PMC free article] [PubMed] [Google Scholar]
- Trommershäuser J, Maloney LT, & Landy MS (2008). Decision making, movement planning and statistical decision theory. Trends in Cognitive Sciences, 12(8), 291–297. [DOI] [PMC free article] [PubMed] [Google Scholar]
- Usher M, & McClelland JL (2001). The time course of perceptual choice: The leaky, competing accumulator model. Psychological Review, 108(3), 550–592. [DOI] [PubMed] [Google Scholar]
- Weber N, & Brewer N (2003). The effect of judgment type and confidence scale on confidence-accuracy calibration in face recognition. Journal of Applied Psychology, 88(3), 97–120. [DOI] [PubMed] [Google Scholar]
- Wolpert DM, Ghahramani Z, & Jordan MI (1995). An internal model for sensorimotor integration. Science, 269(5232), 1880–1882. [DOI] [PubMed] [Google Scholar]
- Wolpert DM, & Landy MS (2012). Motor control is decision-making. Current Opinion in Neurobiology, 22(6), 996–1003. [DOI] [PMC free article] [PubMed] [Google Scholar]
- Yeung N, & Summerfield C (2012). Metacognition in human decision-making: Confidence and error monitoring. Philosophical Transactions of the Royal Society B: Biological Sciences, 367(1594), 1310–1321. [DOI] [PMC free article] [PubMed] [Google Scholar]
- Zhang H, Daw ND, & Maloney LT (2013). Testing whether humans have an accurate model of their own motor uncertainty in a speeded reaching task. PLoS Computational Biology, 9(5), Article e1003080. [DOI] [PMC free article] [PubMed] [Google Scholar]
- Zylberberg A, Barttfeld P, & Sigman M (2012). The construction of confidence in a perceptual decision. Frontiers in Integrative Neuroscience, 6, 79. [DOI] [PMC free article] [PubMed] [Google Scholar]
Associated Data
This section collects any data citations, data availability statements, or supplementary materials included in this article.