Abstract
Compared to green fluorescent protein (GFP)-based biosensors, red fluorescent protein (RFP)-based biosensors are inherently advantageous because of reduced phototoxicity, decreased autofluorescence, and enhanced tissue penetration. However, existing RFP-based biosensors often suffer from small dynamic ranges, mislocalization, and undesired photoconversion. In addition, the choice of available RFP-based biosensors is limited, and development of each biosensor requires substantial effort. Herein, we describe a general and convenient method, which introduces a genetically encoded noncanonical amino acid (ncAA), 3-aminotyrosine (aY), to the chromophores of GFP-like proteins and biosensors for spontaneous and efficient green-to-red conversion. We demonstrated that this method could be used to quickly expand the repertoire of RFP-based biosensors. With little optimization, the aY-modified biosensors preserved the molecular brightness, dynamic range, and responsiveness of their green fluorescent predecessors. We further applied spectrally resolved biosensors for multiplexed imaging of metabolic dynamics in pancreatic β-cells.
Fluorescent protein (FP)-based biosensors are indispensable research tools.1,2 Despite red FP (RFP)-based biosensors increasingly being reported, the emission of most existing FP-based biosensors still falls in the green or yellow spectral region,2 where their spectral overlap hinders and sometimes precludes multiplexing. Moreover, because of their use of longer-wavelength excitation light, RFP-based biosensors are expected to reduce phototoxicity and autofluorescence and increase photon penetration and imaging depth. However, RFP-based biosensors are repeatedly outperformed by their green fluorescent counterparts in real applications, due to the remaining shortcomings of existing RFP-based biosensors, such as small dynamic ranges, mislocalization, and undesired photoconversion.2 In this context, there is a pressing need to expand RFP-based biosensors not only for a broader range of analytical targets but also for improved properties.
Although several green-to-red, photoconvertible FPs have been reported and widely used,1 there has been limited success in directly converting a typical green FP (GFP) to an RFP. In one study, mutagenesis of GFP resulted in an “R10-3” mutant containing a mixture of green and red fluorescent chromophores.3 A few other studies reported green-to-red photoconversion under anaerobic conditions,4,5 under extensive ultraviolet or blue irradiation with high GFP expression levels,6,7 or in the presence of electron receptors.8,9 Nevertheless, these approaches usually led to only partial photoconversion. Research has also been done to modify the photophysical properties of FPs with noncanonical amino acids (ncAAs). In one example, by using auxotrophic E.coli host strains, a tryptophan analog was incorporated into cyan FP (CFP) to derive a “gold” fluorescent protein, GdFP, with excitation and emission maxima at 466 and 574 nm, respectively.10 In several other examples, by expressing orthogonal tRNAs and aminoacyl-tRNA synthetases (aaRSs) in live cells,11 ncAAs were site-specifically introduced into GFP in response to a nonsense amber codon, resulting in GFP mutants with shifted excitation and emission,12,13 altered pH responses,14,15 photoactivation or photoswitching properties,16–18 or new capabilities to sense various analytes.19–23 Despite this progress, there is no reliable evidence that any of the aforementioned methods can be generalized for green-to-red conversion of diverse GFP-like proteins and their derived biosensors.
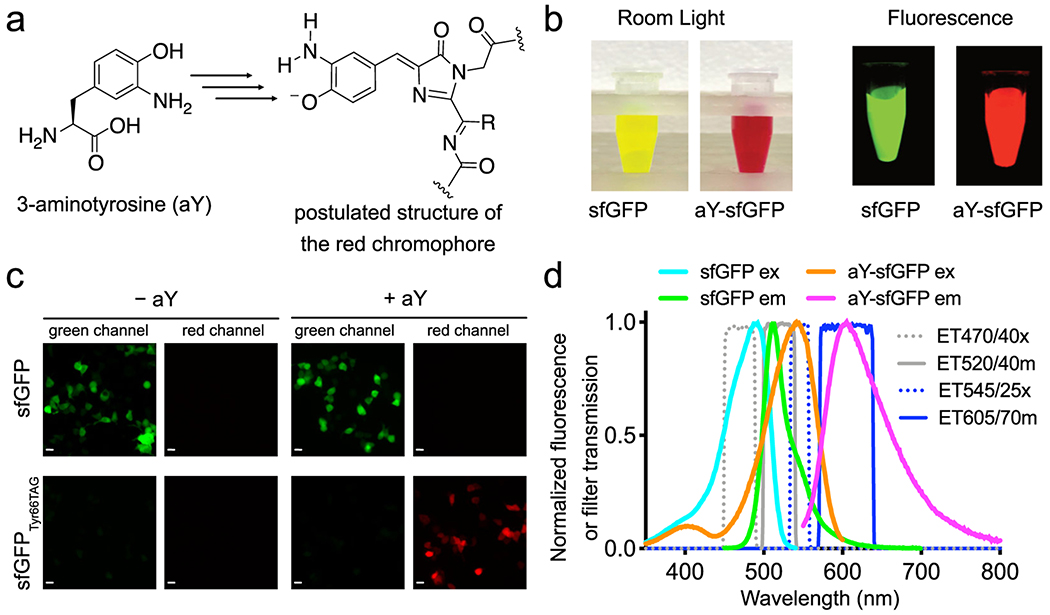
In the process of modifying GFP with 3-aminotyrosine (aY, Fig. 1a) for the development of new biosensors, we serendipitously discovered that aY, when introduced into the chromophores of GFP-like proteins and biosensors via genetic code expansion,11 could spontaneously and efficiently red-shift their fluorescence. Here, we demonstrate that this method can be generalized to red-shift various FP variants and biosensors. In addition to molecular brightness, the dynamic range and responsiveness of the converted biosensors were largely retained. By using spectrally resolved biosensors resulting from this study, we further monitored metabolic dynamics in pancreatic β-cells in response to high glucose.
Figure 1. Green-to-red conversion of sfGFP by 3-aminotyrosine (aY).
(a) Chemical structure of aY. (b) Imaging of sfGFP and aY-sfGFP proteins prepared from E. coli. (c) Microscopic imaging of HEK 293T cells co-transfected with pMAH-EcaYRS and pcDNA3-sfGFP or pcDNA3-sfGFP(Tyr66TAG) in the presence or absence of aY, showing red fluorescence of aY-sfGFP in mammalian cells. Images were identically treated, except that 100 ms and 300 ms exposures were used to acquire images in the top and bottom rows, respectively. Scale bar: 20 μm. (d) Fluorescence excitation and emission spectra of sfGFP (cyan and green) and aY-sfGFP (orange and magenta), suggesting that sfGFP and aY-sfGFP can be sequentially imaged with little crosstalk using appropriate filters. Transmission spectra for excitation and emission filters designated with Chroma Technology part numbers are also plotted (gray and blue). Experiments in panels b-d were repeated three times with similar results using independent biological samples.
RESULTS
Genetic encoding of aY in E. coli and mammalian cells
A previous study reported a Methanococcus jannaschii tyrosyl-tRNA synthetase (MjTyrRS) mutant for the genetic encoding of aY in E. coli,24 so we first tested this MjTyrRS mutant but unfortunately observed a high cross-reactivity with tyrosine. Next, we examined another MjTyrRS mutant, which was initially engineered for the genetic encoding of 3-iodotyrosine.25 We chose this mutant as our starting point for further engineering, since aY is structurally close to 3-iodotyrosine and this particular MjTyrRS mutant was shown not to esterify tyrosine.25 We computationally docked aY into the active site of this enzyme and introduced in silico randomization by following our previous procedure.26 We identified a promising MjTyrRS mutant (designated MjaYRS) with serine at residue 70, which mutation may promote H-bonding with the side-chain amino group of aY (Supplementary Fig. 1a). Next, we expressed a superfolder GFP (sfGFP)27 mutant with an amber codon introduced to its residue 66 in the presence of MjaYRS and the corresponding amber suppression tRNA. We observed strong fluorescence and obtained the full-length protein in good yield (~ 6.7 mg per liter of culture) when aY was supplemented (Supplementary Figs. 1b–d). In the absence of aY, little protein was obtained (Supplementary Fig. 1c), suggesting that MjaYRS has satisfactory specificity. In addition, we characterized the protein prepared in the presence of aY with electrospray ionization mass spectrometry (ESI-MS) and confirmed the incorporation of aY to sfGFP (Supplementary Fig. 1e). We did not observe a peak corresponding to sfGFP with tyrosine at residue 66, further confirming the specificity of MjaYRS.
To enable the genetic encoding of aY in mammalian cells, we took E. coli tyrosyl-tRNA synthetase (EcTyrRS) as our starting template (Supplementary Fig. 2a). We first introduced a D265R mutation to increase anticodon recognition by the aaRS,28 and further inserted a tyrosine editing domain into EcTyrRS to reduce its reactivity with tyrosine.29 We next created 30 EcTyrRS variants by mutating residues 37 and 195 within the amino acid substrate-binding pocket. We identified an aaRS variant (a.k.a. EcaYRS) with Y37L and Q195S mutations (Supplementary Fig. 2b) by screening the EcTyrRS mutants for amber suppression of an enhanced GFP (EGFP) gene containing a TAG codon at residue 39. In the presence of aY, EcaYRS, and the corresponding tRNA, full-length EGFP was generated in human embryonic kidneys (HEK) 293T cells, as confirmed by both fluorescence microscopy and ESI-MS (Supplementary Figs. 2c–e). Although we observed weak fluorescence from the cells cultured in the absence of aY (Supplementary Figs. 2b,c), the ESI-MS analysis of the protein prepared in the presence of aY did not show any peak corresponding to EGFP with tyrosine at residue 39 (Supplementary Fig. 2d), suggesting that EcTyrRS has adequate specificity and aY can outcompete tyrosine for EcTyrRS-catalyzed tRNA aminoacylation.
aY-induced red-shift of FPs and FP-based biosensors
The color of aY-sfGFP (sfGFP27 with aY introduced to its chromophore-forming residue 66) from E. coli was surprisingly red under either room light or green excitation, and it had nearly no residual green fluorescence (Fig. 1b). To test whether this phenomenon is species-specific, we expressed aY-sfGFP in HEK 293T cells and also observed spontaneous, red fluorescence (Fig. 1c). The excitation and emission maxima of aY-sfGFP were red-shifted from those of sfGFP by 56 and 95 nm, respectively, suggesting that it may be possible to pair aY-sfGFP with GFPs or GFP-based biosensors for sequential, dual-color imaging using common fluorescence microscope setups (Fig. 1d).
The chromophore of GFP is spontaneously formed through cyclization, dehydration, and oxidation of an internal tripeptide motif, while the chromophores of common RFPs differ from GFP in terms of additional, self-catalyzed oxidation which expands chromophore conjugation via a hydrolyzable N-acylimine substitution.30 Because aY is sensitive to oxidation, we hypothesize that aY-sfGFP spontaneously forms an RFP-like chromophore through additional oxidation (Fig. 1a & Supplementary Fig. 3a). Although the detailed mechanism remains to be explored, the formation of a hydrolyzable chromophore is supported by backbone cleavage of aY-sfGFP under denaturing conditions (Supplementary Fig. 3b). Furthermore, the absorbance of aY-sfGFP decreases at ~ 540 nm with concurrent increase at ~ 390 nm as pH drops from neutral to acidic, (Supplementary Fig. 3c), suggesting the existence of an anionic chromophore in aY-sfGFP at neutral conditions.
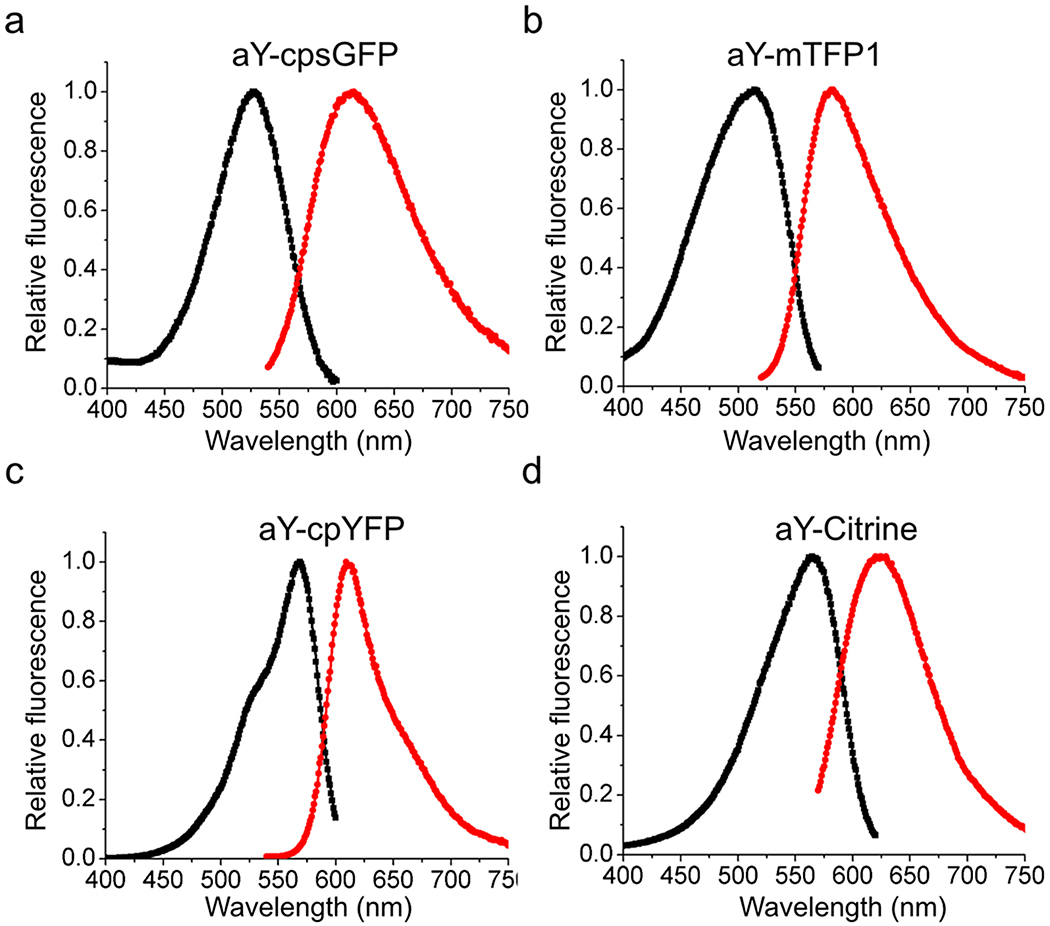
Next, we introduced aY to the chromophores of several FPs containing tyrosine-derived chromophores, including teal fluorescent mTFP1,31 yellow fluorescent Citrine,32 a circularly permuted sfGFP (cpsGFP),33 and a circularly permuted yellow FP (cpYFP).23 Red-shifted excitation and emission were observed for all of them (Extended Data Fig. 1 & Table 1), indicating that the aY-induced green-to-red conversion is neither protein-specific nor topology-specific.
Table 1.
Photophysical properties of the selected fluorescent proteins.
| Chromophore-forming residues | Normal proteins | Proteins with aY-derived chromophores | Brightness ratios e | |||||||
|---|---|---|---|---|---|---|---|---|---|---|
| λex a (nm) | λem b (nm) | ε (mM−1 •cm−1) c | φ d | λex a (nm) | λem b (nm) | ε (mM−1 •cm−1) c | φ d | |||
| sfGFP | TYG | 485 | 510 | 85.6 | 0.70 | 541 | 605 | 125.1 | 0.43 | 89.8% |
| cpsGFP f | TYG | 488 | 510 | 73.1 | 0.66 | 527 | 615 | 88.5 | 0.40 | 73.4% |
| mTFP1 | AYG | 462 | 492 | 65.6 | 0.81 | 514 | 581 | 85.5 | 0.50 | 80.5% |
| cpYFP g | GYG | 503 | 515 | 76.3 | 0.58 | 569 | 609 | 82.6 | 0.38 | 70.9% |
| Citrine | GYG | 516 | 529 | 75.3 | 0.75 | 565 | 624 | 95.0 | 0.45 | 75.7% |
wavelength of the excitation peak.
wavelength of the emission peak.
extinction coefficient.
quantum yield.
molecular brightness (defined as ε×φ) of an aY-modified protein presented as the percentage of the molecular brightness of the corresponding normal protein.
circularly permuted sfGFP variant previously used to derive the hydrogen sulfide sensor, hsGFP.33
circularly permuted EYFP variant previously used to derive the hydrogen sulfide sensor, cpGFP-pAzF.23
We further determined the molecular brightness of these proteins. Although the quantum yields of the aY-modified proteins were reduced by ~ 40%, their extinction coefficients were increased by 8-46%, resulting in overall molecular brightness ranging from 70% to 90% of their parental proteins with tyrosine-derived chromophores (Table 1). This phenomenon is striking because no individual optimization was performed with these aY-modified proteins.
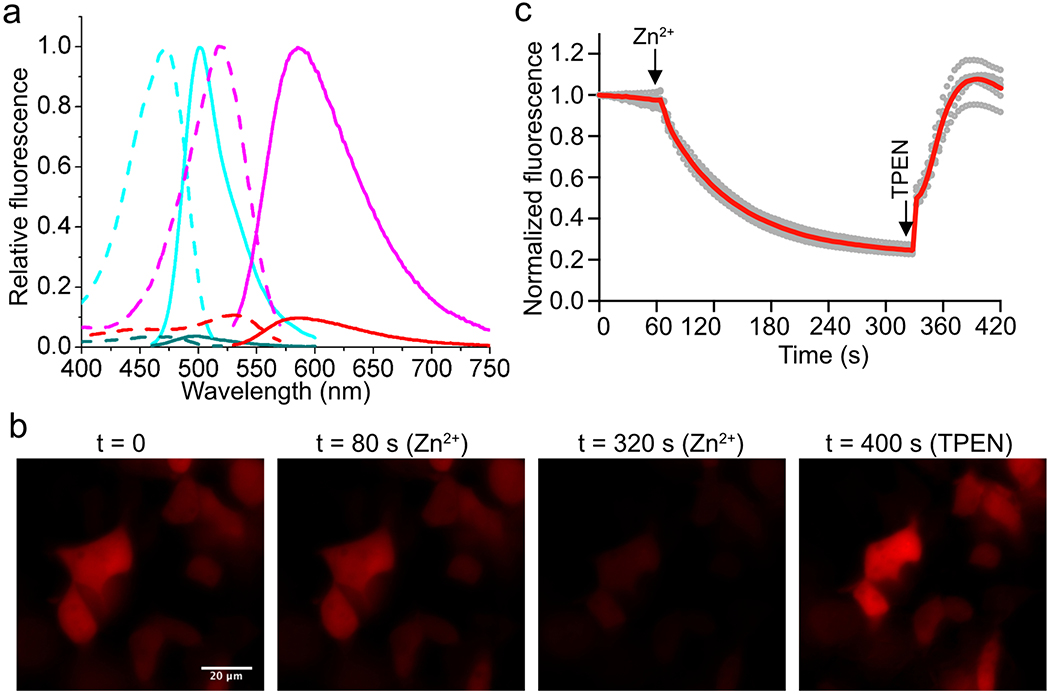
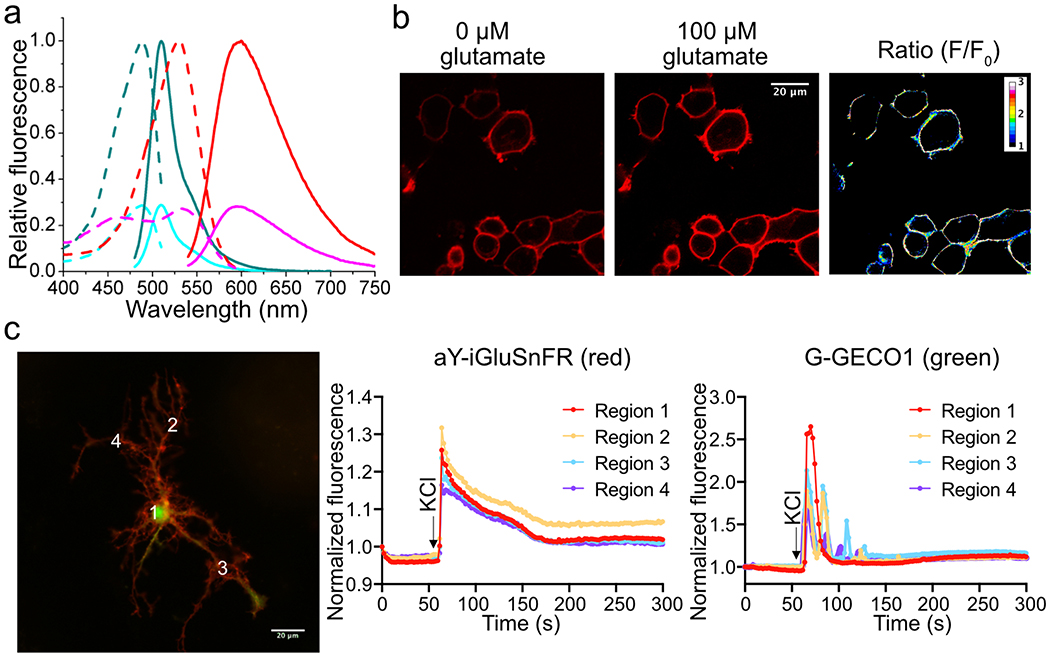
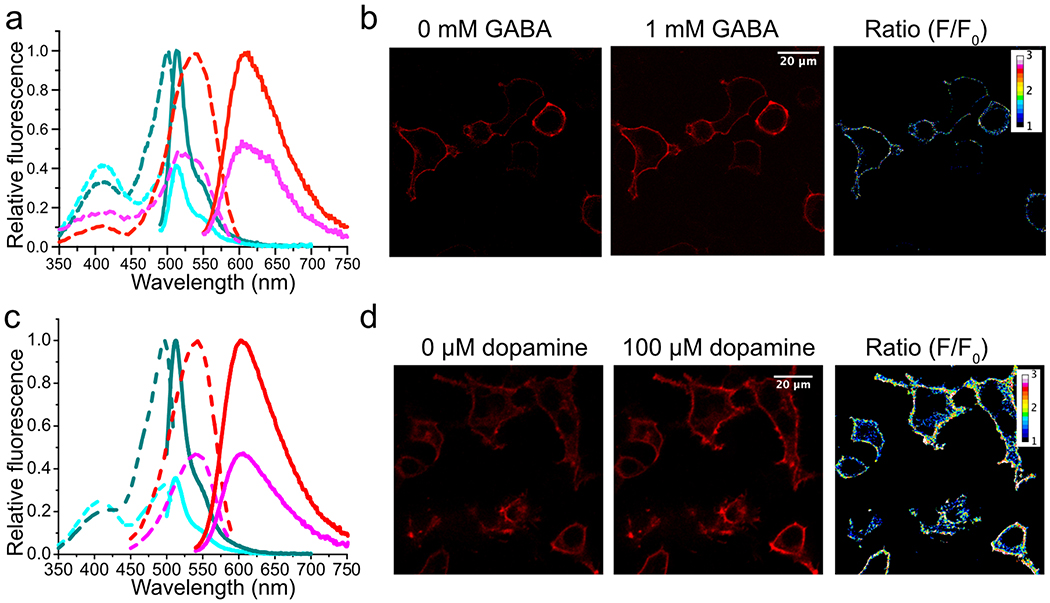
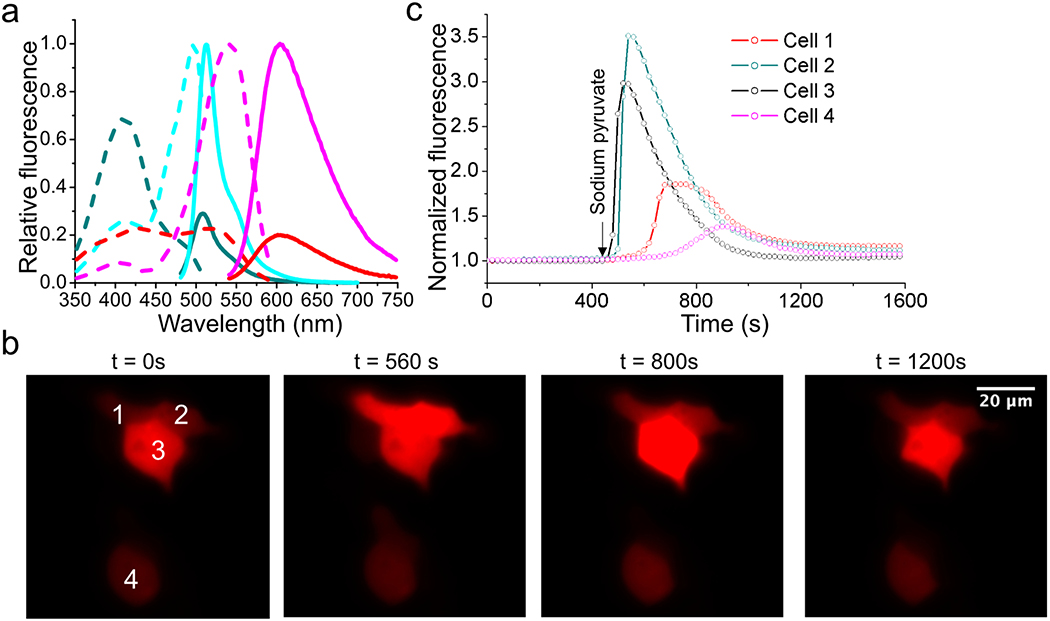
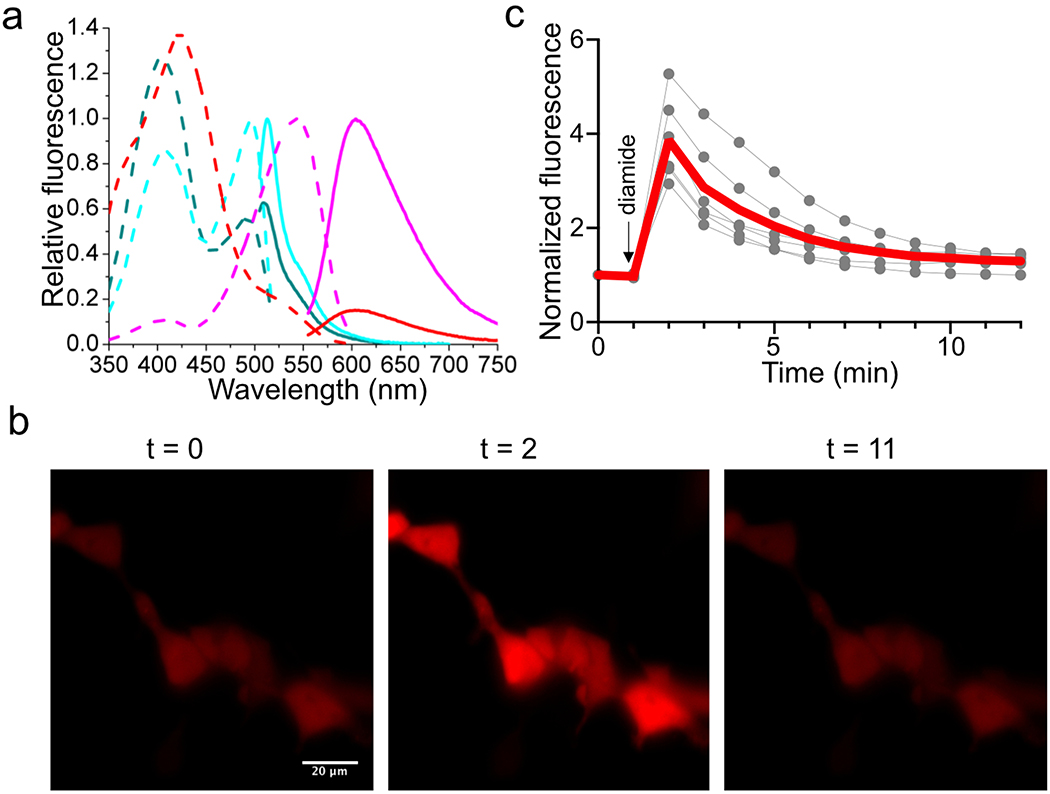
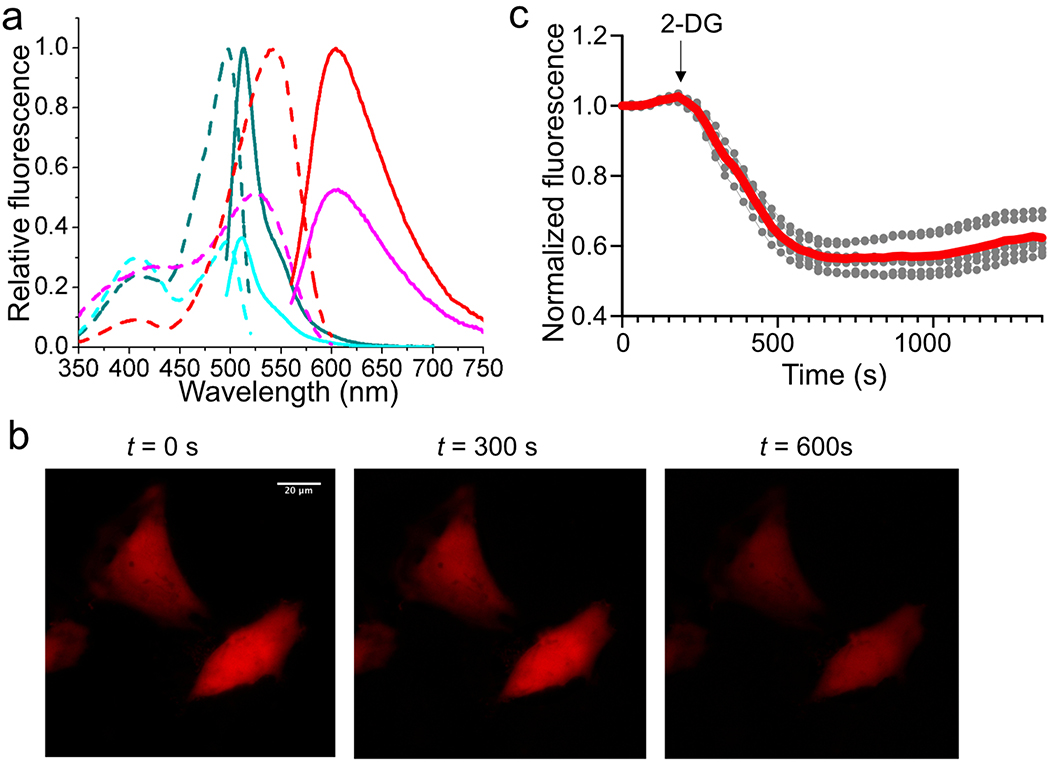
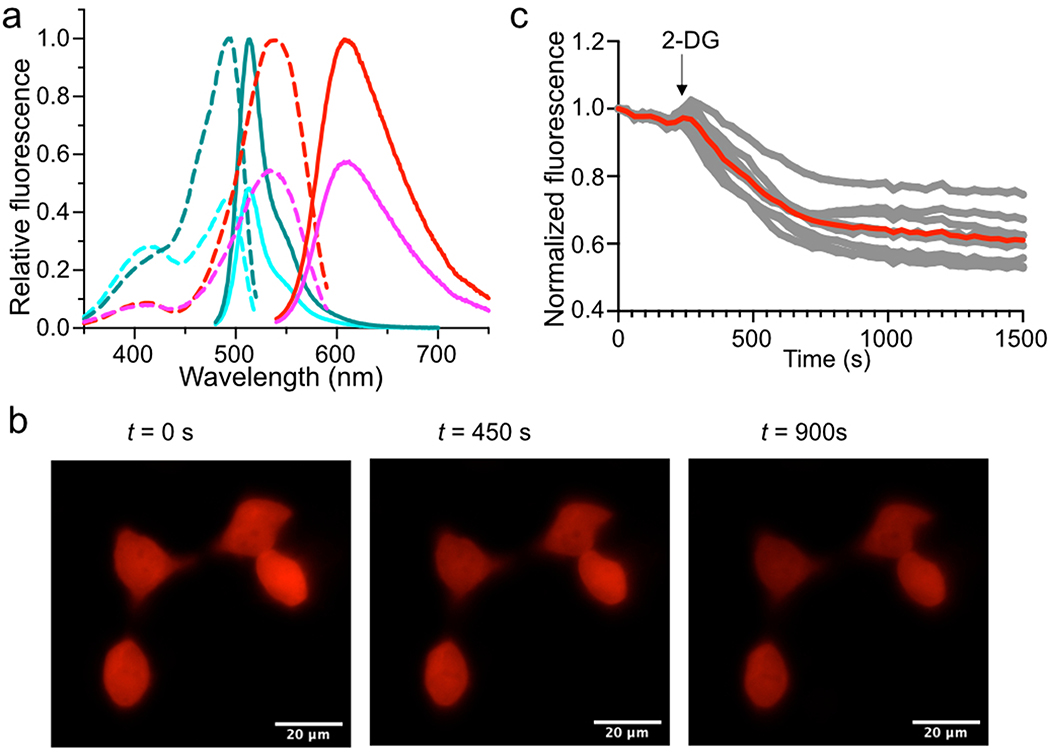
After confirming that aY can red-shift various tyrosine-derived chromophores, we used aY to modify a number of biosensors based on circularly permuted green, teal, or yellow FPs, including G-GECO1 (a Ca2+ sensor),34 ZnGreen1 (a Zn2+ sensor),35 iGluSnFR (a glutamate sensor),36 iGABASnFR (a GABA sensor),37 dLight1.2 (a dopamine sensor),38 SoNar (an NAD+/NADH sensor),39 iNAP1 (an NADPH sensor),40 PercevalHR (an ATP sensor),41 and iATPSnFR1.1 (another ATP sensor).42 We observed red-shifted fluorescence for all tested biosensors (Table 2). Without individual optimization, the aY-modified biosensors again inherited most of the molecular brightness from their green fluorescent predecessors (Table 2). Moreover, the converted biosensors largely preserved the dynamic range and responsiveness, as shown in our validation experiments with purified proteins, cultured mammalian cell lines, and/or primary neurons (Extended Data Figs. 2–9 and Supplementary Videos 1 and 2). In particular, we used the green fluorescent G-GECO1 sensor and aY-iGluSnFR for dual-color imaging of Ca2+ and glutamate in mouse neurons during membrane depolarization and confirmed the spectral orthogonality of the two biosensors (Extended Data Fig. 4 and Supplementary Video 2). Some biosensors, such as SoNar, iNap1, and PercevaHR, are known for robust, excitation-ratiometric responses.39–41 Not surprisingly, their aY-modified biosensors were also excitation-ratiometric (Extended Data Figs. 7–9). The dynamic range of these biosensors, by analyzing either intensiometric changes (ΔF/Fmin) around their emission peaks in the presence of 540 nm excitation or ratiometric changes concerning the two excitation peaks, was comparable or even better than that of the wild-type sensors harboring tyrosine-derived chromophores (Table 2).
Table 2.
Photophysical properties of the tested genetically encoded biosensors and their aY-modified variants.
| Biosensor | Analytical target | λex a (nm) | λem b (nm) | Dynamic Range c (%) | εd (mM−1 •cm−1) | φ e | ||
|---|---|---|---|---|---|---|---|---|
| − | + | − | + | |||||
| G-GECO1 34 | Ca2+ | 497 | 512 | 1,983 | 4.7 | 68.1 | 0.26 | 0.38 |
| aY-G-GECO1 | Ca2+ | 528 | 594 | 1,566 | 7.7 | 79.9 | 0.14 | 0.22 |
| ZnGreen1 35 | Zn2+ | 474 | 500 | 2,531 | 24.8 | 1.3 | 0.48 | 0.35 |
| aY-ZnGreen1 | Zn2+ | 520 | 585 | 915 | 34.7 | 4.8 | 0.28 | 0.20 |
| iGluSnFR 36 | glutamate | 488 | 510 | 257 | 9.6 | 32.6 | 0.58 | 0.60 |
| aY-iGluSnFR | glutamate | 528 | 600 | 270 | 12.2 | 42.7 | 0.46 | 0.49 |
| iGABASnFR 37 | GABA | 502 | 513 | 143 | NDf | NDf | NDf | NDf |
| aY-GABASnFR | GABA | 541 | 602 | 92 | NDf | NDf | NDf | NDf |
| dLight1.2 38 | dopamine | 496 | 513 | 194 | NDf | NDf | NDf | NDf |
| aY-dLight1.2 | dopamine | 545 | 603 | 117 | NDf | NDf | NDf | NDf |
| SoNar 39 | NAD+/NADH | 497 | 512 | 257 [2,532]g | 7.6 | 23.0 | 0.44 | 0.51 |
| aY-SoNar | NAD+/NADH | 544 | 604 | 426 [2,656]g | 6.5 | 28.6 | 0.29 | 0.35 |
| iNap1 40 | NADPH | 497 | 513 | 82 [273]g | 22.6 | 13.1 | 0.50 | 0.43 |
| aY-iNap1 | NADPH | 545 | 604 | 614 [11,735]g | 27.6 | 4.4 | 0.41 | 0.36 |
| PercevalHR 41 | ATP | 498 | 513 | 155 [364]g | 14.6 | 35.6 | 0.28 | 0.28 |
| aY-PercevalHR | ATP | 545 | 604 | 117 [650]g | 18.4 | 40.5 | 0.21 | 0.21 |
| iATPSnFR1.1 42 | ATP | 493 | 513 | 106 | 22.6 | 43.9 | 0.36 | 0.37 |
| aY-iATPSnFR1.1 | ATP | 541 | 608 | 75 | 29.1 | 50.9 | 0.28 | 0.28 |
wavelength of the excitation peak near 490 and 540 nm for green and aY-modified, red fluorescent biosensors, respectively.
wavelength of the emission peak.
unless otherwise specified, dynamic range is defined as the intensiometric change (ΔF/Fmin) around emission peaks in the presence of 480 and 540 nm excitation for green and aY-modified, red fluorescent biosensors, respectively.
extinction coefficient in the presence (+) or absence (−) of the corresponding analyte. For SoNar and aY-SoNar, presented are values with NAD+ (+) or NADH (−).
quantum yield.
not determined.
in square brackets are dynamic ranges (Rmax/Rmin) of the sensors operated in the excitation-ratiometric mode; defined as the ratio of the intensity ratios at two excitation peak wavelengths.
Imaging of metabolic dynamics in pancreatic β cells
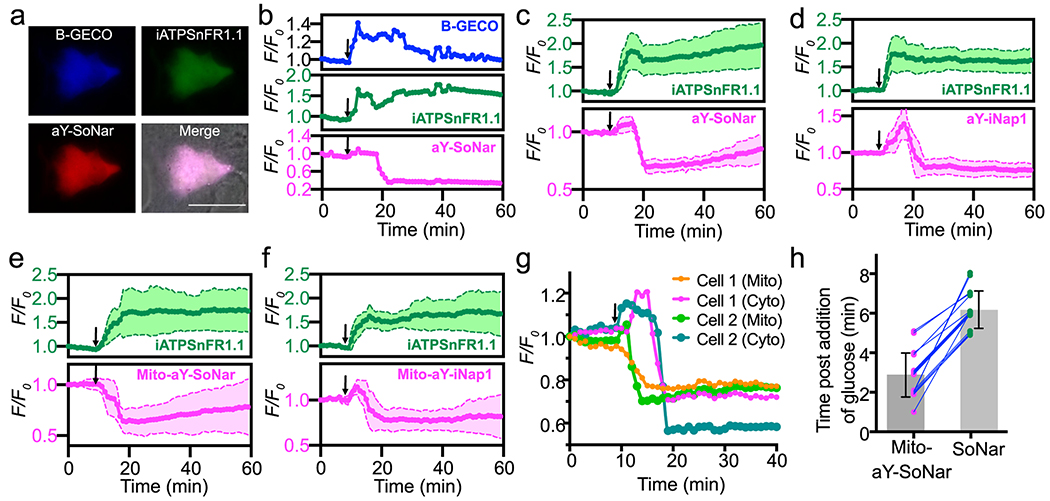
To further demonstrate the use of aY-modified biosensors for multiplexed imaging, we monitored glucose-induced metabolic dynamics in mouse MIN6 β-cells. Pancreatic β-cells are responsible for glucose sensing and secretion of insulin, a key hormone regulating sugar metabolism. Upon entering β-cells, glucose breaks down to generate an array of metabolic signals that regulate insulin synthesis and secretion (Supplementary Fig. 4). Although previous studies have demonstrated important roles of NADH, NADPH, ATP, and Ca2+ in glucose sensing in β cells, the spatiotemporal dynamics of these signals has not been fully understood.43 We first co-expressed B-GECO (a blue fluorescent Ca2+ biosensor),34 iATPSnFR1.1 (a green fluorescent ATP biosensor),42 and aY-SoNar (a red fluorescent NAD+/NADH biosensor) in MIN6 cells (Fig. 2a). To simplify the multicolor time-lapse imaging process and reduce the overall light exposure to avoid photobleaching and phototoxicity, we focused on only the intensiometric changes of the biosensors. In response to high glucose (20 mM), we observed an immediate rise of B-GECO or iATPSnFR1.1 fluorescence, reflecting an acute increase of intracellular Ca2+ and ATP (Fig. 2b). The fluorescence of B-GECO or iATPSnFR1.1 was sustained at high levels with some expected oscillations for an extended period. Surprisingly, the fluorescence of aY-SoNar displayed a small, immediate increase followed by a drop, suggesting an initial small increase and then a decrease of cellular NAD+/NADH. Despite the heterogeneity of individual MIN6 cells, this trend for aY-SoNar was well-reproduced when we examined more cells. (Fig. 2c). Similarly, we observed a phenomenal rise followed by a reduction of the fluorescence of aY-iNap1 (a red fluorescent NADPH biosensor) post glucose stimulation (Fig. 2d). Since the concentration of NADPH is inversely correlated with the fluorescence of aY-iNap1 (Extended Data Fig. 7), we interpret that high glucose transiently decreased NADPH and then maintained high NADPH levels in MIN6 cells.
Figure 2. Fluorescence imaging of glucose-induced metabolic dynamics in pancreatic MIN6 β-cells.
(a) Representative tri-color images of MIN6 co-expressing B-GECO, iATPSnFR1.1, and aY-SoNar. n=3 repeats. Scale bar: 20 μm. Similar results were gained with three independent repeats. (b) Representative traces (F/F0) for B-GECO, iATPSnFR1.1, and aY-SoNar. Similar results were gained with three independent repeats. (c) Quantitative traces (F/F0) for co-expressed iATPSnFR1.1 and aY-SoNar (n=8 cells examined over 3 independent experiments). (d) Quantitative traces (F/F0) for co-expressed iATPSnFR1.1 and aY-iNap1 (n=7 cells examined over 3 independent experiments). (e) Quantitative traces (F/F0) for co-expressed iATPSnFR1.1 and mitochondrial aY-SoNar (n=8 cells examined over 3 independent experiments). (f) Quantitative traces (F/F0) for co-expressed iATPSnFR1.1 and mitochondrial aY-iNap1 (n=12 cells examined over 3 independent experiments). (g) Representative traces (F/F0) for two cells co-expressing cytosolic SoNar and mitochondrial aY-SoNar. Similar results were obtained with five independent repeats. (h) Comparison of response time (corresponding to the middle point of the fluorescence decrease phase) in individual MIN6 cells after glucose addition (n=17 cells examined over 5 independent experiments; Mito-aY-SoNar: 2.88±1.11 min; SoNar: 6.18±0.95 min; Wilcoxon matched-pairs signed rank test, P=0.00015). The time points for addition of 20 mM D-glucose are shown as arrows in panels b-g. Data are presented as mean and s.d. of indicated replicates.
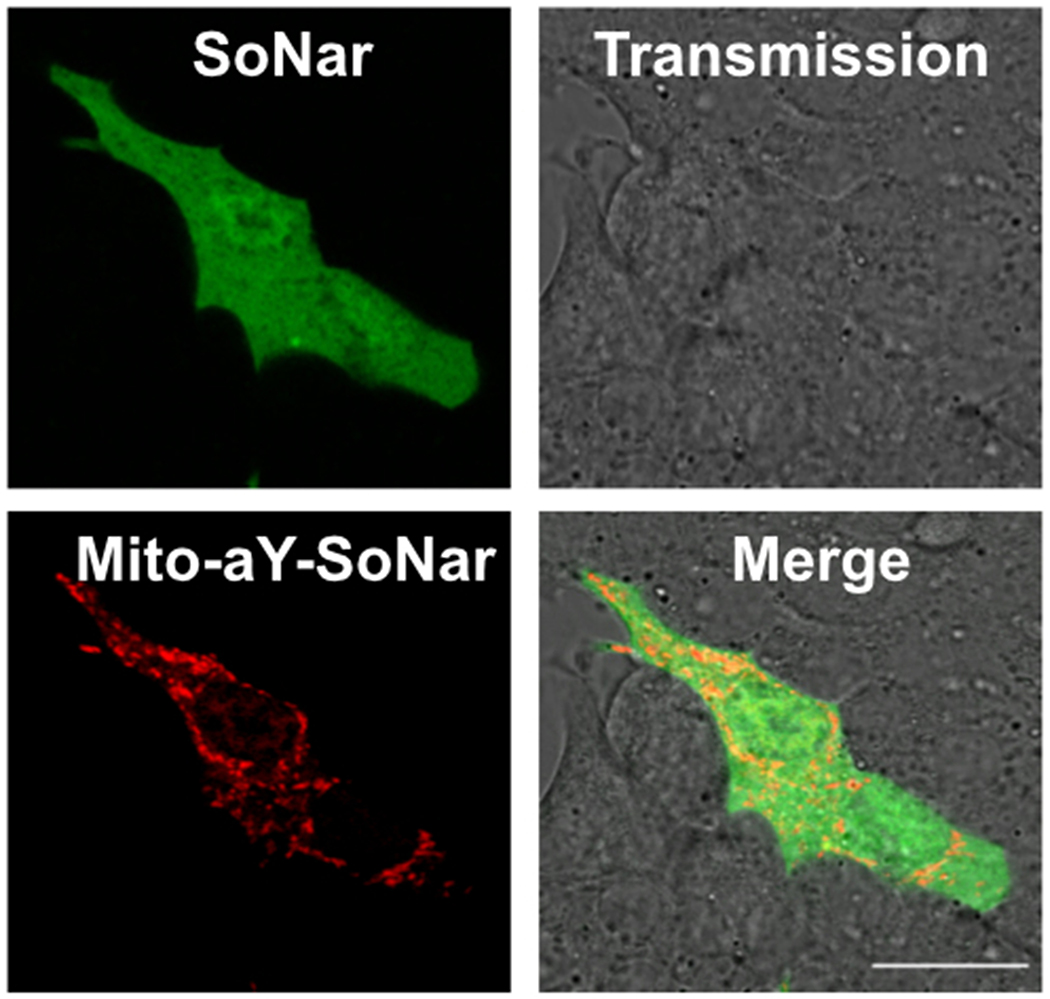
Because NAD+/NADH and NADPH are compartmentalized and mitochondria play a central role in metabolism, we next fused aY-SoNar or aY-iNap1 to a mitochondrial localization sequence for expression in the mitochondria of MIN6 cells. In response to high glucose, mitochondrial NAD+/NADH displayed an immediate decrease, whereas mitochondrial NADPH still decreased transiently before the rise (Fig. 2e,f). We further co-expressed SoNar and mitochondrial aY-SoNar to follow compartmentalized changes in the same MIN6 cells (Fig. 2g, Extended Data Fig. 10, and Supplementary Video 3). Upon glucose stimulation, there were obvious and consistent delays in cytosolic NAD+/NADH decrease compared to mitochondrial NAD+/NADH, and the average delay time was determined to be 3.3 min by analyzing 17 individual cells (Fig. 2g,h). To exclude the possibility that the observed time differences may be caused by different response kinetics, we monitored the fluorescence of SoNar, iNap1, iATPSnFR1.1, and their aY-modified variants upon sequential injections of the corresponding analytes and analyte-depleting enzymatic mixtures (Supplementary Fig. 5). The sensor responses, which were certainly convoluted by the speed of reagent dispensing and mixing, occurred and completed within a few seconds and were much faster than the time differences discussed above regarding our β-cell imaging experiments.
DISCUSSION
In this study, we engineered two new aaRSs to genetically encode aY in E. coli and mammalian cells. Both MjaYRS and EcTyrRS showed adequate specificity for site-specific incorporation of aY into proteins. We further developed a general method based on the introduction of aY to the chromophores of GFP-like proteins and biosensors for spontaneous and efficient green-to-red conversion. Our approach does not require photoconversion or other special experimental conditions and is compatible with a variety of FPs and FP-based biosensors in E. coli, mammalian cell lines, and primary cells. Therefore, this method can be used to quickly expand RFP-based biosensors. Although ncAAs have been explored previously for spectral shifting of FPs, aY is unique in that it causes drastic red-shifting and with little optimization, the molecular brightness of the resultant FPs and biosensors was largely retained. Moreover, the aY-modified biosensors mostly preserved the dynamic range and responsiveness of their green fluorescent predecessors.
Despite its promise, this new technology has a few limitations. First, amber codon suppression is used here to achieve genetic code expansion; although this process is often tolerated by live organisms,11 we expect potential side effects such as hijacking of amber codons in host genomes. In addition, the suppression of the amber codon introduced into the genes of the FPs or biosensors is incomplete due to the competition between amber suppression and release-factor-induced translation termination, and thus, we must use longer exposure times to image aY-modified FPs and biosensors, or increase the amount of the plasmids for the expression of aY-modified proteins in order to gain similar protein expression levels in cells. Furthermore, the amino acid aY has to be exogenously provided into cell culture media, so there may be challenges to using aY-modified biosensors for in vivo imaging. Fortunately, several previous studies have utilized genetic code expansion systems in multi-cellular organisms, such as worms, fruit flies, zebrafish, and mice,44–46 and these studies may serve as examples for further adaption of aY-modified biosensors into similar organisms.
We utilized the aY-based strategy to red-shift a panel of biosensors, including those for metal ions, neurotransmitters, and cell metabolites. Some biosensors were excitation-ratiometric before the conversion and they remained excitation-ratiometric after the conversion. The aY modification drastically red-shifted the long-wavelength excitation band of these biosensors, but only slightly red-shifted their short-wavelength excitation band. Thus, to operate the converted biosensors in a ratiometric mode, ~ 420 nm excitation would still be needed. Therefore, although ratiometric imaging is expected to be advantageous in terms of quantitation, in our microscopic imaging experiments we operated the biosensors intensiometrically, with only the long-wavelength excitation, for simplicity and reduced phototoxicity and photobleaching.
We further used these biosensors for multiplexed imaging of metabolic dynamics in pancreatic β-cells. As expected, we observed an increase in cellular ATP and Ca2+ in response to high glucose. However, changes in NAD+/NADH and NADPH levels were more complicated. Normally, a net gain in NADH is expected to occur upstream to the gain in ATP in glucose metabolism (Supplementary Fig. 4).43 However, we observed a delay in high-glucose-induced NADH increase, particularly in the cytosol, in relation to ATP increase. This unexpected delay corroborates the notion that glucose-sensing mechanisms in β-cells are not yet fully understood.43,47 On the basis of our imaging results, we postulate that, in the first few minutes after high glucose stimulation, there may be transient ATP production from NADH using enzymes such as lactate dehydrogenase (LDH), or high glucose and its derivatives may activate metabolic shuttles between the cytosol and mitochondria.43,47 In addition, glucose-induced NADPH was previously suggested to protect β-cells from oxidative stress,48 but our study uncovered an unexpected, transient phase lasting a few minutes post glucose stimulation, during which NADPH decreases in both cytosol and mitochondria of MIN6 cells. The result suggests that transient oxidation, likely caused by NADPH oxidase or mitochondrial reactive oxygen species (ROS),49,50 may be an acute signaling response of β-cells to high glucose. Research is ongoing in our laboratory to further investigate these mechanisms using primary β-cells and islets.
Methods
Materials, reagents, and general methods.
Synthetic DNA oligonucleotides were purchased from Eurofins Genomics or Integrated DNA Technologies. The gene fragments for dLight1.2, SoNar, and iNap1 were chemically synthesized and purchased from Eurofins Genomics. CMV-B-GECO1 (Addgene plasmid # 32448) and pTorPE-G-GECO1 (Addgene plasmid # 32466) were gifts from Dr. Robert Campbell (University of Alberta). pCMV(MinDis).iGluSnFR (Addgene plasmid # 41732) and pAAV.hSynap.iGABASnFR (Addgene plasmid # 112159) were gifts from Dr. Loren Looger (Janelia). pm-iATPSnFR1.1 (Addgene plasmid # 102549) was a gift from Baljit Khakh (UCLA). FUGW-PercevalHR (Addgene plasmid # 49083) was a gift from Dr. Gary Yellen (Harvard). Wild-type MjTyrRS and EcTyrRS genes were gifts from Dr. Peter Schultz (Scripps). ZnGreen1 was previously reported by our lab.35 FastDigest restriction endonucleases and Phusion High-Fidelity DNA Polymerase were purchased from Fisher Scientific. ChoiceTaq DNA polymerase was purchased from Denville Scientific. The aY amino acid (a.k.a. H-3-amino-Tyr-OH·2HCl, Cat # 402789) was purchased from Bachem. 2-Deoxy-D-glucose (a.k.a. 2-DG, Cat # D0051) and tetramethylazodicarboxamide (a.k.a. diamide, Cat # A1458) were purchased from TCI America. Dopamine hydrochloride (Cat # A11136), ionomycin (Cat # J62448), and reduced β-nicotinamide adenine dinucleotide (a.k.a. NADH, Cat # J61638) were purchased from Alfa Aesar. N,N,N′,N′-tetrakis(2-pyridinylmethyl)-1,2-ethanediamine (a.k.a. TPEN, Cat # 13340) and β-nicotinamide adenine dinucleotide phosphate reduced tetrasodium salt (a.k.a. NADPH, Cat # 9000743) were purchased from Cayman Chemical. Oxidized β-nicotinamide adenine dinucleotide (a.k.a. NAD+, Cat # 481911) was purchased from Sigma-Aldrich. Monosodium L-glutamate (Cat # GL135) was purchased from Spectrum Chemical. Cell culture media were purchased from Corning. Other chemicals were purchased from Fisher Scientific. DNA sequencing was performed by Eurofins Genomics. Fluorescence images were acquired with a Leica DMi8 inverted microscope equipped with a Leica EL6000 light source and a Photometrics Prime 95B Scientific CMOS camera. Depending on the brightness of individual samples, images were usually acquired with 10-15% of the light source intensity, 100-300 ms exposure, and a full-well camera detection mode. A TRITC filter cube with a 545/25 nm bandpass excitation filter and a 605/70 nm bandpass emission filter was used to record red fluorescence from aY-modified FPs and biosensors. A FITC filter cube with a 470/40 nm bandpass excitation filter and a 520/40 nm bandpass emission filter was used to record green fluorescence from corresponding FPs and biosensors. A DAPI filter cube with a 377/50 nm bandpass excitation filter and a 447/60 nm bandpass emission filter was used to record blue fluorescence from B-GECO. SDS-polyacrylamide gel electrophoresis (PAGE) was used to verify the purity of the prepared proteins (Supplementary Fig. 6). Additional unprocessed SDS-PAGE gel scans are presented in Supplementary Fig. 7. Other general information is available from the “Life Sciences Reporting Summary”.
Identification of sS for genetic encoding of aY in E. coli.
Starting with the Protein Data Bank (PDB) entry, 2ZP1, which is an MjTyrRS mutant (MjTyrRS-H70A/D158T/I159S/D286Y) in complex with 3-iodotyrosine,25 random mutagenesis at residue 70 was computationally introduced and the energy score function embedded in Autodock Vina 1.1.251 was used to assess the binding free energies of all complexes. By following our previously reported procedure,26 a promising MjTyrRS mutant with H70S, D158T, I159S, and D286Y mutations (designated MjaYRS) was identified. These mutations were next experimentally introduced into the wild-type MjTyrRS by using sequential overlap PCR reactions and the resultant gene fragment was ligated into the previously reported pEvol plasmid.52 Next, pEvol-MjaYRS and pBAD-sfGFP(Tyr66TAG) were used to co-transform bacterial DH10B cells. A colony picked from LB agar plates supplemented with ampicillin (100 μg/mL) and chloramphenicol (50 μg/mL) was used to inoculate 2 mL of LB at 37°C. Next day, the saturated culture was added to 100 mL of LB. When OD600 reaches 0.6, l-arabinose (0.2%, w/v) and the aY amino acid (2 mM) were added to induce protein expression. After two additional days of shaking incubation at 250 rpm and 30°C, cells were pelleted and lysed with sonication. A control sample without aY was simultaneously prepared. Fluorescence of cleared cell lysates was analyzed. Strong red fluorescence was observed only for the positive group to which aY was added during protein expression. Ni-NTA agarose beads (Thermo Scientific) were added to remaining lysates and 6xHis-tagged proteins were purified by following the manufacturer’s instructions. Proteins eluted from Ni-NTA beads were analyzed with SDS-PAGE and a band matching the size of full-length sfGFP was observed. Moreover, the eluted protein was desalted by precipitation with methanol and chloroform. The protein pellet was dissolved in ddH2O supplemented with 1% formic acid and injected into a Waters SQD2 electrospray ionization mass spectrometer (ESI-MS). The molar mass of the intact protein was determined by deconvolution of ESI peaks in MagTran1.03.53
Identification of aaRS for genetic encoding of aY in mammalian cells.
On the basis of the PDB entry 1WQ3, which is an EcTyrRS mutant in complex with 3-iodotyrosine,54 residues 37 and 195 of EcTyrRS were identified for mutagenesis. First, a D265R mutation was introduced to EcTyrRS using overlap PCR because this mutation was reported to increase anticodon recognition by the aaRS.28 Furthermore, a gene fragment encoding the tyrosine editing domain of phenylalanyl-tRNA synthetase (PheRS)29 was purchased from Eurofins Genomics and inserted to EcTyrRS via overlap PCRs, resulting in EcTyrRS* for reduced activity toward tyrosine. Using the aforementioned EcTyrRS* as the template, overlap PCRs were used to introduce mutations to residues 37 and 195 (numbered according to the wild-type EcTyrRS) and a total of 30 variants (residue 37: A, S, I, T, L, or V; and residue 195: A, N, S, T or C) in the pMAH vector23,55 were generated. These pMAH plasmids were used to co-transfect HEK 293T cells with pcDNA3-EGFP(Tyr39TAG).23,55 The aY amino acid (2 mM) was supplemented to cell culture media. After 2 days of incubation, cell lysates were prepared, and their fluorescence was determined by using a BioTek Synergy Mx plate reader. By comparing the lysate fluorescence of cells cultured in the presence and absence of the aY amino acid, an EcTyrRS* mutant with the highest incorporation specificity and efficiency was identified. This pMAH-aYRS plasmid was again used to co-transfect HEK 293T cells with pcDNA3-EGFP(Tyr39TAG), and the fluorescence difference of HEK 293T in the presence and absence of aY was confirmed with fluorescence microscopy. Furthermore, the full-length EGFP was purified using Ni-NTA agarose beads, desalted, and analyzed with ESI-MS as aforementioned.
Detection of aY-sfGFP fragmentation using SDS-PAGE.
Following a previously reported method,30 purified aY-sfGFP in 1x SDS gel-loading buffer was either unboiled or boiled at 100°C for 10 min, before being loaded to a 15% SDS-polyacrylamide gel (PAGE). Similarly treated mCherry and sfGFP were used for comparison. After electrophoresis, the gel was stained with Coomassie blue R-250.
Construction of expression vectors for FPs and biosensors.
Briefly, overlap PCRs with mutagenic primers were used to replace the codon of the chromophore tyrosine with the amber codon (TAG). The assembled gene fragments were inserted into either pBAD/Myc-His between Xho I and Hind III restriction sites for E. coli expression, or pcDNA3 between Hind III and Xho I restriction sites for mammalian expression. To express the amber variants of iGABASnFR and iGluSnFR on mammalian cell surface, the gene fragments were inserted to pDisplay between Bgl II and Sal I restriction sites. In addition, two residues of SoNar, iNap1, and PercevalHR corresponding to residues 68 and 69 of wild-type GFP were mutated to V and M, respectively, because these mutations were found to promote the formation of the red chromophore. For comparison purposes, pBAD/Myc-His, pcDNA3, and/or pDisplay plasmids harboring the genes of wild-type fluorescent proteins and biosensors were created in parallel. To express biosensors such as SoNar in mitochondria, overlap PCRs were used to add an N-terminal mitochondrial localization sequence (MLSLRQSIRFFKPATRTLCSSRYLL) and the resultant gene fragments were inserted into pcDNA3 between Hind III and Xho I.
Spectral characterization of biosensors.
Wild-type and aY-modified G-GECO1, ZnGreen1, iGluSnFR, SoNar, iNap1, PercevalHR, and iATPSnFR1.1 in pBAD/Myc-His were used to express proteins in E. coli DH10B and purified as C-terminal His6-tagged proteins as previously described.22 Furthermore, the proteins were passed through a HiPrep Sephacryl S-200 HR gel filtration column (GE Healthcare) by using elution buffers (10 mM MOPS, pH 7.2, and 100 mM KCl for G-GECO1 and its aY-modified variant; 150 mM HEPES, pH 7.4, 100 mM NaCl and 0.5 mM TCEP for ZnGreen1 and its aY-modified variant; and 50 mM Tris HCl, pH 7.4, and 100 mM NaCl for other biosensors). The Bradford Assay was used to determine protein concentrations. Sensor proteins were further diluted with their corresponding elution buffers to the final concentrations of ~ 100 nM and then mixed with other desired components for measurement of fluorescence excitation and emission spectra on a monochromator based BioTek Synergy Mx plate reader. To determine extinction coefficients, absorbance was measured on a BioTek Synergy Mx plate reader and corrected for 1 cm light path, and the values for extinction coefficients were then calculated using Beer’s law. To determine quantum yields, fluorescein dissolved in ethanol (φ = 0.79)56 or purified mScarlet-I protein (φ = 0.54)57 was used as the standard. The full emission spectrum of each protein was measured with 1 nm resolution, and intensity values were then added up, normalized to absorbance at the excitation wavelength, and compared with the corresponding references. Spectral characterization of dLight1.2 and iGABASnFR were directly performed with HEK 293T cells. After transfection and sensor expression, ~ 1 million cells were dissociated and thoroughly rinsed with Dulbecco’s Phosphate-Buffered Saline (DPBS). Next, cells were resuspended in 300 μL DPBS and aliquoted into two individual wells of a 96-well microplate with or without supplementing dopamine or GABA. Fluorescence excitation and emission spectra were next determined on a BioTek Synergy Mx plate reader.
Kinetic responses of the selected biosensors.
Fluorescence intensities of purified SoNar, aY-SoNar, iNap1, aY-iNap1, iATPSnFR1.1, and aY-iATPSnFR1.1 proteins were measured by using a CLARIOstar Plus microplate reader (BMG Labtech) equipped with reagent dispensers. The excitation wavelength was set at 480 or 540 nm and the emission wavelength was set at 515 or 605 nm. Each kinetic measurement lasted 300 s and the interval between each reading was 1 s. To SoNar and aY-SoNar, NADH (at a final concentration of 10 μM) was injected at 60 s, and KP372-1 (at a final concentration of 1.5 μM; Echelon Biosciences Research Labs) and NAD(P)H:quinone oxidoreductase 1 (NQO1, at a final concentration of 3 μM; R&D Systems) were injected at 180 s. Similarly, to iNap1 and aY-iNap1, NADPH (at a final concentration of 10 μM) was injected at 60 s, and KP372-1 (at a final concentration of 1.5 μM) and NQO1 (at a final concentration of 3 μM) were injected at 180 s. Prior to measurement, iATPSnFR1.1 and aY-iATPSnFR1.1 were pre-incubated with 1x FastAP Reaction Buffer (Thermo Scientific). ATP (at a final concentration of 500 μM) was injected at 60 s, and 40 units of FastAP Alkaline Phosphatase (Thermo Scientific) was injected at 180 s. Recorded intensity values were corrected for volume changes and related instrument responses by using the sfGFP protein that is expected to unresponsive to all of these chemical and enzymatic treatments.
Culture and transfection of mammalian cell lines.
HEK 293T cells and HeLa cells (purchased from ATCC and tested for mycoplasma by PCR) were cultured in Dulbecco’s Modified Eagle Medium (DMEM) containing 1 g/L glucose and 10% fetal bovine serum (FBS) in a humidified 37°C incubator with 5% CO2. The day before transfection, 2.5x10⁵ cells were used to seed each 35-mm cell culture dish. At the time of transfection, 10 μg of PEI (linear polyethylenimine, 25 kDa, from Polysciences) and a total of 4 μg of corresponding plasmid DNA (pcDNA3 biosensor plasmid: pMAH-aYRS = 1:1, w/w) were mixed in 250 μL of Opti-MEM I Reduced Serum Medium. Complexation lasted for 15 min at room temperature before addition of the mixture to cells with FBS-containing DMEM pre-removed. After additional 3 h of cell incubation at 37°C, the Opti-MEM mixture was replaced with DMEM supplemented with 10% FBS and 2 mM aY. Cell culture media were replaced every 36 h. Fluorescence imaging was typically performed between 48 and 72 h post transfection. Mouse insulinoma MIN6 cells (a gift from Dr. Shuibing Chen at Weill Cornell Medical College; tested for mycoplasma by PCR) were maintained in GlutaMAX-supplemented DMEM containing 4.5 g/L glucose, 10 mM HEPES (pH 7.4), 50 μM 2-mercaptoethanol, and 10% FBS at 37°C. The transfection procedure was similar to that of HEK 293T and HeLa, except for that 6x10⁵ cells were used to seed each 35-mm cell culture dish, and that commercial Lipofectamine 2000 (Thermo Fisher) was used to replace PEI.
Culture and transfection of primary mouse hippocampal neurons.
E18 mouse hippocampus was purchased from BrainBits. Dissociated neurons were cultured with 2 mL of NbActiv4 medium (BrainBits) in 35 mm glass-bottom dishes pre-coated with collagen I (Cat # A1048301, Thermo Fisher). Every two days, half of the cell culture medium was replaced with fresh NbActiv4. Neurons were transfected on day 7 by following BrainBits’s protocol. Briefly, 1 mL of culture media were taken from each 35 mm dish and combined with another 1 mL of fresh NbActiv4. The conditioned medium was incubated at 37°C and 5% CO2. A total of 4 μg of plasmid DNA (G-GECO1 : aY-iGluSnFR : pMAH-aYRS = 1:2:2, w/w/w) and 8 μL of Lipofectamine 2000 (Thermo Fisher) were mixed in 100 μL of BrainBits Transfection Medium and the resultant mixture was incubated at room temperature for 15 min. Next, 1 mL of warm, conditioned NbActiv4 medium was used to replace the medium in each 35 mm dish and the transfection mixture was then added. After 3 h of incubation in at 37°C in a 5% CO2 incubator, the medium was exchanged again to the conditioned medium without transfection mixture but supplemented with 2 mM aY. Half of the aY-containing medium was exchanged every two days. Fluorescence imaging was performed between 48 and 72 h post transfection.
Time-lapse imaging of aY-GECO1, aY-PercevalHR, aY-iATPSnFR, and aY-SoNar in HeLa.
For aY-GECO1, HeLa cells in DPBS (Ca2+- and Mg2+-free) were imaged every 1 s for a duration of 13 min. Stimuli, such as 5 μM histamine, 1 mM CaCl2 with 10 μM ionomycin, and 2 mM EGTA with 5 μM ionomycin, were added sequentially. For aY-PercevalHR or aY-iATPSnFR, HeLa cells in Ca2+- and Mg2+-containing Hank’s Balanced Salt Solution (HBSS) were imaged every 30 s and 10 mM 2-DG was added to induce cellular ATP concentration changes. For aY-SoNar, HeLa cells in Ca2+- and Mg2+-containing DPBS were imaged every 20 s and 1 mM sodium pyruvate was added as the stimulus.
Time-lapse imaging of aY-ZnGreen1 and aY-iNap1 in HEK 293T.
For aY-GECO1, HEK 293T cells in modified Krebs-HEPES-bicarbonate buffer (KHB) containing 140 mM NaCl, 3.6 mM KCl, 0.5 mM NaH2PO4, 0.5 mM MgSO4, 1.5 mM CaCl2, 10 mM HEPES, 2 mM NaHCO3, and 3 mM glucose were imaged every 4 s. ZnCl2 stock was prepared in slightly acidic pure water. TPEN and pyrithione stock solutions were prepared in DMSO. KHB was then used to dilute Zn2+, pyrithione, and TPEN to desired concentrations right before each use. For aY-iNap1, HEK 293T cells in DPBS were imaged every min. 1 mM diamide was used to stimulate NADPH changes.
Imaging of metabolic dynamics of MIN6 cells.
Cells were transiently transfected as aforementioned with desired combinations of plasmids and imaged between 48 and 72 h post transfection. Before imaging, cells were washed thoroughly and left in HBSS (1 g/L glucose) for 1-hour starvation. Images were acquired every min. 20 mM D-glucose was added to stimulate MIN6 cells.
Data and statistical analysis.
Fiji was used to analyze microscopic images. Microsoft Excel, OriginPro, GraphPad Prism, and Affinity Designer were used to analyze data and prepare figures for publication. The Wilcoxon matched-pairs signed rank test was used to determine the P value. No sample was excluded from data analysis, and no blinding was employed. Unless otherwise indicated, data are shown as mean and s.d., and error bars in figures represent s.d.
Data availability.
The gene sequences for MjaYRS and EcaYRS have been deposited to GenBank under the accession numbers MT002434 and MT002433, respectively. The plasmids for pEvol-MjaYRS (Plasmid #153557) and pMAH-EcaYRS (Plasmid #153558) have been deposited to Addgene. Materials, associated protocols, and other supporting data are available from the corresponding author upon request.
Extended Data
Extended Data Figure 1. Fluorescence excitation and emission of aY-modified fluorescence proteins.
Fluorescence excitation (black) and emission (red) profiles of aY-modified cpsGFP (a), mTFP1 (b), cpYFP (c), and Citrine (d).
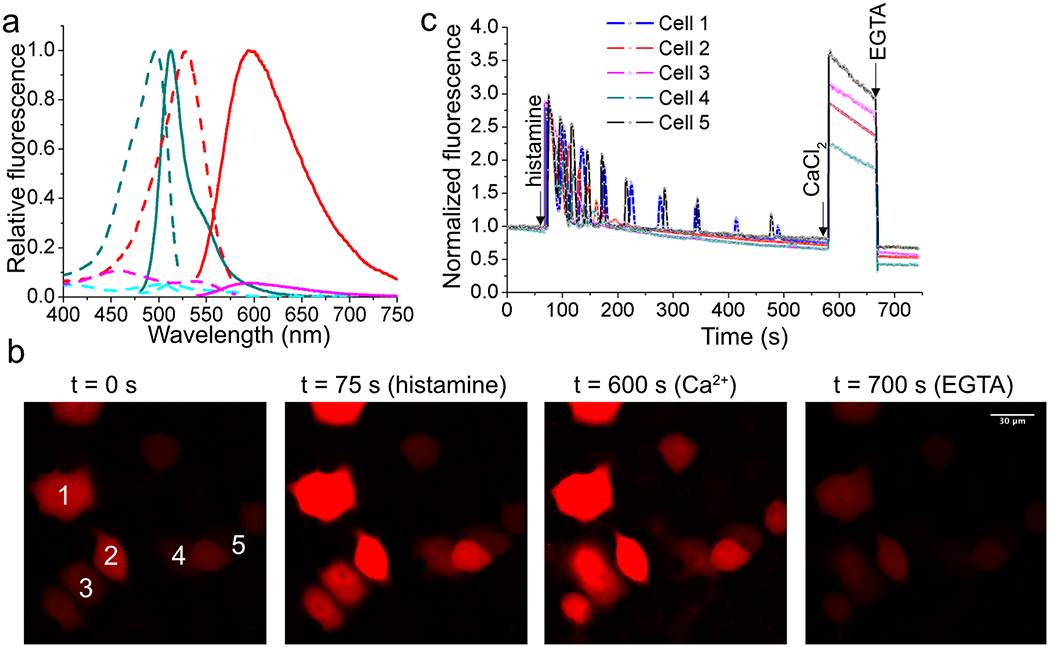
Extended Data Figure 2. Characterization of aY-modified G-GECO1 (Ca2+ sensor).
(a) Fluorescence excitation (dash line) and emission (solid line) profiles for G-GECO1 after addition of 1 mM EGTA (cyan) or 100 μM Ca2+ (dark cyan), and aY-G-GECO1 after addition of 1 mM EGTA (magenta) or 100 μM Ca2+ (red). (b) Representative images of HeLa cells expressing aY-G-GECO1 in response to sequential addition of 5 μM histamine, 1 mM CaCl2 with 10 μM ionomycin, and 2 mM EGTA with 5 μM ionomycin. Scale bar: 30 μm. (c) Quantitative traces for randomly selected five cells in panel b. Intensities are normalized to the values at t = 0 s. The time points for addition of chemicals are shown as arrows. Ca2+ oscillations in response to histamine were observed as expected. These experiments were repeated three times with similar results using independent biological samples.
Extended Data Figure 3. Characterization of aY-modified ZnGreen1 (Zn2+ sensor).
(a) Fluorescence excitation (dash line) and emission (solid line) profiles for ZnGreen1 after addition of 1 mM EDTA (cyan) or 100 μM Zn2+ (dark cyan), and aY- ZnGreen1 after addition of 1 mM EDTA (magenta) or 100 μM Zn2+ (red). (b) Representative images of HEK 293T cells expressing aY-ZnGreen1 in response to sequential addition of 50 μM ZnCl2 with 5 μM pyrithione, and 200 μM TPEN. Scale bar: 20 μm. (c) Quantitative traces for randomly selected six single cells (gray dots) and their average (red line). Intensities are normalized to the values at t = 0 s. The time points for addition of chemicals are shown as arrows. These experiments were repeated three times with similar results using independent biological samples.
Extended Data Figure 4. Characterization of aY-modified iGluSnFR (glutamate sensor).
(a) Fluorescence excitation (dash line) and emission (solid line) profiles for iGluSnFR before (cyan) and after (dark cyan) addition of 100 μM L-glutamate, and aY-iGluSnFR before (magenta) and after (red) addition of 100 μM L-glutamate. (b) Representative images of HEK 293T cells expressing cell-surface-localized aY-iGluSnFR in response to addition of 100 μM L-glutamate. (c) Cultured mouse hippocampal neurons in response to 90 mM KCl (excitatory Tyrode’s saline buffer). Neurons were co-transfected to express cell-surface-localized aY-iGluSnFR (red fluorescence) and a Ca2+ indicator, G-GECO1 (green fluorescence). Quantitative traces for four different regions are presented. Intensities are normalized to the values at t = 0 s. These experiments were repeated three times with similar results using independent biological samples. Scale bar: 20 μm.
Extended Data Figure 5. Characterization of aY-modified iGABASnFR (a,b) and dLight1.2 (c,d) as biosensors for GABA and dopamine, respectively.
(a,c) Fluorescence excitation (dash line) and emission (solid line) profiles for iGABASnFR or dLight1.2 before (cyan) and after (dark cyan) addition of 1 mM GABA or 100 μM dopamine, and aY-iGABASnFR or aY-dLight1.2 before (magenta) and after (red) addition of 1 mM GABA or 100 μM dopamine. (b,d) Representative images of HEK 293T cells expressing surface-localized aY-iGABASnFR (b) or aY-dLight1.2 (d) in response to GABA or dopamine. These experiments were repeated three times with similar results using independent biological samples. Scale bar: 20 μm.
Extended Data Figure 6. Characterization of aY-modified SoNar (NAD+/NADH sensor).
(a) Fluorescence excitation (dash line) and emission (solid line) profiles for SoNar after addition of 20 μM NAD+ (cyan) or NADH (dark cyan), and aY-SoNar after addition of 20 μM NAD+ (magenta) or NADH (red). (b) Representative images of HEK 293T cells expressing aY-SoNar in response to addition of 1 mM pyruvate. Scale bar: 20 μm. (c) Quantitative traces for randomly selected four single cells in panel b. Intensities are normalized to the values at t = 0 s. The time points for addition of chemicals are shown as arrows. These experiments were repeated three times with similar results using independent biological samples.
Extended Data Figure 7. Characterization of aY-modified iNap1 (NADPH sensor).
(a) Fluorescence excitation (dash line) and emission (solid line) profiles for iNap1 before (cyan) and after (dark cyan) addition of 100 μM NADPH, and aY-iNap1 before (magenta) and after (red) addition of 100 μM NADPH. (b) Representative images of HEK 293T cells expressing aY- iNap1 in response to addition of 1 mM diamide. Scale bar: 20 μm. (c) Quantitative traces for randomly selected five single cells (gray dots) and their average (red line). Intensities are normalized to the values at t = 0 s. The time points for addition of chemicals are shown as arrows. These experiments were repeated three times with similar results using independent biological samples.
Extended Data Figure 8. Characterization of aY-modified PercevalHR (ATP sensor).
(a) Fluorescence excitation (dash line) and emission (solid line) profiles for PercevalHR before (cyan) and after (dark cyan) addition of 1 mM ATP, and aY-PercevalHR before (magenta) and after (red) addition of 1 mM ATP. (b) Representative images of HeLa cells expressing aY- PercevalHR in response to 10 mM 2-deoxy-D-glucose (2-DG). Scale bar: 20 μm. (c) Quantitative traces for randomly selected five single cells (gray dots) and their average (red line). Intensities are normalized to the values at t = 0 s. The time points for addition of chemicals are shown as arrows. These experiments were repeated three times with similar results using independent biological samples.
Extended Data Figure 9. Characterization of aY-modified iATPSnFR1.1 (ATP sensor).
(a) Fluorescence excitation (dash line) and emission (solid line) profiles for iATPSnFR1.1 before (cyan) and after (dark cyan) addition of 1 mM ATP, and aY-iATPSnFR1.1 before (magenta) and after (red) addition of 1 mM ATP. (b) Representative images of HeLa cells intracellular expressing aY-iATPSnFR1.1 in response to 10 mM 2-deoxy-D-glucose (2-DG). Scale bar: 20 μm. (c) Quantitative traces for randomly selected eight single cells (gray dots) and their average (red line). Intensities are normalized to the values at t = 0 s. The time points for addition of chemicals are shown as arrows. These experiments were repeated three times with similar results using independent biological samples.
Extended Data Figure 10. Representative dual-color images of MIN6 cells co-expressing SoNar and mitochondrial aY-SoNar.
MIN6 β-cells were sequentially imaged using GFP and RFP channels. Scale bar: 20 μm. This experiment was repeated three times independently with similar results.
Supplementary Material
ACKNOWLEDGEMENTS
We thank R. Campbell, L. Looger, B. Khakh, G. Yellen, and P. Schultz for plasmids, S. Chen for MIN6 cells, and other members of the Ai laboratory for discussion and assistance with experiments. We thank Drs. Wei Ren and Ao Ji for early exploration of this project. Research reported in this publication was supported in part by the University of Virginia and the National Institutes of Health under awards R01GM118675, R01GM129291, U01CA230817, and R01DK122253.
Footnotes
Online Content
Methods and associated references are available in the online version of the paper.
Competing financial interests: The authors declare no competing financial interests.
References
- 1.Rodriguez EA, et al. The Growing and Glowing Toolbox of Fluorescent and Photoactive Proteins. Trends Biochem. Sci. 42, 111–129 (2017). [DOI] [PMC free article] [PubMed] [Google Scholar]
- 2.Greenwald EC, Mehta S, Zhang J. Genetically Encoded Fluorescent Biosensors Illuminate the Spatiotemporal Regulation of Signaling Networks. Chem. Rev 118, 11707–11794 (2018). [DOI] [PMC free article] [PubMed] [Google Scholar]
- 3.Mishin AS, Subach FV, Yampolsky IV, King W, Lukyanov KA, Verkhusha VV. The first mutant of the Aequorea victoria green fluorescent protein that forms a red chromophore. Biochemistry 47, 4666–4673 (2008). [DOI] [PMC free article] [PubMed] [Google Scholar]
- 4.Sawin KE, Nurse P. Photoactivation of green fluorescent protein. Curr. Biol 7, R606–607 (1997). [DOI] [PubMed] [Google Scholar]
- 5.Elowitz MB, Surette MG, Wolf PE, Stock J, Leibler S. Photoactivation turns green fluorescent protein red. Curr. Biol 7, 809–812 (1997). [DOI] [PubMed] [Google Scholar]
- 6.Sattarzadeh A, Saberianfar R, Zipfel WR, Menassa R, Hanson MR. Green to red photoconversion of GFP for protein tracking in vivo. Sci. Rep 5, 11771 (2015). [DOI] [PMC free article] [PubMed] [Google Scholar]
- 7.Ai M, et al. Green-to-Red Photoconversion of GCaMP. PLoS One 10, e0138127 (2015). [DOI] [PMC free article] [PubMed] [Google Scholar]
- 8.Bogdanov AM, et al. Green fluorescent proteins are light-induced electron donors. Nat. Chem. Biol 5, 459–461 (2009). [DOI] [PMC free article] [PubMed] [Google Scholar]
- 9.Saha R, Verma PK, Rakshit S, Saha S, Mayor S, Pal SK. Light driven ultrafast electron transfer in oxidative redding of Green Fluorescent Proteins. Sci. Rep 3, 1580 (2013). [DOI] [PMC free article] [PubMed] [Google Scholar]
- 10.Bae JH, et al. Expansion of the genetic code enables design of a novel “gold” class of green fluorescent proteins. J. Mol. Biol 328, 1071–1081 (2003). [DOI] [PubMed] [Google Scholar]
- 11.Liu CC, Schultz PG. Adding new chemistries to the genetic code. Annu. Rev. Biochem 79, 413–444 (2010). [DOI] [PubMed] [Google Scholar]
- 12.Wang L, Xie J, Deniz AA, Schultz PG. Unnatural amino acid mutagenesis of green fluorescent protein. J. Org. Chem 68, 174–176 (2003). [DOI] [PubMed] [Google Scholar]
- 13.Wang L, et al. Significant expansion and red-shifting of fluorescent protein chromophore determined through computational design and genetic code expansion. Biophys. Rep 4, 273–285 (2018). [DOI] [PMC free article] [PubMed] [Google Scholar]
- 14.Villa JK, et al. Fluorescence Modulation of Green Fluorescent Protein Using Fluorinated Unnatural Amino Acids. Molecules 22, 1194 (2017). [DOI] [PMC free article] [PubMed] [Google Scholar]
- 15.Fu C, et al. Genetically Encoding Quinoline Reverses Chromophore Charge and Enables Fluorescent Protein Brightening in Acidic Vesicles. J. Am. Chem. Soc 140, 11058–11066 (2018). [DOI] [PMC free article] [PubMed] [Google Scholar]
- 16.Groff D, Wang F, Jockusch S, Turro NJ, Schultz PG. A new strategy to photoactivate green fluorescent protein. Angew. Chem. Int. Ed. Engl 49, 7677–7679 (2010). [DOI] [PMC free article] [PubMed] [Google Scholar]
- 17.Reddington SC, Rizkallah PJ, Watson PD, Pearson R, Tippmann EM, Jones DD. Different photochemical events of a genetically encoded phenyl azide define and modulate GFP fluorescence. Angew. Chem. Int. Ed. Engl 52, 5974–5977 (2013). [DOI] [PubMed] [Google Scholar]
- 18.Reddington SC, Baldwin AJ, Thompson R, Brancale A, Tippmann EM, Jones DD. Directed evolution of GFP with non-natural amino acids identifies residues for augmenting and photoswitching fluorescence. Chem. Sci 6, 1159–1166 (2015). [DOI] [PMC free article] [PubMed] [Google Scholar]
- 19.Wang F, Niu W, Guo J, Schultz PG. Unnatural amino acid mutagenesis of fluorescent proteins. Angew. Chem. Int. Ed. Engl 51, 10132–10135 (2012). [DOI] [PubMed] [Google Scholar]
- 20.Liu X, et al. Significant expansion of the fluorescent protein chromophore through the genetic incorporation of a metal-chelating unnatural amino acid. Angew. Chem. Int. Ed. Engl 52, 4805–4809 (2013). [DOI] [PubMed] [Google Scholar]
- 21.Ayyadurai N, et al. Development of a selective, sensitive, and reversible biosensor by the genetic incorporation of a metal-binding site into green fluorescent protein. Angew. Chem. Int. Ed. Engl 50, 6534–6537 (2011). [DOI] [PubMed] [Google Scholar]
- 22.Chen ZJ, Ren W, Wright QE, Ai HW. Genetically encoded fluorescent probe for the selective detection of peroxynitrite. J. Am. Chem. Soc 135, 14940–14943 (2013). [DOI] [PubMed] [Google Scholar]
- 23.Chen S, Chen ZJ, Ren W, Ai HW. Reaction-based genetically encoded fluorescent hydrogen sulfide sensors. J. Am. Chem. Soc 134, 9589–9592 (2012). [DOI] [PubMed] [Google Scholar]
- 24.Seyedsayamdost MR, Xie J, Chan CT, Schultz PG, Stubbe J. Site-specific insertion of 3-aminotyrosine into subunit alpha2 of E. coli ribonucleotide reductase: direct evidence for involvement of Y730 and Y731 in radical propagation. J. Am. Chem. Soc 129, 15060–15071 (2007). [DOI] [PubMed] [Google Scholar]
- 25.Sakamoto K, et al. Genetic encoding of 3-iodo-L-tyrosine in Escherichia coli for single-wavelength anomalous dispersion phasing in protein crystallography. Structure 17, 335–344 (2009). [DOI] [PubMed] [Google Scholar]
- 26.Ren W, Truong TM, Ai HW. Study of the Binding Energies between Unnatural Amino Acids and Engineered Orthogonal Tyrosyl-tRNA Synthetases. Sci. Rep 5, 12632 (2015). [DOI] [PMC free article] [PubMed] [Google Scholar]
- 27.Pedelacq JD, Cabantous S, Tran T, Terwilliger TC, Waldo GS. Engineering and characterization of a superfolder green fluorescent protein. Nat. Biotechnol 24, 79–88 (2006). [DOI] [PubMed] [Google Scholar]
- 28.Takimoto JK, Adams KL, Xiang Z, Wang L. Improving orthogonal tRNA-synthetase recognition for efficient unnatural amino acid incorporation and application in mammalian cells. Mol. BioSyst 5, 931–934 (2009). [DOI] [PubMed] [Google Scholar]
- 29.Oki K, Sakamoto K, Kobayashi T, Sasaki HM, Yokoyama S. Transplantation of a tyrosine editing domain into a tyrosyl-tRNA synthetase variant enhances its specificity for a tyrosine analog. Proc. Natl. Acad. Sci. U. S. A 105, 13298–13303 (2008). [DOI] [PMC free article] [PubMed] [Google Scholar]
- 30.Gross LA, Baird GS, Hoffman RC, Baldridge KK, Tsien RY. The structure of the chromophore within DsRed, a red fluorescent protein from coral. Proc. Natl. Acad. Sci. U. S. A 97, 11990–11995 (2000). [DOI] [PMC free article] [PubMed] [Google Scholar]
- 31.Ai HW, Henderson JN, Remington SJ, Campbell RE. Directed evolution of a monomeric, bright and photostable version of Clavularia cyan fluorescent protein: structural characterization and applications in fluorescence imaging. Biochem. J 400, 531–540 (2006). [DOI] [PMC free article] [PubMed] [Google Scholar]
- 32.Griesbeck O, Baird GS, Campbell RE, Zacharias DA, Tsien RY. Reducing the environmental sensitivity of yellow fluorescent protein. Mechanism and applications. J. Biol. Chem 276, 29188–29194 (2001). [DOI] [PubMed] [Google Scholar]
- 33.Chen ZJ, Ai HW. A Highly Responsive and Selective Fluorescent Probe for Imaging Physiological Hydrogen Sulfide. Biochemistry 53, 5966–5974 (2014). [DOI] [PubMed] [Google Scholar]
- 34.Zhao Y, et al. An expanded palette of genetically encoded Ca2+ indicators. Science 333, 1888–1891 (2011). [DOI] [PMC free article] [PubMed] [Google Scholar]
- 35.Chen Z, Ai HW. Single Fluorescent Protein-Based Indicators for Zinc Ion (Zn2+). Anal. Chem 88, 9029–9036 (2016). [DOI] [PMC free article] [PubMed] [Google Scholar]
- 36.Marvin JS, et al. An optimized fluorescent probe for visualizing glutamate neurotransmission. Nat. Methods 10, 162–170 (2013). [DOI] [PMC free article] [PubMed] [Google Scholar]
- 37.Marvin JS, et al. A genetically encoded fluorescent sensor for in vivo imaging of GABA. Nat. Methods 16, 763–770 (2019). [DOI] [PubMed] [Google Scholar]
- 38.Patriarchi T, et al. Ultrafast neuronal imaging of dopamine dynamics with designed genetically encoded sensors. Science 360, eaat4422 (2018). [DOI] [PMC free article] [PubMed] [Google Scholar]
- 39.Zhao Y, et al. SoNar, a Highly Responsive NAD+/NADH Sensor, Allows High-Throughput Metabolic Screening of Anti-tumor Agents. Cell Metab. 21, 777–789 (2015). [DOI] [PMC free article] [PubMed] [Google Scholar]
- 40.Tao R, et al. Genetically encoded fluorescent sensors reveal dynamic regulation of NADPH metabolism. Nat. Methods 14, 720–728 (2017). [DOI] [PMC free article] [PubMed] [Google Scholar]
- 41.Tantama M, Martinez-Francois JR, Mongeon R, Yellen G. Imaging energy status in live cells with a fluorescent biosensor of the intracellular ATP-to-ADP ratio. Nat. Commun 4, 2550 (2013).24096541 [Google Scholar]
- 42.Lobas MA, et al. A genetically encoded single-wavelength sensor for imaging cytosolic and cell surface ATP. Nat. Commun 10, 711 (2019). [DOI] [PMC free article] [PubMed] [Google Scholar]
- 43.Fridlyand LE, Philipson LH. Glucose sensing in the pancreatic beta cell: a computational systems analysis. Theor. Biol. Med. Model 7, 15 (2010). [DOI] [PMC free article] [PubMed] [Google Scholar]
- 44.Brown W, Liu J, Deiters A. Genetic Code Expansion in Animals. ACS Chem. Biol. 13, 2375–2386 (2018). [DOI] [PMC free article] [PubMed] [Google Scholar]
- 45.Ernst RJ, et al. Genetic code expansion in the mouse brain. Nat. Chem. Biol 12, 776–778 (2016). [DOI] [PMC free article] [PubMed] [Google Scholar]
- 46.Wang L Engineering the Genetic Code in Cells and Animals: Biological Considerations and Impacts. Acc. Chem. Res 50, 2767–2775 (2017). [DOI] [PMC free article] [PubMed] [Google Scholar]
- 47.Korosak D, Slak Rupnik M. Collective Sensing of beta-Cells Generates the Metabolic Code. Front. Physiol 9, 31 (2018). [DOI] [PMC free article] [PubMed] [Google Scholar]
- 48.Gray JP, Alavian KN, Jonas EA, Heart EA. NAD kinase regulates the size of the NADPH pool and insulin secretion in pancreatic beta-cells. Am. J. Physiol. Endocrinol. Metab 303, E191–199 (2012). [DOI] [PMC free article] [PubMed] [Google Scholar]
- 49.Plecitá-Hlavatá L, et al. Glucose-Stimulated Insulin Secretion Fundamentally Requires H(2)O(2) Signaling by NADPH Oxidase 4. Diabetes 69, 1341–1354 (2020). [DOI] [PubMed] [Google Scholar]
- 50.Dan Dunn J, Alvarez LA, Zhang X, Soldati T. Reactive oxygen species and mitochondria: A nexus of cellular homeostasis. Redox Biol.6, 472–485 (2015). [DOI] [PMC free article] [PubMed] [Google Scholar]
- 51.Trott O, Olson AJ. AutoDock Vina: improving the speed and accuracy of docking with a new scoring function, efficient optimization, and multithreading. J. Comput. Chem 31, 455–461 (2010). [DOI] [PMC free article] [PubMed] [Google Scholar]
- 52.Young TS, Ahmad I, Yin JA, Schultz PG. An enhanced system for unnatural amino acid mutagenesis in E. coli. J. Mol. Biol 395, 361–374 (2010). [DOI] [PubMed] [Google Scholar]
- 53.Zhang Z, Marshall AG. A universal algorithm for fast and automated charge state deconvolution of electrospray mass-to-charge ratio spectra. J. Am. Soc. Mass Spectrom. 9, 225–233 (1998). [DOI] [PubMed] [Google Scholar]
- 54.Kobayashi T, et al. Structural basis of nonnatural amino acid recognition by an engineered aminoacyl-tRNA synthetase for genetic code expansion. Proc. Natl. Acad. Sci. U. S. A 102, 1366–1371 (2005). [DOI] [PMC free article] [PubMed] [Google Scholar]
- 55.Chatterjee A, Xiao H, Bollong M, Ai HW, Schultz PG. Efficient viral delivery system for unnatural amino acid mutagenesis in mammalian cells. Proc. Natl. Acad. Sci. U. S. A 110, 11803–11808 (2013). [DOI] [PMC free article] [PubMed] [Google Scholar]
- 56.Kellogg RE, Bennett RG. Radiationless Intermolecular Energy Transfer. III. Determination of Phosphorescence Efficiencies. J. Chem. Phys 41, 3042–3045 (1964). [Google Scholar]
- 57.Bindels DS, et al. mScarlet: a bright monomeric red fluorescent protein for cellular imaging. Nat. Methods 14, 53–56 (2017). [DOI] [PubMed] [Google Scholar]
Associated Data
This section collects any data citations, data availability statements, or supplementary materials included in this article.
Supplementary Materials
Data Availability Statement
The gene sequences for MjaYRS and EcaYRS have been deposited to GenBank under the accession numbers MT002434 and MT002433, respectively. The plasmids for pEvol-MjaYRS (Plasmid #153557) and pMAH-EcaYRS (Plasmid #153558) have been deposited to Addgene. Materials, associated protocols, and other supporting data are available from the corresponding author upon request.


