

Abstract
Adherence monitoring is a vital component of clinical efficacy trials, as the regularity of medication consumption affects both efficacy and adverse effect profiles. Pill-counts don’t confirm consumption, and invasive plasma assessments can only assist post-hoc assessments. We previously reported on the pharmacokinetics of a potential adherence marker to non-invasively monitor dosage consumption during a trial without breaking a blind. We reported that consumption cessation of subtherapeutic 15 mg acetazolamide (ACZ) doses showed a predictable urinary excretion decay that was quantifiable for an extended period. The current study describes the clinical implementation of 15mg ACZ doses as an adherence marker excipient in distinct cohorts taking ACZ for different “adherence” durations. We confirm that ACZ output did not change (accumulate) during 18-20 days of adherence, and developed and assessed urinary cutoffs as nonadherence indicators. We demonstrate that while an absolute concetration cutoff (989 ng/mL) lacked sensitivity, a creatinine normalized equivalent (1376 ACZ ng / mg) was highly accurate at detecting nonadherence. We also demonstrate that during nonadherent phases of three trials, creatinine-normalized urinary ACZ elimination was reproducible within and across trials with low variablity. Excretion was 1st order, with a decay half-life averaging ~2.0 days. Further, excretion remained quantifiable for 14 days, providing a long period during which the date of last consumption might be determined. We conclude that inclusion of 15 mg ACZ as a dosage form adherence marker excipient, provides a reliable and sensitive mechanism to confirm medication consumption and detect nonadherence during clinical efficacy trials.
Keywords: Acetazolamide, Adherence monitoring, Compliance monitoring, Clinical trials, Ingestible monitor, Consumption verification
Introduction
Medication adherence is a vital component of successful pharmacotherapeutic trials (1), but actual medication consumption can be difficult to confirm. Some trials rely on plasma drug concentration assessment, a technique that is invasive, difficult to use to monitor placebo arms and only useful post-hoc, as it reveals the participant’s randomization group. Riboflavin has been used as a non-invasive urinary tracer excipient that can be used in active and placebo arms. However, riboflavin is rapidly eliminated (T1/2 ~2h) (2) and can only reliably confirm adherence for 8-12h after consumption (3). In 2016 we reported on subtherapeutic (15 mg) acetazolamide (ACZ) doses as a promising non-invasive adherence marker (4). We used ACZ because it is completely excreted in urine (5), has been FDA-approved since 1953 and is not physiologically present. It is typically used in doses of 250 and 500 mg twice daily, although in elderly populations it is used to treat congestive heart failure at doses of 125-250 mg/day (6). In both pregnant women and pediatric intracranial hypertensive populations, ACZ is used in doses exceeding 2000 mg/day to treat intracranial hypertension (7, 8). We chose to test ACZ at 15mg q.d., a highly subtherapeutic dose which yields plasma concentrations that are easily detectable using standard analytical methods. The previous (UKY) study demonstrated the plasma and urinary pharmacokinetics of subtherapeutic ACZ doses had high inter-subject reproducibility (4) and was unaffected by a concomitant medication (oxycodone). Urinary ACZ output remained quantifiable during the washout phase for longer than a week, a phenomenon we showed involved erythrocyte sequestration, a compartment from which ACZ was eliminated with a T1/2 of ~50 h.
The current report uses two trial designs to further evaluate ACZ as a medication adherence tracer in cohorts that differ from each other and from the earlier UKY study. The first trial used a residential design with 4-days of “adherence” (days-4 to −1) to a 15mg daily ACZ regimen followed by 6 days in which no ACZ was administered (days 0-5). Days 1–5 were considered the “nonadherence phase”. The second study was a “real world” outpatient test, which assessed the stability of ACZ urinary output levels over 18-days of “adherence” and subsequently monitored urinary concentration decay over 14 days of “nonadherence”.
In the earlier UKY study (4) we controlled for variable rates of urine production by expressing output rates as ug/h. However, this technique requires knowledge of urine volumes and times between voids, restricting its utility in clinical trials. The new studies examine the use of urinary creatinine (Cr) as a normalization technique, an approach more applicable to clinical trial “spot-sampling”. Creatinine is a muscle metabolite that is excreted at a regular rate (9) and so can be used to control for variable urine production rates (10). We evaluated the efficacy of Cr-normalization by comparing regression curve fits when urinary concentration decay rates are calculated as absolute ACZ concentrations (ng/mL) or as ng ACZ / mg Cr. The inclusion of absolute concentration data also allowed us to compare reproducibility between the new trials and the UKY study, in which Cr was not measured. This study reports the reproducibility of ACZ elimination in three distinct cohorts, with different concomitant “test medications” and after different periods of adherence/exposure. Additionally, this report uses adherence phase data to define normalized and absolute concentration cutoffs to identify nonadherence specimens. The performance of the cutoffs is tested using logistic regression models. The study results demonstrate ACZ can accurately identify nonadherence within 1-3 days of consumption cessation and that the date of last consumption can be estimated for at least 14 days.
METHODS
Study Overview
The data in this report were collected in two trials conducted at the National Institute on Drug Abuse (NIDA) Intramural Research Program, in Baltimore, MD and at the Michael E. DeBakey Veterans Affairs Medical Center (VAMC) College of Medicine, in Houston TX. Unpublished data from a previously published study conducted at UKY (4) are also included in some analyses.
NIDA
This residential study was conducted under Investigational Drug Application (IND) #117902 with the Food and Drug Administration (FDA), and was conducted in accordance with the ethical standards of the NIH Addictions Institutional Review Board, which approved the protocol. Each participant gave written informed consent. The study examined the interaction between cocaine and ACZ or cocaine and quinine. Data on cocaine pharmacokinetics were published elsewhere (11), only ACZ data are presented here. Full study details are available at clinicaltrials.gov under NCT 01851473, but an overview is also graphically represented in Fig. S1A and details relevant to the current report are as follows. Single 25 mg intravenous cocaine doses were administered at 9 am on days −5, −1, and 4. During the mornings of the “adherence phase” (days −4 to −1), participants (n=10) received a 15 mg ACZ oral dose. No ACZ was given on days 0-5 (“nonadherence phase), although 75mg of quinine was given on days 1-4 as part of a concurrent study. Participants collected urine voids from days-5 to +5 in polypropylene bottles labeled with their name and the date/time. Specimens were stored in a refrigerator until research staff combined specimens in 3h time bins (plus one overnight specimen and an early morning specimen) and stored aliquots at −20°C.
VAMC:
Urinary ACZ concentrations were assessed as part of a study investigating doxazosin and modafinil effects on cocaine self-administration (IND 106280). The protocol was approved by and conducted in accordance with the ethical standards of the Baylor College of Medicine Institutional Review Board, which is organized and operates according to the United States Office for Human Research Protections regulations (45 CFR 46). Full study details can be found at ClinicalTrials.gov (NCT 02538744A), and an overview is graphically represented in Fig. S1B. Additionally all ACZ-related details follow. During the “adherence phase” (days −18 to-1), outpatient participants (n=10) were prescribed 15 mg ACZ q.d. and were randomized to placebo or 8 mg/day doxazosin. An ad libitum urine specimen was collected for quantification of ACZ and creatinine, 10 (8-12); (median (range)) specimens. On days −3 to −1 participants also took either 0, 200, or 400 mg modafinil, and during inpatient days −1 and 0, participants received IV doses of cocaine (0, 20 and 40 mg). During the “nonadherence” phase, (days 0-14) participants continued to receive doxazosin/placebo provided 14 (9-14) urine specimens while cycling through all three of the modafinil doses. Participants attended 12 (9-13) clinic visits, 4.5 (2-5) during the adherence phase. Urine specimens collected between visits were kept frozen at participants’ homes in pre-labelled polypropylene bottles. Upon return to the clinic samples were stored at −20°C.
UKY:
This study, conducted under IND 69,214, was approved by the University of Kentucky (UKY) Institutional Review Board. It was conducted in accordance with the Helsinki guidelines for ethical research and there is no associated NCT number. The protocol, described in detail elsewhere (4, 12) and is graphically represented in Fig. S1C. It was similar to the NIDA study protocol (n=10), except it examined interactions between oxycodone and ACZ or oxycodone and quinine. Only the ACZ data are presented here. Urine samples representing the ACZ study were collected between day −4 to day 2 (n=4) and day −4 to 6 (n=6).
Inclusion and Exclusion Criteria
All participants were English-speaking, non-treatment-seeking healthy volunteers with a self-reported history of cocaine (NIDA/VAMC) or opioid (UKY) use and a urine drug screen positive for cocaine/opioids within 30 days (VAMC/UKY, respectively) or 60 days (NIDA) prior to enrollment. Participants were aged between 18-50 years (NIDA/UKY) or 18-59 years (VAMC). Baseline examination demonstrated no cardiovascular abnormalities (i.e. high or low blood pressure or heart rate, abnormal ECG). A medical history and brief physical examination were conducted to identify clinically significant exclusionary contraindications. Women with reproductive potential were using a medically acceptable form of contraception during the study. For further inclusion and exclusion criteria see NCT01851473, NCT02538744, or (4, 12) for the NIDA, VAMC or UKY studies, respectively.
Dosage Form Preparation
Drug doses were prepared by the NIDA / VAMC / UKY pharmacies. Tablets of ACZ (125 mg, Taro Pharmaceutical Industries, Hawthorne, NY) were crushed and an equivalent of 15 mg ACZ together with lactose monohydrate powder loose-filled size 00 gelatin capsules. We previously confirmed that the lactose excipient does not affect ACZ’s dissolution profile (4).
Urine Sample Preparation and Analytical Methods
Deuterated ACZ internal standard (IS, 250 μL) was added to 50 μl of urine, which were vortex-mixed, separated by centrifugation and transferred to autosampler vials. Fifteen to 30 μL of each sample was injected onto an LCMS/MS and separated over a 5 μm, 4.6 × 100 mm C18 column at room temperature, using an isocratic mobile phase, consisting of 15 MeOH : 85 H2O : 0.05 HCOOH, 2.5mM NH4HCOO− at a flow rate of 1 mL/min. Analytes were quantified by selective-ion monitoring, under positive ionization by atmospheric pressure chemical ionization (APCI) and multiple reaction monitoring (MRM) modes. The detected m/z ratios for ACZ and its internal standard (IS) were 223 – 181 and 227 – 183 respectively. The standard curve range for ACZ was 50-20000 ng/mL with an LLOQ of 50 ng/mL.
Pharmacokinetic Analyses
Each NIDA participant’s data were individually subject to pharmacokinetic analyses using Phoenix WinNonlin (Pharsight, Certara). Individually optimized parameters and 1/Y2 weighting were used to maximize the fit between observed data and values predicted by one- and two-compartment models. Data for 2 compartment models are reported as mean values of the individual fits (± 95% confidence intervals).
Comparing the Beta Elimination T1/2 During the Nonadherence Phases of Different Studies
Data reproducibility across studies was assessed by subjecting the pooled participant data sets from the nonadherence phases (day 1 onwards) of each trial to nonlinear regression analysis (1/Y2 weighting, automatic outlier detection and a ROUT Coefficient Q of 1%; Graphpad Prism). Nonadherence phases of the NIDA and UKY studies were of insufficient duration to estimate plateau values, and so plateau values were derived by analyzing the respective data sets combined with the VAMC data.
Examining Changes in Urine Concentrations over the Adherence Phase of VAMC Trial
Changes in urinary ACZ over the VAMC adherence phase were examined using a linear regression analysis (Graphpad Prism).
Establishment and Validation of Nonadherence Cutoffs
The 5th percentile lowest observations from the pooled adherence phases of the Cr-normalized (NIDA/VAMC) and absolute concentration (NIDA/VAMC/UKY) data sets were evaluated as cutoffs to indicate nonadherence, which was defined as > 1 full day of abstinence (i.e. 2 days since last dose). Random intercept, repeated-measures logistic regression (also known as generalized linear mixed) models fit with “R” (ver. 3.61), were used to predict the likelihood of non-adherence, given a urinary concentration below the defined cutoff. The models were trained on Cr-normalized or absolute concentration NIDA data sets and were tested with the respective VAMC, or combined VAMC / UKY data sets. Model performance was evaluated on overall accuracy, sensitivity, specificity, area under the receiver operating characteristics (ROC) curve, and the positive and negative predictive values.
Excluded Data
One VAMC participant (CH12) was excluded due to noncompliance with study procedures, and one NIDA record was excluded due to a lab error. Records from specimens collected between 0-6h of the first ACZ dose were not considered representative of adherence. For purposes of assessing the adherence phase (i.e. line fit and cutoff generation and testing), the VAMC participant AB12 was excluded due to self-reported intermittent adherence.
Results
Demographics
The participants’ ages are presented as median (range). In the NIDA study, 9/10 participants were male, age 43y (35-50y). Five of ten participants were African American (AA), 4/10 White (W), 1/10 was multiracial. All VAMC participants were male, 9/10 AA, 1/10 W, age 54y (45-57y). In the UKY study, 8/10 participants were male, 9/10 W, 1/10 AA, age 30y (27-40y).
Compartmental Pharmacokinetic Nonlinear Regression Analyses of NIDA trial data
Data from urine specimens collected throughout the NIDA trial are shown in Figs. 1A (Cr-normalized data; ng/mg) and 1B (absolute concentration data; ng/mL). Data representing each participant’s samples collected after administration of the final ACZ dose, were individually subjected to one- and two-compartment model analyses. Diagnostic Akaike Information Criteria from these analyses all favored a 2-compartment model (13). The mean predicted regression curve of these 2 compartment fits (± 95%CI) are shown superimposed on Figs. 1A and 1B, and the mean half-life parameters are shown inset. Absolute concentrations decayed reliably over time, although Cr-normalization considerably reduced errors in ACZ output assessment, thereby improving the fit and narrowing beta T1/2 confidence intervals.
Figure 1. NIDA trial Creatinine-normalized and Absolute Urinary Acetazolamide Concentration Data.
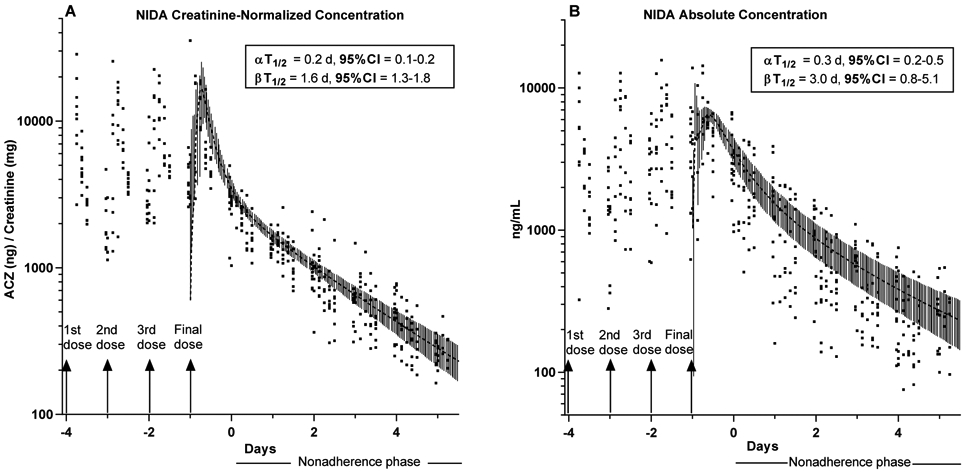
Creatinine normalized (Panel A) and absolute concentration (Panel B) acetazolamide (ACZ) values for all participants in the NIDA trial (n=10). 15 mg ACZ/day was administered on Days −4 to −1. No drug administered during the nonadherence phase.
Grey Overlay curves: represent the mean best fit predicted curves from two-compartmental pharmacokinetic analysis of each individual’s data collected after dose administration on day −1 (4th dose day) ± 95% CI.
Insets: Mean half-lives ± 95%CI calculated from output of two-compartmental pharmacokinetic analysis of each individual’s data collected after final dose administration on Day −1.
Linear and Nonlinear Regression Analysis of the VAMC Study Data
Values representing once-daily urine samples in the VAMC cohort are shown in Figure 2a (Cr-normalized data) and Figure 2b (ng/mL). During the adherence phase, participants provided 4 (1-5) urine specimens during clinical visits and collected 6 (4-9) samples at home between visits. Because of the daily sampling used in this outpatient study, calculations were conducted for the entire cohort, rather than for individuals. Linear regression of the adherence phase showed no significant slope for either Cr-normalized (slope = 63(−42 - 167) ng/mg/day; R2=0.016) or absolute concentration data (slope = 96(−62 - 255) ng/mL/day; R2=0.016), indicating that there was no accumulation of ACZ over 18 days of dosing. Single exponent regression curves representing days 1-14 are shown overlaying the data with the fit results shown inset. As with the NIDA trial, Cr-normalization reduced data scatter compared with absolute concentration (R2=0.71 vs 0.5), although curve fits were good for both datasets considering the outpatient and once daily sampling protocol used. The absolute and Cr-normalized decay T1/2’s were similar to each other, although slightly longer than seen in the NIDA trial, clearly demonstrating the reproducibility of ACZ elimination in different cohorts.
Figure 2: VAMC Creatinine-normalized and Absolute Urinary Acetazolamide Concentration data sets.
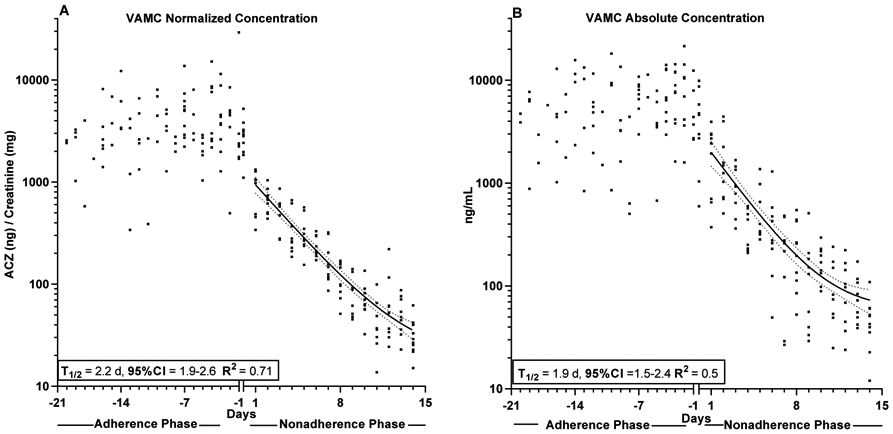
Creatinine normalized (Panel A) and absolute concentration (Panel) acetazolamide (ACZ) values for all participants in the VAMC trial (n=10). Participants received 15mg ACZ/day during the adherence phase and no ACZ during the nonadherence phase
Curve through Nonadherence phase: Non-linear regression analysis (bold line) ± 95%CI (dotted lines) of all pooled participant data based on samples collected after final dose administration on Day −1.
Insets: Mean half-lives ± 95%CI calculated by of pooled participant data (day 1 to day 14) based on samples collected after final dose administration on Day −1.
Comparison of Decay Rates in each Trial
The whole cohort single exponent regression analysis technique used on the VAMC data was applied to the NIDA, UKY (absolute concentration) and combined trials datasets to allow comparison between trials and compare ACZ decay rate reproducibility. The results in Table 1 demonstrate the reproducibility of ACZ concentration decay upon dosing cessation in cohorts with different demographical characteristics and concomitant medications (cocaine, quinine, oxycodone, doxazosin, modafinil). The datasets are also shown overlaid in Fig. 3 to demonstrate that in addition to a similar decay rate, the urine values were similar across cohorts during both adherent and nonadherent phases.
Table 1:
Results of single exponent non-linear regression of pooled participant acetazolamide values from the nonadherence phases of indicated trials.
| Creatinine-Normalized Values | |||||
|---|---|---|---|---|---|
| Beta T1/2 | 95% CI | Plateau | R2 | n | |
| NIDA | 1.6 | 1.5-1.8 | 29* | 0.77 | 10 |
| VAMC | 2.2 | 1.9-2.6 | 19 | 0.71 | 10 |
| NIDA+VAMC | 1.8 | 1.7-2.0 | 29 | 0.83 | 20 |
| Absolute Concentration | |||||
| NIDA | 1.4 | 1.2-1.7 | 112* | 0.35 | 10 |
| VAMC | 1.9 | 1.5-2.4 | 58 | 0.5 | 10 |
| UKY | 1.2 | 0.9-1.7 | 152# | 0.48 | 10 |
| NIDA+VAMC+ UKY | 1.5 | 1.3-1.9 | 112 | 0.47 | 30 |
NIDA and UKY trials did not extend far enough to accurately calculate plateau values, so values derived from the combined NIDA/ VAMC* or UKY/VAMC data# sets were used.
Figure 3: Normalized and Absolute Concentration Values for all Trials Overlaid.
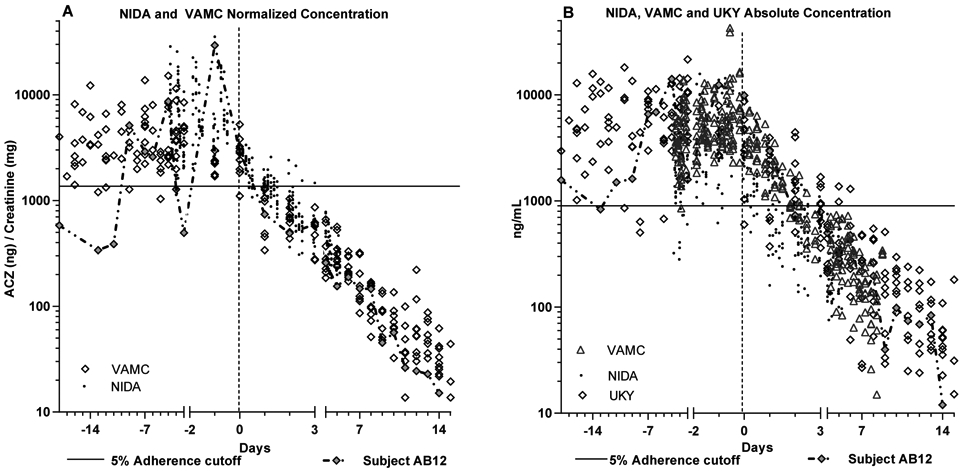
All participant acetazolamide (ACZ) data from different trials are overlaid to demonstrate reproducibility different populations.
A: Creatinine-normalized ACZ data from the NIDA and VAMC trials
B: Absolute concentration data from the NIDA, VAMC and UKY trials
Solid horizontal line: denotes 5% cutoff used in statistical analyses. Dotted line marks day 0 (1st day with no dose) Final two “adherence” days and “nonadherence” days 0-3 are expanded for ease of viewing.
Subject AB12 data shown as chained filled diamonds, to illustrate intermittent adherence.
Nonadherence Cutoff Testing Results
In each of the Cr-normalized and absolute concentration datasets, the lowest 5th percentile of the observed values during the adherence phases were tested as cutoffs for nonadherence detection. The Cr-normalized cutoff (1376 ng/mg) was based on 231 records from the NIDA and VAMC trials, while the absolute concentration cutoff was based on the adherence phase records from the NIDA, VAMC and UKY trial data (989 ng/mL; 380 records). These cutoffs are shown superimposed on Figs. 3A and 3B respectively. The data from VAMC participant AB12 are highlighted in Fig. 3 as filled diamonds connected by a chain, as this participant reported intermittent adherence. Consequently, AB12’s adherence phase values were not considered when developing or testing cutoffs.
Classification Accuracy of Adherence/Nonadherence
The accuracy of each cutoff in detecting nonadherence was assessed using logistic regression models trained on the NIDA datasets and tested with all other available data. The NIDA Cr-normalized and absolute concentration training sets each contained 142 adherence observations (days −4 to-1), and 119 nonadherence observations (days 1-3). Because prediction success becomes easier as time elapses, nonadherence data after day 3 were not considered. The VAMC Cr-normalized test set contained 89 adherence phase records (days −20- to −1) and 28 nonadherence phase records. The absolute concentration test set comprised of VAMC+UKY records (to optimize performance) contained 238 adherence phase and 85 nonadherence phase records.
The cutoff performance is shown in Table 2. The main parameters are discussed below, but due to the complexity of the concepts, graphical illustrations are provided in Fig. 4. Overall accuracy for both cutoffs was very good; the Cr-cutoff was 96% accurate (tested with VAMC data), and the absolute concentration (tested with combined VAMC & UKY data) was 86% accurate. The absolute concentration parameters were strengthened by inclusion of the UKY records as the accuracy of the VAMC data alone was only 80%. In this test, sensitivity or “percentage of successfully detected nonadherence instances” (Fig. 4A) is the most informative parameter, as the others are influenced by the study design to different degrees. The sensitivity of the absolute concentration cutoff based on two data sets was only 56%, while the Cr-normalized cutoff identified 100% of nonadherence records. The difference was due to data variance inherent in absolute concentration measurement, which obscured the rate of decline on nonadherent days 1-3 (compare upper right quadrants of Figs, 3A and 3B). The specificity, or “percentage of adherent instances not falsely indicated as nonadherent” (Fig. 4B) is uninformative in this test, as it essentially represents the inverse of the 5% adherent defined cutoff (except specificity was calculated from the test set, and the cutoff was calculated from combined test and training sets). The positive predictive value (PPV) or the “trustworthiness of instances classified as nonadherent” (Fig. 4D) was very good for both cutoffs, but in fact slightly underestimated true performance, because the cutoffs were based on the lowest 5% of adherent records, and there were more adherent than nonadherent records in the test sets. Inversely, the Negative Predictive Value (NPV, Fig. 4C) i.e. the trustworthiness of instances correctly not classified as nonadherent, was 100% for the Cr-ratio, but is likely slightly lower due to the imbalance between adherent and nonadherent record counts.
Table 2:
Metrics describing performance of adherence phase cutoffs in logistic regression models when used to predict whether observations represent more than one full day of non-adherence (i.e, day zero not included).
| Creatinine Normalized (ng/mg) |
Absolute Concentration (ng/mL) |
|
|---|---|---|
| VAMC 5th Percentile Cutoff=1376 |
VAMC+UKY 5th Percentile Cutoff=989 |
|
| Overall Accuracy | 96% (90% - 99%) | 87% (82% - 90%) |
| Sensitivity | 100% (88% - 100%) | 56% (45% - 67%) |
| Specificity | 94% (87% - 98%) | 97% (95% - 99%) |
| ROC AUC | 97% (95% - 100%) | 77% (72% - 82%) |
| Positive Predictive Value | 85% (68% - 95%) | 89% (77% - 96%) |
| Negative Predictive Value | 100% (96% - 100%) | 86% (82% - 90%) |
| Slope ± SE | 4.64 ± 0.51 | 3.47 ± 0.37 |
Indicated cutoffs represent lowest 5th percentile adherence phase observations from training and test data sets. All data points and cutoffs are also shown in Fig 3. Definitions of the metrics are graphically outlined in Fig 4.
The NIDA data was used as the Training set and the Test data sets were either creatinine-normalized data from VAMC trial or absolute concentration data from VAMC plus UKY trials. All adherence phase observations included except for adherence phase data for VAMC Subject AB12, omitted because of reported intermittent adherence. Nonadherent phase limited to days 1-3, because prediction becomes easier as washout proceeds.
Figure 4: Graphic Definitions of the Logistic Regression Performance Parameters reported in Table 2.
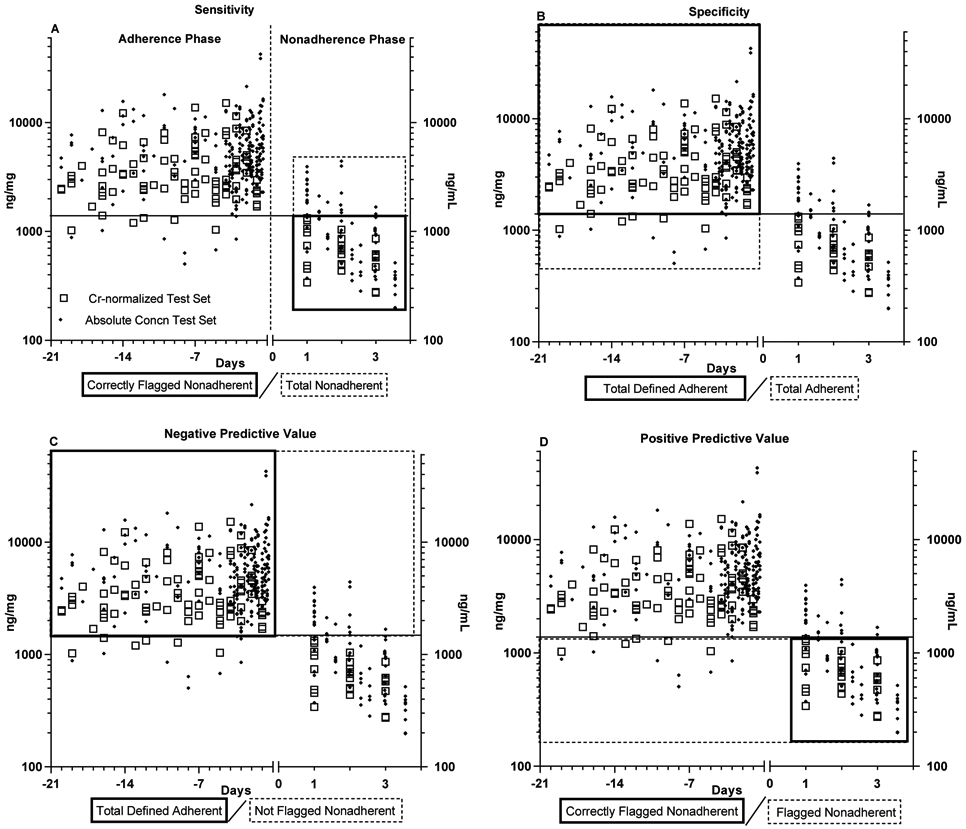
Graphic Definitions of the logistic regression performance parameters reported in Table 2.
The parameter definitions highlighted as grey / dashed boxes overlaid on the test data sets, with the 5th percentile Cr-normalized cutoff shown for illustrative purposes
The data included in the test sets include the entire adherence phase (left of vertical dotted line) and days 1-3 of the nonadherence phase (Right of the vertical dotted line). Participants considered “nonadherent” only when 24h have passed after the time medication should be taken ie, day 1.
Overall, the 989 ng/mL absolute concentration cutoff was relatively poor at identifying nonadherence over days 1-3 (due to data variation), although Fig. 3B suggests it would perform better at detecting a week of nonadherence. In contrast, the Cr-normalized data cutoff of 1376 ng/mg Cr performed excellently for detecting 1-3 days of nonadherence, with a low level of false classification of adherent specimens.
Discussion
The central aim of this study was to provide measures and data to support the clinical implementation of ACZ microdoses as an effective, reliable medication adherence marker. We demonstrated that Cr-normalized ACZ values provide a clinically viable measure that diminishes the impact of differential urine production rates on ACZ concentration assessments. We showed that during simulated nonadherence, urinary ACZ concentrations decay at a consistent rate across populations and clinical settings, regardless of the duration of prior adherence. In addition, we demonstrated that urinary ACZ concentrations are reproducible across adherent cohorts and importantly, that they do not accumulate over 18 days of administration. Based on these findings we developed and tested Cr-normalized and absolute concentration nonadherence detection cutoffs. The latter primarily served as a comparator but may also be useful in clinical situations where Cr-normalization is not possible.
Compared to absolute concentration values, Cr normalization greatly improved the fit of exponential concentration decay curves (as measured by the R2 value) during nonadherence in both the NIDA and VAMC cohorts, improving the R2 from 0.35 to 0.77 in the NIDA trial and from 0.5 to 0.71 in the VAMC trial. Combination of the Cr-normalized data sets resulted in further improvement (R2 = 0.83), indicating the reproducibility of the Cr-normalized data across the two cohorts and the value of Cr-normalization in increasing urinary ACZ assessment accuracy. The reproducibility of urinary ACZ concentration decay during nonadherence (Table 1) was examined as a method to back-calculate the date of last medication consumption. Strikingly, in the VAMC study the urinary decay rate remained exponential for the full 14-day study (Fig. 2A), demonstrating the viability of ACZ as a marker for outpatient trials with only weekly or biweekly clinical visits.
The stability of urinary ACZ values during the VAMC cohort’s adherence phase, together with the sensitivity brought by Cr-normalization to both the NIDA and VAMC cohorts (compare Figs. 3A and B), allowed us to generate a highly sensitive cutoff for detecting nonadherence. After only 1-3 days of nonadherence, a cutoff of 1376 ng/mg based on NIDA and VAMC Cr-normalized ratio data successfully detected 100% of nonadherent VAMC samples. For comparison, an equivalent non-normalized cutoff (739 ng/mL) detected only 37% of nonadherent samples (full analysis not shown). When UKY values were added to increase the non-normalized sample size, the revised cutoff (989 ng/mL) still predicted only 56% of nonadherent samples (Table 2).
In addition to high sensitivity, one also needs confidence that a cutoff only flags nonadherent observations, as false accusations can lead to disillusionment and dropouts, especially in trials using incentivization programs to encourage adherence. This confidence is indicated by PPV (Fig. 4D), which in the current analysis was only 85%, i.e. 15% of nonadherent flags were incorrect. This imperfect prediction was not a failure of the cutoff’s predictive ability, but a result of the imbalanced analytical design. The studies had a limited number of observations and we additionally challenged the cutoff sensitivity by limiting the nonadherence period to days 1-3. This meant only 28 nonadherence phase records were included. However, the cutoff was defined by the lowest 5% of observations during the 18-day adherence phase, which meant that the lowest 4 of the 89 adherence records were deliberately falsely flagged as non-adherent (i.e. below the cutoff). With only 28 nonadherence records, these 4 “false flags” accounted for 12.5% of the 15% PPV false “nonadherent flags”. If we examined only 7 days of adherence phase and increased the nonadherent window to 7 days, the “false flags” would have been a smaller percentage of those records classified as nonadherent and yielded a better PPV score. However, that design would have omitted 11 days of adherence observations and undersold the early nonadherence detection capacity of the system. We estimate that under real-world conditions, a cutoff of approximately 1400 ng ACZ/mg Cr will provide a PPV (the trustworthiness of instances classified as nonadherent) that is considerably better than 85%.
Previously published UKY data demonstrated that ACZ and oxycodone pharmacokinetics are mutually non-interactive when concomitantly administered (4). Clearly such a lack of pharmacokinetic interaction between studied medication and adherence marker is essential for any viable adherence marker excipient. The high degree of reproducibility in the ACZ decay curves in all three of the trials conducted to date (Table1 and Fig 3B) demonstrates that ACZ output is unaffected by concomitant treatment with cocaine, quinine, doxazosin, modafinil or oxycodone (please see S1 to compare drug administration protocols in the different cohorts).
Conclusions
Inclusion of a 15mg ACZ excipient in medication formulations provides a convenient, noninvasive and accurate method to monitor medication adherence during a trial. Accuracy is greatest when creatinine normalized ACZ ratios are used to reduce errors due to differential urine production rates. An ACZ : Cr ratio based cutoff of ~1400 ng ACZ/mg Cr provides a highly sensitive and accurate measure of nonadherence after only a few days of abstinence. Furthermore, when nonadherence is prolonged, ACZ provides the ability to estimate the date of last consumption within an estimation window of 14 days, and its accuracy does not appear to be affected by concomitant cocaine, quinine, modafinil, doxazosin, or oxycodone.
Supplementary Material
Limitations and Caveats.
The statistical analysis of the Cr-normalized cutoff was based on a small number of nonadherence phase observations (28 “day 1-3” observations).
Although 15 mg ACZ q.d. is only 1.5% of a typical 500 mg b.i.d. dose (New Drug Application 008-943), its acceptability to FDA as an excipient in New Drug Application registration studies is unproven. As such ACZ may be most suitable as a marker in proof of concept and phase 2 efficacy trials.
Because of long term ACZ sequestration by erythrocytes (4), doses lower than 15 mg / q.d. may be sufficient for detection efficacy and may still provide a 14-day detection window. However, lower doses may change the cutoff value, and no studies have examined this hypothesis.
Acetazolamide provides a marker of last consumption time and so ACZ doses taken for one or two days prior to a clinical visit may mask longer periods of nonadherence.
These studies were conducted in relatively small cohorts of W and AA males aged between 20-50 y. Cohorts with a diverse range of muscle mass (e.g., higher female representation, or children and elderly participants), will produce Cr at different rates, so that the capacity of Cr-ratios to lower variance may be less impressive in highly diverse cohorts.
The 1400 ng/mg Cr adherence cutoff might vary in cohorts of children or high female representation, or perhaps the intrinsic variability between when a dose is taken and urine sample taken, may minimize the visibility of Cr production rate differences. If the data gathered here were applied to cohorts that significantly differ from those in this study, the tables produced by Barr et al (9) may be used to correct for variance in creatinine production across age groups, races and different sexes.
Acetazolamide is renally eliminated (5) and so is the proposed cutoff unlikely to be suitable as an adherence marker in renally impaired populations. Acetazolamide is used to treat intracranial hypertension in pregnancy, and there once were questions about possible teratogenicity based on high-dose animal studies. However, a recent study found no concerns with ACZ use in any phase of pregnancy, with doses ranging from 250-2000 mg/day (7) and a review concluded “no evidence has been found with respect to the adverse effects of ACZ use during pregnancy”(14)
Acetazolamide ACZ is a sulfonamide but unlike sulfa-antimicrobials, it is considered unlikely to cause “sulfadrug” reactions (15, 16) given that the low doses used here are much lower than test doses for sulfa-sensitive patients (17). However, any ACZ dose should be considered carefully in patients who have previously suffered Stevens Johnson Syndrome.
Future Directions.
A device that can rapidly quantitate urinary ACZ and creatinine at point-of-care would provide a means to promptly identify and address adherence issues as they arise in a trial. Such a device would also assist with medication adherence incentivization programs.
The long urinary life of ACZ is due to erythrocyte deposition (4, 18) and so lower ACZ doses (eg 1-5 mg) may function as well as 15 mg, potentially extending the utility of ACZ as a marker in phase 3 registration trials and as an adherence measure to be used once marketed. Additional trials would be needed to examine the effectiveness of lower ACZ doses and to define new cutoffs.
Trials with a twice daily (bid) regimen may be supported by 7.5 mg ACZ bid. Although the urinary T1/2 of 15 mg ACZ q.d. is 2 days (Table1), daily dosing for 18 days (VAMC) did not cause accumulation. Plasma levels of ACZ 12h after a 15 mg dose are low (~160 ng/mL) but twice those at 24h (90 ng/mL (4) so administration of a ½ dose every 12h is unlikely to alter the rate of excretion. If in b.i.d. regimen studies 1400 ng/mg still approximately represents the lowest 5% of adherent urine samples, it should be a viable cutoff. However, a placebo lead-in study to a trial with 7 days of 7.5 mg b.i.d. dosing and 10 days of urine collection (starting 1st day of dosing), could confirm the utility of ACZ as an adherence monitor in b.i.d. dosing regimen trials.
Study Highlights.
-
What is the current knowledge on the topic?
Elimination of 15 mg ACZ into urine is exponential, and rate limited by erythrocyte stores but remains quantifiable for >7 days. No interaction between ACZ and oxycodone was observed.
-
What question did this study address?
Can urinary ACZ concentration be implemented as a medication adherence monitor for clinical trials? What cutoff defines adherence and how accurate is it? How long is the detection window?
-
What does this study add to our knowledge?
Creatinine-normalized urinary ACZ concentrations provide a noninvasive adherence measure applicable to outpatient trials. A urinary cutoff of ~1400 ng/mg accurately detects nonadherence with high sensitivity. Urinary decay during nonadherence can be used to estimate last consumption date for 14 days.
-
How might this change clinical pharmacology or translational science?
Most adherence systems monitor medication administration. A subtherapeutic ACZ excipient can accurately and non-invasively confirm medication consumption during a trial without breaking the blind. The long and reliable excretion rate allows the date of last consumption to be estimated in trials with lower frequency clinical visits.
Acknowledgements-
We would like to thank Drs Sharon Walsh, Shanna Babalonis and their clinical research team at UKY, for allowing the inclusion of the unpublished UKY data in this report. Thanks to Dr. Phillip Krieter for supervising the sample analysis contract. Part of this work was conducted at, and supported by the Michael E. DeBakey VA Medical Center, Houston, TX.
Funding
This study was supported by a research grant to Baylor College of Medicine from the National Institute on Drug Abuse (DA035513), on which AJ Hampson was Program Officer. The NIDA Intramural Research Program study and some of the analyses were supported by the NIDA Intramural Research Program. This project also contains unpublished data from a previous University of Kentucky study supported by DA016718-08S1.
Footnotes
Disclaimer: The views and opinions expressed in this manuscript are those of the authors only and do not necessarily represent the views, official policy or position of the U.S. Department of Health and Human Services or any of its affiliated institutions or agencies.
Conflict of Interest
The authors declared no competing interests for this work.
References
- (1).Czobor P & Skolnick P The Secrets of a Successful Clinical Trial: Compliance, Compliance, and Compliance. Molecular Interventions 11, 107–10 (2011). [DOI] [PMC free article] [PubMed] [Google Scholar]
- (2).Zempleni J, Galloway JR & McCormick DB Pharmacokinetics of orally and intravenously administered riboflavin in healthy humans. The American journal of clinical nutrition 63, 54–66 (1996). [DOI] [PubMed] [Google Scholar]
- (3).Ramanujam VM, Anderson KE, Grady JJ, Nayeem F & Lu LJ Riboflavin as an oral tracer for monitoring compliance in clinical research. Open Biomark J 2011, 1–7 (2011). [DOI] [PMC free article] [PubMed] [Google Scholar]
- (4).Hampson AJ, Babalonis S, Lofwall MR, Nuzzo PA, Krieter P & Walsh SL A Pharmacokinetic Study Examining Acetazolamide as a Novel Adherence Marker for Clinical Trials. Journal of clinical psychopharmacology 36, 324–32 (2016). [DOI] [PMC free article] [PubMed] [Google Scholar]
- (5).Granero GE et al. Biowaiver monographs for immediate release solid oral dosage forms: acetazolamide. Journal of pharmaceutical sciences 97, 3691–9 (2008). [DOI] [PubMed] [Google Scholar]
- (6).Nunez J et al. Use of acetazolamide in the treatment of patients with refractory congestive heart failure. Cardiovasc Ther 36, e12465 (2018). [DOI] [PubMed] [Google Scholar]
- (7).Falardeau J, Lobb BM, Golden S, Maxfield SD & Tanne E The use of acetazolamide during pregnancy in intracranial hypertension patients. J Neuroophthalmol 33, 9–12 (2013). [DOI] [PubMed] [Google Scholar]
- (8).Aylward SC & Way AL Pediatric Intracranial Hypertension: a Current Literature Review. Current Pain and Headache Reports 22, 1–9 (2018). [DOI] [PubMed] [Google Scholar]
- (9).Barr DB, Wilder LC, Caudill SP, Gonzalez AJ, Needham LL & Pirkle JL Urinary creatinine concentrations in the U.S. population: implications for urinary biologic monitoring measurements. Environ Health Perspect 113, 192–200 (2005). [DOI] [PMC free article] [PubMed] [Google Scholar]
- (10).Heavner DL, Morgan WT, Sears SB, Richardson JD, Byrd GD & Ogden MW Effect of creatinine and specific gravity normalization techniques on xenobiotic biomarkers in smokers' spot and 24-h urines. J Pharm Biomed Anal 40, 928–42 (2006). [DOI] [PubMed] [Google Scholar]
- (11).Ellefsen KN, Concheiro M, Pirard S, Gorelick DA & Huestis MA Pharmacodynamic effects and relationships to plasma and oral fluid pharmacokinetics after intravenous cocaine administration. Drug Alcohol Depend 163, 116–25 (2016). [DOI] [PubMed] [Google Scholar]
- (12).Babalonis S, Hampson AJ, Lofwall MR, Nuzzo PA & Walsh SL Quinine as a potential tracer for medication adherence: A pharmacokinetic and pharmacodynamic assessment of quinine alone and in combination with oxycodone in humans. Journal of clinical pharmacology 55, 1332–43 (2015). [DOI] [PMC free article] [PubMed] [Google Scholar]
- (13).Motulsky H & Christopoulos A Fitting models to biological data using linear and nonlinear regression: a practical guide to curve fitting (Oxford University Press: 2004). [Google Scholar]
- (14).Kesler A & Kupferminc M Idiopathic intracranial hypertension and pregnancy. Clin Obstet Gynecol 56, 389–96 (2013). [DOI] [PubMed] [Google Scholar]
- (15).Swenson ER Safety of carbonic anhydrase inhibitors. Expert opinion on drug safety 13, 459–72 (2014). [DOI] [PubMed] [Google Scholar]
- (16).Wulf NR & Matuszewski KA Sulfonamide cross-reactivity: is there evidence to support broad cross-allergenicity? Am J Health Syst Pharm 70, 1483–94 (2013). [DOI] [PubMed] [Google Scholar]
- (17).Kelly TE & Hackett PH Acetazolamide and sulfonamide allergy: a not so simple story. High altitude medicine & biology 11, 319–23 (2010). [DOI] [PubMed] [Google Scholar]
- (18).Bayne WF, Chu LC & Theeuwes F Acetazolamide binding to two carbonic anhydrase isoenzymes in human erythrocytes. Journal of pharmaceutical sciences 68, 912–3 (1979). [DOI] [PubMed] [Google Scholar]
Associated Data
This section collects any data citations, data availability statements, or supplementary materials included in this article.