

Abstract
Purpose.
Confounding due to poor health is a concern in accelerometer-based studies of physical activity and health, but detailed investigations of this source of bias are lacking.
Methods.
US adults (n=4,840) from NHANES (2003–2006) wore an accelerometer for 1 to 7 days (mean=5.7 days) and were followed for mortality through 2015. Logistic regression was used to examine odds ratios between poor health (chronic conditions, self-reported health, mobility limitations, frailty) and low physical activity levels; Cox models were used to estimate adjusted hazard ratios (HR) and 95% confidence intervals (95%CI) for mortality associations for a one hour/day increase in moderate-to-vigorous physical activity using two commonly used cut-points (MVPA760, MVPA2020). Modeling scenarios with shorter and longer follow-up time, increasing adjustment for poor health, by age-group, and after excluding early years of follow-up were used to assess bias.
Results.
Over a mean of 10.1 years of follow-up, 1,165 deaths occurred. Poor health was associated with low MVPA760 levels and increased mortality risk. In fully adjusted MVPA760 models HR were 26% stronger comparing 0–4 yrs (HR=0.46) to 0–12 yrs of follow-up (HR=0.62), particularly in older adults (65+ years). Increasing statistical adjustment for poor health attenuated MVPA760 associations by 13–15%, and exclusion of the first two years of follow-up had limited effects. Comparable results were obtained with the MVPA2020 cut-point.
Conclusion.
We did not find evidence that confounding by health status resulted in entirely spurious MVPA-mortality associations, however, potential bias was appreciable in modeling scenarios involving shorter follow-up (< 6 years), older adults, and with more limited statistical adjustment for poor health. The strength of MVPA-mortality associations in studies reflecting these scenarios should be interpreted cautiously.
Keywords: National Health and Nutrition Examination Survey (NHANES), reverse causality, physical activity, moderate-vigorous intensity, bias
INTRODUCTION
Accelerometers are increasingly being used in epidemiologic studies to assess physical activity at study baseline and then to associate these measures with subsequent risk of dying (1, 2) or development of chronic diseases (3, 4). Results from such studies have often shown much stronger associations with mortality compared to those which relied upon self-reported measures of physical activity. For example, higher levels of reported leisure-time physical activity were associated with a 40% lower risk for all-cause mortality (5) while higher levels of accelerometer-measured total moderate-vigorous intensity physical activity were associated with more than a 70% lower risk (6)—a difference in association strength of roughly 75%. This disparity is generally thought to be due to the stronger measurement properties of accelerometers as compared to self-report, but other explanations are also possible. One troubling possibility is that pre-existing, undiagnosed or subclinical disease (i.e., poor health) in participants at the time of the accelerometer measurements may result in positive confounding and bias in risk estimates away from the null (7), a phenomenon commonly called “reverse causality” (8–11). We refer to this phenomenon as “confounding by health status” since poor health can be a driver of inactivity and is often linked to increased mortality risk consistent with the definition of confounding, and literal reverse causality is not possible in mortality studies. Confounding by health status is a significant concern in these studies because in other settings accelerometers have been used to identify poor health or frailty in older adults (12, 13) given the likelihood that human movement patterns are reflective of one’s health status. In the worst-case scenario, confounding by health status could induce entirely spurious disease associations that may be wrongly attributed to a benefit of physical activity, and in less severe cases the presence of an association may be correctly identified, but the strength of the relationship could be overstated.
While confounding by health status is widely recognized as a threat to the validity of prospective accelerometer-mortality studies, and strategies to minimize this source of bias are frequently employed (6, 8, 9, 11), few prospective accelerometer studies have investigated this potential bias in detail. Accordingly, we investigated confounding by health status in the NHANES accelerometer cohort that included a large number of health indicators and now has up to 12 years of mortality follow-up. First, we empirically tested for two conditions necessary for confounding to be present: (a) that poor health is associated with lower activity levels, and (b) that poor health is associated with increased mortality risk. Second, to characterize the presence and magnitude of bias due to confounding we examined a variety of statistical modeling and stratification scenarios where confounding by health status would be more or less likely to affect the strength of association observed (7). Specifically, we examined differences in the strength of association observed by length of follow-up time, in stratifications by age-group, with increased statistical adjustment for poor health, and after exclusions of early years of follow-up.
METHODS
Study Population and Design. NHANES is a nationally representative sample of non-institutionalized US adults. In 2003–04 and 2005–06 participants were asked to wear an ActiGraph 7164 accelerometer on the hip for seven days during waking hours (14). Non-wear time was defined per protocol (14), and those with ≥1 day of valid wear (i.e., ≥10 h/d) were included. Moderate-vigorous intensity physical activity (MVPA) was estimated using the 760 count/minute cut-point (MVPA760) (15, 16) in our primary analysis of confounding by health status, and the 2020 cut-point (MVPA2020) in secondary analysis (14). Demographic information (age, sex, education) and health behaviors (alcohol, smoking) were assessed by self-report and height and weight were measured. Diet quality was assessed with 24-hour recall-based measures of 12 dietary components integrated as the 2005 Healthy Eating index (17) (scale range 0 to 100, higher scores healthier). Mortality ascertainment was completed with the National Death Index with follow-up through December 2015 (18–20). The National Center for Health Statistics ethics review board approved the survey protocols, and informed consent was obtained for all participants.
Indicators of Poor Health
We examined a number of indicators of poor health including the most common covariates in epidemiologic studies. Major chronic conditions (diabetes, heart disease, heart failure, stroke, cancer, chronic bronchitis, and emphysema) were collected by self-report. Self-reported general health was assessed using the question, “Would you say your health in general is excellent, very good, good, fair, or poor?”. Mobility limitations (difficulty walking a quarter mile without special equipment, or up 10 steps) were assessed among participants who were 60+ years of age or who were younger than 60 but reported any limitation in ability to work or walk without special equipment due to physical, mental, or emotional problems or illness. We also employed information on frailty in the form of a frailty index based on the concept of deficit accumulation (21). The index was developed from up to 47 indicators that included information on 10 health conditions not including those listed above, information about limitations in other activities of daily living, items related to vision, hearing, healthcare use, medications, and several physiological and biochemical measurements (21). See Supplementary materials for additional detail (Supplemental Digital Content Text 1: Frailty Index Calculations). If present, each deficit was assigned a value of 1 and the frailty index was calculated as the sum of all items divided by the total number of items available. Index values were classified as Non-frail (≤ 0.10), Vulnerable (0.11 to ≤0.21), Frail (0.21 to ≤0.45), and Most frail (≥0.46) (21).
Description of Confounding Due to Poor Health
Confounding associated with poor health status is an elusive phenomenon that is not directly quantifiable, but evidence for this source of bias can be revealed by testing for necessary conditions for confounding and conducting specific analyses designed to demonstrate possible bias. First, two conditions must be met for confounding by health status to be present: poor health must be associated with both physical inactivity and mortality risk (7). Further evidence of possible confounding is revealed by evaluating differences in the strength of association in analytic scenarios that are more or less susceptible to this form of bias. We anticipate greater susceptibility to confounding by poor health (i.e., stronger associations) for results with shorter follow-up time, in older age-groups, with less adjustment for poor health, and when deaths occurring early in follow-up are included. We take the least biased, or best, estimate of the strength of the underlying activity-mortality association to be the value observed in the modeling scenario with maximal adjustment for poor health and longest follow-up times (0–12 years). Our analytic approach is described in more detail below.
Statistical Analysis
Cox proportional hazard models were used to model mortality associations with follow-up time from the interview date to date of death or censoring (12/31/2015). Hazard ratios (HRs) and 95% confidence intervals (95%CIs) were adjusted (as appropriate) for age (years), sex (female, male), race-ethnicity (non-Hispanic White, non-Hispanic Black, Mexican-American, other), education level (< high school, high school diploma, > than high school), diet quality (continuous), alcohol consumption (never, former, current, unknown), smoking status (never, former, current), body mass index (BMI; <25, 25–29.9, ≥30 kg/m2), self-reported general health (excellent, very good, good, fair, poor, unknown), mobility limitation (no physical/mental limitations, no mobility limitation, limited mobility, unknown), diabetes (yes, no, borderline), heart disease (yes, no, unknown), heart failure (yes, no, unknown), stroke (yes, no), cancer (yes, no), chronic bronchitis (never, former, current, unknown), emphysema (yes, no, unknown). Given the small amount of missing data (≤ 5% for a given covariate) we classified these values as missing/unknown in our models. For our primary analysis of confounding by health status we examined MVPA760, and in a secondary parallel analysis we examined MVPA2020.
First, we examined the potential contribution of confounding to the activity-mortality association attributed to each health indicator by examining their associations with both low MVPA and mortality risk. We specifically quantified the associations between individual health indicators and being in the bottom quartile for MVPA (least active) using logistic regression, and risk for premature mortality using cox proportional hazards models. Second, we described variation in the observed MVPA-mortality association for a one hour increase in MVPA with increasing years of mortality follow-up in two year increments, while adjusting for age, sex, race/ethnicity, education, BMI, smoking, alcohol intake, and diet quality (reduced model), and additionally adjusting for chronic conditions (diabetes, coronary heart disease, cancer, stroke, chronic bronchitis, emphysema, heart failure), general health, mobility limitation, and frailty (full model). Third, we examined differences in the strength of the MVPA-mortality association with increasing adjustment for indicators of poor health. We initially fit models that included only demographic and lifestyle factors, and then sequentially added adjustment for chronic conditions, self-reported health, mobility limitations, and frailty. Results were evaluated in scenarios with short (0–6 years) and long follow-up (0–12 years) periods, and by age group (40–64 and 65–85+ years). Finally, we evaluated the influence of excluding early years of follow-up in short and long follow-up scenarios, and with basic adjustment only for chronic conditions, followed by adjustment for all health indicators (full model). In each scenario, we examined results with no exclusions, and with early years of follow-up excluded (up to 5 years of follow-up, when possible). All analyses accounted for the NHANES sample weighting and complex survey sample to ensure appropriate estimation of the characteristics of the population and 95%CIs. Two-sided P-values < 0.05 were considered statistically significant.
RESULTS
We examined adults 40+ years of age at the time of the survey (n=6,355) who had valid accelerometer data (n=4,840). Table 1 describes the analytic cohort.
Table 1.
Descriptive characteristics of the analytic cohort, by quartile of moderate-vigorous intensity physical activity (MVPA760).
| Moderate-vigorous intensity activity (hrs/d) | ||||
|---|---|---|---|---|
| < 0.9 | 0.9–1.4 | 1.5–2.2 | ≥2.3 | |
| Number Participants | 1,574 | 1,178 | 1,052 | 1,036 |
| Deaths | 756 | 214 | 110 | 85 |
| Mean (SE) | ||||
| Age, years | 67.0 (0.5) | 56.3 (0.5) | 53.2 (0.4) | 50.7 (0.4) |
| % (SE) | ||||
| Sex | ||||
| Female | 63.3 (1.5) | 60.5 (1.6) | 53.8 (1.6) | 36.4 (1.7) |
| Male | 36.7 (1.5) | 39.6 (1.6) | 46.2 (1.6) | 63.6 (1.7) |
| Race/Ethnicity | ||||
| White | 79.5 (2.0) | 77.4 (2.6) | 77.3 (2.3) | 75.5 (2.6) |
| Black | 11.4 (1.4) | 9.7 (1.4) | 9.8 (1.3) | 10.0 (1.6) |
| Mexican-American | 3.5 (1.0) | 4.5 (0.9) | 5.7 (1.1) | 7.4 (1.3) |
| Other | 5.6 (0.9) | 8.4 (1.0) | 7.3 (1.1) | 7.2 (1.3) |
| Education | ||||
| Less than High School | 27.7 (2.3) | 12.8 (1.1) | 13.8 (1.5) | 15.6 (1.4) |
| High School | 27.9 (1.4) | 27.2 (1.4) | 24.7 (1.4) | 25.8 (1.8) |
| Greater than high school | 27.7 (2.3) | 60.1 (2.0) | 61.5 (2.0) | 58.6 (2.1) |
| Behavioral factors1 | ||||
| ≤1 | 12.5 (1.1) | 11.7 (1.2) | 10.1 (1.1) | 9.7 (1.4) |
| 2 or 3 | 59.0 (1.6) | 61.5 (1.6) | 63.1 (1.8) | 61.0 (1.4) |
| 4 | 28.5 (1.6) | 26.8 (1.3) | 26.7 (2.0) | 29.3 (1.5) |
Behavioral factors included being a current smoker, alcohol drinker, having BMI ≥ 25.0, or/and poor diet quality (i.e., bottom tertile for 2005 Healthy Eating Index).
First, we examined the two conditions necessary for confounding by poor health to be expressed. In models mutually adjusted for all other heath indicators we found the following factors to be positively associated (p<0.05) with low MVPA: diabetes, heart disease, general health, mobility limitations, and frailty status (Table 2). Factors significantly associated with increased mortality risk were diabetes, stroke, cancer, emphysema, heart failure, general health, mobility limitation, and frailty status. Diabetes, general health, mobility limitation, and frailty status were significantly associated with both low activity and mortality risk (Table 2).
Table 2.
Associations between health status indicators, low MVPA760, and mortality risk
| N | Low MVPA7601 | Mortality Risk2 | |
|---|---|---|---|
| Health Conditions | |||
| Diabetes | |||
| No | 4019 | Referent | Referent |
| Yes | 725 | 1.92 (1.28, 2.87) | 1.32 (1.12, 1.54) |
| CHD | |||
| No | 4494 | Referent | Referent |
| Yes | 319 | 2.12 (1.19, 3.77) | 1.08 (0.84, 1.40) |
| Stroke | |||
| No | 4584 | Referent | Referent |
| Yes | 256 | 1.76 (0.84, 3.71) | 1.43 (1.12, 1.81) |
| Cancer | |||
| No | 4200 | Referent | Referent |
| Yes | 640 | 1.07 (0.75, 1.52) | 1.20 (1.01, 1.43) |
| Chronic Bronchitis | |||
| Never | 4468 | Referent | Referent |
| Previous | 180 | 0.73 (0.43, 1.24) | 1.06 (0.83, 1.36) |
| Current | 175 | 0.97 (0.53, 1.77) | 1.05 (0.79, 1.41) |
| Emphysema | |||
| No | 4673 | Referent | Referent |
| Yes | 155 | 2.03 (0.85, 4.87) | 1.57 (1.21, 2.03) |
| Heart failure | |||
| No | 4574 | Referent | Referent |
| Yes | 244 | 0.96 (0.48, 1.89) | 1.57 (1.21, 2.04) |
| General health | |||
| Excellent | 417 | Referent | Referent |
| Very Good | 1224 | 1.16 (0.85, 1.60) | 1.17 (0.82, 1.67) |
| Good | 1711 | 1.44 (1.05, 1.99) | 1.31 (0.96, 1.77) |
| Fair/Poor | 1217 | 1.77 (1.19, 2.62) | 1.82 (1.25, 2.67) |
| Mobility limitation | |||
| No limitations | 1645 | Referent | Referent |
| Limitation unrelated to mobility | 1833 | 1.06 (0.80, 1.40) | 1.31 (0.96, 1.80) |
| Mobility limitation | 1355 | 1.95 (1.26, 3.02) | 1.76 (1.25, 2.48) |
| Frailty Status | |||
| Non-frail | 705 | Referent | Referent |
| Vulnerable | 2003 | 1.09 (0.85, 1.40) | 1.24 (0.77, 2.01) |
| Frail | 1731 | 1.56 (1.07, 2.28) | 1.58 (0.96, 2.59) |
| Most frail | 401 | 1.10 (0.56, 2.16) | 2.57 (1.61, 4.12) |
Odds ratios for the association between each health indicator and being in the lowest quartile of MVPA (760+)
Hazard ratios for the association between all-cause mortality and each health indicator.
All models adjusted for age, sex, ethnicity/race, education, BMI, smoker, alcohol, HEI 2005, diabetes, stroke, coronary heart disease, cancer, chronic bronchitis, emphysema, heart failure, general health, mobility limitation, and frailty status, as appropriate.
All models included NHANES survey sampling weights.
Next, we examined the variation in the magnitude of the hazard ratios linking mortality and MVPA with increasing amounts of follow-up time in models adjusting only for demographic and lifestyle factors (reduced model) and in models additionally adjusted for all available health indicators (full model; Figure 1). Three patterns of association were clear. First, associations for the reduced model were always stronger (lower HR) by 23 to 37% than those derived from models adjusted for indicators of poorer health. Second, for both models, risk estimates tended to be stronger earlier in follow-up (e.g., ≤ 6 yrs) compared to later in follow-up (> 6 yrs). For example, in the full model the HR was 0.46 with 0–4 yrs of follow-up and 0.62 with 0–12 yrs of follow-up, a 26% difference (i.e., [0.46–0.62]/0.62=0.26). Third, the strength of association stabilized later in follow-up, with little evidence of further weakening of the association with greater follow-up. Given the evidence of stronger associations with shorter follow-up, in subsequent analyses we examined different analytic scenarios in models examining short (0–6 years) and longer follow-up (0–12 years).
Figure 1.
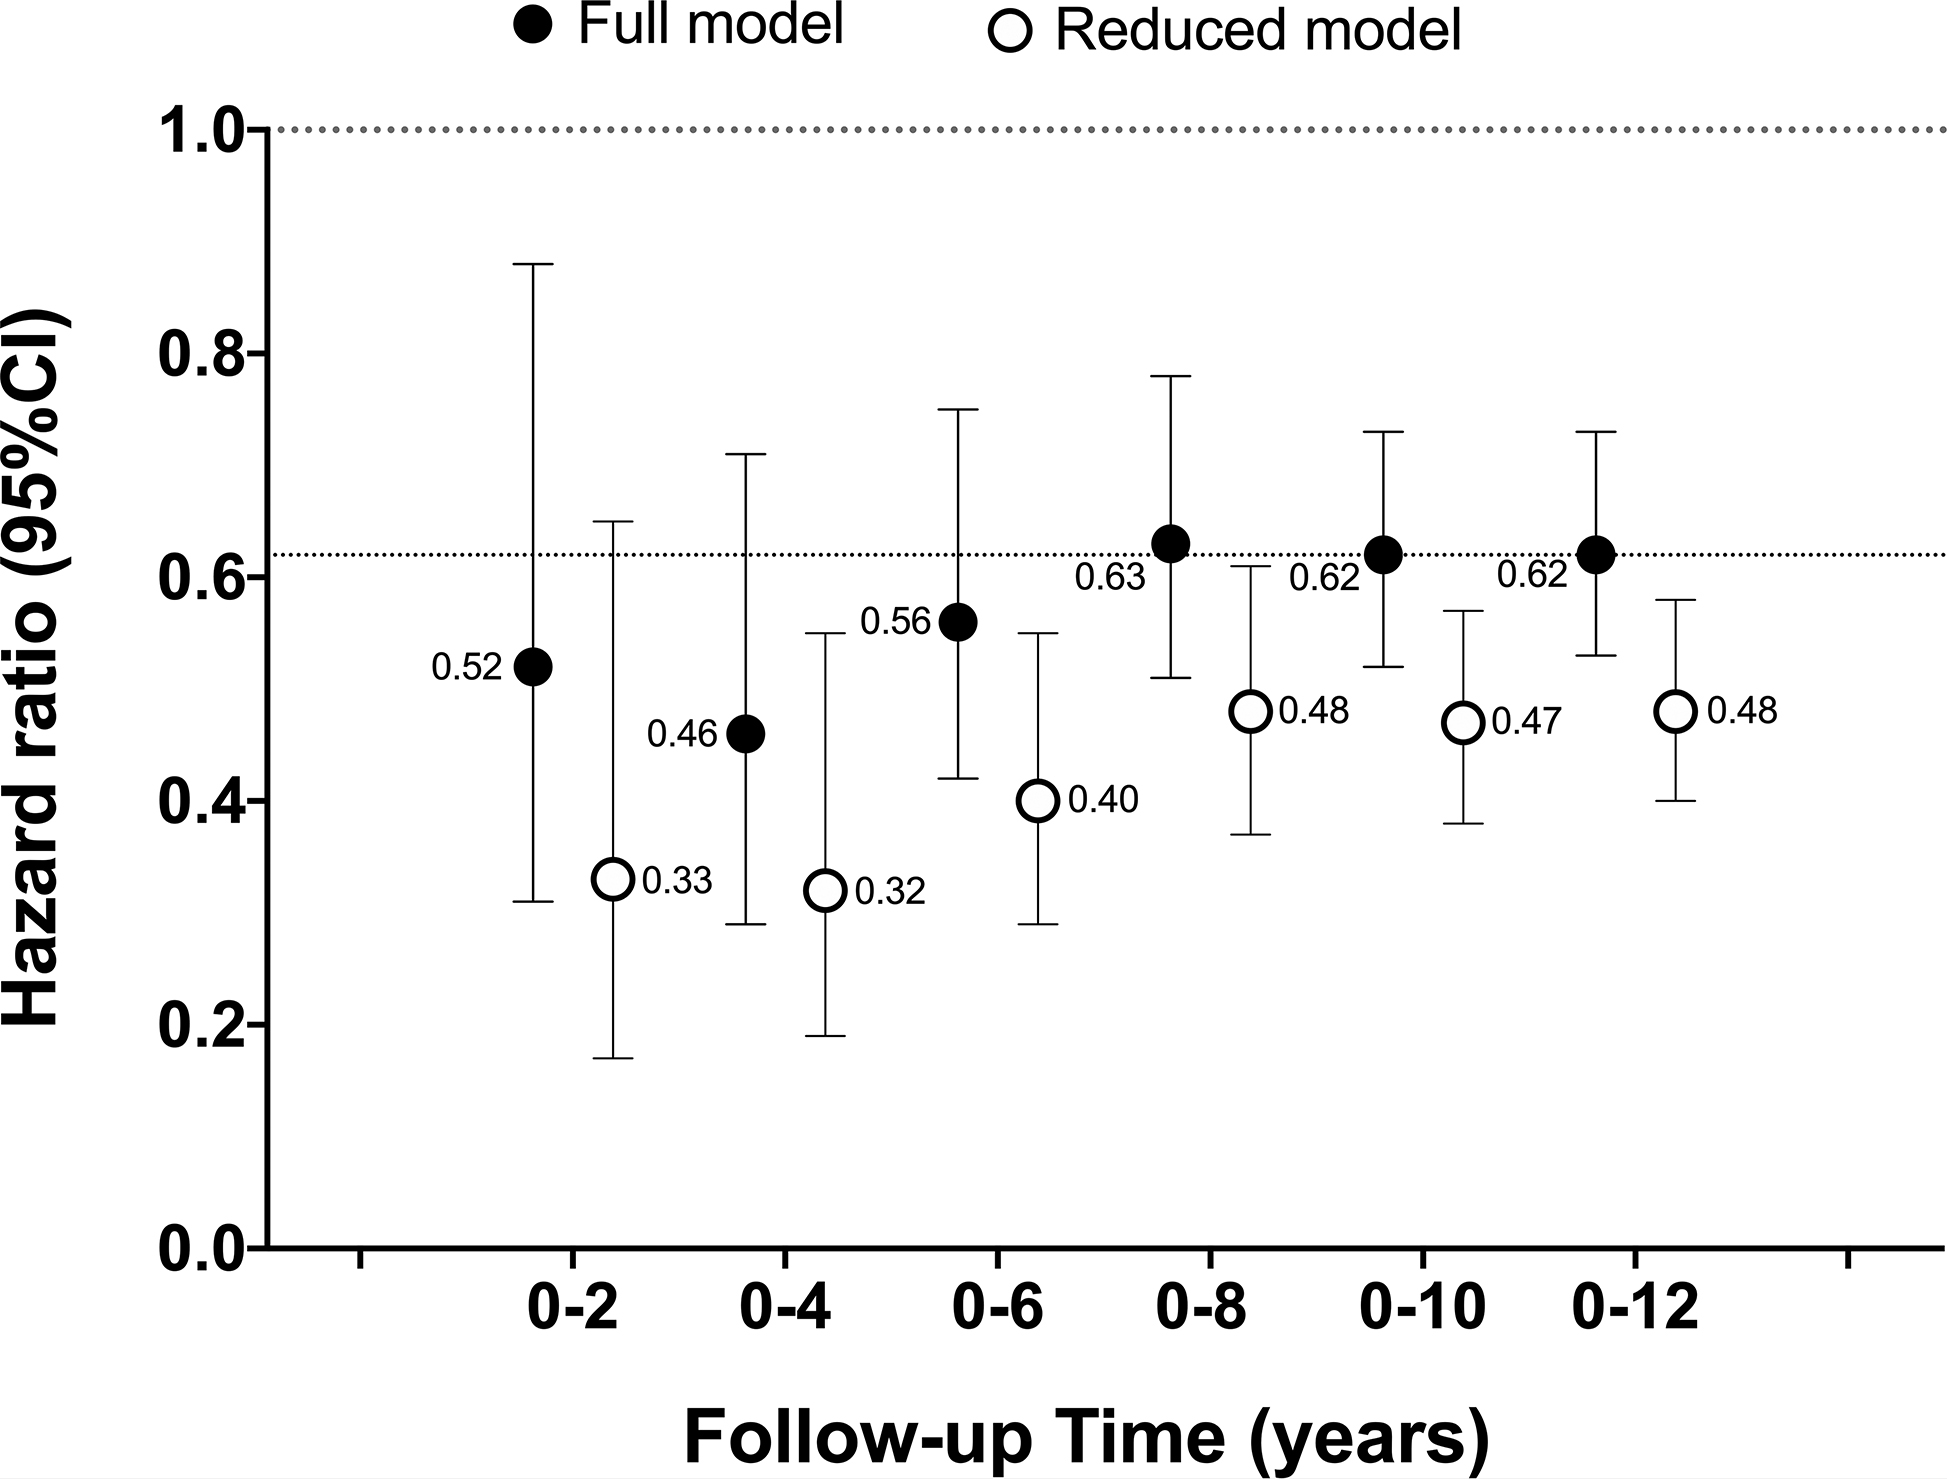
Association between a one hour increase in MVPA760 and all-cause mortality with increasing years of follow-up time in reduced and fully adjusted models.
All models included NHANES survey sampling weights.
The cumulative number of deaths with increasing follow-up time were: 0–2 yrs (n=180 deaths); 0–4yrs (n=378); 0–6 yrs (n=605); 0–8 yrs (n=828); 0–10 yrs (n=1,043); 0–12 yrs (n=1,165)
Reduced models adjusted for age, sex, race/ethnicity, education, BMI, smoking, alcohol intake, and diet quality
Full model adjusted for factors in the reduced model + chronic conditions (diabetes, coronary heart disease, cancer, stroke, chronic bronchitis, emphysema, heart failure), general health, mobility limitation, and frailty
The dotted line at HR = 0.62 reflects our best estimate of the strength of the underlying association in these scenarios
Next, we examined differences in the strength of associations with increasing statistical adjustment for indicators of poor health (Figure 2). Compared to a model adjusting only for demographic and lifestyle factors, further adjustment for pre-existing chronic conditions (diabetes, heart disease, stroke, cancer, chronic bronchitis, emphysema, heart failure) resulted in attenuation of the HR by 13 to 15% (e.g., HR increased from 0.48 to 0.54 [+13%] for long follow-up). Further adjustment for self-reported health, mobility limitations, and frailty resulted in further attenuation of the association. However, in the short follow-up scenario, even with full adjustment for all health indicators (+Frailty index), the HR observed was 10% stronger in comparison to the association with full adjustment and long follow-up (HR=0.56 vs. 0.62), our best estimate of the underlying strength of association. To explore these relationships in more detail, we examined the same scenarios in younger (40–64 yrs) and older adults (65+ yrs), a group in which confounding due to poor health was expected to be more pronounced (Figure 3). In younger adults, full adjustment for all health indicators provided similar results in both short and long follow-up scenarios. However, in older adults, stronger associations persisted in the short follow-up scenario even with full adjustment for poor health. For example, in fully adjusted models (+Frailty index), the association with short follow-up was 22% stronger that that observed with long follow-up (HR=0.46 vs. 0.59; Figure 3). Evidence of confounding was greater with short follow-up in scenarios with fewer adjustments for poor health.
Figure 2.
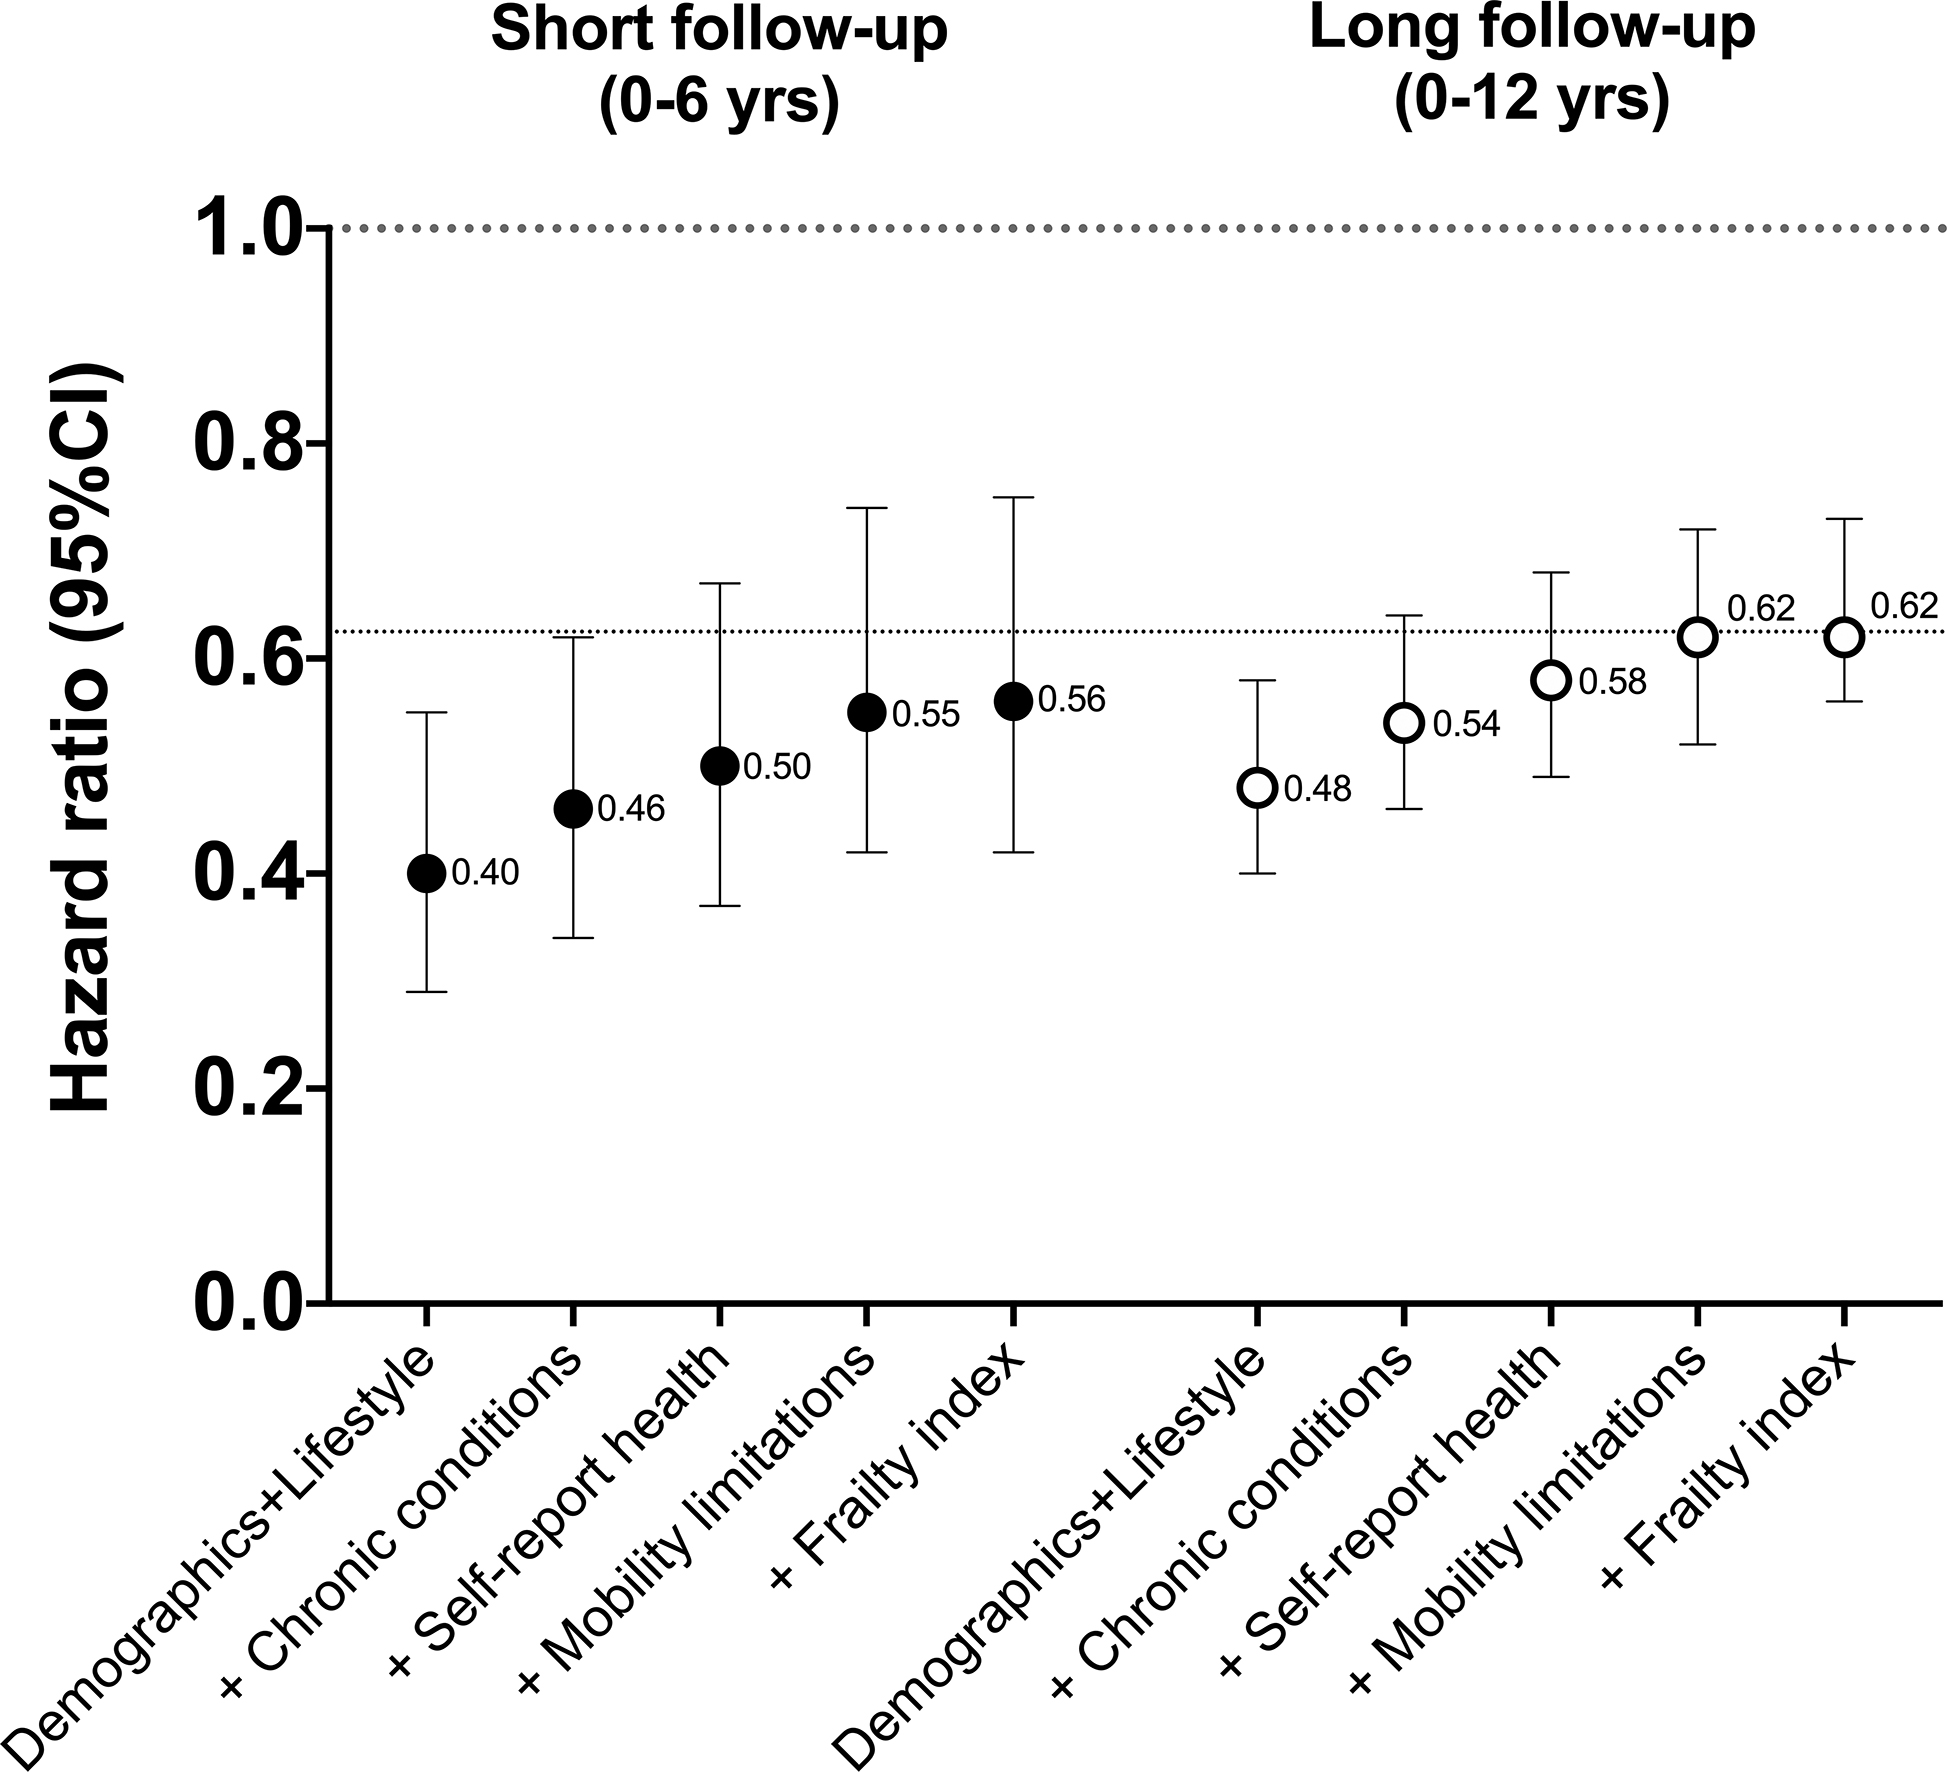
Associations for a one hour increase in MVPA760 with increasing adjustment for poor health, by short and longer follow-up time.
All models included NHANES survey sampling weights.
There were 605 deaths in short follow-up period and 1,165 deaths in long follow-up period.
Demographic and lifestyle model adjusted for age, sex, race/ethnicity, education, BMI, smoking, alcohol intake, and diet quality
+ Chronic conditions = Demographic and lifestyle model + chronic conditions (diabetes, coronary heart disease, cancer, stroke, chronic bronchitis, emphysema, heart failure)
+ Self-reported health = Chronic conditions + self-reported health
+ Mobility limitations = Self-reported health + mobility limitations
+ Frailty index = Mobility limitations + frailty index
The dotted line at HR = 0.62 reflects our best estimate of the strength of the underlying association in these scenarios
Figure 3.
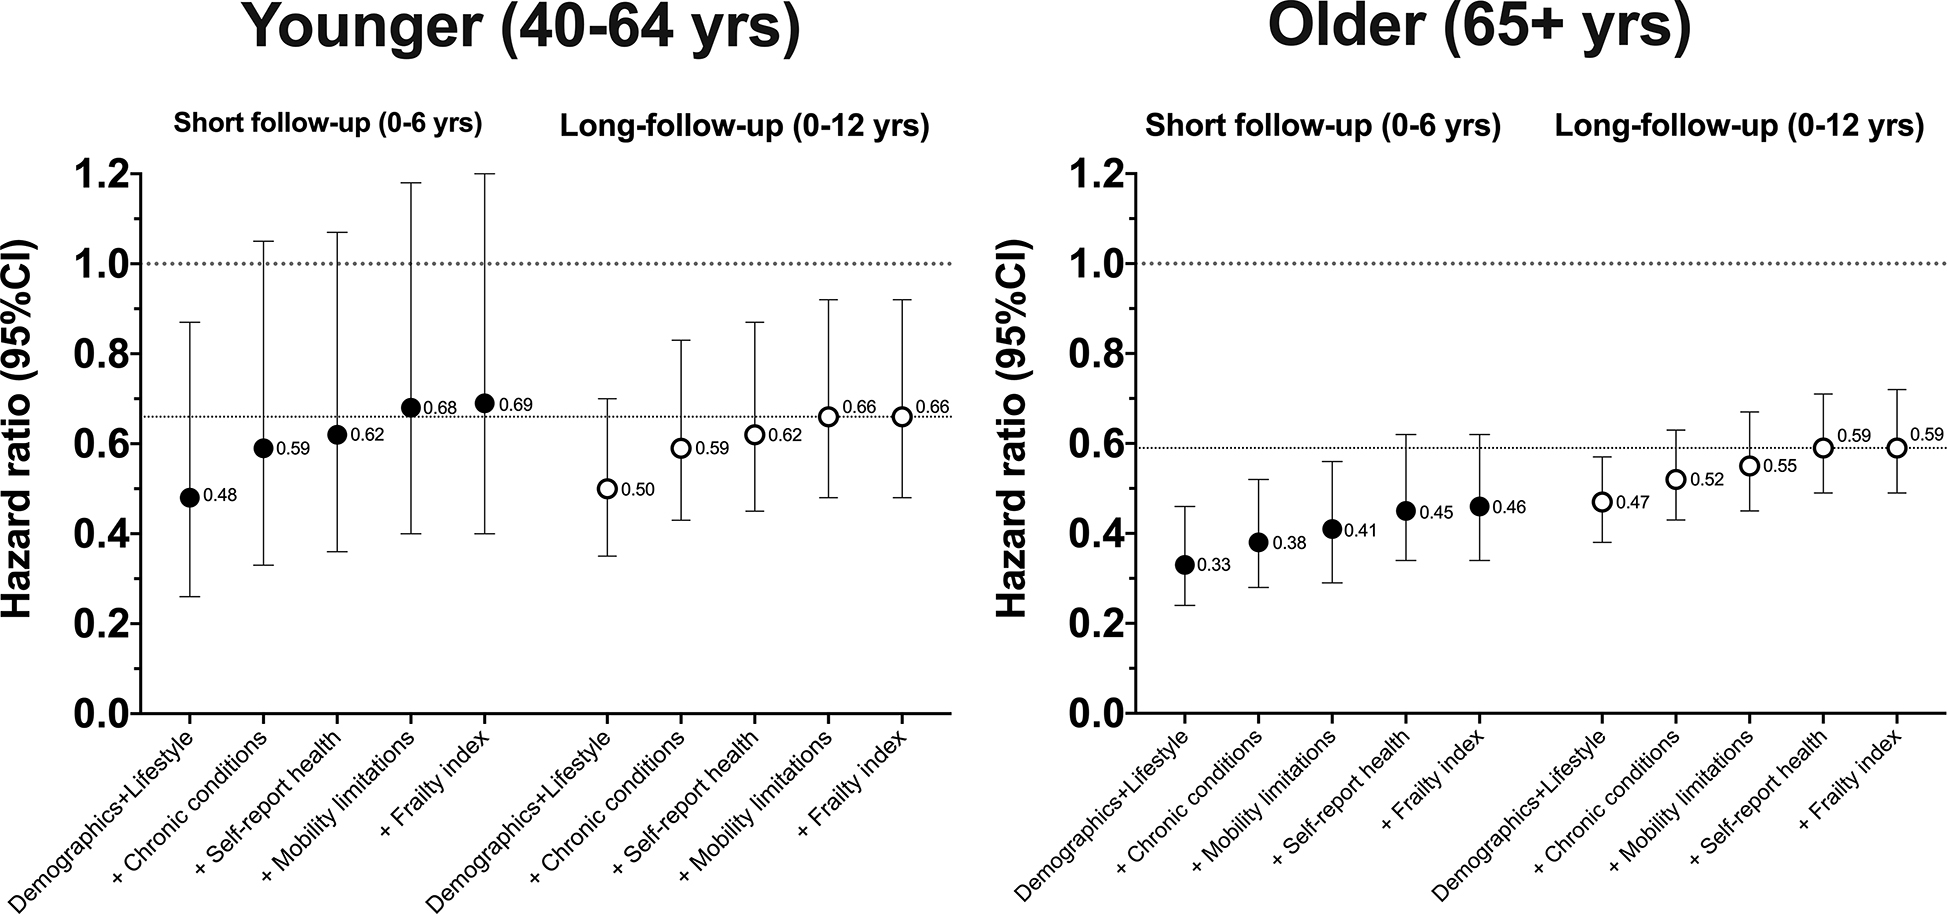
Associations for a one hour increase in MVPA760 with increasing adjustment for poor health for short and longer follow-up time, by age-group.
All models included NHANES survey sampling weights.
Younger participants n=2,904 with 137 deaths with short follow-up and 283 deaths with long follow-up.
Older participants n=1,936 with 468 deaths with short follow-up and 882 deaths with long follow-up.
Demographic and lifestyle model adjusted for age, sex, race/ethnicity, education, BMI, smoking, alcohol intake, and diet quality
+ Chronic conditions = Demographic and lifestyle model + chronic conditions (diabetes, coronary heart disease, cancer, stroke, chronic bronchitis, emphysema, heart failure)
+ Self-reported health = Chronic conditions + self-reported health
+ Mobility limitations = Self-reported health + mobility limitations
+ Frailty index = Mobility limitations + frailty index
The dotted line at HR = 0.66 and 0.59 reflects our best estimate of the strength of the underlying association for the modeling scenarios in each age-group
Finally, we investigated differences in the strength of association without and with excluding early years of follow-up in scenarios adjusting for demographic, lifestyle factors and chronic conditions, and similar scenarios using fully adjusted models (Figure 4). First, excluding the first one or two years of follow-up, a common analytic strategy, had less of an impact on the strength of association than did full adjustment for all health indicators (i.e., Full model). For example, in the short follow-up scenario with basic adjustment for chronic conditions, results with no exclusions showed a HR of 0.46, while excluding 2 years of follow-up only increased the HR to 0.48. In contrast, full adjustment for poor health with no exclusions resulted in a HR of 0.56 in the short follow-up results. Second, in the short follow-up scenario full adjustment and exclusion of up to 2 years of follow-up still resulted in a HR that was about 10% stronger than the same scenario with longer follow-up (HR=0.58 vs. 0.63). Exclusion of 3+ years of follow-up appeared to further minimize bias, but variability in results with exclusion of 3, 4, and 5 years precludes more definitive conclusions (Figure 4). With the complete follow-up, exclusion of deaths up to five years resulted in modest increases in the hazard ratios from 0.62 to 0.66.
Figure 4.
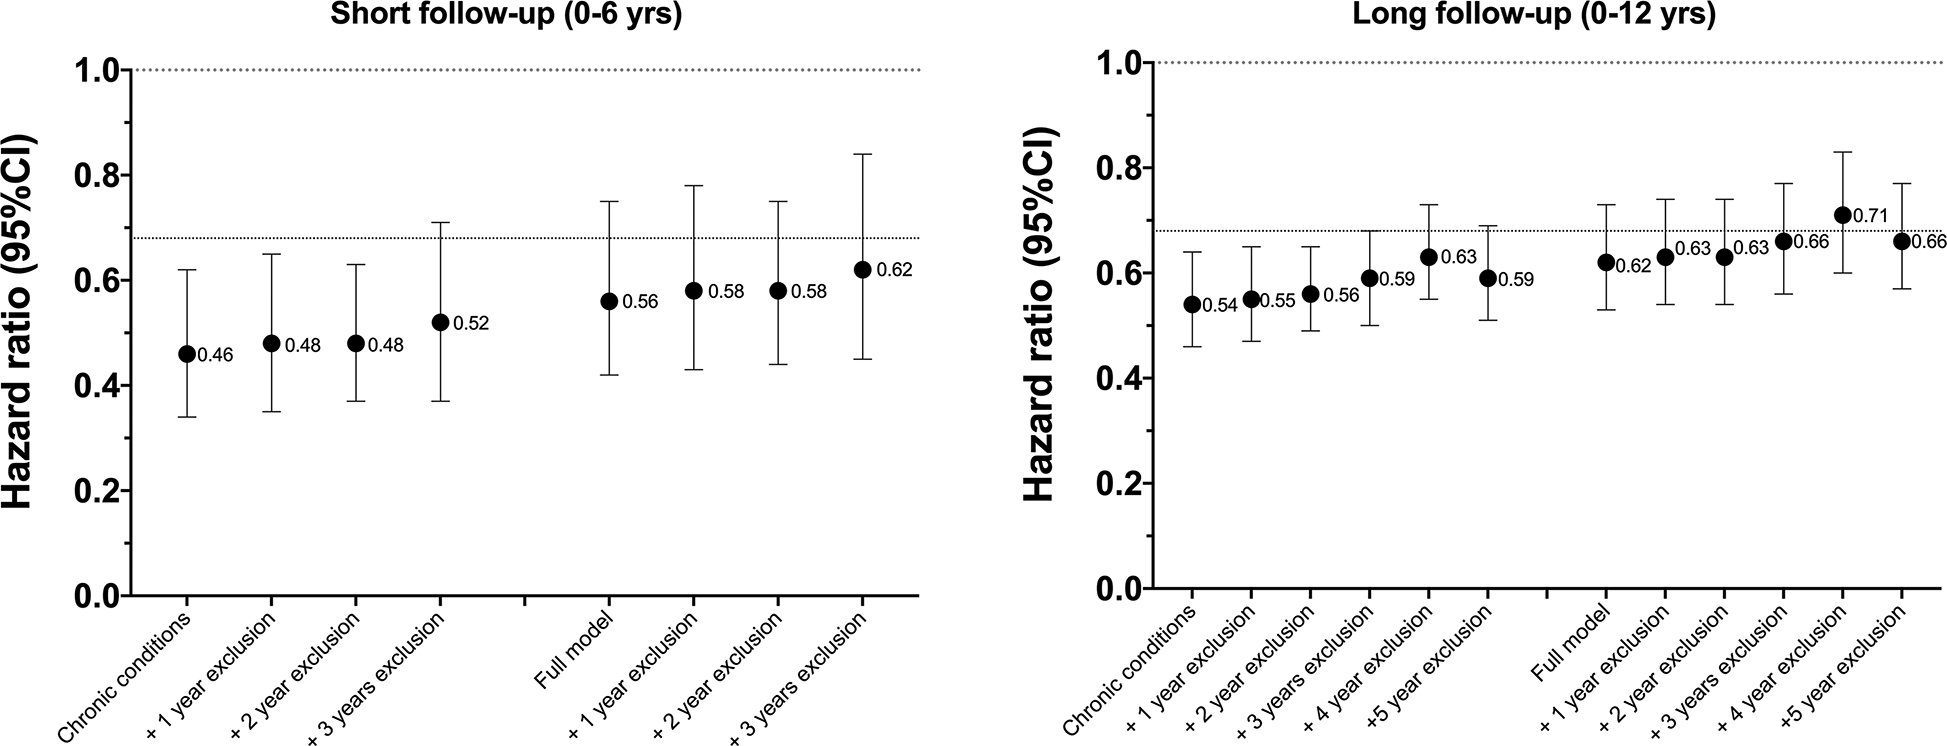
Associations for a one hour increase in MVPA760 with without and with exclusions for early deaths after adjusting only for chronic conditions and all available health indicators (full model), by short and long follow-up time.
All models included NHANES survey sampling weights.
Sample sizes (N) and deaths for Short follow-up were: No exclusions (N=4,840; 605 deaths); +1-year exclusion (4,766; 531 deaths); +2-year exclusion (4,675; 540 deaths); +3-year exclusion (4,566; 331 deaths).
Sample sizes (N) and deaths for Long follow-up were: No exclusions (N=4,840; 1,165 deaths); +1 year exclusion (4,766; 1,091 deaths); +2 year exclusion (4,675; 1,000 deaths); +3 year exclusion (4,566; 981 deaths); +4 year exclusion (4,471; 796 deaths); and +5 year exclusion (4,346; 671 deaths)
Chronic conditions model adjusted for age, sex, race/ethnicity, education, BMI, smoking, alcohol intake, and diet quality, and all chronic conditions (diabetes, coronary heart disease, cancer, stroke, chronic bronchitis, emphysema, heart failure), with no exclusions for early deaths.
Full model = Chronic conditions model + all additional health indicators (self-reported health, mobility limitations, Frailty index)
The dotted line at HR = 0.68 reflects the mean of the last three HRs, our best estimate of the strength of the underlying association with full adjustment and exclusion of years 3, 4, and 5.
Evaluation of the modeling scenarios noted above using MVPA2020 provided broadly consistent results. In analysis with increasing follow-up time, the strength of associations were stronger for models with less adjustment for poor health (reduced model) and there was some evidence that the strength of the risk estimates was greater earlier in follow-up (e.g., ≤ 6 yrs), although wide confidence intervals earlier in follow-up makes firm conclusion difficult (Supplemental Figure 1. MVPA202 and mortality—increasing follow-up). Increasing adjustment for poor health also resulted in attenuation the HR with MVPA2020 (e.g., HR increased from 0.19 to 0.37 [+95%] for long follow-up; Supplemental Digital Content Figure 2. MVPA2020 and mortality—increasing adjustment for poor health) and HRs tended to be stronger in short- compared to long-follow-up even with full adjustment for all health indicators in older adults (Supplemental Digital Content Figure 3. MVPA2020 and mortality—increasing adjustment for poor health, by age). Additionally, exclusion of the first few years of follow-up appeared to have limited effect on the strength of MVPA2020-mortality associations (Supplemental Digital Content Figure 4. MVPA2020 and mortality—excluding early deaths).
DISCUSSION
We found clear evidence that confounding by health status accounts for some, but not all, of the association between accelerometer derived estimates of MVPA and all-cause mortality in this prospective analysis of a nationally representative sample of US adults 40+ years of age enrolled in NHANES. The two conditions necessary for the occurrence of confounding were met for several indicators: poor health was significantly associated with physical inactivity as well as with increased mortality risk. However, after adjustment for more than 50 health indicators, a significant MVPA-mortality association remained. Bias in the strength of this association was noted in modeling scenarios with short follow-up (< 6 years), in models with fewer adjustments for poor health at the time of the accelerometer measurements, in older adults (65+ years) and with two commonly used MVPA cut-points. Our results highlight the need to consider such bias when interpreting results from accelerometer mortality studies conducted in cohorts with shorter follow-up, in older adults, and with more limited control for poor health. Future etiologic studies with accelerometers are encouraged to address the problem of confounding by health status as rigorously as possible.
Accelerometers are increasingly being used in prospective epidemiologic studies (22), and their application in this context has provided critical new insight into the important health benefits associated with physical activity (2, 6, 8, 23) and health risks associated with prolonged sedentary time (6, 8, 24). Findings from this investigation have at least two major implications.
First, we observed clear evidence that higher levels of MVPA were significantly associated with lower risk of mortality after adjusting for more than 50 indicators of poor health and after excluding deaths occurring in the first 5 years of follow-up. This result increases confidence that the MVPA-mortality associations observed in this report and others (2, 6, 8, 23, 25) is not likely to be solely due to confounding by health status. Second, our finding of evidence of confounding by poor health at the time of the accelerometer measurements underscores need for caution in interpreting the strength of the MVPA-mortality association. For example, a recent meta-analysis of eight cohorts including NHANES reported primary results adjusting only for demographic factors and lifestyle behaviors (8), due to limited health status information in some of the studies. In the present analysis, we found that the strength of MVPA-mortality associations to be 23 to 37% stronger in models when health status at the time of the accelerometer measures was not considered, depending on the duration of follow-up (Figure 1). This bias tended to be greatest in older adults and with shorter follow-up. Strain and colleagues (9) recently reported similar evidence of positive confounding with shorter follow-up and with fewer exclusions for prevalent health condition and for early deaths using self-reported physical activity and mortality over 7-years in the UK Biobank. Tarp and colleagues (11) recently examined whether excluding 1, 2, or 5 years of follow-up affected accelerometer-derived mortality risk estimates in NHANES and suggested that excluding up to 5-years of follow-up may be required to minimize this bias. Our report broadly confirms the results from these two studies and extends our understanding of confounding by health status in accelerometer-mortality studies by identifying analytic scenarios that may be most susceptible to this bias, and by investigating the potential for more comprehensive adjustment to mitigate this bias using more than 50 indicators of health status.
This study has its limitations and strengths. First, confounding by health status is not a directly quantifiable phenomena, and its presence can only be inferred by examining differences in the strength of associations in modeling scenarios in which confounding is more or less likely to be expressed (7). Our analysis assumes that the best estimate of the true strength of the MVPA-mortality association was observed in fully adjusted models with the longest follow-up time. We also considered excluding participants with pre-existing health conditions in our analysis, but the reductions in sample-size and smaller number of deaths made interpretation of the HRs challenging for shorter follow-up periods, and previous studies have suggested that such exclusions had a limited impact on MVPA-mortality associations (26). While previous studies have shown attenuation in the strength of association with increasing follow-up (9, 27) we observed relatively stable risk estimates as follow-up time increased from 8 to 12 years with no evidence of attenuation, increasing our confidence that results from longer follow-up were a useful estimate of the strength of the underlying MVPA-mortality association in these data. It is likely that attenuation of the HRs will occur with additional mortality follow-up in the NHANES cohort because of changes in behavior over time, or exposure misclassification (27). Second, we evaluated MVPA levels using only a single 7-day accelerometer administration period without accounting for the influence of known variation in behavior within individuals over time (28, 29). Third, residual confounding is still possible as our indicators of health status may not have fully quantified the essential elements of poor health that may be linked to both MVPA and mortality risk, and we did not consider severity of the chronic conditions examined. Fourth, our analysis was limited to examination of MVPA and all-cause mortality, and it is possible that confounding by poor health may be more or less of an issue for other disease end-points, such as cardiovascular events or incident cancers or with other physical activity summary metrics (e.g., total activity counts, step counts, sedentary time, light intensity PA)(11). Fifth, due to inherent differences in statistical power from one analytic scenario to the next, our interpretation of results relied solely on comparison of the strength of associations observed rather than formal statistical testing. Sixth, it is possible that physical activity earlier in life may prevent some of the health conditions we controlled for in our analysis and could be conceived of as possible mediating factors. However, since these health conditions were present at the time of the accelerometer measurements, we believe it is reasonable to view them as confounding factors rather than mediators in mortality analyses reported here. Strengths of our study included evaluation of the NHANES cohort, which includes a representative sample of the US population, relatively wide age-range, longer follow-up time, and a relatively large numbers of deaths. Importantly for the present analysis, NHANES also collected extensive phenotype information that facilitated a more comprehensive and detailed evaluation of confounding by poor health than was possible in many previous studies.
CONCLUSION
Results from this study support the broad validity of the association between higher MVPA levels and lower mortality risk, but also demonstrate that positive confounding by health status is observable in certain scenarios, including those involving shorter follow-up periods, in subgroups of older adults, and when results are presented with more limited adjustment for health status at the time of the accelerometer measures. More caution may be warranted when interpreting the relative strength of the MVPA-mortality associations observed in previous studies or those with limited ability to control for health status. Use of risk estimates derived from these studies should be used with great care if they are to be applied to broader public health metrics such as population attributable risk that rely on accurate estimates of the strength of association for relevant predictions. Additionally, as new large prospective studies that have implemented accelerometers to assess physical activity mature and begin to report their early results, such as the UK Biobank (30), German National Cohort (31), and the Cancer Prevention Study III (32), careful attention to minimizing confounding by health status is warranted, particularly when follow-up time is limited.
Supplementary Material
Supplemental Digital Content Text 1: Frailty Index Calculations
Supplemental Digital Content Figure 1. MVPA2020 and mortality—increasing follow-up
Supplemental Digital Content Figure 2. MVPA2020 and mortality—increasing adjustment for poor health
Supplemental Digital Content Figure 3. MVPA2020 and mortality—increasing adjustment for poor health, by age
Supplemental Digital Content Figure 4. MVPA2020 and mortality—excluding early deaths
Acknowledgments
This research using publicly available data was supported by the Intramural Research Program of the National Institutes of Health (National Cancer Institute [NCI], National Institute on Aging), and NCI’s Division of Cancer Control and Population Sciences. No additional funding was involved.
Footnotes
Conflict of Interest
The authors have no conflicts of interest in terms of professional relationships with companies or manufacturers who could benefit from the results of this study. The results reported herein do not constitute endorsement by ACSM, and the authors have endeavored to present study results clearly, honestly, without fabrication or falsification, or inappropriate data manipulation.
REFERENCES
- 1.Evenson KR, Wen F, Herring AH. Associations of Accelerometry-Assessed and Self-Reported Physical Activity and Sedentary Behavior With All-Cause and Cardiovascular Mortality Among US Adults. Am J Epidemiol. 2016;184(9):621–32. [DOI] [PMC free article] [PubMed] [Google Scholar]
- 2.Lee IM, Shiroma EJ, Kamada M, Bassett DR Jr, Matthews CE, Buring JE. Association of Step Volume and Intensity With All-Cause Mortality in Older Women. JAMA Intern Med. 2019;179(8):1105–12. [DOI] [PMC free article] [PubMed] [Google Scholar]
- 3.Kraus WE, Yates T, Tuomilehto J, Sun J-L, Thomas L, McMurray JJV, et al. Relationship between baseline physical activity assessed by pedometer count and new-onset diabetes in the NAVIGATOR trial. BMJ Open Diabetes Research & Care. 2018;6(1). [DOI] [PMC free article] [PubMed] [Google Scholar]
- 4.Yates T, Haffner SM, Schulte PJ, Thomas L, Huffman KM, Bales CW, et al. Association between change in daily ambulatory activity and cardiovascular events in people with impaired glucose tolerance (NAVIGATOR trial): a cohort analysis. Lancet. 2014;383(9922):1059–66. [DOI] [PubMed] [Google Scholar]
- 5.Arem H, Moore SC, Patel A, Hartge P, Berrington de Gonzalez A, Visvanathan K, et al. Leisure time physical activity and mortality: a detailed pooled analysis of the dose-response relationship. JAMA Intern Med. 2015;175(6):959–67. [DOI] [PMC free article] [PubMed] [Google Scholar]
- 6.Matthews CE, Keadle SK, Troiano RP, Kahle L, Koster A, Brychta R, et al. Accelerometer-measured dose-response for physical activity, sedentary time, and mortality in US adults. Am J Clin Nutr. 2016;104(5):1424–32. [DOI] [PMC free article] [PubMed] [Google Scholar]
- 7.Savitz DA. Selection Bias in Cohort Studies Interpreting Epidemologic Evidence. Oxford: Oxford University Press; 2003. p. 51–80. [Google Scholar]
- 8.Ekelund U, Tarp J, Steene-Johannessen J, Hansen BH, Jefferis B, Fagerland MW, et al. Dose-response associations between accelerometry measured physical activity and sedentary time and all cause mortality: systematic review and harmonised meta-analysis. BMJ. 2019;366:l4570. [DOI] [PMC free article] [PubMed] [Google Scholar]
- 9.Strain T, Wijndaele K, Sharp SJ, Dempsey PC, Wareham N, Brage S. Impact of follow-up time and analytical approaches to account for reverse causality on the association between physical activity and health outcomes in UK Biobank. Int J Epidemiol. 2019;49(1):162–72. [DOI] [PMC free article] [PubMed] [Google Scholar]
- 10.Sattar N, Preiss D. Reverse Causality in Cardiovascular Epidemiological Research: More Common Than Imagined? Circulation. 2017;135(24):2369–72. [DOI] [PubMed] [Google Scholar]
- 11.Tarp J, Hansen BH, Fagerland MW, Steene-Johannessen J, Anderssen SA, Ekelund U. Accelerometer-measured physical activity and sedentary time in a cohort of US adults followed for up to 13 years: the influence of removing early follow-up on associations with mortality. Int J Behav Nutr Phys Act. 2020;17(1):39. [DOI] [PMC free article] [PubMed] [Google Scholar]
- 12.Galan-Mercant A, Cuesta-Vargas AI. Clinical frailty syndrome assessment using inertial sensors embedded in smartphones. Physiol Meas. 2015;36(9):1929–42. [DOI] [PubMed] [Google Scholar]
- 13.Razjouyan J, Naik AD, Horstman MJ, Kunik ME, Amirmazaheri M, Zhou H, et al. Wearable Sensors and the Assessment of Frailty among Vulnerable Older Adults: An Observational Cohort Study. Sensors (Basel). 2018;18(5):1336. [DOI] [PMC free article] [PubMed] [Google Scholar]
- 14.Troiano RP, Berrigan D, Dodd KW, Masse LC, Tilert T, McDowell M. Physical Activity in the United States Measured by Accelerometer. Med Sci Sports Exerc. 2008;40(1):181–8. [DOI] [PubMed] [Google Scholar]
- 15.Matthews CE. Calibration of Accelerometer Output for Adults. Med Sci Sports Exerc. 2005;37(11):S512–S22. [DOI] [PubMed] [Google Scholar]
- 16.Matthews C, Keadle S, Berrigan D, Staudenmayer J, Saint-Maurice P, Troiano RP, et al. Influence of accelerometer calibration approach on MVPA estimates for adults. Journal of Physical Activity & Health. 2018;15(10):S109–S. [Google Scholar]
- 17.National Cancer Institute Epidemiology and Genetics Research Branch. SAS Code: Healthy Eating Index 2005. Rockville, MD: National Cancer Institute; [cited 2019 03/11/2019]. Available from: https://epi.grants.cancer.gov/hei/sas-code.html. [Google Scholar]
- 18.Arias E, Heron M, Hakes J. The Validity of Race and Hispanic-origin Reporting on Death Certificates in the United States: An Update. Vital Health Stat 2. 2016(172):1–21. [PubMed] [Google Scholar]
- 19.National Center for Health Statistics. The linkage of National Center for Health Statistics Survey Data to the National Death Index — 2015 Linked Mortality File (LMF): Methodology overview and analytic considerations. Hyattsville, MD: 2018. [Google Scholar]
- 20.Cowper DC, Kubal JD, Maynard C, Hynes DM. A primer and comparative review of major US mortality databases. Ann Epidemiol. 2002;12(7):462–8. [DOI] [PubMed] [Google Scholar]
- 21.Blodgett J, Theou O, Kirkland S, Andreou P, Rockwood K. The association between sedentary behaviour, moderate-vigorous physical activity and frailty in NHANES cohorts. Maturitas. 2015;80(2):187–91. [DOI] [PubMed] [Google Scholar]
- 22.Lee IM, Shiroma EJ. Using accelerometers to measure physical activity in large-scale epidemiological studies: issues and challenges. Br J Sports Med. 2014;48(3):197–201. [DOI] [PMC free article] [PubMed] [Google Scholar]
- 23.Jefferis BJ, Parsons TJ, Sartini C, Ash S, Lennon LT, Papacosta O, et al. Objectively measured physical activity, sedentary behaviour and all-cause mortality in older men: does volume of activity matter more than pattern of accumulation? Br J Sports Med. 2018;doi: 10.1136/bjsports-2017-098733. [DOI] [PMC free article] [PubMed] [Google Scholar]
- 24.Diaz KM, Howard VJ, Hutto B, Colabianchi N, Vena JE, Safford MM, et al. Patterns of Sedentary Behavior and Mortality in U.S. Middle-Aged and Older Adults: A National Cohort Study. Ann Intern Med. 2017;167(7):465–75. [DOI] [PMC free article] [PubMed] [Google Scholar]
- 25.Saint-Maurice PF, Troiano RP, Bassett DR Jr, Graubard BI, Carlson SA, Shiroma EJ, et al. Association of Daily Step Count and Step Intensity With Mortality Among US Adults. JAMA. 2020;323(12):1151–60. [DOI] [PMC free article] [PubMed] [Google Scholar]
- 26.Fishman EI, Steeves JA, Zipunnikov V, Koster A, Berrigan D, Harris TA, et al. Association between Objectively Measured Physical Activity and Mortality in NHANES. Med Sci Sports Exerc. 2016;48(7):1303–11. [DOI] [PMC free article] [PubMed] [Google Scholar]
- 27.Andersen LB. Relative risk of mortality in the physically inactive is underestimated because of real changes in exposure level during follow-up. Am J Epidemiol. 2004;160(2):189–95. [DOI] [PubMed] [Google Scholar]
- 28.Saint-Maurice P, Sampson JN, Keadle SK, Willis EA, Troiano RP, MC E. Reproducibility of Accelerometer and Posture-Derived Measures of Physical Activity. Med Sci Sports Exerc. 2020; 52(4):876–83. [DOI] [PMC free article] [PubMed] [Google Scholar]
- 29.Keadle SK, Shiroma EJ, Kamada M, Matthews CE, Harris TB, Lee IM. Reproducibility of Accelerometer-Assessed Physical Activity and Sedentary Time. Am J Prev Med. 2017;52(4):541–8. [DOI] [PMC free article] [PubMed] [Google Scholar]
- 30.Doherty A, Jackson D, Hammerla N, Plötz T, Olivier P, Granat MH, et al. Large Scale Population Assessment of Physical Activity Using Wrist Worn Accelerometers: The UK Biobank Study. PLoS One. 2017;12(2):e0169649. [DOI] [PMC free article] [PubMed] [Google Scholar]
- 31.The German National Cohort: aims, study design and organization. Eur J Epidemiol. 2014;29(5):371–82. [DOI] [PMC free article] [PubMed] [Google Scholar]
- 32.Patel AV, Jacobs EJ, Dudas DM, Briggs PJ, Lichtman CJ, Bain EB, et al. The American Cancer Society’s Cancer Prevention Study 3 (CPS-3): Recruitment, study design, and baseline characteristics. Cancer. 2017;123(11):2014–24. [DOI] [PubMed] [Google Scholar]
Associated Data
This section collects any data citations, data availability statements, or supplementary materials included in this article.
Supplementary Materials
Supplemental Digital Content Text 1: Frailty Index Calculations
Supplemental Digital Content Figure 1. MVPA2020 and mortality—increasing follow-up
Supplemental Digital Content Figure 2. MVPA2020 and mortality—increasing adjustment for poor health
Supplemental Digital Content Figure 3. MVPA2020 and mortality—increasing adjustment for poor health, by age
Supplemental Digital Content Figure 4. MVPA2020 and mortality—excluding early deaths