

Abstract
Aggressive form of neuroblastoma (NB) is a malignant childhood cancer derived from granule neuron precursors and sympatho-adrenal lineage with N-MYC amplification. An insulinoma associated-1 (INSM1) transcription factor has emerged as a NB biomarker that plays critical role in facilitating tumor cell growth and transformation. N-myc activates INSM1 in NB was discovered. In order to elucidate the signaling pathways associated with INSM1 expression and NB tumor cell growth, we developed an INSM1 promoter-driven luciferase assay for new drug discovery. Promoter-driven luciferase assay demonstrated high Z’ factor (>0.7). Performance measures using signal-to-noise ratio, signal window, and Z’ factor confirmed this assay is a robust screening method. A panel of FDA-approved oncology drugs set (147 compounds) was subjected to the INSM1 promoter-driven luciferase assay. The positive-hit compounds were validated for effects on cell viability and INSM1 expression. Screening a FDA-approved oncology drugs set revealed multiple inhibitors against various signaling pathways via suppression of INSM1 promoter activity. The positive-hit compounds consist of 9 signaling pathway inhibitors negatively regulates INSM1 expression and cell viability in NB. These inhibitors target DNA/RNA/protein synthesis, tubulin assembly, and histone deacetylase signaling pathways. The outcome of this assay indicates that the newly identified pathways could be critical for NB growth and transformation. This technology and the positive-hits of multiple pathways represent a promising option of identifying re-purposed FDA-approved drugs valuable for NB treatment in the context of a NB-specific marker, INSM1.
Keywords: INSM1, neuroblastoma, promoter-driven, targeting, signaling pathway
1. Introduction
NB accounts for 50% of all cancer in infants making it the most common tumor in infants younger than 1 year. It accounts for about 6-7% of all cancers in children. NB is the most common cancer in babies and the third-most common cancer in children after leukemia (26%) and brain cancer (21%). There are about 800 new cases of NB each year in the United States. The average age of children when they are diagnosed is about 1 to 2 years. Nearly 90% of cases are diagnosed by age 5 (key statistics from American Cancer Society). Human NB is the most common childhood extracranial tumor arising from the sympathetic nervous system. NB is a type of cancer that forms in certain types of nerve tissue. It most frequently starts from one of the adrenal glands, but can also develop in the neck, chest, abdomen, or spine. Symptoms may include bone pain, a lump in the abdomen, neck, or chest, or a painless bluish lump under the skin. It is also a clinically heterogeneous disease that ranges from spontaneous regression to high-risk stage 4 disease. Treatment and outcomes depend on the risk group to which a patient belongs. Treatments may include observation, surgery, radiation, chemotherapy, or stem cell transplant. In high-risk NB, survival rate is about 40% with a long-term survival rate of only 15%. Therefore, a successful therapeutic strategy for high-risk NB patients represents an unmet societal need.
Insulinoma associated-1 (IA-1 or INSM1) encodes a zinc-finger transcription factor, which was isolated from a human insulinoma subtraction library with specific expression patterns, predominantly in neuroendocrine (NE) tissues and tumors (1). INSM1 plays a key role in sympatho-adrenal lineage and neuroblastoma (NB) tumorigenesis (2,3). Since INSM1 functions as an onco-fetal transcription factor, it is conceivable that INSM1 represents a novel NE-specific tumor marker and a critical regulator of NE cell differentiation (4–7). Recently, INSM1 has emerged as a superior, sensitive, and specific biomarker histologically for NE tumors (8–21). Its functional role in NETs extends both transcriptional regulation and extra-nuclear activities associated with multiple signaling pathways as well as cell cycle regulation (3,22–24). N-myc and/or Ascl1 protein binds to the E2-box of the INSM1 promoter that activates endogenous INSM1 expression. Whereas INSM1 plays a critical role in stabilizing N-myc protein and directly contributes to NB transformation (3). Collectively, a positive-feedback loop of Shh signaling induces INSM1 through N-myc and concurrently INSM1 expression enhances N-myc stability contributing to the transformation of human NB.
Our pilot study revealed that targeting INSM1 promoter activity could be an effective drug screen approach to elucidate novel signaling pathways critical for INSM1 expression and NB tumor cell survival (24). In this study, we established and optimized a robust INSM1 promoter-driven luciferase assay derived from NB cell lines. Using this NB-based screening platform, we screened a pre-selected FDA-approved oncology drugs set and identified 9 signaling pathway inhibitors including Dactinomycin, Plicamycin, Vinblastine Sulfate, Daunorubicin-HCl, Idarubicin-HCl, Mitoxantrone, Romidepsin, Omacetaxine Mepesuccinate, and Panobinostat, critical for NB tumor cell survival. The identified inhibitors act on the DNA/RNA/protein synthesis, tubulin assembly, and histone deacetylase signaling pathways. The targeted interference of these signaling pathways could not only inhibit INSM1 promoter activity, but also disrupt NB tumor cell growth. We performed a cell-viability dosage response analysis to determine the IC50 value of each selected compound. Potentially, this INSM1 promoter-driven luciferase reporter assay represents a valuable approach for identifying re-purposed FDA-approved drugs beneficial for NB cancer patients.
2. Materials and methods
2.1. Construction of INSM1 promoter-driven luciferase vector and generation of stably transfected NB cell line.
We previously established two stable cell lines in BE2-M17 and IMR-32 containing an INSM1 promoter-driven luciferase reporter gene (24). Briefly, a 467-bp DNA fragment comprising an INSM1 promoter (−426/+40 bp) was cloned into the XhoI and HindIII sites of pGL4.18 [luc2/Neo] expression vector. pGL4.18 INSM1p-[luc2/Neo] vector was linearized using a restriction enzyme Sal I digestion and transfected into BE2-M17 or IMR-32 NB cell line. BE2-M17 and IMR-32 cells were obtained from American Type Culture Collection (ATCC, Manassas, VA). Cells were cultured in RPMI 1640 medium supplemented with 10% fetal bovine serum (Atlanta Biological Inc, Flowery Branch, GA USA), 1x penicillin/streptomycin in 5% CO2 incubator at 37 °C. The transfected cells were selected with Neomycin (G418, 400 μg/ml) for 2-3 weeks. Luciferase activity from stably transfected cell line was measured using Steady-Luc Firefly HTS assay kit (Biotium, Inc. Fremont, CA USA).
2.2. Western blot analyses.
Cell lysates were extracted with lysis buffer (10 mM Tris-HCl, pH 7.5, 150 mM NaCl, 10% glycerol, 1% Triton X-100, 1 mM dithiothreitol, 0.2 mM phenylmethylsulfonyl fluoride, 1 μg/ml of aproptinin, 1 μg/ml of leupeptin, 1 mM Na3VO4, and 5 mM NaF) and separated by SDS-PAGE. The electrophoresed proteins were electro-transferred onto a nitrocellulose membrane (Bio-Rad Laboratories Inc., Hercules, CA USA) for Western blotting analyses. The membrane was blocked with 5% non-fat dry milk in TBST (20 mM Tris-HCl, pH 7.6, 137 mM NaCl, and 0.1% Tween 20), probed with the indicated primary antibody at 4 °C overnight, and bound with horseradish peroxidase-conjugated secondary antibody at room temperature for 1 h. The blot was developed with chemi-luminescence substrate (Bio-Rad) under X-ray film (Fuji Photo Film Co., Japan). The same blot was stripped and re-probed with control antibody.
2.3. Inter-plate and inter-day test.
To assess the plate uniformity and quality control in our assay, the inter-plate and inter-day test was examined with 3 plates per day for 2 days. The variability tests were conducted on 3 types of signals on each plate including maximum (Max), medium (Mid), and minimum (Min, background) signals. The wells in the 3 plates tested at the same day were arranged with 3 different plate layouts. The treatment order on plate 1 was columns 1, 3, and 5 with Min, Mid, and Max treatment and repeated 4 times throughout the last column. The order on plate 2 was Mid-Max-Min, whereas the third plate was Max-Min-Mid. To obtain the Min (background) signals, the wells were plated with wild type BE2-M17 cells with 0.1% DMSO. The other wells were plated with genetic engineered BE2-M17 cells with 0.1% DMSO to obtain the Max signals or treated with 0.75 μM 5’-iodotubercidin (5’-IT) (Sigma, St. Louis MO USA) for Mid signals.
2.4. Statistical analysis.
Data from each experiment were collected from at least three times, each with at least 6 replicates to achieve the quality requirements and acceptance criteria. The QC parameters used in this study to analyze the results are signal-to-noise (S/N), signal window (SW) and Z’-factor (25).
Signal-to-noise were calculated as
SW and Z’-factors were determined as:
The acceptance criteria for intra-plate tests are based on the coefficient of variation (CV) of the means for each signal (Max, Mid, and Min). CV was calculated as: .
The calculation used in controls-based normalization method is normalized percent inhibition (NPI).
2.5. INSM1p-driven luciferase assay using oncology drugs set.
INSM1p-luc2 transfected BE2-M17 and IMR-32 cell-based reporter assays were subjected to a FDA-approved oncology drugs set (AOD IX) obtained from the NCI Developmental Therapeutic Program’s Open Compound Repository (USA). The primary screen used two drug concentrations (1 and 10 μM) to test their inhibitory effects on INSM1 promoter activity after 24 h treatment. The cut-off line for inhibition of INSM1 promoter activity was arbitrarily set on 75% inhibition.
2.6. Cell viability assay.
MTS cell proliferation assay was carried out according to the manufacturer’s protocol (Abeam, Cambridge, MA USA). In brief, each group of cells were treated with the indicated concentration (1 or 10 μM) of compounds for 48 h. Treated cells were collected and incubated in medium containing 20 μl of MTS assay reagent at 37 °C for 4 h. The assay was read at absorbance (490 nm) using a 96-well plate spectrophotometer.
3. Results
3.1. Establish an INSM1 promoter-driven luciferase reporter in NB and assay development.
INSM1 promoter (−426/+40 bp) was cloned into a pGL4.18-[luc2/Neo] vector and transfected into NB tumor cells (BE2-M17, IMR-32) with G418 selection for 2-3 weeks (24). The luciferase activity from stably transfected cell line (SC) reflects the strength of INSM1 promoter activity and protein expression levels in each cell line (Fig. 1A and B). IMR-32 expresses particularly strong INSM1 protein and luciferase activity. The non-transfected wild-type parental line (P) was used as a negative luciferase control. Our study consists of a two-step approach. First, we focus on assay development, optimization, quality control, plate uniformity, and signal variability assessment in this INSM1p-targeted luciferase assay derived from NB. Second, we screen a pre-selected FDA-approved oncology drugs set.
Fig. 1. Luciferase expression in genetically engineered NB stable cell lines and the effects of seeding density on luciferase signal and background.
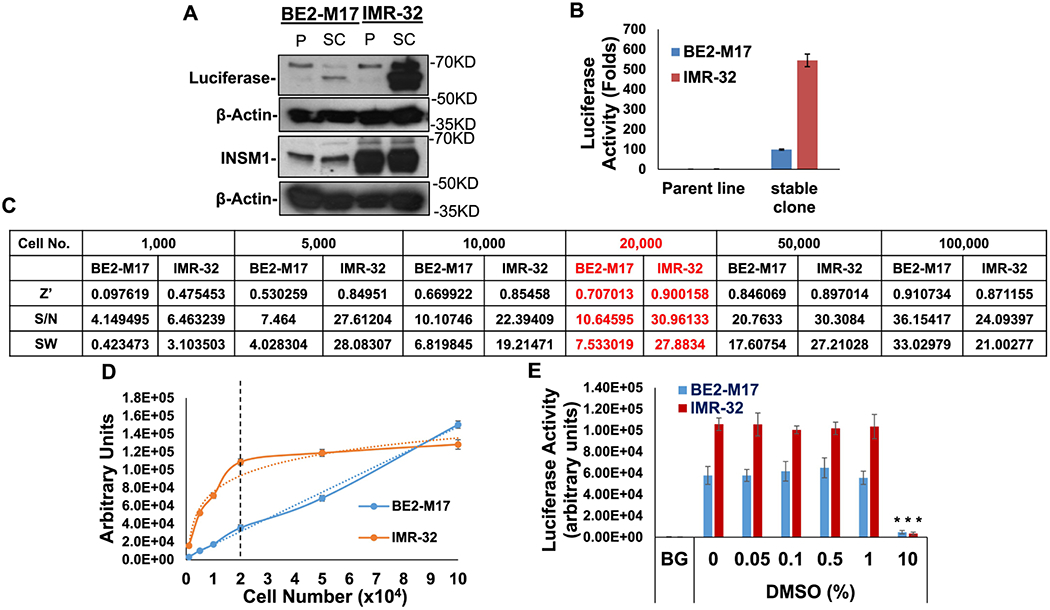
(A) Western blot analyses of firefly luciferase under the control of INSM1-promoter and the endogenous INSM1 expression in both parental (P) and genetically engineered BE2-M17 and IMR-32 NB stable clone (SC). (B) Luciferase activity was measured as folds induction of luciferase activity as compared with the parental cells (no luciferase activity). Results are means ± SD from 3 experiments and each experiment consists of 8 replicates. (C) INSM1-promoter-luc2 transfected stable lines or wild type BE2-M17 or IMR-32 cells were seeded in 96-well plates by the indicated seeding density from 1,000 to 100,000 cells/well. Z’ factor, S/N, or SW from each seeding density was calculated. Results are shown as means ± SD. Each sample was derived from 6 replicates. (D) The cell numbers (x 104) versus luciferase signals (arbitrary units) are shown. Dotted line intersects at 20,000 cells. (E) DMSO compatibility assay. Stably transfected BE2-M17 or IMR-32 were seeded (20,000 cells/well) in a 96-well plate for 16 h, then treated with indicated concentration of DMSO (0-10%) for additional 24 h. The result expresses as means ± SD, each set consisted of 8 replicates. ***, p ≤ 0.001.
3.2. Performance measures.
The assay’s performance measures were determined as follow: Seeding density (BE2-M17 or IMR-32) was tested using 1,000 to 100,000 cells/well in a 96-well plate (Fig. 1C). Luciferase activities were found to increase in a cell number-dependent manner in both cell lines. In order to determine the proper cell seeding density, we examined each cell seeding with signal-to-noise ratio (S/N), signal window (SW), and Z’ factor. Luminescence intensity showed in proportionally increase to cell number in INSM1-promoter-luc2 cell lines. The luminescence signals of INSM1-promoter-luc2 IMR-32 stable cell line increased in proportion to cell numbers while the seeding density ≤20,000 cells/well. The luminescence intensity reached a plateau when the seeding density >20,000 cells per well in IMR-32 stable cells. The increased luminescence signal intensity correlates to seeding cell numbers (≤20,000) (Fig 1D). According to the luminescence signal intensity, the S/N, SW, and Z’-factor results, the suitable seeding density for INSM1-promoter-luc2 IMR-32 cell line should be around 20,000 cells per well in 96-well plate when the luciferase activity achieves the robust level with the best statistical analysis. In contrast, INSM1-promoter-luc2 BE2-M17 cells exhibited the strongest luminescence signal at 100,000 cells/well. Since this cell-based reporter assay was developed to screen the potential inhibitors and the screening procedure takes at least 48 hours after cell seeding, the cell doubling time should also be taken into consideration. The doubling time of INSM1-promoter-luc2 BE2-M17 is 18 h versus 80 h for IMR-32 cells, thus 20,000 cells/well seeding density was chosen to conduct further assays. Assay plates were validated using Z’ factor (25). An assay plate with a Z’ factor >0.4 was considered appropriately robust for screening. In our pilot screening, we showed our assay with a Z’ factor of >0.8 and was considered an appropriately robust screening.
3.3. Solvent compatibility.
The cell-based assay is established for screening the small molecule suppressing INSM1 promoter activity. Test compounds or chemical libraries are typically stored in DMSO, thus solvent-compatibility of assay reagent needs to be configured. DMSO concentration from 0-10% were tested. The results showed that BE2-M17 or IMR-32 cell-based assay was tolerable to DMSO (1%) with no significant effect. However, 10% DMSO solvent itself has significant inhibitory effect on INSM1 promoter activity (Fig. 1E).
3.4. Plate uniformity and signal variability assessment of INSM1-promoter-lnc2 BE2-M17 cell-based assay.
To optimize the quality of assay protocol in a 96-well plate format, we examined the signal and plate acceptance criteria using six plates performed in two separate days. Three plates were assessed per day with three types of plate layouts. The layouts have a combination of wells producing Max (H), Mid (M) and Min (L) signals on a plate with proper statistical design. The cells on those wells producing “Max” signal were treated with DMSO only, and the wells for “Min” signal were seeded with wild-type BE2-M17 cells (no luciferase reading) and DMSO treatment. In the “Mid” signals, INSM1-promoter-luc2 cells were treated with 0.75 μM 5’-IT. After 24 h treatment, the signals were examined using BioTek Synergy HT reader. For spatial uniformity assessment, the Max and Mid signals were used to determine the drift effect. Overall, the drift of Max and Mid in all six plates were <5% with no significant drift effect (>20%). For examples, in the plate 1-day 1 reading, the drift of Max was only 0.257% [(71449.8-71264.2)/72271.5] and the drift of Mid was 2.74% [(36658.6-35673.9)/35934.5], The scatter dot plate shows no significant edge effect (Fig. 2A and B). The results of the intra-plate test showed that CVmax, CVmid, and CVmin of the plates were all <20%, all the SW were >10, and Z’ factor were above or near 0.8, which are far more superior to the recommended acceptance criteria (Z’ ≥ 0.4 and SW ≥ 2). The Mid signal showed the luciferase activity treated with 0.75 μM 5’-IT. In our previous study, we demonstrated that 5’-IT inhibited INSM1 promoter activity thus the IC50 dosage (0.75 μM) of 5’-IT treatment was chosen as Mid signals (24). Normalized percent inhibition (NPI) of each plate compared to each other showed no significant differences. The normalized average Mid-signal did not translate into a fold shift. The lowest to the highest inhibition activities were 50.278-63.495 %. The results passed the criteria of inter-plate and inter-day tests, which do not exceed 2-folds difference of Mid-signals between plates and days. (Fig. 2C).
Fig. 2. Plate uniformity and signal variability assessment of INSM1p-luc2 engineered BE2-M17 assay.

(A, B) A scatter plot represents the result of the first plate of day1 and the signals of each well ordered by row first then by column (left) and by column first, then by row (right). Max signals were obtained with 0.1% DMSO; Mid signals were obtained with 0.75 μM 5’-Iodotubercidin (5’-IT); and wild-type BE2-M17 cells were seeded in the Min signal with 0.1% DMSO. BE2-M17 cells were seeded in a 96-well plate for 16 h and treated with 0.1% DMSO or 5’-IT for additional 24 h. (C) The inter-plate and inter-day tests on 6 plates showed no drift effect in the intra-plate tests and was stable with no significant shift across plates or days. The scatter dot plate shows no significant edge effect.
3.5. FDA-approved oncology drugs screen using INSM1p-luc2 engineered BE2-M17 and IMR-22 stable lines.
INSM1p-luc2 engineered BE2-M17 and IMR-32 stable lines were subjected to a FDA-approved oncology drugs set (AOD IX, total 147 compounds) screening. The primary screen was conducted using a high (10 μM) or a low (1 μM) concentration of compound treatment in both INSM1p-luc2 engineered BE2-M17 and IMR-32 cells for 24 h. The cut off line for INSM1 promoter inhibition was arbitrarily set at 75%. Seventeen compounds show ≥ 75% inhibition of INSM1 promoter activity in both cell lines at high concentration, whereas 5 compounds remain with ≥ 75% inhibition of INSM1 promoter activity at low concentration (Fig. 3). A robust Z’ factor value shows in IMR-32 (Z’=0.767) and BE2-M17 (Z’=0.771) at 10 μM versus IMR-32 (Z’=0.705) and BE2-M17 (Z’=0.654) at 1 μM concentration, respectively. These compounds were identified for their targeted interference of different signaling pathways including inhibitors for DNA/RNA/protein replication/synthesis (# 7, 15, 59, 111), tubulin assembly (# 25), topoisomerase (# 33, 42, 54, 57, 65), tyrosine kinase (# 93), histone deacetylase (# 95, 118), and serine/threonine kinase (# 104, 133, 137 147) signaling pathways. In order to distinguish that the inhibition of INSM1 promoter activity was not due to the decreased cell number, the luciferase activity was normalized with cell number in a shorter time (8 h) assay instead of a regular treatment assay (24 h). It was known that suppression of INSM1 protein expression would eventually affect the NB tumor cell survival (3). The cell number was calibrated according to the cell viability OD490 reading with R2 = 0.9912 (Fig. 4A, inset). Clearly, the shorter time treatment results specific INSM1 promoter inhibition independent of cellular cytotoxicity in the majority of compound treatment. This result indicates that our INSM1 promoter-driven assay is specific for identifying compound targeting INSM1 promoter activity, which may subsequently kill NB tumor cells via differential signaling pathway interference. Further viability analyses of these 17 inhibitors at high and low concentrations revealed that although high concentration shows at least 50-75% cytotoxicity, the killing effect is potentially due to the non-specific high dose (10 μM) toxicity effect on cell survival. Thus, we chose a cut off line of 50% viability inhibition (green line) at low (1 μM) concentration treatment as selection criteria (Fig. 4B). There are 9 compounds including Dactinomycin (#7), Plicamycin (#15), Vinblastine Sulfate (#25), Daunorubicin-HCl (#33), Idarubicin-HCl (#54), Mitoxantrone (#57), Romidepsin (#95), Omacetaxine Mepesuccinate (#111), and Panobinostat (#118) show less than 50% viability upon 1 μM treatment, suggesting these compounds inhibit signaling pathway critical for the survival of NB tumor cell growth (Table 1). Therefore, these 9 compounds warrant further investigation for inhibition of INSM1 expression and NB tumor cell survival.
Fig. 3. A FDA-approved oncology drugs screen using INSM1p-luc2 engineered BE2-M17 and IMR-32 stable lines.

A pre-selected oncology drugs set was subjected to BE2-M17-based and IMR-32-based INSM1p-luc2 screening platforms. (A) 10 μM (Z’=0.771; Z’=0.767) or (B) 1 μM (Z’=0.654; Z’=0.705) of each compound (compound number, total 147 compounds) was added to the screening platform for 24 h. The data was presented as percentage of 0.1% DMSO (control, 100%) luciferase activity. An arbitrary cut off line (green line) was set at 25% of relative INSM1p activity (75% inhibition). Green arrow indicates compound showing ≥ 75% inhibition.
Fig. 4. Short-term (8 h) treatment of INSM1 promoter activity and cell viability assays.

(A) Seventeen compounds (10 μM) showed greater than 75% inhibition of INSM1 promoter activity (24 h) were subjected to a short-term (8 h) treatment assay normalized by cell number in stably transfected BE2-M17. Either 1 μM or 10 μM concentration was employed in both short-term INSM1 promoter and viability assays. The cell number was determined by viability OD490 reading with R2 = 0.9912 (inset). (B) BE2-M17 cells were treated with 17 compounds (10 μM and 1 μM) as compared with 0.1% DMSO control for 48 h in a cell viability assay. A cut offline (green line) shows 9 compounds below 50% cell viability (green arrow).
Table 1.
Compounds selected for viability dose-response assay and their biological functions
| Comp. # | Name | Targeted Interference of Signaling Pathway and Cancer Treatment | Ref. |
|---|---|---|---|
| 7 | Dactinomycin | Also known as actinomycin D preventing RNA elongation, used to treat Wilms tumor, rhabdomyosarcoma, Ewing’s sarcoma, trophoblastic neoplasm, testicular cancer, and certain types of ovarian cancer. | 29 |
| 15 | Plicamycin | RNA synthesis inhibitor, used to treat testicular cancer, Paget’s disease of bone. | 30 |
| 25 | Vinblastine Sulfate | Binding to tubulin to inhibit the assembly of microtubules and inhibit proper formation of mitotic spindle, used to treat Hodgkin’s lymphoma, NSCLC, bladder cancer, brain cancer, melanoma, and testicular cancer. | 31 |
| 33 | Daunorubicin-HCl | Daunorubicin exhibits cytotoxic activity through topoisomerase-mediated interaction with DNA, thereby inhibiting DNA replication, repair, RNA, and protein synthesis, used to treat AML, ALL, chronic myelogenous leukemia (CML), and Kaposi’s sarcoma. | 32 |
| 54 | Idarubicin-HCl | Insert into DNA and interfere Topoisomerase II function, It is an anthracycline anti-leukemic drug. | 32 |
| 57 | Mitoxantrone | Topoisomerase II inhibitor, used to treat metastatic breast cancer, acute myeloid leukemia, and non-Hodgkin’s lymphoma | 32 |
| 95 | Romidepsin | Natural product histone deacetylase inhibitor, used in cutaneous T-cell lymphoma (CTCL) and peripheral T-cell lymphomas (PTCLs) | 33 |
| 111 | Omacetaxine Mepesuccinate (Homoharringtonine) | Natural extract, initial step of protein translation inhibitor, it inhibits protein translation by preventing the initial elongation step of protein synthesis, for the treatment of adult patients with chronic myeloid leukemia (CML) with resistance and/or intolerance to two or more tyrosine kinase inhibitors | 34 |
| 118 | Panobinostat | Non-selective pan-histone deacetylase inhibitor (hydroxamic acid), FDA approval for use in patients with multiple myeloma | 35 |
3.6. Dosage response analyses.
We performed a cell-viability dosage response analyses of 9 compounds that show at least 50% inhibition of NB cell viability at 1 μM concentration. The IC50 value was calculated as dose inhibition of 50% of cell viability, which displays in a range of 29.25-831.48 nM with the most inhibitory effect on NB cell viability using Dactinomycin (#7, IC50=29.25) and Omacetaxine Mepesuccinate (#111, IC50=34.22) (Fig 5A–I). We further examined whether the treated BE2-M17 or IMR-32 cells with 1 μM of each compound for 48 h could down regulate INSM1 and/or N-myc protein expression. In BE2-M17 cells, #25, #33, or #57 are less effective in INSM1 expression, which are also consistently less effective for #33, #54, or #57 in N-myc expression. Similarly, IMR-32 cells show less effective for #25 or #57 in INSM1 and N-myc expression suggesting that #25 or #57 signaling inhibition may not affect INSM1 and N-myc expression directly. Other compounds exhibit either strong or moderate inhibition of INSM1 and N-myc protein expression supporting these compounds could interrupt signaling pathways through modulation of INSM1 and N-myc signaling pathway transcriptional loop. Particularly, inhibitors acting on RNA/protein synthesis (#7, #15, and #111) and histone deacetylase (#95 and #118) demonstrated strong inhibition of INSM1 and N-myc protein expression (Fig. 6A). Furthermore, we examined the phosphorylation patterns of AKT and GSK3β upon compound treatment (Fig. 6B). Compound #111 shows the most potent AKT phosphorylation inhibition in contrast to other compounds. Most of the compounds except #25 show suppression of GSK3β phosphorylation. Since the treated compound targets different signaling pathway, it is anticipated that in addition to phosphor-AKT/ -GSK3β pathway other signaling pathways may involve in the process of INSM1 protein expression.
Fig. 5. Determine IC50 from cell-viability dosage response analyses.

BE2-M17 cells were treated with indicated concentrations of (A) Dactinomycin, (B) Plicamycin, (C) Vinblastine Sulfate, (D) Daunorubicin, (E) Idarubicin, (F) Mitoxantrone, (G) Romidpsin, (H) Omacetaxine Mepesuccinate, and (I) Panobinostat for 48 h in a cell viability assay. IC50 value of each compound was calculated for 50% inhibition of cell viability.
Fig. 6. Western blot analyses of INSM1 and N-myc protein expression in NB cells treated with 9 signaling pathway inhibitor individually.


(A) BE2-M17 or IMR-32 cells were treated with indicated signaling pathway inhibitor (1 μM) as compared with DMSO control for 48 h before subjected to INSM1 and N-myc Western blot analyses. Relative expression of INSM1 and N-myc protein level from each compound treatment were repeated three times as normalized with GAPDH as loading control. (B) Expression ratio of phosphor-AKT/AKT and phosphor-GSK3β/GSK3β were examined upon each compound treatment for 48 h in BE2-M17 NB cells.
4. Discussion
The cause of NB remains elusive; however, the amplification of N-MYC occurred in roughly 30% of NB patients, which strongly correlated with advanced stage of disease and poor outcome (26–28). We discovered that N-myc targets INSM1 gene, a transcriptional suppressor of NE tumors. INSM1 modulates the PI3K/AKT/GSK3β signaling pathway through a positive-feedback loop resulting in stabilization of the N-myc protein (3). Thus, INSM1 emerges as a critical player closely associated with N-myc in facilitating NB cell growth and transformation (24). Our study specifically designed to target and treat N-MYC amplified high-risk NB patients. An INSM1 promoter-driven luciferase screening-platform should provide a valuable means to target signaling pathways critical for NB cell growth and transformation.
In this study, we screened a FDA-approved oncology drugs set (147 compounds) using BE2-M17 and IMR-32 based INSM1 promoter-driven reporter assays. Seventeen compounds (treated with 10 μM concentration) show ≥ 75% inhibition of INSM1 promoter activity, whereas 5 compounds remain strong inhibition (≥ 75%) at low concentration (1 μM). Our assay measures luciferase activity reflecting total cell numbers and the expression of INSM1 promoter activity. In order to distinguish between off-target cytotoxic effect and specific INSM1 promoter inhibition, a shorter time (8 h) treatment of the 17 selected compounds from primary screen were further evaluated for their INSM1 promoter inhibition normalized with corresponding cell number. The result shows that inhibition of INSM1 promoter activity can be achieved at a shorter treatment time (8 h) without reducing the cell number suggesting detection of INSM1 promoter activity is more sensitive than cell viability measurement. Since using high concentration (10 μM) may pose direct off-target cytotoxicity to NB cells, we further selected compound exhibits greater than 50% killing effect at a lower concentration (1 μM). There are 9 compounds were selected for further measurement of their IC50 value in NB. These 9 compounds and their biological functions are: Dactinomycin (#7) known as actinomycin D is a toxic compound inhibits RNA elongation, a potent inducer of apoptosis, and inhibits growth of pancreatic cancer cells (29). Plicamycin (#15) is a RNA synthesis inhibitor. Plicamycin has potent anti-tumor effects in vitro and has been evaluated in long-term follow-up of stage III testicular carcinoma (30). Vinblastine Sulfate (#25) binds to tubulin to inhibit the assembly of microtubules and inhibits proper formation of mitotic spindle (31). Daunorubicin-HCl (#33), Idarubicin-HCl (#54), and Mitoxantrone (#57) belong to topoisomerase inhibitors exhibiting cytotoxic activity through topoisomerase-mediated interaction with DNA, inhibiting DNA replication, RNA, and protein synthesis (32). Romidepsin (#95) is a natural product of histone deacetylase inhibitor that entered the phase II multi-institutional trial as monotherapy for patients with cutaneous T-cell lymphoma (33). Omacetaxine Mepesuccinate (#111) derived from natural extract, is an inhibitor for the initial elongation step of protein translation widely used for myeloid hematological malignancies (34). Panobinostat (#118) is a non-selective pan-histone deacetylase inhibitor tested with high-risk acute myeloid leukemia (35). Interestingly, #7, #15, #33, #54, #57, and #111 are inhibitors acting on DNA/RNA/protein replication/synthesis and topoisomerase action. Topoisomerases are enzymes that participate in the over-winding or under-winding of DNA. Inhibitor interferes topoisomerase function interrupting DNA replication and transcription. Compound #25 belongs to the inhibitor acting on tubulin assembly pathway. It has entered the clinical trials for stage 4 NB patients (31). Since INSM1 plays a critical role downstream of N-myc protein and NB transformation (3), it is reasonable to speculate that these compounds should suppress NB cell survival. Two histone deacetylase inhibitors (Romidepsin #95, Panobinostat #118) demonstrated strong INSM1 promoter and cell viability inhibition (> 70%) at 1 μM concentration suggesting that epigenetic histone modification is critical for INSM1 expression and NB tumor cell survival. Our previous study revealed that another pan-histone deacetylase inhibitor, Trichostatin A down regulates INSM1 promoter activity and NB survival (24). Majority of these 9 compounds have already entered the clinical trials against various cancers including Hodgkin’s lymphoma, non-small cell lung carcinoma, bladder cancer, brain cancer, melanoma, testicular cancer, cutaneous T-cell lymphoma, acute myeloid leukemia, chronic myeloid leukemia, and multiple myeloma (Table 1). Therefore, the INSM1 promoter-driven reporter assay could serve as a valuable tool for dissecting critical signaling pathways valuable for interrupting NB tumor cell growth. Moreover, a combination of multiple signaling inhibitors targeting INSM1 should be a novel strategy for the treatment of high-risk NB patients.
5. Conclusions
An INSM1 promoter-driven luciferase assay derived from NB was developed for new drug discovery. A panel of FDA-approved oncology drugs set (147 compounds) screen revealed 9 positive-hit compounds that demonstrated inhibition of INSM1 promoter activity and NB tumor cell survival. The NB-based assay platform and the positive-hits of multiple pathways represent a promising option of identifying re-purposed FDA-approved drugs valuable for NB treatment in the context of aNB-specific marker, INSM1.
Highlights.
A robust INSM1 promoter-driven luciferase assay was developed to screen new drugs for NB treatment.
Nine positive-hit compounds from a FDA-approved oncology drugs set were identified.
These inhibitors target DNA/RNA/protein synthesis, tubulin assembly, and histone deacetylase signaling pathways.
This technology presents a promising option of identifying re-purposed FDA-approved drugs valuable for NB treatment in the context of a NB-specific marker, INSM1.
Acknowledgments:
The FDA-approved oncology drugs set (AOD IX) was provided by the Drug Synthesis and Chemistry Branch, Developmental Therapeutics Program, Division of Cancer Treatment and Diagnosis, National Cancer Institute, USA.
Funding: This work was supported by National Cancer Institute, National Institutes of Health, USA, Grant CA218764 (to MSL).
Abbreviations
- NB
neuroblastoma
- INSM1
insulinoma associated-1
- S/N
signal to noise
- SW
signal window
- NE
neuroendocrine
- NET
neuroendocrine tumor
- FDA
food and drug administration
- SDS-PAGE
sodium dodecyl sulfate polyacrylamide gel electrophoresis
- HDAC
histone deacetylase
- Max
maximum
- Mid
medium
- Min
minimum
- CV
coefficient of variation
- NPI
normalized percent inhibition
- 5’-IT
5’-iodotubercidin
- DMSO
dimethyl-sulfoxide
- PMSF
phenylmethylsulfonyl fluoride
- QC
quality control
Footnotes
Publisher's Disclaimer: This is a PDF file of an unedited manuscript that has been accepted for publication. As a service to our customers we are providing this early version of the manuscript. The manuscript will undergo copyediting, typesetting, and review of the resulting proof before it is published in its final form. Please note that during the production process errors may be discovered which could affect the content, and all legal disclaimers that apply to the journal pertain.
Conflict of interest: The authors declare that they have no conflicts of interest with the contents of this article.
References
- 1.Goto Y, DeSilva MG, Toscani A, Prabhakar BS, Notkins AL, and Lan MS (1992) A novel human insulinoma-associated cDNA, IA-1, encodes a protein with zinc-finger DNA-binding motifs. J.Biol.Chem 267, 15252–15257 [PubMed] [Google Scholar]
- 2.Wildner H, Gierl MS, Strehle M, Pla P, and Birchmeier C (2008) Insm1 (IA-1) is a crucial component of the transcriptional network that controls differentiation of the sympatho-adrenal lineage. Development 135, 473–481 [DOI] [PubMed] [Google Scholar]
- 3.Chen C, Breslin MB, and Lan MS (2015) INSM1 increases N-myc stability and oncogenesis via a positive-feedback loop in neuroblastoma. Oncotarget 6, 36700–36712 [DOI] [PMC free article] [PubMed] [Google Scholar]
- 4.Chen C, Notkins AL, and Lan MS (2019) Insulinoma-Associated-1: From Neuroendocrine Tumor Marker to Cancer Therapeutics. Mol Cancer Res 17, 1597–1604 [DOI] [PMC free article] [PubMed] [Google Scholar]
- 5.Fujino K, Motooka Y, Hassan WA, Ali Abdalla MO, Sato Y, Kudoh S, Hasegawa K, Niimori-Kita K, Kobayashi H, Kubota I, Wakimoto J, Suzuki M, and Ito T (2015) Insulinoma-Associated Protein 1 Is a Crucial Regulator of Neuroendocrine Differentiation in Lung Cancer. Am.J.Pathol 185, 3164–3177 [DOI] [PubMed] [Google Scholar]
- 6.Jia S, Wildner H, and Birchmeier C (2015) Insm1 controls the differentiation of pulmonary neuroendocrine cells by repressing Hes1. Dev Biol 408, 90–98 [DOI] [PubMed] [Google Scholar]
- 7.Zhang T, Liu WD, Saunee NA, Breslin MB, and Lan MS (2009) Zinc-finger transcription factor INSM1 interrupts cyclin D1 and CDK4 binding and induces cell cycle arrest. J.Biol.Chem 284, 5574–5581 [DOI] [PMC free article] [PubMed] [Google Scholar]
- 8.Rosenbaum JN, Guo Z, Baus RM, Werner H, Rehrauer WM, and Lloyd RV (2015) INSM1: A Novel Immunohistochemical and Molecular Marker for Neuroendocrine and Neuroepithelial Neoplasms. Am.J.Clin.Pathol 144, 579–591 [DOI] [PubMed] [Google Scholar]
- 9.Chen C, Breslin MB, and Lan MS (2016) Ectopic expression of a small cell lung cancer transcription factor, INSM1 impairs alveologenesis in lung development. BMC.Pulm.Med 16, 49. [DOI] [PMC free article] [PubMed] [Google Scholar]
- 10.Doxtader EE, and Mukhopadhyay S (2018) Insulinoma-associated protein 1 is a sensitive and specific marker of neuroendocrine lung neoplasms in cytology specimens. Cancer Cytopathol 126, 243–252 [DOI] [PubMed] [Google Scholar]
- 11.Rooper LM, Sharma R, Li QK, Illei P, and Westra WH (2017) INSM1 Demonstrates Superior Performance to the individual and combined use of Synaptophysin, Chromogranin, and CD56 for Diagnosing Neuroendocrine Tumors of the Thoracic Cavity. Am J Surg Pathol 41, 1561–1569 [DOI] [PubMed] [Google Scholar]
- 12.Dermawan JK, and Mukhopadhyay S (2018) Insulinoma-associated protein 1 (INSM1) differentiates carcinoid tumourlets of the lung from pulmonary meningothelial-like nodules. Histopathology 72, 1067–1069 [DOI] [PubMed] [Google Scholar]
- 13.Kuji S, Watanabe R, Sato Y, Iwata T, Hirashima Y, Takekuma M, Ito I, Abe M, Nagashio R, Omae K, Aoki D, and Kameya T (2017) A new marker, insulinoma-associated protein 1 (INSM1), for high-grade neuroendocrine carcinoma of the uterine cervix: Analysis of 37 cases. Gynecol Oncol 144, 384–390 [DOI] [PubMed] [Google Scholar]
- 14.Tanigawa M, Nakayama M, Taira T, Hattori S, Mihara Y, Kondo R, Kusano H, Nakamura K, Abe Y, Ishida Y, Okabe Y, Hisaka T, Okuda K, Fujino K, Ito T, Kawahara A, Naito Y, Yamaguchi R, Akiba J, Akagi Y, and Yano H (2018) Insulinoma-associated protein 1 (INSM1) is a useful marker for pancreatic neuroendocrine tumor. Med Mol Morphol 51, 32–40 [DOI] [PubMed] [Google Scholar]
- 15.Rooper LM, Bishop JA, and Westra WH (2018) INSM1 is a Sensitive and Specific Marker of Neuroendocrine Differentiation in Head and Neck Tumors. Am JSurg Pathol 42, 665–671 [DOI] [PubMed] [Google Scholar]
- 16.Rush PS, Rosenbaum JN, Roy M, Baus RM, Bennett DD, and Lloyd RV (2018) Insulinoma-associated 1: A novel nuclear marker in Merkel cell carcinoma (cutaneous neuroendocrine carcinoma). J Cutan Pathol 45, 129–135 [DOI] [PubMed] [Google Scholar]
- 17.Ames HM, Rooper LM, Laterra JJ, Eberhart CG, and Rodriguez FJ (2018) INSM1 Expression Is Frequent in Primary Central Nervous System Neoplasms but Not in the Adult Brain Parenchyma. J Neuropathol Exp Neurol 77, 374–382 [DOI] [PMC free article] [PubMed] [Google Scholar]
- 18.Lilo MT, Chen Y, and LeBlanc RE (2018) INSM1 Is More Sensitive and Interpretable than Conventional Immunohistochemical Stains Used to Diagnose Merkel Cell Carcinoma. Am J Surg Pathol 42, 1541–1548 [DOI] [PubMed] [Google Scholar]
- 19.Mukhopadhyay S, Dermawan JK, Lanigan CP, and Farver CF (2019) Insulinoma-associated protein 1 (INSM1) is a sensitive and highly specific marker of neuroendocrine differentiation in primary lung neoplasms: an immunohistochemical study of 345 cases, including 292 whole-tissue sections. Mod Pathol 32, 100–109 [DOI] [PubMed] [Google Scholar]
- 20.Minami K, Jimbo N, Tanaka Y, Ogawa H, Hokka D, Nishio W, Yoshimura M, Itoh T, and Maniwa Y (2020) Insulinoma-associated protein 1 is a prognostic biomarker in pulmonary high-grade neuroendocrine carcinoma. J Surg Oncol [DOI] [PubMed] [Google Scholar]
- 21.McHugh KE, Mukhopadhyay S, Doxtader EE, Lanigan C, and Allende DS (2020) INSM1 Is a Highly Specific Marker of Neuroendocrine Differentiation in Primary Neoplasms of the Gastrointestinal Tract, Appendix, and Pancreas. American journal of clinical pathology 153, 811–820 [DOI] [PubMed] [Google Scholar]
- 22.Liu WD, Wang HW, Muguira M, Breslin MB, and Lan MS (2006) INSM1 functions as a transcriptional repressor of the NeuroD.beta2 gene through the recruitment of cyclin D1 and histone deacetylase. Biochem.J 397, 169–177 [DOI] [PMC free article] [PubMed] [Google Scholar]
- 23.Zhang T, Chen C, Breslin MB, Song K, and Lan MS (2014) Extra-nuclear activity of INSM1 transcription factor enhances insulin receptor signaling pathway and Nkx6.1 expression through RACK1 interaction. Cell Signal. 26, 740–747 [DOI] [PMC free article] [PubMed] [Google Scholar]
- 24.Chen C, Breslin MB, Guidry JJ, and Lan MS (2019) 5’-Iodotubercidin represses insulinoma-associated-1 expression, decreases cAMP levels, and suppresses human neuroblastoma cell growth. J Biol Chem 294, 5456–5465 [DOI] [PMC free article] [PubMed] [Google Scholar]
- 25.Zhang JH, Chung TD, and Oldenburg KR (1999) A Simple Statistical Parameter for Use in Evaluation and Validation of High Throughput Screening Assays. J Biomol Screen 4, 67–73 [DOI] [PubMed] [Google Scholar]
- 26.Brodeur GM, Seeger RC, Schwab M, Varmus HE, and Bishop JM (1984) Amplification of N-myc in untreated human neuroblastomas correlates with advanced disease stage. Science 224, 1121–1124 [DOI] [PubMed] [Google Scholar]
- 27.Look AT, Hayes FA, Shuster JJ, Douglass EC, Castleberry RP, Bowman LC, and al., e. (1991) Clinical relevance of tumor cell ploidy and N-myc gene amplification in childhood neuroblastoma: a pediatric oncology group study. J.Clin.Oncol 9, 581–591 [DOI] [PubMed] [Google Scholar]
- 28.Seeger RC, Brodeur GM, Sather H, Dalton A, Seigel SE, Wong KY, and al. e. (1985) Association of multiple copies of the N-myc oncogene with rapid progression of neuroblastomas. N.Engl.J.Med 313, 1111–1116 [DOI] [PubMed] [Google Scholar]
- 29.Kleeff J, Kornmann M, Sawhney H, and Korc M (2000) Actinomycin D induces apoptosis and inhibits growth of pancreatic cancer cells. International journal of cancer 86, 399–407 [DOI] [PubMed] [Google Scholar]
- 30.Kennedy BJ, and Torkelson JL (1995) Long-term follow-up of stage III testicular carcinoma treated with mithramycin (plicamycin). Med Pediatr Oncol 24, 327–328 [DOI] [PubMed] [Google Scholar]
- 31.Amoroso L, Erminio G, Makin G, Pearson ADJ, Brock P, Valteau-Couanet D, Castel V, Pasquet M, Laureys G, Thomas C, Luksch R, Ladenstein R, Haupt R, Garaventa A, and Group S (2018) Topotecan-Vincristine-Doxorubicin in Stage 4 High-Risk Neuroblastoma Patients Failing to Achieve a Complete Metastatic Response to Rapid COJEC: A SIOPEN Study. Cancer Res Treat 50, 148–155 [DOI] [PMC free article] [PubMed] [Google Scholar]
- 32.Economides MP, McCue D, Borthakur G, and Pemmaraju N (2019) Topoisomerase II inhibitors in AML: past, present, and future. Expert Opin Pharmacother 20, 1637–1644 [DOI] [PubMed] [Google Scholar]
- 33.Piekarz RL, Frye R, Turner M, Wright JJ, Allen SL, Kirschbaum MH, Zain J, Prince HM, Leonard JP, Geskin LJ, Reeder C, Joske D, Figg WD, Gardner ER, Steinberg SM, Jaffe ES, Stetler-Stevenson M, Lade S, Fojo AT, and Bates SE (2009) Phase II multi-institutional trial of the histone deacetylase inhibitor romidepsin as monotherapy for patients with cutaneous T-cell lymphoma. J Clin Oncol 27, 5410–5417 [DOI] [PMC free article] [PubMed] [Google Scholar]
- 34.Lu S, and Wang J (2014) Homoharringtonine and omacetaxine for myeloid hematological malignancies. J Hematol Oncol 7, 2. [DOI] [PMC free article] [PubMed] [Google Scholar]
- 35.DeAngelo DJ, Walker AR, Schlenk RF, Sierra J, Medeiros BC, Ocio EM, Rollig C, Strickland SA, Thol F, Valera S-Z, Dasgupta K, Berkowitz N, and Stuart RK (2019) Safety and efficacy of oral panobinostat plus chemotherapy in patients aged 65 years or younger with high-risk acute myeloid leukemia. Leuk Res 85, 106197. [DOI] [PMC free article] [PubMed] [Google Scholar]