

Abstract
The NSD family of histone methyltransferases is associated with various malignancies, including aggressive acute leukemia with NUP98-NSD1 translocation. While NSD proteins represent attractive drug targets, their catalytic SET domains exist in autoinhibited conformation, presenting significant challenges for inhibitor development. Here, we employed a fragment-based screening strategy followed by chemical optimization, which resulted in development of the first-in-class irreversible small molecule inhibitors of the NSD1 SET domain. The crystal structure of NSD1 in complex with covalently bound ligand reveals conformational change in the autoinhibitory loop of the SET domain and formation of a channel-like pocket suitable for targeting with small molecules. Our covalent lead, compound BT5, demonstrates on-target activity in NUP98-NSD1 leukemia cells, including inhibition of H3K36 dimethylation and downregulation of target genes, and impairs colony formation in NUP98-NSD1 patient sample. This study will facilitate development of the next generation of potent and selective inhibitors of the NSD histone methyltransferases.
The family of nuclear receptor–binding SET Domain (NSD) methyltransferases is comprised of three members NSD1, NSD2 (MMSET/WHSC1) and NSD3 (WHSC1L1), which regulate chromatin integrity and gene expression1. The NSDs are key enzymes involved in mono- and di-methylation of histone H3 lysine 36, a histone mark that is most commonly associated with the transcription of active euchromatin2. Overexpression, mutations and translocations of NSDs are associated with a variety of human malignancies1,3. The role of NSD1 in cancer is complex, and enhanced expression of NSD1 has been associated with lung4 and prostate cancers5, while loss of function mutations in NSD1 have been observed in head and neck squamous cell carcinomas6. The best-characterized oncogenic role of NSD1 is linked to its translocation with the Nucleoporin 98 (NUP98) gene, which predominantly occurs in pediatric acute leukemia patients7–9. NUP98-NSD1 is a potent oncogene that enforces expression of HOXA cluster and MEIS1 genes and its oncogenic activity depends on the catalytic activity of NSD1 histone methyltransferase10. Their emerging role in various cancers renders the members of the NSD family as attractive targets for the development of small molecule inhibitors.
All NSD histone methyltransferases contain a conserved catalytic SET domain, which features a unique autoinhibitory loop that blocks access to the substrate binding site11. The compact, autoinhibited structure of the NSD SET domains likely impeded previous inhibitor development efforts. As such, NSD SET domain inhibitors described to date are either very weak12, nonselective and without validated binding to the NSD SET domains13, or are SAM analogs (e.g. sinefungin)14 or peptides15 lacking cellular activity. Therefore, development of drug-like small molecule inhibitors of NSDs with on-target activity in cancer cells remains a major challenge. Here, we employed fragment screening strategy and identified a small molecule that binds to the NSD1 SET domain. Upon chemical optimization, we developed first-in-class covalent inhibitors of NSD1 that block its activity in cells and demonstrate selective growth inhibition of NUP98-NSD1 leukemia cells.
Results
Identification of NSD1 ligand through fragment screening
To identify inhibitors of NSD1 SET domain, we performed fragment screening of an in-house library of ~1,600 fragment-like compounds using NMR and found 6-chloro-1,3-benzothiazol-2-amine, BT1 (1) that binds to the SET domain (Fig. 1a, Supplementary Fig. 1). We subsequently synthesized several analogs of BT1 and found that introduction of a 4-hydroxyl group increased chemical shift perturbations upon binding to NSD1 SET domain (Supplementary Fig. 1). Among tested analogs, BT2 (2) with the 4-hydroxyl and 6-bromo substituents (Fig. 1a) demonstrated the most pronounced perturbations in NMR experiments (Supplementary Fig. 1). We then determined the binding affinity of BT2 towards NSD1 SET domain, resulting in KD = 10.4 μM and 1:1 stoichiometry (Fig. 1b). In the enzymatic assay, BT2 inhibited NSD1 activity with IC50 = 66 μM (Fig. 1c). Because BT2 is a low molecular weight compound (12 heavy atoms) it has very high ligand efficiency for binding to NSD1 (LE = 0.57)16, representing an attractive candidate for further optimization. Our attempts to determine the crystal structure of NSD1 in complex with BT2 failed. Instead, we obtained the structure of the free NSD1 SET domain, which is similar to the one reported previously11 (Extended Data Fig. 1a). To map the binding site of BT2 to NSD1 in solution we employed NMR spectroscopy and found that the compound induces large chemical shift perturbations localized in the vicinity of the autoinhibitory loop (Fig. 1d). Strikingly, the crystal structure lacks any pockets in this area (Fig. 1e, Extended Data Fig. 1b), which suggests that binding of BT2 to the NSD1 SET domain results in significant rearrangements of the autoinhibitory loop.
Figure 1.

Development of NSD1 ligands using fragment-based approach. a) Chemical structures of fragment hit BT1 and improved BT2; b) Characterization of the binding of BT2 to NSD1 SET using ITC. Data are mean ± s.d. from two independent experiments; c) Activity of BT2 in HMT assays with NSD1. Mean IC50 values ± s.d. calculated from two independent experiments. d) Fragment of 1H-15N HSQC spectrum of 150 μM 15N NSD1 SET (black) superimposed onto the spectrum of 150 μM 15N NSD1 SET with 150 μM BT2 (red). Selected residues in the autoinhibitory loop are boxed; e) crystal structure of NSD1 SET domain with mapped residues undergoing strong chemical shift perturbations (ΔσHN > 0.05ppm or ΔσN > 0.5ppm) upon binding of 150 μM BT2 (red). NSD1 SET domain is shown in surface with C2062 in yellow.
Structure of NSD1 SET domain with covalently bound ligand
Mapping the binding of BT2 to NSD1 SET domain by NMR revealed strong perturbations of chemical shifts for residues in the autoinhibitory loop, including C2062 (Fig. 1d,e). Therefore, we explored development of irreversible ligands, and serendipitously, we found that BT3 (3) synthesized by introducing the thiocyanate moiety instead of bromine, binds covalently to NSD1 SET domain as validated by mass spectrometry (MS) (Fig. 2a,b). This finding allowed us to determine a high-resolution crystal structure of the covalent complex of NSD1 SET domain with BT3 (Fig. 2c). In this structure, we unambiguously observe disulfide bond formed between BT3 and the side chain of C2062 (Fig. 2c,d, Extended Data Fig. 2), which likely results from the reduction of the thiocyanate moiety in BT3 in the presence of reducing agent (Supplementary Fig. 2)17 followed by covalent binding. The ligand binds in the vicinity of the autoinhibitory loop in an internal channel-like pocket that is absent in the free NSD1 SET domain (Fig. 2e). This pocket is formed upon rearrangement of the loop residues 2064 to 2067 and the C-terminus of the SET domain (residues 2081 to 2083), and is associated with the replacement of buried N2065 side chain by BT3 and shift of N2065 to the solvent exposed site (Fig. 2f). The 2-amino-4-hydroxy-benzothiazole core of BT3 is almost entirely buried in the SET domain (Fig. 2e) and its binding is stabilized by the hydrophobic contacts with L2081 and F1996 and a network of well-defined interactions, including four hydrogen bonds with the carbonyl group of T1994, hydroxyl of SAM co-factor and an internal water molecule (Fig. 2d). Interestingly, the sulfur from the thiazole ring is in a close contact with the carbonyls of N2065 and G2066 (Fig. 2d), suggesting favorable chalcogen bonds18.
Figure 2.

Crystal structure of NSD1 with covalently bound BT3. a) Chemical structure of BT3. b) MS spectrum of 1 μM NSD1 SET domain incubated with 30 μM BT3 for 18 h at 30 °C. Representative spectrum of two independent experiments. c) Crystal structure of NSD1 SET with covalently bound BT3. Electron density omit map for BT3 contoured at 1 σ is shown as black mesh. BT3 and residues in the binding site are shown as sticks; SAM is blue. d) Details of BT3 binding site. BT3 (orange carbons), selected residues in the binding site (white carbons) and SAM (blue carbons) are shown in sticks. Internal water is shown as red sphere. e) Comparison of the autoinhibitory loop regions between NSD1 SET bound to BT3 (left, autoinhibitory loop in magenta) and ligand free NSD1 SET (right, autoinhibitory loop is green). Protein is in surface representation, SAM (green and magenta) and BT3 (blue) are shown in sticks; f) Conformation of the autoinhibitory loop and the C-terminus in NSD1 SET with bound BT3 (magenta carbons) superimposed onto the structure of ligand-free NSD1 SET (green carbons). Selected residues are presented in sticks and labeled.
The crystal structure of NSD1-BT3 complex rationalizes the structure activity relationship (SAR) observed for a set of screening hit analogs (Supplementary Fig. 1). The most pronounced chemical shift perturbations in NSD1 were observed for the compounds 4 and BT2, both of which contain hydroxyl group involved in the two internal hydrogen bonds (Fig. 2d). Replacement of hydroxyl (compounds 5, 4, and BT2) with methoxyl (compounds 6, 7, 8) led to a less pronounced chemical shift perturbations, which is likely associated with weaker binding to NSD1 due to the loss of the hydrogen bond with SAM and replacement of an internal water molecule by the methyl group. This SAR strongly supports similar binding mode of the 2-amino-4-hydroxy-benzothiazole core in both reversible ligands and irreversible BT3.
Development of irreversible aziridine inhibitors
Analysis of the crystal structure of NSD1 bound to BT3 suggests that C2062 could be targeted with electrophilic groups to develop irreversible inhibitors. Thus, we synthesized compounds 9 and 10 by introducing acrylamide Michael acceptor moieties, which are the most common reactive groups in irreversible inhibitors19. By employing MS and NMR we found that both compounds lack covalent binding and only weakly interact with NSD1 (Supplementary Fig. 3). This suggests that the acrylamide moiety is too large and too polar to fit into the buried binding site on NSD1.
To target C2062 we introduced an aziridine moiety, which is relatively small, hydrophobic, and has been previously reported in cysteine reactive compounds20. This resulted in BT4 (11), which covalently binds to NSD1 as validated by MS (32% engagement after 8 h incubation) (Fig. 3a). Analysis of NMR experiments revealed strong chemical shift perturbations in NSD1, including C2062, upon binding of BT4 (Fig. 3b). We have also developed two additional analogs of BT4 with methyl- (BT5, 12) and ethyl-aziridine (BT6, 13) moieties (BT5 and BT6 were synthesized as racemates) (Fig 3a). BT5 engages covalently with NSD1 more rapidly than BT4 (80% engagement vs 32% after 8 h incubation) (Fig 3a). On the contrary, BT6 did not show covalent binding after 8 h, suggesting that bulkier ethyl group diminished binding to the SET domain (Fig. 3a). Our attempts to determine the crystal structure of NSD1 with bound aziridine analogs failed, and we employed NMR to confirm that BT5 induced chemical shift perturbations of the same residues as BT3, including C2062 (Extended Data Fig. 3). To further validate the target cysteine in NSD1 SET domain we introduced a point mutation of C2062A and found that it abolished covalent binding of BT5 (Extended Data Fig. 4).
Figure 3.

Characterization of the covalent engagement of irreversible NSD1 inhibitors. a) MS spectra of 1 μM NSD1 SET domain incubated with 10 μM aziridine analogs BT4, BT5, BT6 for 8 h at 32°C. Percent of covalent engagement with NSD1 SET is shown in parenthesis. Representative spectra out of two independent replicates. b) Fragment of 1H-15N HSQC spectrum of 150 μM 15N NSD1 SET (black) superimposed onto spectrum of 150 μM 15N NSD1 SET with 300 μM BT4 (red). Assignment is shown for selected residues undergoing strong chemical shift perturbations including C2062. c,d) Determination of the kinact/KI for binding of BT4 (c) and BT5 (d) to NSD1 using MS. Mean values of kinact, KI and kinact/KI ± s.d. from two independent experiments and representative graphs are shown. e) MS spectra of 1 μM NSD2 and 1 μM NSD3 incubated with 10 μM BT5 for 8 h at 32° C. Representative spectra are shown out of two replicates.
The activity of irreversible inhibitors can be characterized by the second order rate constant kinact/KI that reflects both reversible binding (KI) and the rate of covalent bond formation (kinact)21. To determine kinact/KI we employed MS to measure the rate of formation of the ligand-NSD1 complex as a function of ligand concentration (Supplementary Fig. 4). The activity of BT4 is relatively modest (kinact/KI = 3.5 M−1s−1) (Fig. 3c), while BT5 is several-fold more potent (kinact/KI = 19.6 M−1s−1) (Fig. 3d). The weakest analog, BT6, engages with NSD1 too slowly to determine the kinact/KI (Supplementary Fig. 4c). Because C2062 is conserved among members of NSD family, we assessed selectivity of BT5 via testing the covalent binding kinetics with NSD2 and NSD3 SET domains. An eight-hour incubation of BT5 with NSD3 led to 14% covalent engagement, which increased to 33% after 18 hours (Fig. 3e, Supplementary Fig. 5a). Quantitative analysis of BT5 binding to NSD3 yielded kinact/KI = 3.8 M−1s−1 (Supplementary Fig. 5b,c). Interestingly, very similar KI values obtained for NSD1 (KI = 25.0 μM) (Fig. 3d) and NSD3 (KI = 20.1 μM) (Supplementary Fig. 5c) suggest that the contribution of reversible binding of BT5 to both proteins is comparable. On the contrary, the reactivity of BT5 towards NSD1 is significantly faster (kinact = 4.8 * 10−4 s−1) when compared to NSD3 (kinact = 7.4 * 10−5 s−1) explaining the more efficient engagement of the compound to NSD1. We have also found that BT5 shows no covalent binding to NSD2 within 8 h (Fig. 3e), and we observed only modest (10 %) engagement upon longer incubation (18 h) (Supplementary Fig. 5d). Overall, comparison of the covalent binding demonstrates marked selectivity of BT5 towards NSD1.
We have also tested inhibition of the catalytic activity of NSD1 by BT5 in a histone methyltransferase (HMT) assay using nucleosomes as a substrate and found IC50 = 5.8 μM upon 4 h incubation (Fig. 4a), which further improved to IC50 = 1.4 μM after 16 h due to irreversible binding (Fig. 4b). We have also observed inhibition of NSD2 and NSD3 by BT5, albeit at higher concentrations (Fig. 4c), which likely results from non-covalent binding (Supplementary Fig. 6a,b,c). Furthermore, compound BT6, which engages NSD1 less effectively than BT5 (Supplementary Fig. 4c), is also a modest inhibitor of NSD1 in the HMT assay (Fig. 4d).
Figure 4.

Characterization of the activity of NSD1 inhibitors in HMT assays. a,b) Inhibition of NSD1 activity by BT5 after 4 h (a) and 16 h (b) incubation. c) Inhibition of NSD2 and NSD3 by BT5 after 4 h incubation. d) Inhibition of NSD1 by BT6 after 4 h incubation. Mean IC50 values ± s.d. are calculated from two independent experiments, each with n = 3, and representative graphs are shown. e). Activity of 50 μM BT5 tested against panel of histone methyltransferases in HMT assay using technical duplicates. Error bars represent s.d.
Since BT5 binds to the autoinhibitory loop that is unique to the NSD family of histone methyltransferases and ASH1L, we anticipated high selectivity for this class of compounds. Indeed, we have not detected any significant inhibition in the panel of histone methyltransferases when using 50 μM BT5 (Fig. 4e). We further tested binding of BT5 to the ASH1L SET domain, which also features the presence of autoinhibitory loop22 and found no interaction (Supplementary Fig. 6d). Broader selectivity studies against selected epigenetic enzymes, including 10 HDACs, 4 sirtuins and 6 HATs revealed no significant activity of BT5 at 50 μM concentration (Supplementary Fig. 7a). Furthermore, assessment of BT5 in a broad panel of 291 protein kinases revealed no substantial off-target activity (Supplementary Fig. 7b). Aziridines have not been extensively explored in medicinal chemistry and stability of aziridine containing compounds it is not well known. Thus, we tested the stability of BT5 using NMR in two different buffers, including the one used for the HMT assay, and found that the compound remained unaffected for at least 1–2 days in these conditions (Supplementary Fig. 8a,b,c). Additionally, the presence of the aziridine moiety in BT5 may confer non-selective reactivity with the cysteine containing proteins. Thus, we incubated BT5 with CDC25B phosphatase and thioredoxin, both of which contain reactive cysteines, and observed no or minimal covalent binding (Supplementary Fig. 8d,e).
BT5 binds to NSD1 SET domain in cells
We then assessed whether BT5 can engage NSD1 SET domain in eukaryotic cells using CETSA assay23. Because full length NSD1 is a large protein, we have generated a shorter, FLAG-tagged, ~35 kDa construct encompassing SET domain. Treatment of the HEK293T cells transfected with Flag-NSD1 SET by BT5 resulted in stabilization of the protein when compared to DMSO (Fig. 5a). We have also developed HiBiT CETSA experiment by expressing NSD1 SET domain with HiBiT tag in HEK293T cells24. Treatment with BT5 stabilized the NSD1 SET by ~4 °C when compared to DMSO (Fig. 5b), supporting that BT5 binds to NSD1 in cells. We have also tested the activity of BT5 in the CETSA assay with NSD2 and NSD3 and found no stabilization of these proteins (Extended Data Fig. 5). Overall, our aziridine inhibitor BT5 exhibits cellular selectivity towards NSD1, which is consistent with its covalent engagement observed in vitro (Fig. 3).
Figure 5.

Treatment with BT5 demonstrates on-target activity in cells. a) CETSA assay in HEK293T cells transfected with Flag-NSD1 SET construct treated overnight (~16 h) with DMSO or 5 μM BT5. Representative gel of two independent experiments. b) HiBiT CETSA in HEK293T cells treated with DMSO or 5 μM BT5. Experiment was performed once with n = 2. c) Growth inhibition of a panel of leukemia cell lines upon treatment with BT5 (NUP98-NSD1, GI50 = 0.87 ± 0.09 μM; HM-2, GI50 = 5.1 ± 0.3 μM; MOZ-TIF2, GI50 = 6.1 ± 0.7 μM; NUP98-HOXA9, GI50 = 7.7 ± 0.6 μM; K562, GI50 > 12.5 μM; MOLM13, GI50 = 7.6 ± 0.7 μM; SET2, GI50 > 12.5 μM) and BT6 (NUP98-NSD1, GI50 = 6.7 ± 0.8 μM) quantified using MTT assay. GI50 values are mean ± s.d. from two independent experiments. d) Levels of H3K36 methylation in HM-2 and NUP98-NSD1 cells. Representative gel of two independent experiments. e,f) Assessment of epigenetic marks in NUP98-NSD1 (e) and HM-2 (f) cells treated with BT5 for 8 days. Representative gel of two independent experiments. g) qPCR analysis of HoxA genes and Meis1 in NUP98-NSD1 cells treated with BT5 for 8 days. Representative data from two independent experiments and analyzed by unpaired two-tailed t-test. h) ChIP-qPCR analysis of H3K36me2, H3K36me3 and H3 occupancy at the promoter of Hoxa9 in NUP98-NSD1 cells treated with DMSO or 2 μM BT5 for 4 days. Representative data of two experiments analyzed by unpaired two-tailed t-test. ns – not significant.
BT5 blocks proliferation of NUP98-NSD1 cells
Oncogenic activity and transforming properties of NUP98-NSD1 have been characterized previously9,10. Notably, catalytic activity of the NSD1 SET domain is necessary for proliferation of NUP98-NSD1 cells and expression of HoxA genes10. In order to test the activity of NSD1 inhibitor, we have generated such cell line by transforming murine bone marrow progenitor cells with NUP98-NSD1 oncogene. We also used three additional murine cell lines transformed with other leukemia oncogenes, Hoxa9/Meis1 (HM-2 cells)25, NUP98-HOXA926 and MOZ-TIF227 for testing selectivity. Treatment of NUP98-NSD1 cells with BT5 resulted in pronounced growth inhibition that was time dependent, yielding GI50 = 1.3 and 0.87 μM at day 3 and 7, respectively (Fig. 5c, Supplementary Fig 9a). Importantly, cell lines transformed with other leukemia oncogenes were less sensitive to BT5, demonstrating 6–8 less potent cell growth inhibition (GI50 = 5.1–7.7 μM at day 7) (Fig. 5c). We have also tested the activity of BT2, which is a weaker and reversible NSD1 inhibitor, and observed modest cell growth inhibition (GI50 = 33 μM) (Supplementary Fig. 9b). Concordantly, BT6 which is a weaker covalent inhibitor but also comprising the aziridine moiety (Fig 4d, Supplementary Fig. 4c), demonstrated substantially reduced activity in NUP98-NSD1 cells when compared to BT5 (Fig. 5c). To further assess selectivity of BT5, we treated three human leukemia cell lines (K562, MOLM13 and SET2) and observed GI50 weaker than 6 μM (Fig. 5c). Altogether, these results support that irreversible inhibitor BT5 shows selectivity towards NUP98-NSD1 cell line. However, the presence of the aziridine group is likely associated with some toxicity at the concentrations of BT5 exceeding 5 μM.
BT5 demonstrates on-target inhibition of NSD1
To confirm on-target mechanism of action we compared activity of BT5 in NUP98-NSD1 and HM-2 cell lines. First, we analyzed global methylation of H3K36 and found significantly increased level of H3K36me2 but not H3K36me3 in NUP98-NSD1 cells when compared to HM-2 (Fig. 5d). This suggests that overexpression of NUP98-NSD1 oncogene (Supplementary Fig. 10a) leads to enhanced histone methyltransferase activity of NSD1. Subsequently, we analyzed the effect of BT5 in both cell lines and found a dose-dependent suppression of H3K36me2 only in NUP98-NSD1 cells (Fig. 5e). Methylation of other lysines in histone H3 as well as global H3K36 methylation in HM-2 cells was not affected (Fig. 5e,f), which is consistent with the inhibition of NSD1 and possibly some inhibition of NSD2/NSD3. Importantly, treatment of both cell lines with BT5 did not affect H3K36me3 levels. This is consistent with lack of in vitro inhibition of SETD2 (Fig. 4e), the sole histone methyltransferase responsible for the tri-methylation of H3K3628.
We subsequently tested whether BT5 affects the expression level of Hoxa9, Hoxa5, Hoxa7 and Meis1, which are established target genes of NUP98-NSD110. Indeed, we observed up to 50% reduction in the expression of these genes upon treatment with BT5 in the NUP98-NSD1 leukemia cells (Fig. 5g). On the contrary, no such effect was observed in three other cell lines: HM-2, NUP98-HOXA9 and MOZ-TIF2 (Supplementary Fig. 10b,c,d). We have further confirmed expression of the NSD1 fusion in NUP98-NSD1 cells but not in the control cell lines (Supplementary Fig. 10a). Mechanistically, NUP98-NSD1 binds genomic elements adjacent to Hoxa9 and maintains H3K36 mono and di-methylation10. To further validate on-target activity of BT5, we performed ChIP experiments in NUP98-NSD1 cells treated with the inhibitor and observed reduction of the H3K36me2 level but not H3K36me3 at Hoxa9 promoter region (Fig. 5h). Altogether, the mechanism of action studies clearly confirm that BT5 inhibits NSD1 SET domain and impairs the activity of NUP98-NSD1 in leukemia cells.
BT5 impairs colony formation in NUP98-NSD1 patient sample
Translocations of t(5;11) resulting in NUP98-NSD1 fusion are relatively rare and predominantly observed in pediatric AML patients8. We identified a single human primary sample derived from the patient with NUP98-NSD1 translocation, which we used for testing the activity of BT5 using colony forming assay. Treatment with NSD1 inhibitor reduced the number of colonies in a dose dependent manner (Fig. 6a), with the residual colonies remaining much smaller and more dispersed as compared to the DMSO treated samples (Fig. 6b). Gene expression studies in the NUP98-NSD1 primary sample demonstrated reduction in HOXA9 and MEIS1 expression upon treatment with BT5 (Fig. 6c), which confirms on-target activity of NSD1 inhibitor. On the contrary, no activity of BT5 on colony formation was observed in the patient sample with MLL-ENL translocation (Fig. 6d,e). We further tested the effect of BT5 on normal CD34+ bone marrow progenitor cells and detected no toxicity up to 12 μM concentration (Fig. 6f,g).
Figure 6.

Activity of BT5 in primary samples. a) Colony assay in patient sample with NUP98-NSD1 translocation treated with BT5 for 10 days. Data are mean ± s.d. from one experiment with cells plated in triplicates and analyzed by unpaired two-tailed t-test. b) Representative colonies from treatment of NUP98-NSD1 sample with DMSO or 12 μM BT5. c) Expression of HOXA9 and MEIS1 in NUP98-NSD1 sample treated with BT5 for 10 days. Data are mean ± s.d. from one experiment with cells plated in triplicates and analyzed by unpaired two-tailed t-test; ns – not significant. d) Colony assay in patient sample with MLL-ENL translocation treated with BT5 for 10 days. Data are mean ± s.d. from one experiment with cells plated in triplicates and analyzed by unpaired two-tailed t-test. ns – not significant. e) Representative colonies from treatment of MLL-ENL sample with DMSO or 12 μM BT5. f) Colony assay in normal CD34+ cells treated with BT5 for 10 days. Data are mean ± s.d. from one experiment with cells plated in triplicates and analyzed by unpaired two-tailed t-test. ns – not significant. g) Representative colonies from treatment of CD34+ cells with DMSO or 12 μM BT5.
Discussion
In this work, we report development of irreversible inhibitors of NSD1 histone methyltransferase. By employing NMR fragment screening followed by chemical optimization, we synthesized small molecules based on 2-amino-4-hydroxybenzothiazole scaffold that bind to the NSD1 SET domain. Previous studies demonstrated that the NSD1 SET domain adapts compact autoinhibited conformation7 and lacks pockets suitable for small molecule binding. Here, we determined the crystal structure of NSD1 SET with covalently bound ligand, which reveals conformational change in the autoinhibitory loop leading to formation of a unique, channel-like site suitable for small molecule binding. The best reversible ligand we developed, BT2, binds NSD1 with KD = 10.4 μM and inhibits its activity with IC50 = 66 μM. While, BT2 has moderate potency, due to its low molecular weight (245 Da), it features striking ligand efficiency (LE = 0.57), suggesting high quality interactions with the SET domain. Indeed, the crystal structure of covalently bound analog BT3 shows that the 2-amino-4-hydroxybenzothiazole scaffold forms multiple finely tuned interactions with NSD1, including 4 hydrogen bonds and two chalcogen bonds (Fig. 2d).
Based on the crystal structure, we developed the first-in-class irreversible inhibitors of NSD1 targeting C2062 in the autoinhibitory site. We successfully employed the aziridine moiety as a warhead suitable for covalent targeting of cysteine in a buried hydrophobic site. Our covalent lead, BT5, inhibits NSD1 at low μM concentrations, shows engagement to NSD1 SET domain in cells and global reduction of the H3K36me2 level without perturbing H3K36me3. Interestingly, despite C2062 is conserved in all three NSD SET domains, we observe enhanced selectivity of BT5 towards NSD1, particularly in CETSA engagement experiments. Treatment of NUP98-NSD1 transformed cells with BT5 results in growth inhibition and correlates with downregulation of HoxA genes, validating its on-target mechanism of action. BT5 impairs colony formation in primary AML cells harboring NUP98-NSD1 but not with MLL-ENL translocation or in normal CD34+ progenitor cells.
While BT5 constitutes proof-of-concept that targeting NSD protein’s SET domains with small molecules is feasible, this is a tool compound with the activity comparable to the first-generation of covalent K-RAS inhibitors29. Further optimization is needed to develop NSD1 chemical probes and drug-like analogs of BT5. One of such improvements could be the replacement of the aziridine moiety to attenuate reactivity and thereby improve cellular selectivity. Nevertheless, this work provides a valuable lead compound BT5 that can bind reversibly and irreversibly to all three NSD SET domains, albeit with different activities, exhibiting distinct preference towards NSD1. The crystal structure of NSD1 with covalently bound ligand will advance development of the next-generation of potent and selective inhibitors of the NSD family of histone methyltransferases.
Online Methods
Protein expression and purification
cDNA constructs encoding NSD1 SET: residues 1852–2105 (used for HMT assay and MS), NSD2 SET (residues 952–1226), NSD3 SET (residues 1032–1308) were ordered from Genscript and cloned into modified pET32a vector containing a Thioredoxin (Trx) tag upstream of the N-terminal hexa-histidine (6xHis) tag. For NMR and ITC studies, NSD1 SET (residues 1852–2085), NSD2 SET (residues 984–1206) were cloned into pQE80L (Qiagen) vector with uncleavable N-terminal hexa-histidine tag. For NMR experiments, NSD3 SET (residues 1066–1288) was cloned into the same pET32a vector containing a Trx tag described above. For X-ray crystallography, NSD1 SET (residues 1863–2085) was cloned into pQE80L (Qiagen) vector. C2062 mutation was introduced into NSD1 SET (residues 1852–2105) using the QuikChange method and confirmed by sequencing.
The unlabeled proteins were overexpressed in Escherichia coli BL21 (DE3) cells by the addition of 0.5 mM Isopropyl β-D-1-thiogalactopyranoside (IPTG) and 0.1 mM zinc chloride at an OD600 of 0.8–1.0. The 15N NSD1, 15N NSD2, 15N NSD3 and 13C,15N NSD1 proteins were expressed using M9 minimal media. Protein purifications were carried out at 4 °C. Cells were resuspended in 50 mM Tris pH 7.5, 250 mM NaCl, 1 mM Tris(2-carboxyethyl)phosphine (TCEP), 0.05 mM Phenylmethylsulfonyl fluoride (PMSF) and lysed using an Emuliflex homogenizer (ATA Scientific instruments). Clarified lysates were loaded onto a nickel affinity column, and proteins were eluted using an imidazole gradient. The Trx tag was cleaved by overnight incubation with 40 μg/mL Precission protease, further purified by nickel affinity chromatography and dialyzed into 50 mM Tris pH 7.5, 150 mM NaCl, 1 mM TCEP. Protein purity was analyzed by SDS-PAGE and examples of protein gels are shown in Supplementary Fig. 11.
Recombinant histone-methyltransferases DOTL1 (HMT-11–101), EZH2 (HMT-23–501), PRMT1 (HMT-11–119), PRMT3 (HMT-11–113), PRMT4 (HMT-11–120), SMYD1 (HMT-11–304), SMYD2 (HMT-11–110), SUV39 H2 (HMT-11–112) were purchased from Reaction Biology. The plasmid encoding SETD2 (25348) was purchased from Addgene. Plasmids encoding G9a, GLP, SET7/9 were kindly provided by Raymond C. Trievel (University of Michigan). Plasmids of ASH1L and PRDM9 were kindly provided by Cheryl H. Arrowsmith and Masoud Vedadi (Structural Genomics Consortium, University of Toronto). ASH1L, G9a, GLP, PRDM9, SETD2, SET7/9 were expressed and purified as described previously30–33.
NMR experiments and fragment screening
Samples for NMR binding studies were prepared with 150 μM 15N NSD1 in buffer (50 mM Tris, pH 7.5, 150 mM NaCl, 1 mM TCEP) with compounds at various concentrations in 5% final DMSO and 7% D2O. For fragment screening, we tested an in-house library of 1600 fragment-like compounds. Compounds were screened in mixtures of 20 compounds per sample at 5% DMSO, 250 μM final compound concentration. 1H-15N HQSC spectra were acquired at 30 °C on a 600 MHz Bruker Avance III spectrometer equipped with cryoprobe, running Topspin version 2.1. Processing and spectral visualization was performed using NMRPipe34 and Sparky (T. D. Goddard and D. G. Kneller, SPARKY 3, University of California, San Francisco).
Assignment of NSD1 backbone chemical shifts
Samples for backbone assignment were made with 500 μM 13C15N-labeled NSD1 (residues 1852–2085) in buffer containing 50 mM Tris, 150 mM NaCl, pH 7.5, 1 mM TCEP, 5% D2O. Spectra were acquired at 30 °C on a 600 MHz Bruker Avance III spectrometer equipped with cryoprobe, running Topspin version 2.1. Backbone assignment was done using a series of triple-resonance experiments including HNCACB, CBCA(CO)NH, HNCA, HN(CO)CA, HNCO, HN(CA)CO, and 15N-separated NOESY-HSQC. Processing and spectral visualization was performed using NMRPipe34 and Sparky (T. D. Goddard and D. G. Kneller, SPARKY 3, University of California, San Francisco).
ITC experiments
NSD1 was exchanged into ITC buffer (50 mM phosphate, pH 7.5, 150 mM NaCl, 1 mM TCEP) by dialysis and degassed prior to measurement. The titrations were performed using a VP-ITC titration calorimetric system (MicroCal) at 25 °C. The calorimetric cell, containing 50 μM NSD1 SET domain with 5% DMSO, was titrated with 600 μM BT2 in 5% DMSO injected in 10 μL aliquots. Reference cell contained buffer with 5% DMSO. Data were analyzed using Origin 7.0 (OriginLab) to obtain KD and binding stoichiometry.
MS experiments
Mass spectrometry (MS) experiments were performed with 1 μM of NSD1, NSD2, or NSD3 in PBS buffer (4 mM KPi pH 7.4, 155 mM NaCl) with 1 mM Dithiothreitol (DTT) and 2 μM S-adenosyl Methionine (Sigma). The proteins were incubated with compounds (at concentrations, times and temperatures indicated) at 3.0% DMSO followed by quenching with 0.2% formic acid. Samples were then flash frozen and stored at −80 °C until LCMS analysis. LCMS analysis was carried out on an Agilent 6545 Q-TOF LC/MS with an Agilent 1290 Infinity LC system. Protein was eluted from a Phenomenex 50 × 2.1 mm widepore C4 column by a gradient of 5–100% buffer B (95% acetonitrile, 5% water, 0.1% formic acid) with buffer A (100% water, 0.1% formic acid) over 30 s at a flow rate of 0.2 mL/min. The resulting spectra were deconvoluted and analyzed using Agilent MassHunter Qualitative Analysis B 07.00 software. Relative peak heights at the unmodified protein weight and protein-compound adduct weight were compared to obtain the percent of covalent engagement at each time point.
MS experiments with Thioredoxin and CDC25B samples were made by diluting each protein to 2 μM in 50 mM Tris pH 7.5, 50 mM NaCl, 1 mM DTT and incubating with 50 μM BT5 as described above without the addition of formic acid.
Kinetics experiments were carried out with NSD1 using several concentrations of tested compounds ranging from 4 μM - 48 μM. Samples were incubated for time periods ranging from 0.5–8 h at 30 °C and processed as described above. The data were analyzed as described before21.
Radiometric Histone Methyltransferase (HMT) Assays
HMT assays were carried out with 200 nM NSD1, NSD2 or NSD3 in 5% DMSO and a buffer containing 50 mM Tris pH 8.5, 0.005% bovine serum albumin, 0.02% Triton-x 100, 0.5 mM TCEP. In the case of reversible inhibitors, NSD1 was incubated with compounds at room temperature for 1 h prior to initiating HMT reaction. For irreversible inhibitors, compounds were incubated for indicated times at 32 °C (NSD1 and NSD2) or room temperature (NSD3). The HMT reactions were initiated by addition of 250 nM chicken nucleosomes (Reaction Biology, HMT-35–179), 0.4 μM 3H-labelled S-adenosyl methionine (Perkin Elmer, NET155V250UC) and 2.4 μM unlabeled S-adenosyl methionine. The reaction was continued for 1 h at room temperature, then quenched by addition of 10% Trichloroacetic acid (TCA) and then transferred to 96-well filter plates (Millipore sigma, MSFBN6B), washed twice with 10% TCA, then once with 200-proof ethanol. The plates were dried overnight at room temperature, before the addition of Microscint-0 (PerkinElmer, 6013611). The radiometric signal was read by a Perkin Elmer Microbeta2 2450 Microplate counter and the resulting data was analyzed in GraphPad Prism version 7.04. Each reaction was performed in technical triplicates.
Selectivity of BT5 was assessed by radiometric HMT assays for a panel of recombinant SET domains from ASH1L, DOT1L, EZH2, G9a, GLP, PRDM9, PRMT1, PRMT3, PRMT4, SETD2, SET7/9, SMYD1, SMYD2, SUV39 H2 using core histone or nucleosomes as substrates and based on previously reported conditions. Assays were carried out in 50 mM Tris pH 8.5, 1 mM DTT with indicated additional components and a 2 h incubation with BT5 at 32 °C. Assays with ASH1L, SETD2, and DOT1L were carried out with 250 nM enzymes in a buffer containing 25 mM NaCl, 2 mM MgCl2, 0.01% BSA, 0.05% Triton X-100. Reactions were carried out by the addition of 250 nM chicken nucleosome and 1000 nM 3H SAM for 1 h and processed as described above. Assays with G9a, GLP, PRDM9, PRMT1, PRMT3, PRMT4, SET7/9, SMYD1, SMYD2, SUV39 H2 were performed using 250 nM enzymes, using a buffer containing 25 mM NaCl, 5 mM MgCl2, 5% glycerol, 0.01% BSA, 0.002% Triton X-100 and 0.05 mg/mL mixture of histones from calf thymus (Sigma-Aldrich, H9250) was used as a substrate. EZH2 was tested at 50 nM and the assay was performed in a buffer containing 50 mM NaCl, 1 mM EDTA, 0.01% Triton X-100 and 0.05 mg/mL mixture of histones from calf thymus was used as a substrate.
Crystallization, Data Collection, and Structure Determination
Crystals of NSD1 were obtained using 12 mg/ml protein in 20 mM Tris, pH 7.5, 150 mM NaCl, 1 mM TCEP buffer and the precipitant solution (100 mM sodium citrate, pH 5.6, 200 mM potassium sodium tartrate and 2 M ammonium sulfate). X-ray diffraction data were collected on beamline 21-ID-F at LS-CAT (Advanced Photon Source, Argonne National Laboratory, USA) at 0.97872 Å wavelength under liquid nitrogen streaming. The collected data were processed using the HKL2000 package35. The structure was determined by molecular replacement method with the CCP4 version of MOLREP36 using the NSD1 SET domain (PDB code 3OOI) as a search model. Refinement of the structure was performed using PHENIX Refine37.
Co-crystallization of NSD1 with BT3 was performed with 15.5 mg/ml protein incubated with 5-fold molar excess of compound in 20 mM Tris, pH 7.5, 150 mM NaCl, 1 mM TCEP buffer on ice for 2 hours. Crystals were grown using the sitting drop vapor diffusion method at 17 °C by mixing in a 1:1 ratio with a reservoir solution of 100 mM sodium cacodylate, pH 6.5, 200 mM calcium acetate and 18% PEG 8000. Plate-like crystals appeared after 3 weeks and were cryo-protected with additional 20% glycerol before freezing in liquid nitrogen. Diffraction data were collected on beamline 21-ID-G at LS-CAT (Advanced Photon Source, Argonne National Laboratory, USA). The collected data were processed in the same way as for ligand free NSD1 using the HKL2000 package35 and the structure was determined using molecular replacement with PHASER38 as described above followed by refinement using PHENIX Refine37. Additional analysis and refinement has been done using WinCoot39. The statistics of the structure refinement and quality of the final model are summarized in Supplementary Table 1.
Profiling BT5 selectivity
Activity of BT5 was tested at 25 and 50 μM concentrations with 1 h incubation at room temperature, against selected set of protein kinases by Nanosyn. Profiling of the BT5 activity against panel of epigenetic enzymes including 10 HDACs, 4 sirtuins, 6 HATs was performed by Reaction Biology using 50 μM BT5 and 1 h incubation time.
Cell lines
The NUP98-NSD1 cells were generated according to the method described before10. The cDNA encoding NUP98-NSD1 cDNA in MSCV-Neo vector was a kind gift from Dr. Ani Deshpande, Sanford Burnham, Medical Discovery Institute9. Briefly, the 5 ×10⁵ enriched Lin− bone marrow progenitors from Balb/c mice were infected with retroviral supernatant from platE cells transfected with NUP98-NSD1(MSCV-neo) plasmids by two rounds spinoculation, followed by 7 days of G418 selection (1 mg/mL). The NUP98-NSD1 cells are cultured in IMDM media supplemented with 15% FBS, P/S and recombinant murine SCF (50ng/mL, R&D System) and IL3 (10 ng/mL, R&D System). Cells from a single colony were expanded and used in the experiments. MOZ-TIF2 and HM-2 (transformed with Hoxa9/Meis1) cells were generated as described previously27,40. All animal experiments in this study were approved by the University of Michigan Committee on Use and Care of Animals and Unit for Laboratory Animal Medicine (ULAM).
Cellular Thermal Shift Assay (CETSA)
pCMV-Flag-NSD1, pCMV-Flag-NSD2 and pCMV-Flag-NSD3 constructs were generated by cloning NSD1 residues 1753–2095 (synthetic construct generated by Invitrogen), and NSD2 residues 877–1226 and NSD3 residues 957–1298, respectively (synthetic constructs by Genscript), into pCMV vector. For CETSA experiments, 1×10⁶ HEK293T cells in DMEM medium with 10% FBS and 1% Pen Strep were seeded in 100 mm cell culture plates appropriate volume and incubated overnight (37 °C, 5% CO2). The following day cells were transfected with 1 μg/ml pCMV-Flag-NSD1, pCMV-Flag-NSD2 or pCMV-Flag-NSD3 containing FLAG tag using 2.5 μl/ml Lipofectamine 2000 transfection reagent and incubated overnight. Cells were treated the next day with 0.25% DMSO or 5 μM of BT5. Following overnight incubation, the cells were harvested, washed and resuspended with PBS. Equal volume of cell suspensions were aliquoted. Aliquots were heated individually at different temperatures for 3 min followed by cooling for 3 min at RT. Cells were lysed by addition of the lysis buffer (50 μL) and using 3 freeze-thaw cycles with liquid nitrogen. The lysates were centrifuged at 20,000 × g for 20 minutes at 4 °C and supernatants were transferred to new tubes, then analyzed by SDS-PAGE and western blot analysis of Flag-NSD1, Flag-NSD2 and Flag-NSD3 expression using anti-FLAG (M2, Sigma, #F3165, dilution 1:1,000) antibody. HSP90 (Cell Signaling Technology, #4874, dilution 1:5,000) and Actin (Santa Cruz, #sc-47778, dilution 1:10,000) were used as loading controls.
HiBiT-CETSA
N-HiBiT-NSD1 construct was generated by cloning NSD1 residues 1852–2105 into pBiT3.1-N [CMV/HiBiT/Blast] vector (Promega, #N236A). 5×10⁵ HEK293T cells in 2 mL DMEM medium with 10% FBS and 1% Pen Strep (37 °C, 5% CO2) were reverse transfected in 6-well plates, with 160 μl of complexes (2 μL FuGENE® HD Transfection Reagent [Promega #E2311] and 400 ng DNA per well in Opti-MEM™ [Gibco, #31985088]). After 24 h, cells were collected, counted and re-plated at initial cell density with fresh medium and 0.25% DMSO or 5 μM. After additional 24 h, cells were collected and 60 μL were aliquoted to PCR strips at a cell density of 1×10⁶ cells/mL. Samples were then heated at the indicated temperatures for 3 min using a pre-heated thermal cycler, allowed to equilibrate to room temperature. 20 μL of samples were aliquoted to 384-well plate in duplicate (2×10⁴ cells per well), then 20 μL of Nano-Glo® HiBiT Lytic Detection System (Promega, # N3030) was added, and samples were analyzed for luminescence intensity using a PHERAstar microplate reader reader (BMG LABTECH).
Immunoblotting
1×10⁶ NUP98-NSD1 and HM-2 cells in required medium with 10% FBS and 1% Pen Strep were collected, washed, and whole cell lysate was prepared using RIPA lysis buffer supplemented with 1X proteinase inhibitor cocktail. For compound-treated samples, 1×10⁵ NUP98-NSD1 cells or 1×10⁴ HM-2 cells in required medium with 10% FBS and 1% Pen Strep were seeded in 24-well culture plates in 1 ml medium and treated with indicated doses of BT5 for 4 days. Cells were collected, counted and re-plated at initial cell density with fresh medium and compound for another 4 days. On day 8, cells were collected, washed, and whole cell lysate was prepared using RIPA lysis buffer supplemented with 1X proteinase inhibitor cocktail. Western blot detection of histone H3K36me2 (Cell signaling technology #2901S, clone CZ5H12, dilution 1:2,000), histone H3K36me3 (Cell signaling technology, #4909S, clone D5A7, dilution 1:2,000), histone H3K27me3 (Cell signaling technology, #9733S, clone C36B11, dilution 1:2,000), H3K79me3 (abcam, #ab2621, dilution 1:2,000) was performed using 12% SDS-PAGE gel. Total H3 (abcam, #ab1791, dilution 1:50,000) and Actin (Santa Cruz, #sc-47778, dilution 1:10,000 or Genescript, #A00702, dilution 1:10,000) were used as loading controls.
Real-time qPCR
1×10⁵ NUP98-NSD1 cells in required medium with 10% FBS and 1% Pen Strep were seeded in 24-well culture plates in 1 ml medium and treated with indicated doses of BT5 for 4 days. Cells were collected, counted and re-plated at initial cell density with fresh medium and compound for another 4 days. On day 8, cells were collected, washed, and RNA was isolated using Qiagen RNA isolation kit as per manufacturer’s instructions. 250 ng to 1 μg of total RNA was then reverse transcribed to cDNA using HICAP RT kit from Applied Biosystems. Following cDNA synthesis, quantitative PCR was performed using Taqman probes for Hoxa9, Hoxa5, Hoxa7 and Meis125. Gene expression analysis was carried out using the 2-ΔΔCT relative quantification method. Duplicate reactions were performed for each tested sample, and the average CT was calculated for the quantification analysis. GAPDH was used as an endogenous reference control. Expression of NUP98-NSD1 was analyzed using pair of primers, including NUP98 forward primer (TACTACGACAGCCACTTTGGG) and NSD1 reverse primer (TCCAAAAGCCACTTGCTTGG). Quantitative PCR was performed using SYBR Green Supermix with ROX (BioRad) and GAPDH and b-actin were used as an endogenous reference control.
Chromatin Immunoprecipitation (ChIP)
3×10⁶ NUP98-NSD1 cells plated in 10 cm dish were treated with DMSO (0.25%) or 2 μM BT5 for 4 days. Following 4 days of incubation cells were fixed with 1% paraformaldehyde for 10 min at room temperature. Cells were then quenched with glycine for 5 min at room temperature. ChIP was performed using SimpleChIP® Enzymatic Chromatin IP Kit (Cell Signaling Technology; #9003) according to the manufacturer’s instructions. The DNA–protein complexes from equal number of cells (~ 4×10⁶ cells) treated with DMSO or 2 μM BT5 were immunoprecipitated using antibodies against H3K36me2 (Cell signaling technology#2901S, clone CZ5H12, dilution 1:100), H3K36me3 (Cell signaling technology# 4909S, clone D5A7, dilution 1:100), H3 (Cell Signaling Technology #4620S, clone D2B12, dilution 1:100) and normal IgG (Cell Signaling Technology #2729P, dilution 1:100) as the negative control overnight at 4 °C. The DNA was eluted using SimpleChIP® Enzymatic Chromatin IP Kit (Cell Signaling Technology; #9003) according to the manufacturer’s instructions and subjected to quantitative PCR using SYBR Green promoter region primers for mouse Hoxa925.
Cell viability experiments
Murine bone marrow derived cells (NUP98-NSD1, NUP98-HOXA9, MOZ-TIF2) were cultured in IMDM (Invitrogen) supplemented with 15 % h.i. FBS, 1% penicillin/streptomycin, 10 μg/mL murine IL3 (R & D Systems) and with 10 μg/mL murine SCF (Peprotech). Human leukemia cells K562 (ATCC), SET2 (DSMZ) and MOLM13 (DSMZ) were cultured in RPMI 1640 (Invitrogen) supplemented with 10 % FBS and 1 % penicillin/streptomycin (Invitrogen). SET-2 cells were cultured in RPMI 1640 supplemented with 20% FBS and 1 % penicillin/streptomycin. Cells were plated at 0.1 ×10⁵ to 2 × 10⁵ cells/mL (depending on cell line) and treated with varying concentrations of compounds (BT2, BT5 or BT6) and final 0.25% DMSO. Cells were cultured at 37 °C, 5% CO2 incubator for 7 days. Media were changed on day 4 and compounds were resupplied. Cell numbers were adjusted to initial levels. Cell suspensions (100 μL) were transferred to 96-well plates for each sample in quadruplicate. At day 7, 10 μL of MTT reagent (M6494, Molecular Probes™) was added to each well of the 96 well plate and incubated at 37°C for 4 hours. The formazan was then solubilized by adding 100 μL acidified 10% SDS solution and incubated at 37°C overnight. Plates were read for absorbance at 570 nm using a PHERAstar BMG microplate reader. The experiments were performed 2 times in quadruplicate with calculation of mean and SD for each condition. Data were analyzed in GraphPad Prism 8 to obtain GI50 values.
Colony assays with primary samples
Sample from leukemia patients with NUP98-NSD1 (#322) was received from Columbia University. Presence of NUP98-NSD1 translocation was validated by RNA-seq and sample #322 also contained mutations in WT1 and PTPN11. Patient sample with MLL-ENL also comprising mutations in FLT3, NRAS and STAG2 (#6315) was received from the Stem Cell and Xenograft Core at the University of Pennsylvania. The patient samples were transplanted into NSGS mice (Jackson lab) via tail vein injection (5 million cells and 8 million cells, respectively), which resulted in development of terminal leukemia. The leukemia cells were harvested from the spleen of the primary leukemia mice and frozen in 10% DMSO, 50% of FBS in IMDM until used in further experiments.
For colony formation assays, cells were thawed and cultured in IMDM media with 20% BIT9500 (9500, STEMCELL), 100 ng/mL hSCF, 20 ng/mL hIL-3, 20 ng/mL hIL6, 10 ng/mL hFLT3L, 20 ng/mL hGM-CSF and 20 ng/mL hG-CSF(Peptrotech) for short time (2–4 hours). Subsequently, cells were plated in triplicates on methylcellulose medium supplemented with human cytokines (MethoCult H4435; StemCell Technologies) with cell density of 2.5 *104 cells per 1ml. Following addition of BT5 or DMSO, samples were plated in 35 mm dishes, incubated for 10 days, and counted. CD34+ cells (Stem Cell and Xenograft Core at the University of Pennsylvania) were thawed and cultured using the same method as described above, and used for colony forming assay at 750 cells/mL density.
Data availability Statement
Crystal structure of NSD1 (PDB code 3OOI) was used as search model to determine the structures reported here. Crystal structures of NSD1 and NSD1 in complex with BT3 have been deposited in PDB under the accession codes 6KQP and 6KQQ, respectively.
Supplementary Material
Extended Data
Extended Data Fig 1. Crystal structure of NSD1 SET domain and mapping of the binding of BT2 using NMR.

a) Superposition of the crystal structure of NSD1 SET domain (residues 1863–2085) determined in this work (magenta) onto the previously described crystal structure of NSD1 SET (PDB code 3OOI, green). Positions of the N- and C- termini are labeled and SAM is in blue sticks. b) Ribbon (left) and surface (right) representations of NSD1 SET domain (residues 1863–2085) with mapped residues undergoing strong chemical shift perturbations (ΔσHN > 0.05ppm or ΔσN > 0.5ppm) upon binding of BT2 (shown in red).
Extended Data Fig. 2. Crystal structure of NSD1 SET domain in complex with covalently bound compound BT3.

a) The crystal structure of NSD1 SET domain (residues 1863–2085) with bound BT3 (blue), SAM (pale blue) and mapped residues undergoing strong chemical shift perturbations (ΔσHN > 0.05ppm or ΔσN > 0.5ppm) upon binding of BT3 (shown in red). Disulfide-bond dimer of BT3 found in the structure (pale green). The dimer binds in a site that is distant from inhibitor binding and lack of chemical shift perturbations in this area indicates that this represents a crystallization artifact. b) Same as in panel a rotated by 90 deg.
Extended Data Fig. 3. BT3 and BT5 bind to the same site on NSD1 SET domain.
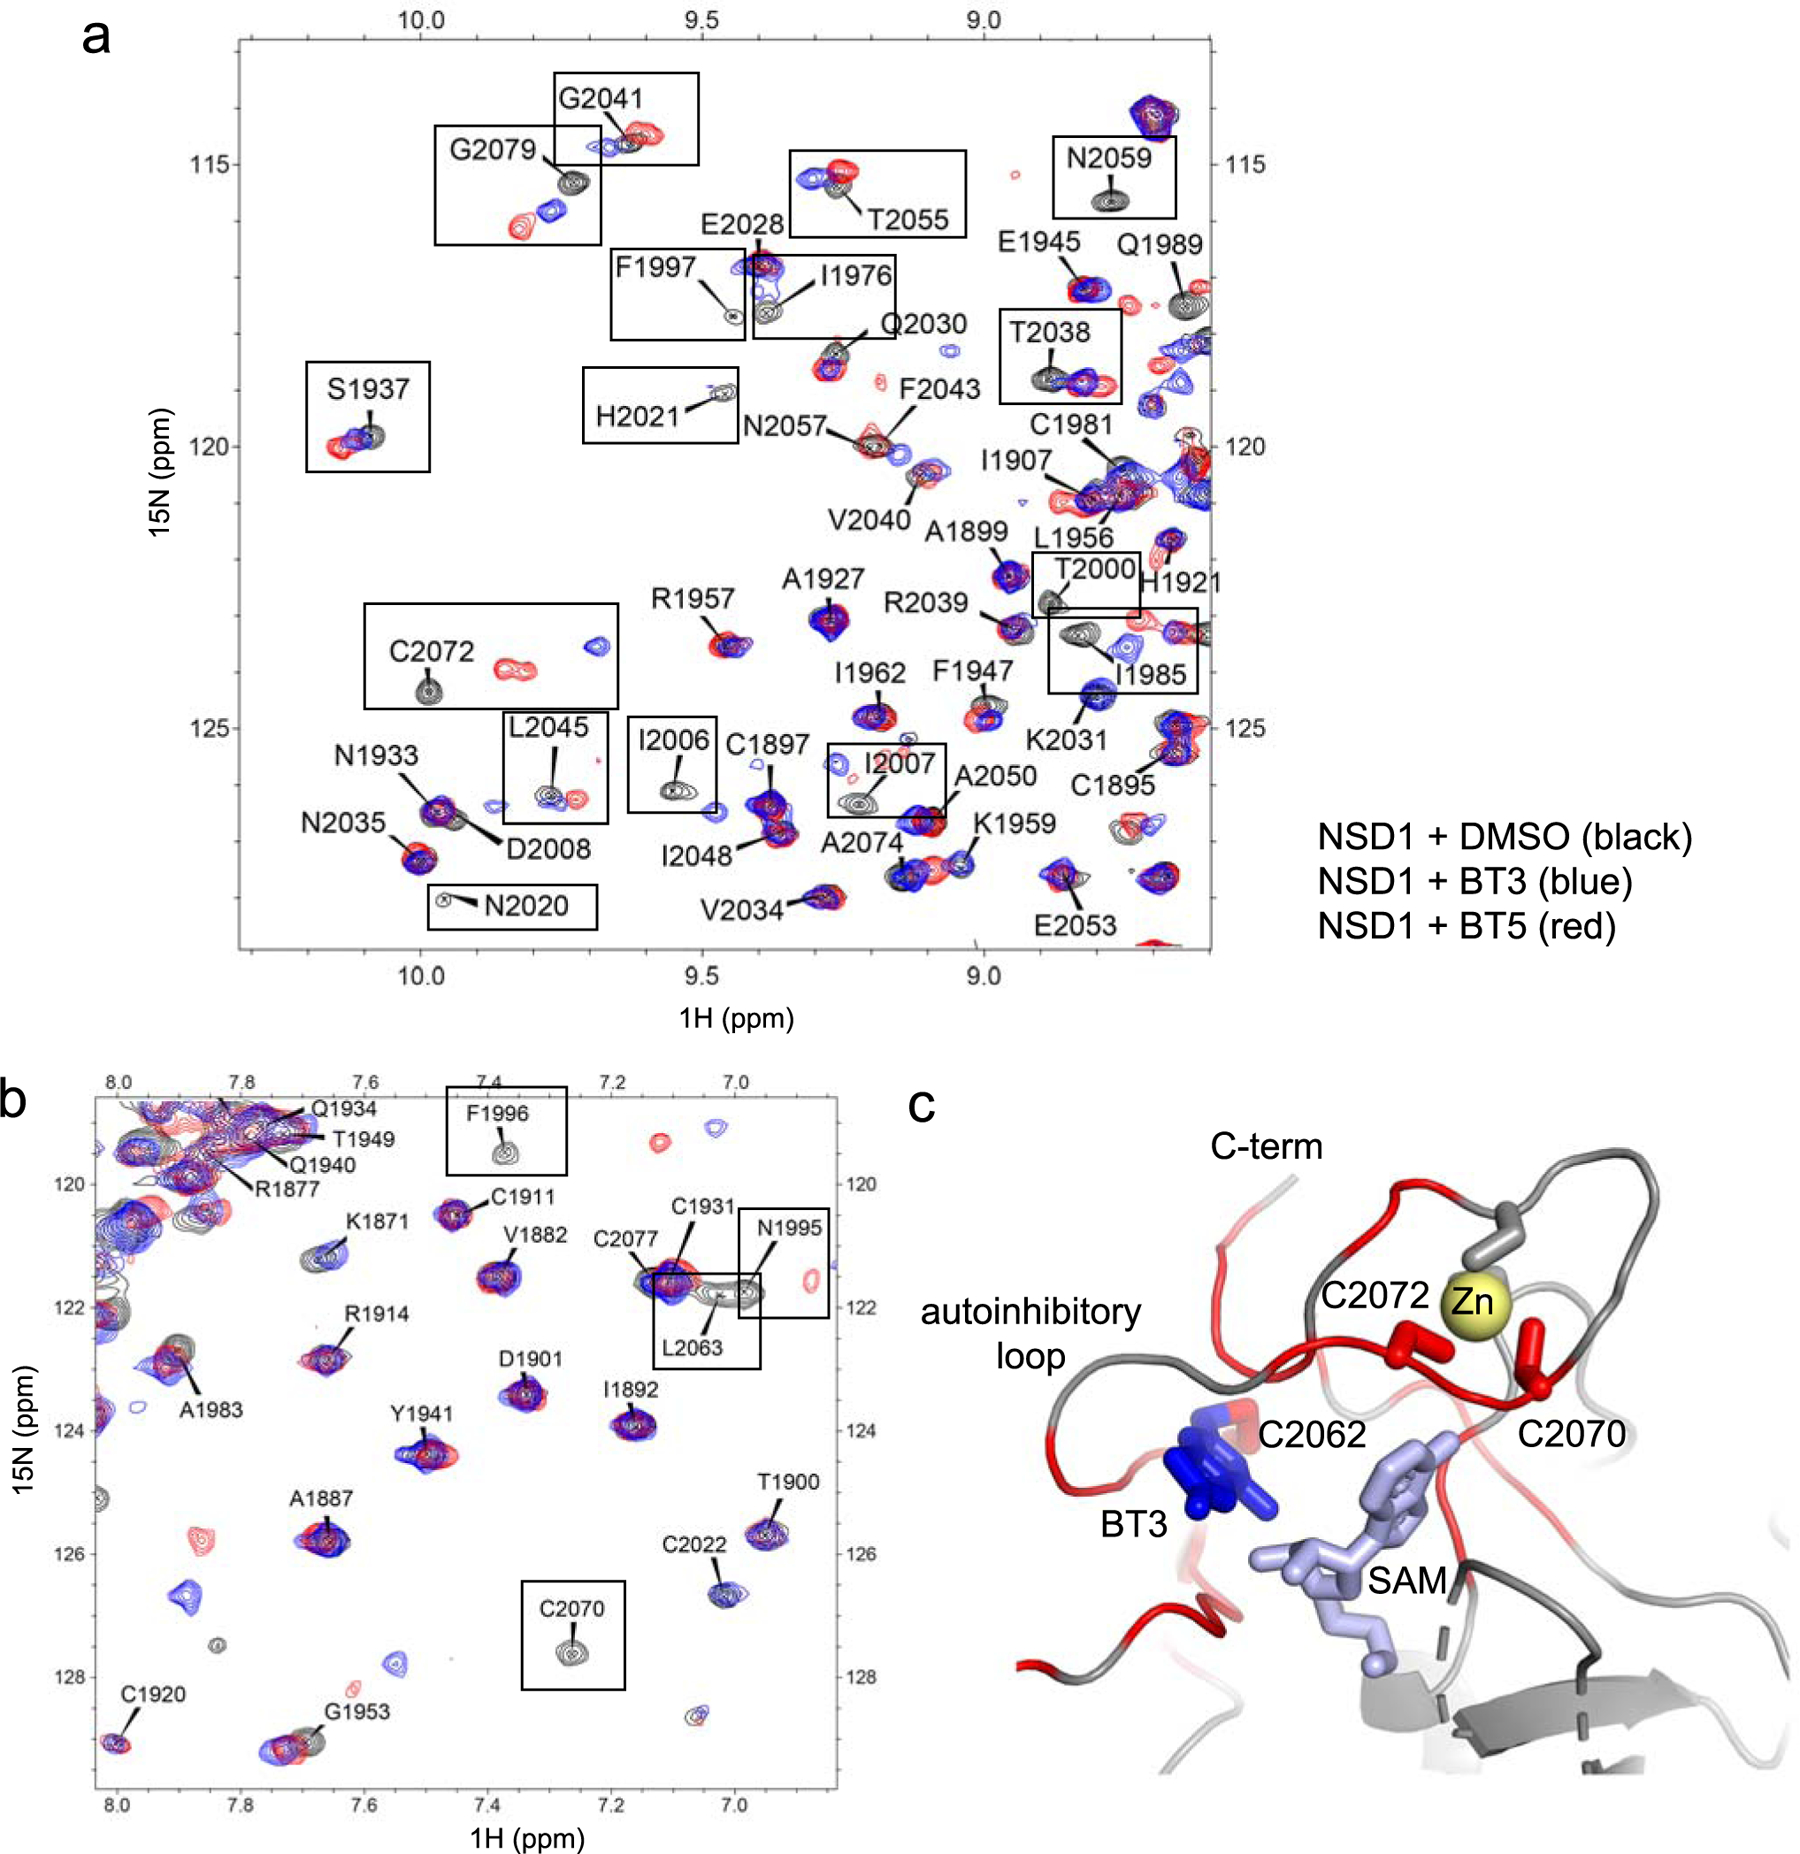
(a,b) Comparison of the two different fragments of 1H-15N HSQC spectra of 150 μM NSD1 SET domain (black), with 500 μM compound BT3 (blue) or 300 μM compound BT5 (red). Selected residues perturbed by both compounds BT3 and BT5 are boxed. (c) The crystal structure of NSD1-BT3 complex showing chemical shift perturbations (ΔσHN > 0.05ppm or ΔσN > 0.5ppm) upon binding of BT3 (shown in red). Position of two cysteine residues (C2070 and C2072) involved in Zn coordination and strongly perturbed upon binding of BT3 is shown.
Extended Data Fig. 4. Compound BT5 does not bind covalently to NSD1 C2062A SET domain.

(a) MS spectra of 1 μM wild-type NSD1 SET domain incubated with DMSO (left) or 16 μM BT5 (right) for 2 h showing 51% covalent engagement with BT5. (b) MS spectra of 1 μM NSD1 C2062A SET domain incubated with DMSO (left) or 16 μM BT5 (right) for 2 h. No covalent engagement of BT5 is observed (expected mass 30,066 Da). Representative spectra shown are from two independent experiments (n=2).
Extended Data Fig. 5. Treatment with BT5 lacks engagement with NSD2 and NSD3 in cells.

CETSA assay in HEK293T cells transfected with FLAG-NSD2 SET (top) or FLAG-NSD3 SET (bottom) constructs treated with DMSO or 5 μM BT5. Cell lysates were incubated for 3 min at indicated temperatures. Experiments were performed two times.
Acknowledgements
This work was funded by the National Institute of Health (NIH) R01 grants CA226759 and CA207272 to T.C., 1R01 CA160467 and R01 CA229250 to J. G., LLS TRP grants 6111-14 and 6564-19 to T.C., 6485-16 and 6579-20 to J.G. and LLS Scholar grants (1340-17) to T.C. and (1215-14) to J.G. C.A.H. is supported by Chemistry Biology Interface (CBI) Training Program (T32GM008597). J.G. is Rogel Scholar at the University of Michigan. This work was also supported by the Chemotherapy Foundation (AF) and NIH grants R35 CA210065 (AF) and P30 CA013696 (Flow Cytometry Shared Resource). This research used resources of the Advanced Photon Source, a U.S. Department of Energy (DOE) Office of Science User Facility operated for the DOE Office of Science by Argonne National Laboratory under Contract No. DE-AC02-06CH11357. Use of the LS-CAT Sector 21 was supported by the Michigan Economic Development Corporation and the Michigan Technology Tri-Corridor (Grant 085P1000817). NUP98-NSD1 construct has been a kind gift from Dr Aniruddha J. Deshpande. MOZ-TIF2 construct was provided by Dr. I. Kitabayashi and NUP98-HOXA9 cells were provided by Dr. H Xu.
Competing Financial Interests statement
HH, CAH, SZ, HJC, MAP, JG, TC are co-inventors on patent application for NSD1 inhibitors. TC and JG received prior support from Kura Oncology for unrelated project; they received licensing royalties from Kura Oncology. AF is consulting for Ayala Pharmaceuticals and SpringWorks Therapeutics; he received previous research support by Pfizer, Brystol Myers Squib, Merck, Eli Lilly; patent and reagent licensing royalties from Novartis, EMD Millipore and Applied Biological Materials.
References
- 1.Bennett RL, Swaroop A, Troche C & Licht JD The Role of Nuclear Receptor-Binding SET Domain Family Histone Lysine Methyltransferases in Cancer. Cold Spring Harb Perspect Med 7 (2017). [DOI] [PMC free article] [PubMed] [Google Scholar]
- 2.Wagner EJ & Carpenter PB Understanding the language of Lys36 methylation at histone H3. Nat Rev Mol Cell Biol 13, 115–126 (2012). [DOI] [PMC free article] [PubMed] [Google Scholar]
- 3.Morishita M & di Luccio E Cancers and the NSD family of histone lysine methyltransferases. Biochim Biophys Acta 1816, 158–163 (2011). [DOI] [PubMed] [Google Scholar]
- 4.Job B et al. Genomic aberrations in lung adenocarcinoma in never smokers. PLoS One 5, e15145 (2010). [DOI] [PMC free article] [PubMed] [Google Scholar]
- 5.Bianco-Miotto T et al. Global levels of specific histone modifications and an epigenetic gene signature predict prostate cancer progression and development. Cancer Epidemiol Biomarkers Prev 19, 2611–2622 (2010). [DOI] [PubMed] [Google Scholar]
- 6.Cancer Genome Atlas N Comprehensive genomic characterization of head and neck squamous cell carcinomas. Nature 517, 576–582 (2015). [DOI] [PMC free article] [PubMed] [Google Scholar]
- 7.Hollink IH et al. NUP98/NSD1 characterizes a novel poor prognostic group in acute myeloid leukemia with a distinct HOX gene expression pattern. Blood 118, 3645–3656 (2011). [DOI] [PubMed] [Google Scholar]
- 8.Shiba N et al. NUP98-NSD1 gene fusion and its related gene expression signature are strongly associated with a poor prognosis in pediatric acute myeloid leukemia. Genes Chromosomes Cancer 52, 683–693 (2013). [DOI] [PubMed] [Google Scholar]
- 9.Deshpande AJ et al. AF10 regulates progressive H3K79 methylation and HOX gene expression in diverse AML subtypes. Cancer Cell 26, 896–908 (2014). [DOI] [PMC free article] [PubMed] [Google Scholar]
- 10.Wang GG, Cai L, Pasillas MP & Kamps MP NUP98-NSD1 links H3K36 methylation to Hox-A gene activation and leukaemogenesis. Nat Cell Biol 9, 804–812 (2007). [DOI] [PubMed] [Google Scholar]
- 11.Qiao Q et al. The structure of NSD1 reveals an autoregulatory mechanism underlying histone H3K36 methylation. J Biol Chem 286, 8361–8368 (2011). [DOI] [PMC free article] [PubMed] [Google Scholar]
- 12.Shen Y et al. Identification of LEM-14 inhibitor of the oncoprotein NSD2. Biochem Biophys Res Commun 508, 102–108 (2019). [DOI] [PubMed] [Google Scholar]
- 13.Coussens NP et al. High-throughput screening with nucleosome substrate identifies small-molecule inhibitors of the human histone lysine methyltransferase NSD2. J Biol Chem 293, 13750–13765 (2018). [DOI] [PMC free article] [PubMed] [Google Scholar]
- 14.Tisi D et al. Structure of the Epigenetic Oncogene MMSET and Inhibition by N-Alkyl Sinefungin Derivatives. ACS Chem Biol 11, 3093–3105 (2016). [DOI] [PubMed] [Google Scholar]
- 15.Morrison MJ et al. Identification of a peptide inhibitor for the histone methyltransferase WHSC1. PLoS One 13, e0197082 (2018). [DOI] [PMC free article] [PubMed] [Google Scholar]
- 16.Hopkins AL, Keseru GM, Leeson PD, Rees DC & Reynolds CH The role of ligand efficiency metrics in drug discovery. Nat Rev Drug Discov 13, 105–121 (2014). [DOI] [PubMed] [Google Scholar]
- 17.Degani Y, Neumann H & Patchornik A Selective cyanylation of sulfhydryl groups. J Am Chem Soc 92, 6969–6971 (1970). [DOI] [PubMed] [Google Scholar]
- 18.Fick RJ et al. Sulfur-Oxygen Chalcogen Bonding Mediates AdoMet Recognition in the Lysine Methyltransferase SET7/9. ACS Chem Biol 11, 748–754 (2016). [DOI] [PubMed] [Google Scholar]
- 19.Abdeldayem A, Raouf YS, Constantinescu SN, Moriggl R & Gunning PT Advances in covalent kinase inhibitors. Chem Soc Rev (2020). [DOI] [PubMed] [Google Scholar]
- 20.McGregor LM, Jenkins ML, Kerwin C, Burke JE & Shokat KM Expanding the Scope of Electrophiles Capable of Targeting K-Ras Oncogenes. Biochemistry 56, 3178–3183 (2017). [DOI] [PMC free article] [PubMed] [Google Scholar]
- 21.Strelow JM A Perspective on the Kinetics of Covalent and Irreversible Inhibition. SLAS Discov 22, 3–20 (2017). [DOI] [PubMed] [Google Scholar]
- 22.Rogawski DS et al. Two Loops Undergoing Concerted Dynamics Regulate the Activity of the ASH1L Histone Methyltransferase. Biochemistry 54, 5401–5413 (2015). [DOI] [PMC free article] [PubMed] [Google Scholar]
- 23.Martinez Molina D et al. Monitoring drug target engagement in cells and tissues using the cellular thermal shift assay. Science 341, 84–87 (2013). [DOI] [PubMed] [Google Scholar]
- 24.Dart ML et al. Homogeneous Assay for Target Engagement Utilizing Bioluminescent Thermal Shift. ACS Med Chem Lett 9, 546–551 (2018). [DOI] [PMC free article] [PubMed] [Google Scholar]
- 25.Borkin D et al. Pharmacologic inhibition of the Menin-MLL interaction blocks progression of MLL leukemia in vivo. Cancer Cell 27, 589–602 (2015). [DOI] [PMC free article] [PubMed] [Google Scholar]
- 26.Xu H et al. NUP98 Fusion Proteins Interact with the NSL and MLL1 Complexes to Drive Leukemogenesis. Cancer Cell 30, 863–878 (2016). [DOI] [PMC free article] [PubMed] [Google Scholar]
- 27.Shima H et al. Ring1A and Ring1B inhibit expression of Glis2 to maintain murine MOZ-TIF2 AML stem cells. Blood 131, 1833–1845 (2018). [DOI] [PubMed] [Google Scholar]
- 28.Edmunds JW, Mahadevan LC & Clayton AL Dynamic histone H3 methylation during gene induction: HYPB/Setd2 mediates all H3K36 trimethylation. EMBO J 27, 406–420 (2008). [DOI] [PMC free article] [PubMed] [Google Scholar]
- 29.Hansen R et al. The reactivity-driven biochemical mechanism of covalent KRAS(G12C) inhibitors. Nat Struct Mol Biol 25, 454–462 (2018). [DOI] [PubMed] [Google Scholar]
- 30.Eram MS et al. Kinetic characterization of human histone H3 lysine 36 methyltransferases, ASH1L and SETD2. Biochim Biophys Acta 1850, 1842–1848 (2015). [DOI] [PubMed] [Google Scholar]
- 31.Wu H et al. Structural biology of human H3K9 methyltransferases. PLoS One 5, e8570 (2010). [DOI] [PMC free article] [PubMed] [Google Scholar]
- 32.Eram MS et al. Trimethylation of histone H3 lysine 36 by human methyltransferase PRDM9 protein. J Biol Chem 289, 12177–12188 (2014). [DOI] [PMC free article] [PubMed] [Google Scholar]
- 33.Del Rizzo PA et al. SET7/9 catalytic mutants reveal the role of active site water molecules in lysine multiple methylation. J Biol Chem 285, 31849–31858 (2010). [DOI] [PMC free article] [PubMed] [Google Scholar]
- 34.Delaglio F et al. NMRPipe: a multidimensional spectral processing system based on UNIX pipes. J Biomol NMR 6, 277–293 (1995). [DOI] [PubMed] [Google Scholar]
- 35.Otwinowski Z & Minor W Processing of X-ray diffraction data collected in oscillation mode. Methods Enzymol 276, 307–326 (1997). [DOI] [PubMed] [Google Scholar]
- 36.Vagin A & Teplyakov A Molecular replacement with MOLREP. Acta Crystallogr D Biol Crystallogr 66, 22–25 (2010). [DOI] [PubMed] [Google Scholar]
- 37.Afonine PV et al. Towards automated crystallographic structure refinement with phenix.refine. Acta Crystallogr D Biol Crystallogr 68, 352–367 (2012). [DOI] [PMC free article] [PubMed] [Google Scholar]
- 38.McCoy AJ et al. Phaser crystallographic software. J Appl Crystallogr 40, 658–674 (2007). [DOI] [PMC free article] [PubMed] [Google Scholar]
- 39.Emsley P, Lohkamp B, Scott WG & Cowtan K Features and development of Coot. Acta Crystallogr D Biol Crystallogr 66, 486–501 (2010). [DOI] [PMC free article] [PubMed] [Google Scholar]
- 40.Jo SY, Granowicz EM, Maillard I, Thomas D & Hess JL Requirement for Dot1l in murine postnatal hematopoiesis and leukemogenesis by MLL translocation. Blood 117, 4759–4768 (2011). [DOI] [PMC free article] [PubMed] [Google Scholar]
Associated Data
This section collects any data citations, data availability statements, or supplementary materials included in this article.
Supplementary Materials
Data Availability Statement
Crystal structure of NSD1 (PDB code 3OOI) was used as search model to determine the structures reported here. Crystal structures of NSD1 and NSD1 in complex with BT3 have been deposited in PDB under the accession codes 6KQP and 6KQQ, respectively.