

Abstract
Purpose:
Pancreatic cancer is among the most aggressive malignancies and is rarely discovered early. However, pancreatic ‘incidentalomas’, particularly cysts, are frequently identified in asymptomatic patients through anatomical imaging for unrelated causes. Accurate determination of the malignant potential of cystic lesions could lead to life-saving surgery or spare patients with indolent disease undue risk. Current risk assessment of pancreatic cysts requires invasive sampling, with attendant morbidity and sampling errors. Here, we sought to identify imaging biomarkers of high-risk pancreatic cancer precursor lesions.
Experimental Design:
Translocator protein (TSPO) expression, which is associated with cholesterol metabolism, was evaluated in pre-malignant and pancreatic cancer lesions from human and genetically engineered mouse (GEM) tissues. In vivo imaging was performed with [18F]V-1008, a TSPO-targeted positron emission tomography (PET) agent, in two GEM models. For image-guided surgery (IGS), V-1520, a TSPO ligand for near-infrared optical imaging based upon the V-1008 pharmacophore, was developed and evaluated.
Results:
TSPO was highly expressed in human and murine pancreatic cancer. Notably, TSPO expression was associated with high-grade, pre-malignant intraductal papillary mucinous neoplasms (IPMNs) and pancreatic intraepithelial neoplasia (PanIN) lesions. In GEM models, [18F]V-1008 exhibited robust uptake in early pancreatic cancer, detectable by PET. Furthermore, V-1520 localized to pre-malignant pancreatic lesions and advanced tumors enabling real-time IGS.
Conclusions:
We anticipate that combined TSPO PET/IGS represents a translational approach for precision pancreatic cancer care through discrimination of high-risk indeterminate lesions and actionable surgery.
Keywords: Pancreatic Cancer, Translocator Protein (TSPO), Image-guided Surgery, PET Imaging, Fluorescence Imaging
Introduction
Pancreatic cancer is a leading cause of cancer-related deaths in the United States and abroad and is projected to be the second most common cause of death from cancer by 2030 (1–3). Despite growing awareness and targeted research efforts aimed at improved diagnosis and treatment, the overall five-year survival rate for pancreatic cancer remains less than 10 percent (1). New ways to diagnose pancreatic cancer earlier are urgently needed and need to include predicting future cancer through identifying high-risk, pre-malignant precursor lesions. Identifying precursor lesions of various subtypes likely to progress to pancreatic cancer, such as high-grade pancreatic intraepithelial neoplasias (PanINs) or intraductal papillary mucinous neoplasms (IPMNs), could improve outcomes associated with this disease. The goal of this work was to develop a translational approach for precision pancreatic cancer care through non-invasive discrimination of high-risk indeterminate lesions and pancreatic cancer, as well as subsequent actionable surgery.
Cystic lesions of the pancreas are common incidental findings (‘incidentalomas’) in routine cross-sectional computed tomography (CT) and magnetic resonance imaging (MRI) (4–6). Though IPMNs are frequently non-malignant at the time of diagnosis, over time, many are capable of progressing to invasive pancreatic ductal adenocarcinoma (PDAC) (7, 8). Discovery of a pancreatic cyst results in a lifelong clinical management dilemma due to a lack of tools capable of determining its malignant potential. Conventional imaging tests rely on crude metrics such as cyst size, main pancreatic duct involvement, or solid components within the cyst, none of which provide molecular information or adequately predict malignant potential (9–12). As a result, preemptively, IPMNs account for a disproportionate number of pancreatic resections (~30%), with attendant morbidity and mortality associated with aggressive surgery (13). Improved non-invasive imaging biomarkers of high-risk lesions that would benefit from surgical resection are needed.
Once a decision is made for pancreatic surgery, surgeons rely on visual and tactile information to differentiate tumor and surrounding non-tumor tissue. However, challenges associated with this determination often lead to incomplete resection and recurrence. Image-guided surgery (IGS) is reported to improve resection margins in a number of cancer types (Reviewed in (14, 15)), including pancreatic cancer (16–19). Given the current lack of imaging tools capable of selecting patients for surgery, coupled with the potential for improved outcomes stemming from IGS of pancreatic cancer, we envisioned a companion, multi-modal approach centered around a single molecular target that combines non-invasive PET imaging with fluorescence-based IGS.
In this study, we evaluated translocator protein (TSPO) expression as a potential biomarker of high-risk pre-malignant lesions and pancreatic cancer. TSPO is an 18 kDa protein involved in cholesterol metabolism that is elevated in many human cancers, including glioma (20, 21), colon cancer (22, 23), and breast cancer (23–26). We evaluated TSPO expression in human pancreatic cancer through immunohistochemical (IHC) staining of pancreatic tissue microarrays (TMAs) consisting of different grades of pancreatic cancer as well as pre-malignant cystic lesions (IPMNs). We also evaluated expression of TSPO in genetically engineered mouse (GEM) models of pancreatic cancer (Ptf1a-Cre;LSL-KrasG12D/+ (KC), Ptf1a-Cre;LSL-KrasG12D/+;Tgfbr2+/− (KTC), and Ptf1a-Cre;LSL-KrasG12D/+;Smad4fl/fl (KSC)). In both settings, TSPO levels were associated with high-grade pre-malignant lesions, including IPMNs and PanINs. We previously developed and utilized TSPO ligands for cancer imaging (20, 21, 25–38). Given the observed TSPO expression profiles, we evaluated one such PET imaging ligand, [18F]V-1008 (20, 29, 31, 33), for non-invasive imaging of pancreatic cancer within the context of two GEM models. Subsequently, to facilitate IGS, we developed a TSPO imaging ligand for near-infrared optical imaging based upon the V-1008 PET ligand pharmacophore. In a GEM model, the nanomolar affinity optical imaging ligand, V-1520, localized to pre-malignant pancreatic lesions and advanced tumors enabling preclinical, real-time IGS. Taken together, results presented here suggest that combined TSPO PET/IGS represents a novel, translational approach for precision pancreatic cancer care through discrimination of high-risk indeterminate lesions and actionable surgery.
Materials and Methods
Pancreas tissue microarrays (TMAs)
A pancreatic TMA was generously provided by Dr. Michael Goggins (Johns Hopkins). A separate TMA was generated by the Vanderbilt Translational Pathology Shared Resource (TPSR) at Vanderbilt University Medical Center (VUMC). The TMAs contain cores from 40 normal pancreas samples, 39 chronic pancreatitis (CP) samples, 8 Grade 1 pancreatic cancer samples, 33 Grade 2 pancreatic cancer samples, and 13 Grade 3 pancreatic cancer samples. All staining was performed by hand. Antigen retrieval was performed in pH 6.0 Citrate Buffer for 15 minutes at 105 °C using a pressure cooker followed by cool down for 10 minutes at room temperature. Samples were quenched with 0.03% H2O2 with sodium azide for 5 minutes. The samples were then incubated with primary antibody against TSPO (PBR Goat Polyclonal Antibody, Novus Biologicals NB100-41398) at a dilution of 1:1000 for 60 minutes. Detection was performed by incubating with Goat Probe (BioCare Medical) for 10 minutes and HRP Polymer (BioCare Medical #GHP516) for 10 minutes followed by 3, 3’-diaminobenzidine (DAB+) chromogen for 5 minutes. All incubations were performed at room temperature. Positive tissue controls were included.
Slides were scored by three independent reviewers (J.L., M.H., and H.C.M.) and scores were confirmed by an expert GI pathologist (C.S.). TSPO IHC expression was assessed using an intensity score-derived methodology which defined no expression as zero, weak expression as one, moderate expression as two, and strong expression as three.
Another TMA consisting of dysplastic IPMN samples from 65 patients was also utilized. This TMA was generated by the Vanderbilt TPSR at VUMC. Dysplasia scores ranged from 0 to 4. Patients with dysplasia scores of 0 or 1 were assigned to low-grade dysplasia, 2 to intermediate-grade dysplasia, and 3 or 4 to high-grade dysplasia. The highest dysplasia grade per patient was used. The TMA contained a total of 20 low-grade dysplasia samples, 23 intermediate-grade dysplasia samples, and 22 high-grade dysplasia samples. TSPO staining was performed as above and was scored as Negative (0), Weak (1 or 2), Moderate (3 or 4), or Strong (5 or 6). For statistical analyses, TSPO staining was categorized into three groups defined as Weak (IHC score of 0, 1 or 2), Moderate (IHC score of 3 or 4), and Strong (IHC score of 5 or 6).
Genetically Engineered Mouse (GEM) Models
All animal procedures were in compliance with federal and institutional guidelines and were approved by the Vanderbilt Institutional Animal Care and Use Committee. Three validated genetically engineered mouse models which recapitulated genetic mutations relevant in human pancreatic cancer were generated and included: Ptf1a-Cre;LSL-KrasG12D/+ (KC), Ptf1a-Cre;LSL-KrasG12D/+;Tgfbr2+/− (KTC), and Ptf1a-Cre;LSL-KrasG12D/+;Smad4fl/fl (KSC). Genetically engineered models more closely mimic the development and presentation of human disease in comparison to tumor xenografts (39–44). KC mice progress to higher grade PanIN lesions (42) and were chosen to model pre-invasive disease. Advanced disease was modeled using KTC (43) and KSC (43, 44) mice. These mice are generated using the Cre-loxP system driven by the endogenous pancreas-specific locus Ptf1a (pancreatic transcription factor-1a) as previously described (42–44). Ptf1a plays an essential role in mammalian pancreatic development and differentiation (45). The stop codon between two loxP sites was excised using Cre-Lox recombination to activate the Kras mutation (KrasG12D) (43). Ptf1a-Cre, Ptf1a-Cre;Tgfbr2fl/fl, and Ptf1a-Cre;Smad4fl/fl mice were mated with LSL-KrasG12D/+ mice to obtain the KC, KTC, and KSC mice respectively as well as littermate control mice. Animals possessing single vector (i.e. Kras, Cre, Tgfbr2, or Smad4 only) or wild genotypes were utilized as age-matched controls. Genotyping by polymerase chain reaction (PCR) was performed 3 weeks after birth to identify the genetically engineered mice and controls needed for the experiments. TSPO PET and fluorescence imaging were evaluated at regular intervals that approached the median survival for each model. KTC and KSC mice were imaged up to twelve weeks of age to account for the rapid progression of tumors in these models (43, 44, 46). Animals were weighed and sacrificed for tissue collection shortly after in vivo imaging and white light photographs obtained during tissue resection to document relative location, size, and shape of the pancreas.
Immunostaining of Mouse Tissues
Pancreases were isolated from normal and genetically engineered mice at 4, 9 and ≥12 weeks of age. Tissues were fixed in cold 4% paraformaldehyde for 1–2 hours for normal tissues and 16–18 hours for tumor-bearing tissues. Duration of fixation was lengthened for tumor-bearing samples due to the increase in stromal density in these tissues. Following fixation, samples were embedded into paraffin blocks. Tissues were sectioned (5 μm thickness) and stained for TSPO. All staining was performed by hand. Antigen retrieval was performed on all samples in pH 6.0 Citrate Buffer for 15 minutes at 105 °C using a pressure cooker followed by cool down for 10 minutes at room temperature. Samples were quenched with 0.03% H2O2 with sodium azide for 5 minutes. The samples were then incubated with primary antibody against TSPO (PBR Rabbit Monoclonal Antibody, Novus Biologicals NBP1–95674) at a dilution of 1:400 for 60 minutes. Detection was performed by incubating with Dako K4003 EnVision+ System HRP labelled polymer Anti-Rabbit for 20 minutes followed by 3, 3’-diaminobenzidine (DAB+) chromogen for 5 minutes. All incubations were performed at room temperature. Additional tissue slices were stained using standard hematoxylin and eosin (H&E) and Masson’s trichrome methods. Tissues were reviewed by an expert GI pathologist (C.S.)
Chemistry
[18F]V-1008 was produced as published (20, 29). For small animal imaging studies, radiochemical purities were >99% and radiochemical specific activities were within the range of 170 ± 80 TBq/mmol. For blocking studies, V-8310, 7-chloro-N,N,5-trimethyl-4-oxo-3(6-fluoropyridin-2-yl)-3,5-dihydro-4H-pyridazino[4,5-b]indole-1-acetamide, was synthesized as reported (30).
NIR probe V-1520 was synthesized using a similar method to that previously described for an analogous tracer (38). Briefly, LI-COR IRDye 800CW NHS ester was purchased from LI-COR Biosciences (Lincoln, NE). The dye (2 eq) and the unconjugated ligand were dissolved by stirring in dry dimethyl sulfoxide (DMSO) in the presence of triethylamine (TEA, 2 eq) in an argon-flushed vessel. The reaction was allowed to stir overnight, protected from room light, at room temperature. The product was purified by reverse phase high performance liquid chromatography (HPLC) on a semi-prep HPLC using a C18 column (Varian, 4 μm). The product was eluted with 50/50 acetonitrile/water as mobile phase. High resolution mass spectrometry was performed to confirm synthesis of the desired product: C76H97N7O16S4 m/z = 746.8010 (M+2H2+), found 746.8020; m/z = 1492.5947 (M+H+), found 1492.5958.
PET imaging and Analysis
Animal handling and preparation for and during PET imaging studies were performed analogously to previously described methods (47). Upon study commencement, animals were anesthetized using 2% isofluorane anesthesia in 100% oxygen at 2 L/min and kept warm throughout the duration of the PET scan. For PET imaging of KTC mice, animals were administered 10.4-11.8 MBq of PET imaging agent via intravenous injection and imaged using a dedicated Concorde Microsystems Focus 220 microPET scanner (Siemens Preclinical Solutions). PET images were acquired as 60-minute dynamic data sets initiated upon PET agent injection. Images were acquired at designated time points which corresponded with the age of the animal.
PET data were reconstructed using a three-dimensional (3D) ordered subset expectation maximization/maximum a posteriori (OSEM3D/MAP) algorithm. Dynamic data was binned into twelve 5 second (0-1 minute) and fifty-nine 60 second (2-60 minute) frames. The resulting three-dimensional reconstructions had an x-y voxel size of 0.474 mm and inter-slice distance of 0.796 mm. For quantification of PET agent uptake, ASIPro software (Siemens Preclinical Solutions) was used to manually draw three-dimensional regions of interest (ROIs) around the entire tumor volume and the measured counts converted to the percentage of the injected dose per gram of tissue (%ID/g). To aid in the localization of tumor-bearing pancreas, high field anatomical magnetic resonance imaging (MRI) images were collected either immediately before or after PET imaging acquisitions. For initial evaluations, PET and MRI images were manually proportioned and overlaid using commercially available image processing software.
For PET imaging of KSC mice, animals were administered 6.6-9.7 MBq of PET imaging agent in 100 μL via retroorbital injection. The mice were then returned to their cages and fed ad libitum for 40 minutes. Mice were anesthetized with 2% isofluorane and imaged for 20 minutes in an Inveon microPET (Siemens Preclinical Solutions). All data sets were reconstructed using the MAP algorithm into 128 x 128 x 95 slices with a voxel size of 0.095 x 0.095 x 0.08 cm3 at a beta value of 0.01. For anatomical CT images, immediately following the PET scans, the mice were imaged in a NanoSPECT/CT (Bioscan) at an x-ray beam intensity of 90 mAs with an x-ray energy of 45 kVp. The images were reconstructed at 170 x 170 x 114 with a voxel size of 0.4 x 0.4 x 0.4 mm3. To aid in the localization of tumor-bearing pancreas, high field anatomical MRI were collected the day following PET imaging acquisitions. The MRI, PET, and CT images were loaded onto the image analysis tool Amide (www.souceforge.net). The PET and CT images were co-registered based on bed position. Then, the MR images were co-registered to the CT images visually based on biological fiducial markers such as kidneys. ROIs were drawn around the tumors in the PET scans.
MR imaging and Analysis
For MRI acquisitions of KTC mice, animals were secured in a prone position in a 38-mm inner diameter radiofrequency coil and placed in a 7.0T (16 cm bore) Varian small animal imaging system. Throughout scanning, animals were warmed to 37 °C using heated air flow and maintained under anesthesia using 2% isofluorane anesthesia in 100% oxygen at 2 L/min. Following localization of the pancreas using multi-slice gradient echo images of all three imaging planes, T2-weighted fast-spin echo images were acquired over 22 slices in the axial and coronal planes using a 25.6 mm x 25.6 mm field of view, 1.0 mm slice thickness, and a 256 x 256 data matrix. Additional parameters included a 2 s repetition time, 36 ms effective echo time, 9 ms echo spacing, and an echo train length of 8. A pneumatic pillow was used to monitor the respiration cycle of the animals, as well as trigger the imaging acquisition to collect data at the same time point in the respiration cycle, in order to reduce motion-induced imaging artifacts.
For MRI acquisitions of KSC mice, mice were anesthetized via inhalation of 2%/98% isofluorane/oxygen. Animals were secured in the prone position in an in-house fabricated animal cradle with bite bar and placed in a 25-mm inner diameter radiofrequency (RF) coil. Animals were then placed in a 7T Bruker Avance III horizontal bore imaging system (Bruker BioSpin, Billerica, MA) for data collection. Respiration rate and internal body temperature were continuously monitored, and a constant body temperature of 37 °C was maintained using heated air flow. For each animal, multi-slice gradient echo images were collected in all three imaging planes (axial, sagittal, and coronal) in order to localize the pancreas, with repetition time (TR) = 75 ms, echo time (TE) = 5 ms, slice thickness = 2 mm, flip angle = 35°, and an average of 4 acquisitions. Additional parameters include field of view (FOV) = 50 mm x 50 mm and data matrix = 128 x 128. Following localization of the pancreas, T2-weighted fast-spin echo images were acquired over 24 contiguous slices in the axial and coronal planes, with field of view (FOV) = 25.6 mm x 25.6 mm, slice thickness = 1.0 mm, and data matrix = 256 x 256. Additional parameters include repetition time (TR) = 2 seconds, effective echo time (TE) = 40.2 ms, echo train length = 8, echo spacing = 6.7 ms, and number of experiments (NEX) = 16. A pneumatic pillow was used to monitor the respiration cycle of the mice, as well as trigger the imaging acquisition to collect data at the same time point in the respiration cycle, in order to reduce motion-induced imaging artifacts.
Uptake of [18F]V-1008 in Excised Tissue
Genetically engineered KSC pancreatic cancer mice and age-matched littermate controls were used to evaluate uptake of [18F]V-1008 in normal pancreas versus pre-invasive pancreatic lesions. Animals were administered 1.1-1.7 MBq of [18F]V-1008 in 100 μL of PBS via retroorbital injection. The mice were then returned to their cages and fed ad libitum for 60 minutes. Following 60 minutes of tracer uptake, the mice were euthanized and the pancreases were resected. Radioactivity and weights of the samples were determined using a Hidex automatic gamma counter (Lablogic). %ID/g values of each sample were calculated according to the weight and radioactivity of the samples.
Computational Modeling
The crystal structure of BcTSPO/PK11195 (PDB ID 4RYI (48)) was used as a target for ligand docking. Docking calculations were carried out using the Surflex-Dock method (49) from within Sybyl 2.1.1. Starting ligand coordinates were generated using CONCORD. The receptor was prepared and minimized using Sybyl’s protein structure preparation tools. The Surflex-Dock receptor protomol was generated based on the PK11195 ligand atoms, using bloat and threshold parameters of 2.0 and 0.5, respectively. Docking was then carried out using the standard geomX parameters, with added starting conformers for each ligand fragment. The best pose we observed had a favorable Total Score of 13.2.
Receptor Binding Assay
Binding affinity of V-1520 was determined using C6 glioma cell lysates as previously reported (20, 27, 32, 38). Lysates were incubated with N-(sec-butyl)-1-(2-chlorophenyl)-N-methyl-3H-isoquinoline-3-carboxamide ([3H]PK11195) (final concentration = 6 nM) and V-1520. The reaction was terminated by rapid filtration through a Brandel harvester and collection onto a filter presoaked with 0.3% polyethylenimine. Filters were then punched out into scintillation vials and bound radioactivity measured on a Beckman LS 6000 Scintillation Counter. All experiments were conducted in triplicate. Competition curves were analyzed with GraphPad Prism to obtain binding affinity (IC50). Ki values were calculated using the equation Ki = IC50/(1+[radioligand]/Kd), where IC50 is determined from the competition curves, [radioligand] is the final concentration of [3H]PK11195 (6 nM) and Kd is the dissociation constant for [3H]PK11195 (5 nM).
Excised tissue imaging
NIR Probe V-1520 or free dye was dissolved in phosphate-buffered saline (PBS) to make a final concentration of 0.1 μM. Mice were injected with 200 μL of solution via retroorbital injection. The mice were euthanized eighteen hours post-injection and tissues were excised and washed in PBS. Excised tissues were imaged using Odyssey Imaging Systems (LI-COR Biosciences) under the 800 nm filter.
Blocking Study
In vivo blocking studies were carried out in the KSC genetically engineered pancreatic cancer mice. Mice were switched to a low fluorescence diet (Purified diet (Alfalfa-free), Cat. #2020X, Envigo RMS Inc.) at least three days prior to imaging. V-8310 (7-chloro-N,N,5-trimethyl-4-oxo-3(6-fluoropyridin-2-yl)-3,5-dihydro-4H-pyridazino[4,5-b]indole-1-acetamide), a high-affinity pyridazinoindole ligand targeting TSPO, was synthesized as previously described (30). Stock solutions of the compounds were prepared in dimethyl sulfoxide (DMSO). The stock solutions were diluted in PBS to make the final concentrations for injection. Mice were administered 1 nmol of V-1520 in 100 μL via tail vein injection. For blocking studies, 100 nmol V-8310 (7-chloro-N,N,5-trimethyl-4-oxo-3(6-fluoropyridin-2-yl)-3,5-dihydro-4H-pyridazino[4,5-b]indole-1-acetamide) (30) in 200 μL was injected 30 minutes prior to V-1520 via retroorbital injection. Mice were euthanized and the pancreases were collected 2 hours post-injection of V-1520. The pancreases were imaged on the Odyssey Imaging System using the 800 nm filter. Regions of interest were drawn around the pancreases and values are reported as fluorescence signal per area of the region of interest.
In vivo imaging
In vivo imaging was carried out on the Pearl Small Animal Imaging System (LI-COR Biosciences). Mice were injected with 10 μM V-1520 in 200 μL of PBS. Imaging was performed eighteen hours post-injection. Animals were anesthetized using isofluorane and were positioned on the stage for imaging. An incision was made down the midline to expose the abdominal cavity. Fluorescence images were acquired using the 800 nm filter channel. Following imaging, the pancreases were isolated for histology as described above.
Real-time intraoperative image-guided surgery
Genetically engineered KSC pancreatic cancer mice and age-matched littermate controls were used for experiments evaluating V-1520 in real-time intraoperative fluorescence guided surgeries. Mice were switched to a low fluorescence diet (Purified diet (Alfalfa-free), Cat. #2020X, Envigo RMS Inc.) at least three days prior to imaging. Mice were injected with 20 nmol of V-1520 in 100 μL of PBS i.v. and the surgery was performed 24 hours post-injection. A single, 20 mm-30 mm long abdominal midline incision was made to expose pancreas areas. Tumor areas were exposed to the Curadel RP-1 OSN system. This system is combined with FLARE® imaging systems to enable fluorescence imaging during surgery. Intraoperative fluorescence guided surgery was visualized in real-time using both white light and fluorescence imaging with an 800 nm wavelength filter. Following imaging, pancreases were isolated, fixed, and embedded in paraffin blocks. Excised tissue blocks were imaged using Odyssey Imaging Systems (LI-COR Biosciences) under the 800 nm filter. Tissues were sectioned (5 μm thickness) and H&E was performed as above. Unstained slides were imaged using fluorescence microscopy as described below. Images of H&E slides were captured using a high throughput Leica SCN400 Slide Scanner automated digital image system from Leica Microsystems. Whole slides were imaged at 20x magnification to a resolution of 0.5 μm/pixel.
Fluorescence Microscopy
Zeiss Axio Observer Z1 Inverted Phase Contrast Fluorescence Microscope was used to capture fluorescence images. The microscope is equipped with a LED light source (Zeiss Colibri 7). The probe was visualized with a Cy7 filter (excitation: LP 710 nm, emission: LP 810 nm, beam splitter: 760nm) and fluorescence signals were captured with a digital camera (Hamamatsu, Model: C11440-42U30) and are shown with a pseudocolor of red. 10X objective lens and an additional 10X eyepiece were used with total magnification of 100X. Images were further processed with the ZEN 2.3 software (Blue version, Zeiss).
Statistical Methods
Experimental replicates are reported as the mean ± standard deviation (SD). The association of TSPO expression among IPMN positive and IPMN negative patients as well as among different grades of dysplasia were summarized in frequency tables with statistical significance evaluated using the Pearson’s chi-squared test. To determine subgroup differences in TSPO expression, a Kruskal-Wallis test was performed among all groups followed by pair-wise comparisons using the Wilcoxon rank sums test. Experiment-wise control of the type I error rate at 5% was maintained using the Bonferroni correction. Analysis of differences in expression for benign versus IPMN samples was performed using a Wilcoxon rank sums test. The two-sample Student’s t-test was applied for all other statistical comparisons using GraphPad Prism. For all tests, p values < 0.05 were considered statistically significant.
Logistic regression was used to model sensitivity, specificity, positive predictive values, negative predictive values, and accuracy for TSPO IHC staining of the TMAs to predict pancreatic cancer or IPMN positivity along the receiver operating characteristic (ROC) curve. Sensitivity is defined as the true positive fraction. The false positive fraction is defined as 1-Specificity. Positive predictive values are the probability that subjects with a positive screening test truly have the disease (either pancreatic cancer or IPMN). Negative predictive values are the probability that subjects with a negative screening test truly don’t have the disease. The accuracy is the ratio of the sum of true positive and negative values divided by the sum of all positive and negative values. The ROC curve is a plot of the Sensitivity (true positive fraction) versus 1-Specificity (the false positive fraction) as the TSPO score changes. A 95% confidence interval for the area under the curve that excludes 0.5 suggests the marker has prognostic value. The points on ROC curves where sensitivity, specificity, and other indexes were presented are starred on their respective graphs.
Results
TSPO expression in human pancreatic cancer and precursor lesions
TSPO expression was evaluated in pancreatic ductal adenocarcinoma in comparison with normal pancreas and chronic pancreatitis (CP) in a TMA of 133 patient samples. Overall, TSPO expression was found to be very low in normal pancreas tissue with modest staining in centroacinar cells and normal ducts (Figure 1A). Low-level staining was also observed within the inflammatory infiltrate comprising chronic pancreatitis. The mean IHC score of normal pancreas was 1.025 ± 0.660. CP exhibited slightly higher staining intensity with a mean IHC score of 1.385 ± 0.847 (Figure 1B, not significant relative to normal pancreas), localized to inflammatory cells as expected (50–54). In contrast, pancreatic cancer exhibited robust TSPO expression, with mean scores of 2.625 ± 0.518 (p < 0.00001 relative to normal pancreas, p = 0.00022 relative to CP), 2.576 ± 0.663 (p < 0.00001 relative to normal pancreas, p < 0.00001 relative to CP), and 1.923 ± 0.760 (p = 0.00036 relative to normal pancreas) for Grades 1-3, respectively (Figures 1A and 1B). Using a cutoff for IHC score of 1, we obtained a sensitivity of 0.870, specificity of 0.658, positive predictive value of 0.635, negative predictive value of 0.881, and accuracy of 0.744. The area under the ROC curve is 0.85 with a 95% confidence interval of 0.79 to 0.92 (Figure 1C).
Figure 1. TSPO expression was elevated in human pancreatic lesions.
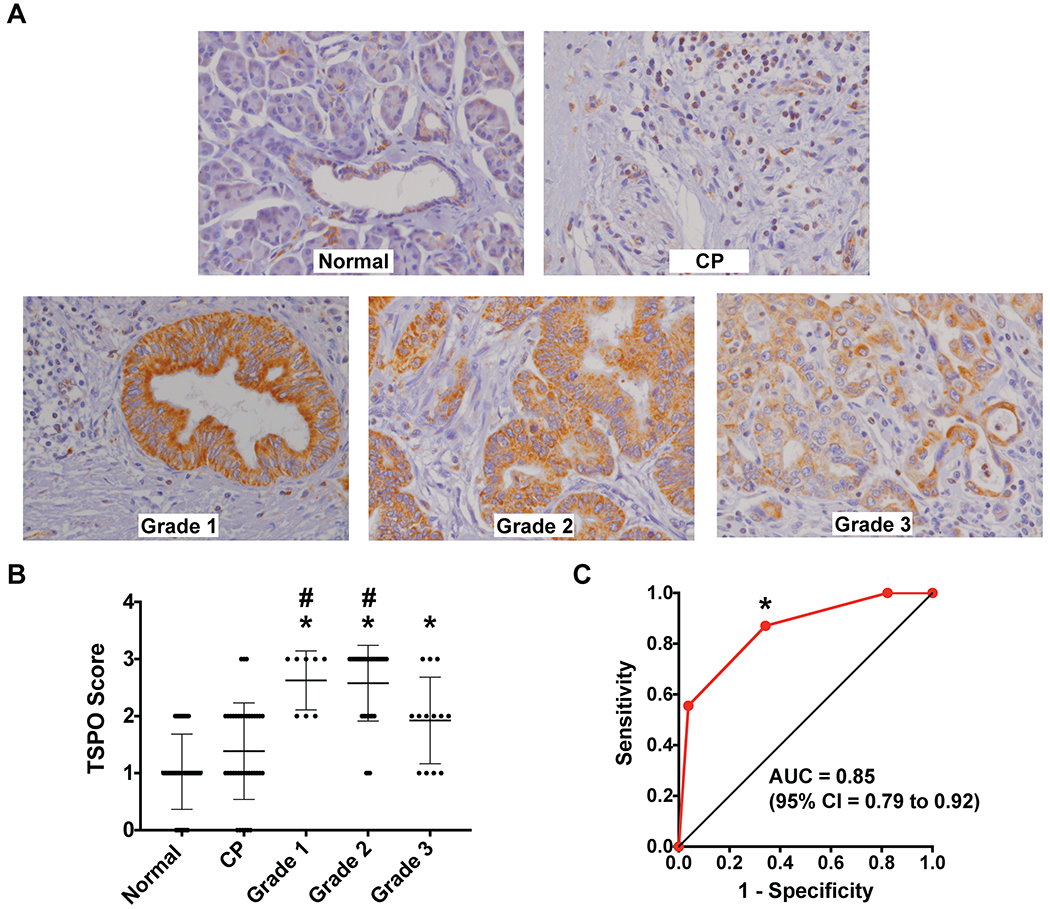
(A) Representative TSPO histological sections (40x magnification) from clinical tissue samples of Normal Pancreas, Chronic Pancreatitis (CP), and Grade 1, Grade 2, and Grade 3 Pancreatic Cancer. (B) Summary of mean ± SD TSPO immunohistochemistry scoring of human pancreatic cancer TMA by three independent reviewers. Asterisks and number signs indicate statistical significance compared to normal pancreas and CP respectively (Wilcoxon rank sums test with Bonferroni correction, p < 0.007 is considered statistically significant). (C) ROC curve plotting Sensitivity against 1-Specificity for TSPO staining in pancreatic cancer (all grades) versus normal pancreas and chronic pancreatitis. The asterisk indicates the chosen point on the ROC curve that results in the values presented.
In another group of patient samples, we evaluated TSPO expression in IPMN relative to benign lesions (n = 65). IPMN samples exhibited significantly higher TSPO expression compared with benign lesions (Wilcoxon rank sums test, p = 0.00004) (Figures 2A and 2B). The mean IHC scores of benign lesions and IPMNs were 1.737 ± 1.661 and 3.717 ± 1.682, respectively. IPMN positive patients had significantly higher TSPO expression than IPMN negative patients (Supplementary Table S1, Pearson’s chi-squared test, p < 0.0001). Seventy-eight percent (36/46) of IPMN positive patients had moderate to strong TSPO expression compared to 21% (4/19) of IPMN negative patients. Furthermore, TSPO expression was found to correlate directly with the grade of dysplasia across low, intermediate, and high-grade samples (Figure 2 and Supplementary Table S2, Pearson’s chi-squared test, p < 0.0001). The mean TSPO IHC scores for low-, intermediate-, and high-grade dysplasia were 1.700 ± 1.625, 3.130 ± 1.456, and 4.455 ± 1.595, respectively. Fifty-five percent (12/22) of patients with high-grade dysplasia had strong TSPO expression compared to only 16% (7/43) of low- and intermediate-grade dysplasia samples. Using a cutoff for IHC score of 2, we obtained a sensitivity of 0.783, specificity of 0.789, positive predictive value of 0.900, negative predictive value of 0.600, and accuracy of 0.785. The area under the ROC curve is 0.80 with a 95% confidence interval of 0.68 to 0.92 (Figure 2C).
Figure 2. TSPO expression was elevated in pre-malignant pancreatic lesions.
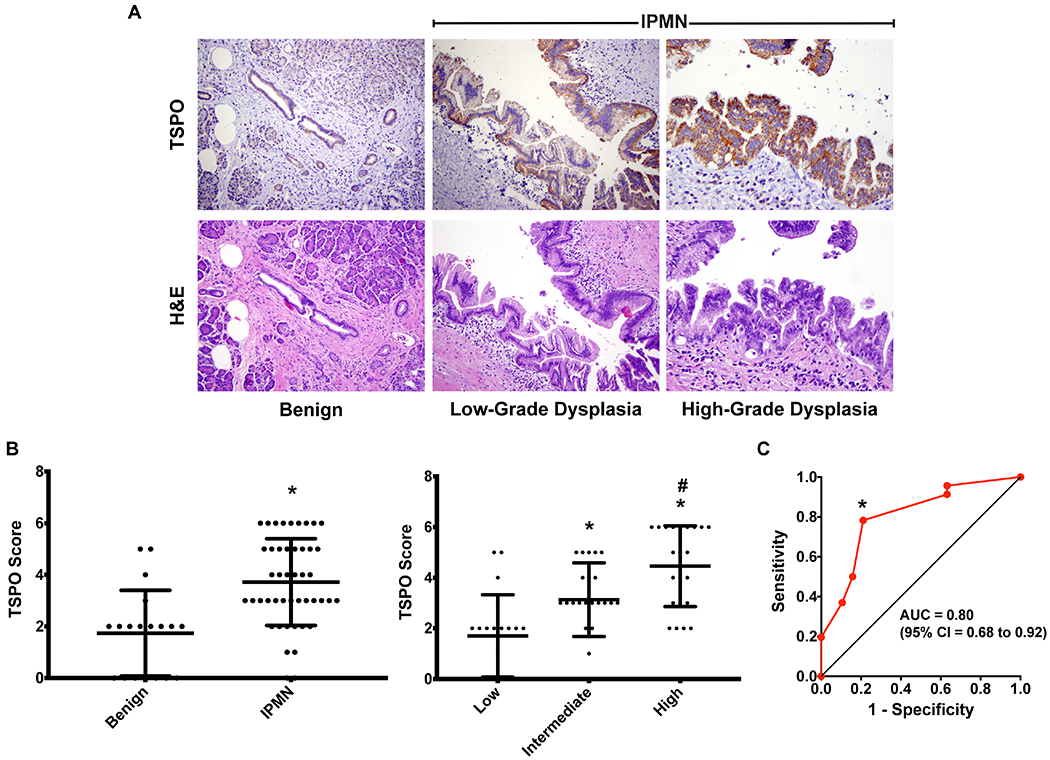
(A) Representative TSPO (top) and H&E (bottom) histological sections (40x magnification) from clinical tissue samples of benign pancreas lesions (left) and intraductal papillary mucinous neoplasm (IPMN) samples with low- and high-grade dysplasia (middle and right, respectively). (B) Summary of mean ± SD TSPO immunohistochemistry scoring of benign pancreas lesions versus IPMN (left) and low-, intermediate-, and high-grade dysplasia samples (right). Asterisks indicate statistical significance compared to benign lesions (left, Wilcoxon rank sums test, p = 0.00004). Asterisks and number signs indicate statistical significance compared to low-grade dysplasia and intermediate-grade dysplasia samples respectively (right, Wilcoxon rank sums test with Bonferroni correction, p < 0.0167 is considered statistically significant). (C) ROC curve plotting Sensitivity against 1-Specificity for TSPO staining in IPMNs versus benign lesions. The asterisk indicates the chosen point on the ROC curve that results in the values presented.
TSPO expression in genetically engineered mouse (GEM) models of pancreatic cancer
GEM models of pancreatic cancer were used to further evaluate TSPO expression as a function of pancreatic cancer initiation and progression as shown in Supplementary Table S3. Each of the selected models (Ptf1a-Cre;LSL-KrasG12D/+ (KC), Ptf1a-Cre;LSL-KrasG12D/+;Tgfbr2+/− (KTC), and Ptf1a-Cre;LSL-KrasG12D/+;Smad4fl/fl (KSC)) recapitulate relevant features of human pancreatic cancer as previously described (41–44). To model low-grade dysplasia, KC mice were utilized, which progress to higher grade PanIN lesions (42) and simulate pre-invasive disease. Advanced disease was modeled using KTC (43) and KSC (43, 44) mice. Ptf1a-Cre mice were used as a control to evaluate normal pancreatic tissue. As shown in Figure 3, TSPO expression was low in normal mouse pancreas (Ptf1a-Cre) and low-grade PanINs (KC). In contrast, high-grade PanINs and PDACs observed in similarly aged KTC mice demonstrated significantly higher TSPO staining. In KSC mice, both cystic and early invasive lesions exhibited higher TSPO levels compared to normal pancreas.
Figure 3. TSPO expression was elevated in pre-invasive and invasive pancreatic lesions in genetically engineered mouse models.

Representative images of histological sections (40x magnification) of tissue samples from Ptf1a-Cre, Ptf1a-Cre;LSL-KrasG12D/+ (KC), Ptf1a-Cre;LSL-KrasG12D/+;Tgfbr2+/− (KTC), and Ptf1a-Cre;LSL-KrasG12D/+;Smad4fl/fl (KSC) genetically engineered mice. Three consecutive slices were stained with TSPO IHC, H&E, and Masson’s Trichrome. Shown are TSPO IHC (top), H&E (middle), and Masson’s Trichrome (bottom) for each excised tissue. Ptf1a-Cre, KC, and KTC mice were ≥12 weeks old. Images shown for KC mice represent low grade PanIN1 lesions (non-malignant). Images shown for KTC mice highlight different regions of a single tissue sample which represent high grade PanIN3 lesions (pre-invasive) and metastatic PDAC (invasive). For KSC mice, 4-week old and 9-week old mice were used to show different progression of disease. Images shown are for cystic/PanIN lesions (pre-invasive) and metastatic PDAC (invasive).
TSPO PET imaging of pancreatic cancer in GEM models
Non-invasive imaging studies using [18F]V-1008, a high-affinity TSPO PET ligand (20, 29, 31, 33), were conducted in KTC mice at two stages of disease progression. Focal, elevated uptake of [18F]V-1008 was observed in the pancreases of 7-8 week old KTC mice (Supplementary Figure S1A). Histological evaluation of pancreas tissues collected from imaged 7-8 week old mice confirmed the presence of abundant low- to moderate-grade dysplasia, which is known to progress to full PDAC by 20 weeks in this model (43). Mice of the same genotype that were 11-12 weeks old, which histologically exhibited more advanced disease, were also imaged. In these mice, [18F]V-1008 also showed increased uptake in tumor tissue (Supplementary Figure S1B). We subsequently performed imaging studies in KSC mice. PET imaging indicated accumulation of the TSPO PET tracer in the pancreases of these mice with histological evaluation of tissue confirming the presence of pre-invasive cystic lesions (Figure 4A). Uptake of [18F]V-1008 in pre-invasive lesions was compared to uptake in normal pancreases by measuring radioactivity in excised tissues following injection of the tracer in mice. Pre-invasive lesions had significantly higher uptake than normal pancreases (Figure 4B, p < 0.01) indicating the potential of [18F]V-1008 to distinguish early disease.
Figure 4. [18F]V-1008 localization observed in Ptf1a-Cre;LSL-KrasG12D/+;Smad4fl/fl (KSC) pancreatic lesions.
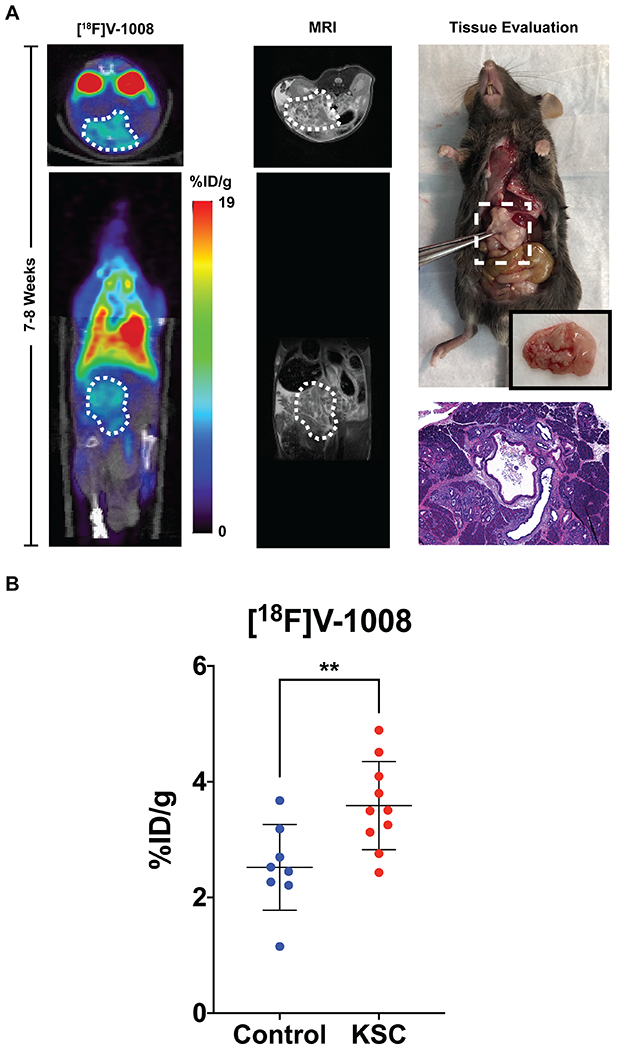
(A) Representative [18F]V-1008 transverse and coronal PET and MR images of a 7-8 week old KSC animal (n = 4, %ID/g = 4.73 ± 0.15). Regions of interest indicating the pancreas on the images are shown as white-dashed areas. A high-power photograph of the tissue resection and an H&E histological image (40x) were acquired demonstrating the presence of pre-invasive cystic lesions. (B) Quantification of uptake of [18F]V-1008, shown as percentage of the injected dose per gram of tissue or %ID/g, in normal pancreases from littermate control mice (n = 8) and pre-invasive pancreatic lesions from genetically engineered KSC mice (n = 10). Average %ID/g ± SD for control mice and KSC mice was 2.52 ± 0.74 and 3.59 ± 0.76, respectively. Asterisks indicate statistical significance (Two-Sample Student’s t-test, p < 0.01).
A NIR dye-labeled TSPO ligand, V-1520
Given the promising imaging results obtained with [18F]V-1008, we leveraged our prior experience with TSPO ligands for optical imaging (22, 25, 26, 34–38) and synthesized a novel TSPO ligand for near-infrared (NIR) fluorescence imaging. To do so, we conjugated the V-1008 pyrazolopyrimidine pharmacophore to an FDA-approved NIR dye (55) through an 8-carbon linker, hypothesizing that such a tracer could facilitate image-guided surgery (IGS) in this setting (Figure 5A). Termed V-1520, the resulting probe exhibited high affinity for TSPO (Ki = 4.47 nM, Figure 5B). Similar to our previous observations with analogous tracers (38), computational modeling demonstrated that the ligand pharmacophore readily fit the binding domain formed by the five transmembrane α helices, while the 8-carbon linker allowed the non-binding dye unit to reside outside the TSPO binding lobby (Figure 5C).
Figure 5. TSPO NIR probe V-1520.
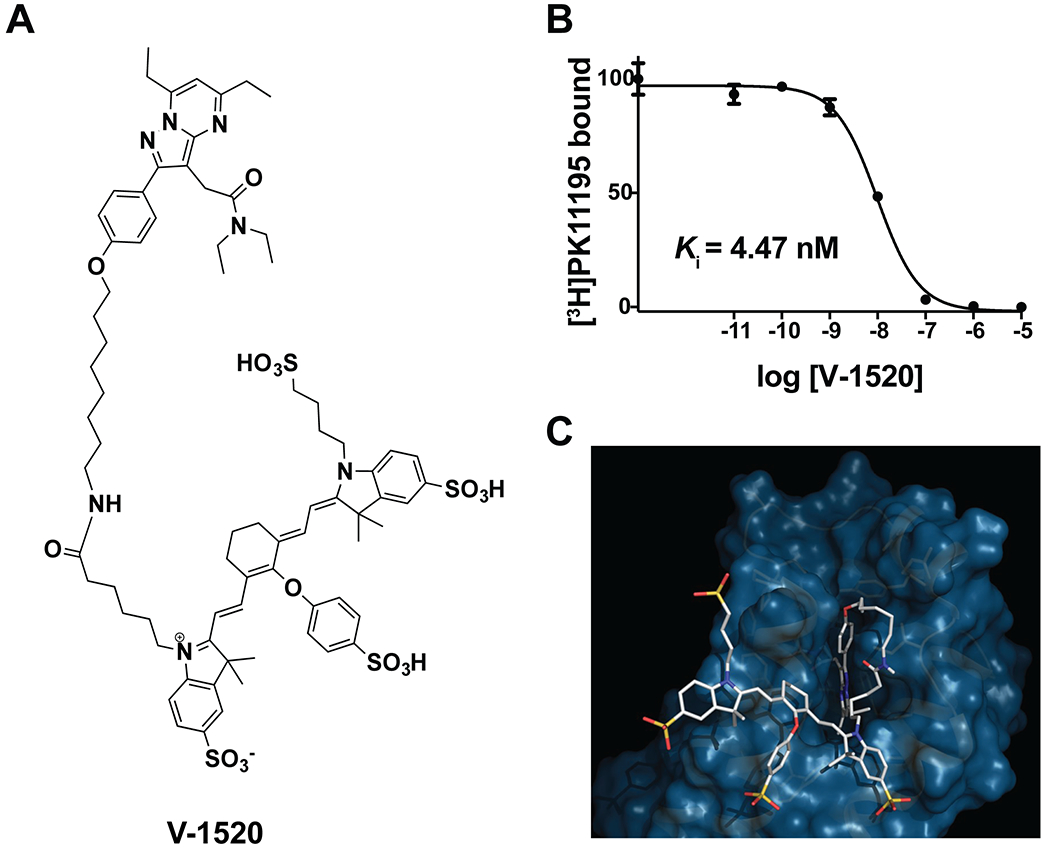
(A) Chemical structure of V-1520. (B) Binding affinity of V-1520 for TSPO assessed using equilibrium competitive binding against [3H]PK11195 in C6 glioma cell lysates. (C) Computational modeling of V-1520 interaction with TSPO.
Optical imaging of excised pancreatic tissue
Having demonstrated TSPO binding in vitro, we next evaluated the tissue biodistribution and accumulation of V-1520 ex vivo following in vivo administration. Genetically engineered mice (KSC) and age-matched littermate controls were intravenously administered V-1520. Following an uptake period, the mice were euthanized for collection and ex vivo imaging of various organs (Supplementary Figures S2 and S3). Normal tissue accumulation of V-1520 agreed with that previously observed for TSPO ligands (21, 25, 29), including very modest accumulation in the healthy pancreas of control mice. Critically, accumulation of V-1520 was approximately 10-fold higher in pancreases collected from both 4-week old (low-grade dysplasia) and 9-week old (high-grade dysplasia) genetically engineered mice compared to healthy pancreas (Supplementary Figure S2C).
We next explored the in vivo specificity of V-1520 and potential utility for in vivo imaging using KSC mice. Similar to the biodistribution studies, V-1520 accumulated in tumor tissue, while unconjugated free dye, IRDye800CW, did not (Supplementary Figure S4). In addition, the free dye was unable to distinguish the malignant pancreas from normal pancreas as shown by comparing imaging data from genetically engineered and littermate control mice. Furthermore, tumor accumulation of V-1520 could be blocked to background levels by pre-treating KSC mice with another high-affinity TSPO ligand (30) (Supplementary Figure S5).
Preclinical image-guided surgery (IGS)
To simulate IGS using V-1520, KSC mice were administered tracer and imaged in multiple formats. First, mice were surgically opened and imaged immediately following sacrifice using a preclinical mouse scanner (Supplementary Figure S6A). Histologically-confirmed, TSPO-positive, low-grade pancreatic dysplasia with early invasion (Supplementary Figure S6B) was well-discriminated from background tracer uptake (Supplementary Figure S6A bottom, green arrow). We next carried out real-time fluorescence imaging of live KSC mice and age-matched littermate controls following V-1520 exposure during surgery using an intraoperative imaging system. Representative images taken during the surgery are shown in Figure 6 and movies are shown in Supplementary Movies S1 and S2. Strong fluorescence signal was observed in lesions arising in KSC mice but not in the pancreases of healthy controls. Ex vivo imaging of the pancreases isolated from these mice confirmed the fluorescence observed intraoperatively and also demonstrated the heterogeneity of probe uptake which was similarly observed with TSPO IHC. Fluorescence microscopy indicated uptake of V-1520 in cancer cells as well as tumor-associated inflammatory cells present in the stroma of KSC mice whereas minimal uptake was seen in control pancreases (Supplementary Figure S7).
Figure 6. Surgical navigation and real-time intraoperative fluorescence image-guided surgery of pancreatic lesions using V-1520.
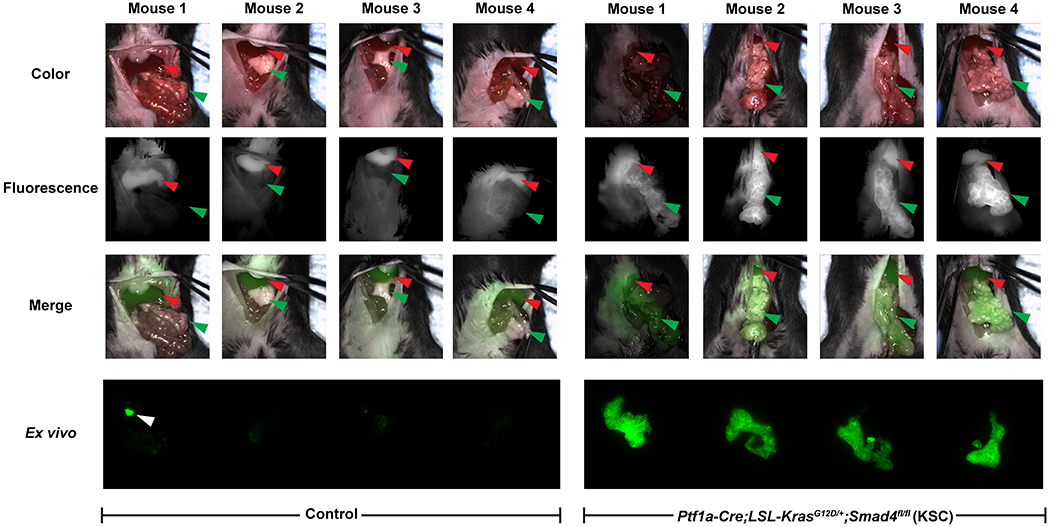
Intraoperative imaging of littermate control (left) or genetically engineered mouse (GEM) model of pancreatic cancer (Ptf1a-Cre;LSL-KrasG12D/+;Smad4fl/fl (KSC)) (right). Fluorescence image-guided surgery was performed on 8-week old mice using V-1520 and the Curadel intraoperative imaging system. The mice were injected with 20 nmol V-1520 i.v. and the surgery was performed 24 hours post-injection. Representative real-time images of the mice during surgery. The surgeon has exposed the pancreas for visualization of the tumor. Shown are color only images (top), fluorescence only images (second row) and overlays of the color and fluorescence (shown in green) images (third row). Red arrows indicate the livers and green arrows indicate the pancreases. For representative full movies, see Supplementary Movies S1 and S2. Ex vivo fluorescence images of tissue blocks containing the pancreases isolated from these mice were acquired using the Odyssey imaging system (bottom). White arrow indicates a small piece of bowel that was removed when excising the pancreas.
Discussion
New ways to diagnose pancreatic cancer at earlier stages are urgently needed. Prompting this study, we envisioned an opportunity to deploy multi-modality molecular imaging to predict pancreatic cancer by prioritizing high-risk, pre-malignant precursor lesions in at-risk patients. While unlikely to flag suspicious PanINs due to spatial resolution limits coupled with their relative size (4, 56), cystic lesions are frequently discovered in routine cross-sectional CT and MRI (4–6) and, thus, represent potentially low-lying fruit for disambiguation. Here, we present preclinical data suggestive of a workflow for pancreatic cancer care initiated following identification of a suspicious indeterminate pancreatic lesion.
We identified TSPO as a biomarker of pre-malignant pancreatic lesions and pancreatic cancer. To take advantage of a dual-modality imaging approach, we utilized a TSPO-targeted ligand to develop two imaging agents: [18F]V-1008 for PET imaging and V-1520 for optical fluorescence imaging. We anticipate that [18F]V-1008 can be utilized to non-invasively image patients with indeterminate lesions identified by CT or MRI. Our data suggests that uptake of this tracer would indicate that the patient has high-grade lesions that are likely to progress to cancer and thus would enable selection of patients who should be candidates for surgery. V-1520 could subsequently be utilized as part of the surgery to enable visualization of tumors and other precursor lesions intraoperatively facilitating improved resection. This study described the preclinical evaluation of these two tracers as a step towards clinical translation. We performed in vivo imaging studies and uptake assays of excised tissues using [18F]V-1008 in genetically engineered mouse models of pancreatic cancer. We also evaluated V-1520 in vitro, ex vivo, and in vivo. [18F]V-1008 and V-1520 have high affinity for TSPO and showed utility in imaging of pre-malignant lesions and pancreatic cancer in genetically engineered mouse models. Importantly, V-1520 enabled visualization of pancreatic tumors intraoperatively.
TSPO expression in pancreatic cancer has not been previously reported despite the fact that it is known to be highly expressed in many human cancers, including glioma (20, 21), colon cancer (22, 23), and breast cancer (23–26). We first confirmed the relevance of TSPO in pancreatic cancer by evaluating the correlation between disease grade and TSPO expression in pancreatic ductal adenocarcinoma (PDAC) through IHC of TMAs consisting of human clinical samples from normal pancreas, precursor lesions, and advanced tumors. We observed high expression of TSPO in pre-malignant pancreatic lesions (IPMNs) as well as in all different grades of pancreatic cancer while there was minimal expression in normal pancreas and chronic pancreatitis (CP). The low expression observed in CP in comparison to tumor samples indicates that TSPO may be able to differentiate between inflammation, which is characteristic of CP, and cancer. Using ROC analysis, we demonstrate the potential of TSPO to serve as a biomarker with high sensitivity, good negative predictive value, and high accuracy to distinguish pancreatic cancer from normal pancreas and CP. Based on the limited tissue samples evaluated in this study, some potential for false positives can not be ruled out in this setting given the moderate values (~65%) obtained for specificity and positive predictive value. However, more the focus of this work, ROC analysis demonstrated that TSPO could discriminate IPMN from benign lesions with high sensitivity, specificity, positive predictive value, and accuracy. A few lesions classified as IPMN exhibited similar TSPO expression to benign lesions; given the subtleties of lesion discrimination in this space, we can not exclude the possibility that a few lesions were incorrectly classified at pathology. In limited specimens, we observed a negative predictive value of 0.600, suggesting a possible sub-class of TSPO-negative IPMNs. Additional studies using more comprehensive tissue collections could further elaborate TSPO expression profiles; yet similarly, our study highlights the advantages of non-invasive imaging, which does not suffer from IHC’s inherent limitations of sampling and heterogeneity.
Importantly, TSPO levels were not elevated in KC mice suggesting that TSPO is not merely associated with early initiation. Rather, elevated TSPO levels appear to reflect further genetic transformations beyond mutant Kras that lead to pancreatic cancer progression. As reported (42), KC mice develop pancreatic intraepithelial neoplasias (PanINs) around one year of age, which progress very slowly (and rarely) to PDAC. Combining the Kras mutation further with loss of Tgfbr2 (43) or Smad4 (43, 44), whose inactivation has been observed in invasive human PDAC (43), resulted in elevated TSPO levels that were detectable by imaging and, subsequently, rapid tumor formation. As aggressive pancreatic cancer models, KTC and KSC mice develop pre-invasive lesions early in life that progress to pancreatic cancer, with nearly all mice succumbing to disease by twenty weeks of age. In both advanced GEM models, early, intermediate, and advanced lesions all demonstrated elevated expression levels of TSPO. Thus, as a biomarker, our data suggests that TSPO may be ideally suited to reflect early lesions on a rapid trajectory to invasive cancer, as well as identify cancer itself.
In summary, we have presented preclinical proof-of-principle studies illuminating a new multi-modality strategy that enables non-invasive imaging of pancreatic cancer, prioritization of high-risk, pre-malignant pancreatic lesions, and subsequent image-guided surgery. Combining the sub-pharmacological dosages of the radio- and optical imaging tracers for imaging efficacy with the proven safety profiles of PET and optical imaging suggests the feasibility of translating this PET/IGS approach to clinical evaluation.
Supplementary Material
Translational Relevance.
Pancreatic cancer is a leading cause of cancer deaths. Routine imaging fails to predict the malignant risk of discovered lesions. Non-invasive imaging has the potential to identify lesions requiring surgery urgently. Here, we identified translocator protein (TSPO) as a biomarker of high-risk, pre-malignant lesions of pancreatic cancer. Using a novel TSPO-targeted ligand, we developed both a positron emission tomography (PET) imaging agent and a near-infrared fluorescent imaging agent. Preclinical studies reported here using genetically engineered mouse models illuminate a new multi-modality strategy based on TSPO as an imageable target for prioritizing high-risk, pre-malignant pancreatic lesions using PET, and subsequent fluorescence-based image-guided surgery (IGS). Combined TSPO PET/IGS represents a novel, translational approach for precision pancreatic cancer care.
Acknowledgments
The authors acknowledge Fuxue Xin and Daniel Colvin, Ph.D. for assistance with PET and MR imaging and data analysis, Dr. Robert Coffey and Anne Powell, Ph.D. for assistance with breeding, and the VUMC Center for Small Animal Imaging and Radiochemistry Core facilities for assistance with PET imaging and synthesis of the PET radiotracer. The authors thank the Translational Pathology Shared Resource at Vanderbilt University Medical Center for assistance with the IHC staining. The Translational Pathology Shared Resource is supported by NCI/NIH Cancer Center Support Grant 2P30 CA068485-14 and the Vanderbilt Mouse Metabolic Phenotyping Center Grant 5U24DK059637-13. Whole slide imaging was performed in the Digital Histology Shared Resource at Vanderbilt University Medical Center (www.mc.vanderbilt.edu/dhsr). We also acknowledge Dr. Michael Goggins (Johns Hopkins) for providing the pancreatic cancer TMA.
The authors acknowledge funding from K25 CA127349 (National Institutes of Health (NIH) National Cancer Institute (NCI), H.C. Manning), 1R01 CA163806 (NIH NCI, J. Li, M.R. Hight, E. McKinley, H.C. Manning), the Vanderbilt Ingram Cancer Center (VICC) Support Grant (NIH NCI P30 CA068485, A.S. Cohen, G.D. Ayers, M.N. Tantawy, F. Revetta, M.K. Washington, H.C. Manning), Vanderbilt University Medical Center’s Digestive Disease Research Center (NIH National Institute of Diabetes and Digestive and Kidney Diseases (NIDDK) P30 DK058404, A.S. Cohen, H.C. Manning), the VICC Specialized Program of Research Excellence (SPORE) in Gastrointestinal Cancer (NIH NCI P50 CA236733, A.S. Cohen, A. Fu, M. Bai, G.D. Ayers, F. Revetta, M.K. Washington, H.C. Manning), The Kleberg Foundation (H.C. Manning), The Lustgarten Foundation (J. Li, M.R. Hight, E. McKinley, H.C. Manning), and the Vanderbilt Center for Molecular Probes (H.C. Manning) This work was supported by NIH grants 1S10OD016245-01 for the Small-Animal PET Scanner, housed in the Vanderbilt Center for Small Animal Imaging, and 1S10OD019963-01A1 for the GE TRACERlab FX2 N and Comecer Hotcell, housed in the Vanderbilt Center for Molecular Probes - Radiochemistry Core.
Footnotes
Conflict of Interest disclosure statement: The authors declare no competing financial interests. V-1520 is covered by US patent 9,458,161. V-1008 is reported in a pending patent application, US 15/012,795.
References
- 1.Siegel RL, Miller KD, Jemal A, Cancer statistics, 2020. CA Cancer J Clin 2020; 70: 7–30. [DOI] [PubMed] [Google Scholar]
- 2.Bray F, Ferlay J, Soerjomataram I, Siegel RL, Torre LA, Jemal A, Global cancer statistics 2018: GLOBOCAN estimates of incidence and mortality worldwide for 36 cancers in 185 countries. CA Cancer J Clin 2018; 68: 394–424. [DOI] [PubMed] [Google Scholar]
- 3.Rahib L, Smith B, Aizenberg R, Rosenzweig A, Fleshman J, Matrisian L, Projecting cancer incidence and deaths to 2030. Cancer Research 2014; 74: 4006. [DOI] [PubMed] [Google Scholar]
- 4.Laffan TA, Horton KM, Klein AP, Berlanstein B, Siegelman SS, Kawamoto S et al. , Prevalence of unsuspected pancreatic cysts on MDCT. AJR Am J Roentgenol 2008; 191: 802–807. [DOI] [PMC free article] [PubMed] [Google Scholar]
- 5.Lee KS, Sekhar A, Rofsky NM, Pedrosa I, Prevalence of incidental pancreatic cysts in the adult population on MR imaging. Am J Gastroenterol 2010; 105: 2079–2084. [DOI] [PubMed] [Google Scholar]
- 6.Santo E, Bar-Yishay I, Pancreatic solid incidentalomas. Endosc Ultrasound 2017; 6: S99–S103. [DOI] [PMC free article] [PubMed] [Google Scholar]
- 7.Maitra A, Fukushima N, Takaori K, Hruban RH, Precursors to invasive pancreatic cancer. Adv Anat Pathol 2005; 12: 81–91. [DOI] [PubMed] [Google Scholar]
- 8.Hruban RH, Wilentz RE, Maitra A, Identification and analysis of precursors to invasive pancreatic cancer. Methods Mol Med 2005; 103: 1–13. [DOI] [PubMed] [Google Scholar]
- 9.Sahani DV, Kadavigere R, Saokar A, Fernandez-del Castillo C, Brugge WR, Hahn PF, Cystic pancreatic lesions: a simple imaging-based classification system for guiding management. Radiographics 2005; 25: 1471–1484. [DOI] [PubMed] [Google Scholar]
- 10.Tanaka M, Chari S, Adsay V, Fernandez-del Castillo C, Falconi M, Shimizu M et al. , International consensus guidelines for management of intraductal papillary mucinous neoplasms and mucinous cystic neoplasms of the pancreas. Pancreatology 2006; 6: 17–32. [DOI] [PubMed] [Google Scholar]
- 11.Tanaka M, Fernandez-del Castillo C, Adsay V, Chari S, Falconi M, Jang JY et al. , International consensus guidelines 2012 for the management of IPMN and MCN of the pancreas. Pancreatology 2012; 12: 183–197. [DOI] [PubMed] [Google Scholar]
- 12.Tanaka M, Fernandez-Del Castillo C, Kamisawa T, Jang JY, Levy P, Ohtsuka T et al. , Revisions of international consensus Fukuoka guidelines for the management of IPMN of the pancreas. Pancreatology 2017; 17: 738–753. [DOI] [PubMed] [Google Scholar]
- 13.Society for Surgery of the Alimentary Tract, SSAT patient care guidelines. Cystic neoplasms of the pancreas. J Gastrointest Surg 2007; 11: 1225–1227. [DOI] [PubMed] [Google Scholar]
- 14.Nagaya T, Nakamura YA, Choyke PL, Kobayashi H, Fluorescence-Guided Surgery. Front Oncol 2017; 7: 314. [DOI] [PMC free article] [PubMed] [Google Scholar]
- 15.Tringale KR, Pang J, Nguyen QT, Image-guided surgery in cancer: A strategy to reduce incidence of positive surgical margins. Wiley Interdiscip Rev Syst Biol Med 2018; 10: e1412. [DOI] [PubMed] [Google Scholar]
- 16.Tummers WS, Kimura RH, Abou-Elkacem L, Beinat C, Vahrmeijer AL, Swijnenburg RJ et al. , Development and Preclinical Validation of a Cysteine Knottin Peptide Targeting Integrin alphavbeta6 for Near-infrared Fluorescent-guided Surgery in Pancreatic Cancer. Clin Cancer Res 2018; 24: 1667–1676. [DOI] [PubMed] [Google Scholar]
- 17.Gutowski M, Framery B, Boonstra MC, Garambois V, Quenet F, Dumas K et al. , SGM-101: An innovative near-infrared dye-antibody conjugate that targets CEA for fluorescence-guided surgery. Surg Oncol 2017; 26: 153–162. [DOI] [PubMed] [Google Scholar]
- 18.Tummers WS, Miller SE, Teraphongphom NT, Gomez A, Steinberg I, Huland DM et al. , Intraoperative Pancreatic Cancer Detection using Tumor-Specific Multimodality Molecular Imaging. Ann Surg Oncol 2018; 25: 1880–1888. [DOI] [PMC free article] [PubMed] [Google Scholar]
- 19.Hoogstins CES, Boogerd LSF, Sibinga Mulder BG, Mieog JSD, Swijnenburg RJ, van de Velde CJH et al. , Image-Guided Surgery in Patients with Pancreatic Cancer: First Results of a Clinical Trial Using SGM-101, a Novel Carcinoembryonic Antigen-Targeting, Near-Infrared Fluorescent Agent. Ann Surg Oncol 2018; 25: 3350–3357. [DOI] [PMC free article] [PubMed] [Google Scholar]
- 20.Tang D, McKinley ET, Hight MR, Uddin MI, Harp JM, Fu A et al. , Synthesis and structure-activity relationships of 5,6,7-substituted pyrazolopyrimidines: discovery of a novel TSPO PET ligand for cancer imaging. J Med Chem 2013; 56: 3429–3433. [DOI] [PMC free article] [PubMed] [Google Scholar]
- 21.Tang D, Li J, Buck JR, Tantawy MN, Xia Y, Harp JM et al. , Evaluation of TSPO PET Ligands [(18)F]VUIIS1009A and [(18)F]VUIIS1009B: Tracers for Cancer Imaging. Mol Imaging Biol 2017; 19: 578–588. [DOI] [PMC free article] [PubMed] [Google Scholar]
- 22.Deane NG, Manning HC, Foutch AC, Washington MK, Aronow BA, Bornhop DJ et al. , Targeted imaging of colonic tumors in smad3−/− mice discriminates cancer and inflammation. Molecular cancer research 2007; 5: 341–349. [DOI] [PubMed] [Google Scholar]
- 23.Han Z, Slack RS, Li W, Papadopoulos V, Expression of peripheral benzodiazepine receptor (PBR) in human tumors: relationship to breast, colorectal, and prostate tumor progression. J Recept Signal Transduct Res 2003; 23: 225–238. [DOI] [PubMed] [Google Scholar]
- 24.Galiegue S, Casellas P, Kramar A, Tinel N, Simony-Lafontaine J, Immunohistochemical assessment of the peripheral benzodiazepine receptor in breast cancer and its relationship with survival. Clin Cancer Res 2004; 10: 2058–2064. [DOI] [PubMed] [Google Scholar]
- 25.Wyatt SK, Manning HC, Bai M, Bailey SN, Gallant P, Ma G et al. , Molecular imaging of the translocator protein (TSPO) in a pre-clinical model of breast cancer. Molecular Imaging and Biology 2010; 12: 349–358. [DOI] [PMC free article] [PubMed] [Google Scholar]
- 26.Wyatt SK, Manning HC, Bai M, Ehtesham M, Mapara KY, Thompson RC et al. , Preclinical molecular imaging of the translocator protein (TSPO) in a metastases model based on breast cancer xenografts propagated in the murine brain. Curr Mol Med 2012; 12: 458–466. [DOI] [PMC free article] [PubMed] [Google Scholar]
- 27.Buck JR, McKinley ET, Hight MR, Fu A, Tang D, Smith RA et al. , Quantitative, preclinical PET of translocator protein expression in glioma using 18F-N-fluoroacetyl-N-(2,5-dimethoxybenzyl)-2-phenoxyaniline. J Nucl Med 2011; 52: 107–114. [DOI] [PMC free article] [PubMed] [Google Scholar]
- 28.Tang D, Hight MR, McKinley ET, Fu A, Buck JR, Smith RA et al. , Quantitative preclinical imaging of TSPO expression in glioma using N,N-diethyl-2-(2-(4-(2-18F-fluoroethoxy)phenyl)-5,7-dimethylpyrazolo[1,5-a]pyrimi din-3-yl)acetamide. J Nucl Med 2012; 53: 287–294. [DOI] [PMC free article] [PubMed] [Google Scholar]
- 29.Tang D, Nickels ML, Tantawy MN, Buck JR, Manning HC, Preclinical imaging evaluation of novel TSPO-PET ligand 2-(5,7-Diethyl-2-(4-(2-[(18)F]fluoroethoxy)phenyl)pyrazolo[1,5-a]pyrimidin-3-yl)- N,N-diethylacetamide ([ (18)F]VUIIS1008) in glioma. Mol Imaging Biol 2014; 16: 813–820. [DOI] [PMC free article] [PubMed] [Google Scholar]
- 30.Cheung YY, Nickels ML, Tang D, Buck JR, Manning HC, Facile synthesis of SSR180575 and discovery of 7-chloro-N,N,5-trimethyl-4-oxo-3(6-[(18)F]fluoropyridin-2-yl)-3,5-dihydro-4H-pyri dazino[4,5-b]indole-1-acetamide, a potent pyridazinoindole ligand for PET imaging of TSPO in cancer. Bioorg Med Chem Lett 2014; 24: 4466–4471. [DOI] [PMC free article] [PubMed] [Google Scholar]
- 31.Tantawy MN, Charles Manning H, Peterson TE, Colvin DC, Gore JC, Lu W et al. , Translocator Protein PET Imaging in a Preclinical Prostate Cancer Model. Mol Imaging Biol 2018; 20: 200–204. [DOI] [PMC free article] [PubMed] [Google Scholar]
- 32.Tang D, Li J, Nickels ML, Huang G, Cohen AS, Manning HC, Preclinical Evaluation of a Novel TSPO PET Ligand 2-(7-Butyl-2-(4-(2-[(18)F]Fluoroethoxy)phenyl)-5-Methylpyrazolo[1,5-a]Pyrimidin-3 -yl)-N,N-Diethylacetamide ((18)F-VUIIS1018A) to Image Glioma. Mol Imaging Biol 2019; 21: 113–121. [DOI] [PMC free article] [PubMed] [Google Scholar]
- 33.Powell AE, Vlacich G, Zhao ZY, McKinley ET, Washington MK, Manning HC et al. , Inducible loss of one Apc allele in Lrig1-expressing progenitor cells results in multiple distal colonic tumors with features of familial adenomatous polyposis. Am J Physiol Gastrointest Liver Physiol 2014; 307: G16–23. [DOI] [PMC free article] [PubMed] [Google Scholar]
- 34.Manning HC, Goebel T, Thompson RC, Price RR, Lee H, Bornhop DJ, Targeted molecular imaging agents for cellular-scale bimodal imaging. Bioconjug Chem 2004; 15: 1488–1495. [DOI] [PubMed] [Google Scholar]
- 35.Manning HC, Smith SM, Sexton M, Haviland S, Bai M, Cederquist K et al. , A peripheral benzodiazepine receptor targeted agent for in vitro imaging and screening. Bioconjug Chem 2006; 17: 735–740. [DOI] [PubMed] [Google Scholar]
- 36.Bai M, Wyatt SK, Han Z, Papadopoulos V, Bornhop DJ, A novel conjugable translocator protein ligand labeled with a fluorescence dye for in vitro imaging. Bioconjug Chem 2007; 18: 1118–1122. [DOI] [PubMed] [Google Scholar]
- 37.Bai M, Rone MB, Papadopoulos V, Bornhop DJ, A novel functional translocator protein ligand for cancer imaging. Bioconjug Chem 2007; 18: 2018–2023. [DOI] [PubMed] [Google Scholar]
- 38.Li J, Smith JA, Dawson ES, Fu A, Nickels ML, Schulte ML et al. , Optimized Translocator Protein Ligand for Optical Molecular Imaging and Screening. Bioconjug Chem 2017; 28: 1016–1023. [DOI] [PMC free article] [PubMed] [Google Scholar]
- 39.Westphalen CB, Olive KP, Genetically engineered mouse models of pancreatic cancer. Cancer J 2012; 18: 502–510. [DOI] [PMC free article] [PubMed] [Google Scholar]
- 40.Herreros-Villanueva M, Hijona E, Cosme A, Bujanda L, Mouse models of pancreatic cancer. World J Gastroenterol 2012; 18: 1286–1294. [DOI] [PMC free article] [PubMed] [Google Scholar]
- 41.Rozenblum E, Schutte M, Goggins M, Hahn SA, Panzer S, Zahurak M et al. , Tumor-suppressive pathways in pancreatic carcinoma. Cancer research 1997; 57: 1731–1734. [PubMed] [Google Scholar]
- 42.Hingorani SR, Petricoin EF, Maitra A, Rajapakse V, King C, Jacobetz MA et al. , Preinvasive and invasive ductal pancreatic cancer and its early detection in the mouse. Cancer Cell 2003; 4: 437–450. [DOI] [PubMed] [Google Scholar]
- 43.Ijichi H, Chytil A, Gorska AE, Aakre ME, Fujitani Y, Fujitani S et al. , Aggressive pancreatic ductal adenocarcinoma in mice caused by pancreas-specific blockade of transforming growth factor-β signaling in cooperation with active Kras expression. Genes & development 2006; 20: 3147–3160. [DOI] [PMC free article] [PubMed] [Google Scholar]
- 44.Bardeesy N, Cheng KH, Berger JH, Chu GC, Pahler J, Olson P et al. , Smad4 is dispensable for normal pancreas development yet critical in progression and tumor biology of pancreas cancer. Genes Dev 2006; 20: 3130–3146. [DOI] [PMC free article] [PubMed] [Google Scholar]
- 45.Kawaguchi Y, Cooper B, Gannon M, Ray M, MacDonald RJ, Wright CV, The role of the transcriptional regulator Ptf1a in converting intestinal to pancreatic progenitors. Nat Genet 2002; 32: 128–134. [DOI] [PubMed] [Google Scholar]
- 46.Ijichi H, Genetically-engineered mouse models for pancreatic cancer: Advances and current limitations. World J Clin Oncol 2011; 2: 195–202. [DOI] [PMC free article] [PubMed] [Google Scholar]
- 47.Hight MR, Cheung YY, Nickels ML, Dawson ES, Zhao P, Saleh S et al. , A peptide-based positron emission tomography probe for in vivo detection of caspase activity in apoptotic cells. Clin Cancer Res 2014; 20: 2126–2135. [DOI] [PMC free article] [PubMed] [Google Scholar]
- 48.Guo Y, Kalathur RC, Liu Q, Kloss B, Bruni R, Ginter C et al. , Protein structure. Structure and activity of tryptophan-rich TSPO proteins. Science 2015; 347: 551–555. [DOI] [PMC free article] [PubMed] [Google Scholar]
- 49.Jain AN, Surflex-Dock 2.1: robust performance from ligand energetic modeling, ring flexibility, and knowledge-based search. J Comput Aided Mol Des 2007; 21: 281–306. [DOI] [PubMed] [Google Scholar]
- 50.Batarseh A, Papadopoulos V, Regulation of translocator protein 18 kDa (TSPO) expression in health and disease states. Mol Cell Endocrinol 2010; 327: 1–12. [DOI] [PMC free article] [PubMed] [Google Scholar]
- 51.Chen MK, Guilarte TR, Translocator protein 18 kDa (TSPO): molecular sensor of brain injury and repair. Pharmacol Ther 2008; 118: 1–17. [DOI] [PMC free article] [PubMed] [Google Scholar]
- 52.Rupprecht R, Papadopoulos V, Rammes G, Baghai TC, Fan J, Akula N et al. , Translocator protein (18 kDa) (TSPO) as a therapeutic target for neurological and psychiatric disorders. Nat Rev Drug Discov 2010; 9: 971–988. [DOI] [PubMed] [Google Scholar]
- 53.Cosenza-Nashat M, Zhao ML, Suh HS, Morgan J, Natividad R, Morgello S et al. , Expression of the translocator protein of 18 kDa by microglia, macrophages and astrocytes based on immunohistochemical localization in abnormal human brain. Neuropathol Appl Neurobiol 2009; 35: 306–328. [DOI] [PMC free article] [PubMed] [Google Scholar]
- 54.Bird JL, Izquierdo-Garcia D, Davies JR, Rudd JH, Probst KC, Figg N et al. , Evaluation of translocator protein quantification as a tool for characterising macrophage burden in human carotid atherosclerosis. Atherosclerosis 2010; 210: 388–391. [DOI] [PMC free article] [PubMed] [Google Scholar]
- 55.Marshall MV, Draney D, Sevick-Muraca EM, Olive DM, Single-dose intravenous toxicity study of IRDye 800CW in Sprague-Dawley rats. Mol Imaging Biol 2010; 12: 583–594. [DOI] [PMC free article] [PubMed] [Google Scholar]
- 56.Distler M, Aust D, Weitz J, Pilarsky C, Grutzmann R, Precursor lesions for sporadic pancreatic cancer: PanIN, IPMN, and MCN. Biomed Res Int 2014; 2014: 474905. [DOI] [PMC free article] [PubMed] [Google Scholar]
Associated Data
This section collects any data citations, data availability statements, or supplementary materials included in this article.