

Abstract
The evaluation of surgically resected papillary thyroid carcinomas (PTC) by immunohistochemistry (IHC) for BRAF mutation has diagnostic, prognostic and therapeutic implications. The goal of this meta-analysis was to perform a systematic review of studies using the VE1 clone (specific for detection of the BRAF V600E mutation) on formalin-fixed paraffin embedded (FFPE) thyroid surgical resection specimens for primary papillary thyroid carcinoma. The authors’ molecular techniques, immunohistochemistry protocols, and scoring methods for VE1 immunostaining were also evaluated. This study included 4079 PTCs representing data from 23 studies. The results extracted from each study were split into two different groups, direct sequencing group or PCR group, based on the molecular “gold standard” method used to compare VE1 IHC staining. In the direct sequencing group, the IHC sensitivity was 100% (95% CI 0.97–1.00) and specificity 84% (95% 0.72–0.91). In the PCR group the sensitivity was 98% (95% CI 0.96–0.99) and specificity 89% (95% CI 0.82–0.94). Although immunohistochemical procedures varied by author, the overall performance of the VE1 clone shows that it is highly sensitive and relatively specific for detecting the BRAF V600E mutation in surgical resection specimens. However, standardization of immunohistochemical procedural method and scoring/interpretation criteria may improve the reliability and reproducibility for the use of VE1 clone for future practice.
Keywords: Papillary thyroid carcinoma, Immunohistochemistry, BRAFV600E, Meta-analysis
Introduction
The most common malignancy of the thyroid gland is papillary thyroid carcinoma (PTC). The prevalence of PTC has been reported to be increasing worldwide. Factors beyond early detection via medical surveillance and more sensitive diagnostic procedures such as environmental and unrecognized carcinogens have been implicated as potential explanations [1–3]. The most common gene mutation involving PTC (~ 60%) is a missense mutation in the BRAF oncogene, valine (V) substituting glutamic acid (E) at amino acid position 600, which ultimately drives MAPK pathway signaling [4]. Recent molecular based analytic studies have shown most PTCs are driven by two distinct signaling mechanisms of the MAPK pathway, either BRAF-like and RAS-like [5]. Further investigations correlating genotype with histologic morphology showed a strong correlation with BRAF V600E mutation to classic and tall cell PTC variants, whereas RAS mutations strongly correlated with the follicular variant of PTC [4]. A systematic review and meta-analysis by Tufano et al., showed the recurrence rate in patients with BRAF V600E mutated PTCs was twice as high as wild-type PTCs (24.9% versus 12.6%). Additionally, BRAF-mutated PTCs had increased risk for lymph node metastasis (54.1% versus 36.8%), increased risk for extrathyroidal extension (46.2% versus 23.6%), and were associated with advanced AJCC III/IV stage (35.4% versus 19.6%) [6]. The increase in prevalence of PTC along with the relative access to molecular testing has facilitated the use of therapeutic agents targeting specific mutations such as BRAF V600E. Moreover, PTCs with BRAF V600E mutation have shown to have decreased response to radioactive iodine (RAI) I-131 treatment do to loss of radioiodine avidity [7]. Currently BRAF-inhibitors (dabrafenib and vemurafenib) are being used to treat various types of cancer that harbor BRAF mutations such as colorectal carcinoma, melanoma, and various brain tumors. At the time of writing this paper, four clinical trials (three open and one closed) for patients with PTC have biomarker inclusion criteria requiring BRAF V600E mutational positivity status [8]. Thus, it is imperative that analysis of mutational status is performed efficiently and accurately to select for those patients who may in the future benefit from BRAF targeted therapy.
Various molecular methods have been used for the detection of BRAF V600E mutation including DNA sequencing methods (Sanger, pyrosequencing, mass spectroscopy and direct) and PCR based methods [real-time PCR (rt-PCR), allele-specific locked nucleic acid PCR (ASLNA-qPCR), peptide nucleic acid clamping polymerase chain reaction, and SNaPshot]. However, these methods are labor intensive, time-consuming, generally more expensive than immunohistochemistry and often subject to the quality of the DNA within formalin-fixed paraffin embedded tissue (FFPE). In 2011 Capper et al., developed the first BRAF V600E specific antibody, the VE1 clone, which has allowed the potential role of immunohistochemistry (IHC) to act as a surrogate marker for the detection of BRAF V600E, thus, ideally making an immunohistochemical method more attractive for general pathology practice [9]. Since the development of this antibody, numerous studies have correlated the performance of the VE1 antibody on various tissue types, including papillary thyroid carcinoma, to current molecular gold standard techniques for the detection of the BRAF V600E mutation.
In 2015 Pyo et al., published the first systematic review of the diagnostic test accuracy using clone VE1 in 1141 PTC cases from 11 different studies [10]. This meta-analysis included tissue from surgical resection specimens and core needle biopsies as well as cytology specimens from fine needle aspirates. Review of the various studies included in the meta-analysis showed a wide variation in immunohistochemical protocols (i.e., incubation times and antibody dilution), antibody (commercially available vs laboratory developed), and grading methods used to assess scoring of antibody positivity. In light of these data, the current study aimed to evaluate the sensitivity and specificity of VE1 IHC in detecting BRAF V600E mutations in surgically resected PTC compared to molecular methods (gold standard). In addition, immunohistochemical method protocols and scoring systems used in the various studies were reviewed, in an attempt to further standardize testing and interpretation in the future.
Material and Methods
Selection and Search Criteria
A literature search was performed using MEDLINE databases (PubMed search interface) up to October 31, 2019. Keywords used in the search included the following: “papillary thyroid carcinoma,” “immunohistochemistry,” and “BRAF.” Inclusion criteria for our study included: papillary thyroid carcinoma and variants of PTC, formalin-fixed paraffin embedded surgically resected thyroid specimens, immunohistochemistry performed using a commercially available VE1 clone, comparison testing performed using a molecular method (gold standard) with correlation data, and written in the English language. Exclusion criteria included: non-FFPE tissue (i.e., cytology specimens and fine needle aspirates), non-commercially available VE1 clones (i.e. individual laboratory developed antibody), and non-PTC carcinomas. Malignant thyroid neoplasms other than PTC; such as anaplastic thyroid carcinoma, follicular thyroid carcinoma, medullary carcinoma, etc., were not included within the data set (see Fig. 1 for details).
Fig. 1.

Flow chart—final study selection
Evaluation of Articles and Data Extraction
The title and abstract of each article were screened for exclusion. If initial inclusion criteria were meet, the materials and methods section of the article were screened for further inclusion criteria (FFPE thyroid tissue, surgical resection specimens, and commercially available VE1 clone). Data from all eligible studies were then extracted [9, 11–37]. Extracted data included the following; first author’s name, title of article, year of publication, number of PTC and PTC variant specimens, type of molecular method for the detection of BRAF V600E, immunohistochemistry protocol (including dilution and incubation time), VE1 clone manufacturer, and method used for interpretation of antibody staining. For the meta-analysis the following data was extracted: all molecular (wild type and mutation) and immunohistochemistry (positive and negative) results.
Studies from the selected articles were then divided (Tables 1 and 2) based on the gold standard comparison testing used in each study to assess for BRAF V600E mutation. Those using direct sequencing methods (Sanger, Pyrosequencing) were placed in the “Direct Sequencing group” and those using PCR-based methodologies (rt-PCR, PNA-Clamp, SNaPshot, etc.) were placed in the “PCR group.”
Table 1.
Direct sequencing group—methods
| Study (year) | Method | Number of specimens | Clone VE1 vendor | Dilution/incubation | Interpretation | Note |
|---|---|---|---|---|---|---|
| Bullock (2012) | Sanger | 96 | Spring Bioscience | NA/30 min | No intensity score. Positive if staining > 20% of tumor cells | |
| Dvorak (2014) | Sanger | 73 | Ventana | NA/16 min | Intensity 0–3+; strong (3+), medium (2+), weak (1+) and no staining (0). Positive if unequivocal staining in > 85% tumor cells | |
| Fisher (2013) | Pyrosequencing | 25 | Spring Bioscience | 1:40/30 min | Intensity 0–3+; Positive if > 10% of tumor cells and 2+ or 3+. Anything less considered negative | Study also used pan-BRAF antibody. These were excluded from study |
| Ghossein (2013) | Mass spectrometry | 31 | Spring Bioscience | 1:50/NA | Intensity 0–3+; 0 (no staining), 1+ (faint), 2+ (moderate), 3+ (strong) Considered positive if 2+ | |
| Kim (2014) | Sanger | 91 | Spring Bioscience | 1:300/15 min | Allred | |
| Kim (2014) | Pyrosequencing | 91 | Spring Bioscience | 1:300/15 min | Allred | |
| Kim (2018) | Sanger | 697 | Spring Bioscience | NA/32 min | No staining negative; weak/faint to strong/diffuse considered positive | |
| Loo (2018) | Sanger | 12 | Ventana | NA/32 min | NA | |
| Martinuzzi (2016) | Sanger | 85 | Spring Bioscience | 1:50/NA | Capper et al. method | |
| Oh (2018) | Sanger | 23 | Ventana | 1:4/16 min | Diffuse homogenous staining in all tumor cells considered positive. Non-spec staining of colloid and equivocal weak or focal as negative | |
| Qui (2015) | Sanger | 127 | Ventana | NA/16 min | NA | |
| Zagzag (2013) | Sanger | 37 | Spring Bioscience | NA/NA | Intensity 0–3+ of 0–100% of tumor cells; < 1+ and < 20% was considered negative. > 80%, stratified into 1–3+ as positive | Some molecular results used to determine true positivity in weakly staining samples |
| Zhao (2019) | Sanger | 185 | Ventana | NA/16 min | Intensity 0–3; 1–3+ staining considered positive. No or only "slight" staining as negative | |
| Zhu (2016) | Sanger | 118 | Spring Bioscience | NA/40 min | Intensity 0–3+; 0 if no or faint staining in 10% or fewer cells, 1+ faint > 10% cells, 2+ mod > 10% cells, 3+ strong > 10%. Positive when score 1+ |
Table 2.
PCR group—methods
| Study (year) | Method | Number of specimens | Clone VE1 vendor | Dilution/incubation | Interpretation | Note |
|---|---|---|---|---|---|---|
| Abd Elmageed (2017) | rt-PCR | 130 | Spring Bioscience | 1:100/60 min | Capper et al. method | |
| Chen (2018) | Quantitative rt-PCR | 40 | GBI Biotechnology | NA/NA | Capper et al. method | |
| de Biase (2014) | ASLNA-qPCR | 20 | Spring Bioscience | NA/NA | NA | |
| Jung (2015) | PCR | 467 | Spring Bioscience | 1:50/NA | No or weak staining considered negative. Moderate or strong staining considered positive | |
| Kim (2014) | PNA-clamp | 91 | Spring Bioscience | 1:300/15 min | Allred | |
| Kim (2014) | rt-PCR | 91 | Spring Bioscience | 1:300/15 min | Allred | |
| Martinuzzi (2016) | PNA-clamp | 85 | Spring Bioscience | 1:50/NA | Capper et al. method | |
| McKelvie (2013) | C-PCR | 71 | Spring Bioscience | NA/12 min | Unequivocal diffuse cytoplasmic staining in > 85% of tumor cells considered positive | SNaPshot used in 9 discordant cases. 8/9 VE1+/C-PCR- were confirmed positive by SNaPshot, the last case VE1+, C-PCR- and SNaPshot- |
| Na (2015) | rt-PCR | 104 | Spring Bioscience | 1:100/NA | Intensity 0–3+; strong (3+) when staining of tumor cells was stronger than or equivalent to surrounding follicular colloid | |
| Qiu (2015) | rt-PCR | 127 | Ventana | NA/16 min | NA | |
| Routhier (2013) | SNaPshot | 15 | Spring Bioscience | 1:100/NA | Capper et al. method | Study included 4 PTC mets to LNs and 4 Follicular carcinomas. These were removed from the data set |
| Sun (2015) | rt-PCR | 556 | Ventana | NA/NA | Capper et al. method | |
| Szymonek (2017) | rt-PCR #1 | 137 | Ventana | 1:100/16 min | Intensity 0–3+; Positive if staining was ≥ 25% of tumor cells | |
| rt-PCR #2 | 137 | Ventana | 1:100/32 min | Same as above | ||
| Zhang (2018) | ARMS-PCR | 132 | Ventana | NA/32 min | Intensity 0–3+; weak (1+), requiring 10× or greater objective to observe staining, 2+ moderate, easy to recognize "yellow" staining w/10×. 3+ strong, “brown” with 4× | Sanger sequencing used in discrepant cases |
| Zhao (2019) | PCR | 185 | Ventana | NA/16 min | Intensity 0–3+; positive 1–3+. No or only slight staining, negative |
Statistical Analysis
The meta-analysis was performed using all extracted data and analyzed using STATA Version 13 (College Station, TX) software [38]. Rates of BRAF V600E mutation according to the immunohistochemical results were included in the meta-analysis. Forrest plots and summary receiver operating characteristic (SROC) curves were obtained. Both the direct sequencing and PCR groups were assessed for publication bias using Begg’s funnel plots (data not shown).
Results
Study Selection and Characteristic Review
Using the search criteria as described above, a total of 265 articles were identified in the database search. Initial evaluation of studies eliminated 236 articles. Twenty-nine remaining articles were then evaluated and six additional studies were excluded. Twenty-three studies were ultimately included in the meta-analysis [11–15, 17–26, 28–30, 32–35]. The characteristics of the selected 23 studies are included in Tables 1 and 2. The reason for exclusion of the six studies included the use of a non-commercially available BRAF V600E antibody clone in 4 studies [9, 16, 27, 31], one study using a non-VE1 clone [37], and one study using only core needle biopsy specimens [36]. The majority of the studies used the anti-human BRAF V600E (clone VE1) monoclonal antibody by Spring Bioscience (Spring Bioscience Pleasanton, CA, USA) [11, 13–15, 18, 21, 25, 26, 28–30, 32, 39, 40] or Ventana medical systems (Ventana Medical Systems, Roche Diagnostics Indianapolis, IN, USA) [12, 17, 19, 20, 22, 33–35]. Only one study used a BRAF V600E antibody from GBI Biotechnology (Beijing Zhongshan-GBI Biotechnology Co., Beijing, China) [24]. Of the twenty-thee included studies, a total of 3669 surgically resected FFPE PTC specimens were included in the meta-analysis. Some studies used the same specimen tested on different molecular platforms, bringing the total number of molecular tests performed to 4079 [14, 34]. The number of tissue samples tested in the various studies ranged from 12 [17] to 697 [15] samples.
Immunohistochemistry Method and Scoring
As stated above, the majority of the studies used the VE1 clone from either Spring Bioscience or Ventana, only one study used a VE1 antibody from GBI Biotechnology. However, processing of the slides varied in terms of dilution of antibody, incubation time, and temperature. Although some studies did not include a dilution factor in their method description, studies that did include a dilution factor varied from 1:4 to 1:300. Likewise, incubation times, if included in the method description, ranged from 12 to 60 min. A variety of immunohistochemical automatic staining platforms were used that included; Ventana Benchmark (Ventana Medical Systems Tucson, AZ), DAKO (DAKO, Carpinteria, CA), and Leica Bond (Leica Microsystems, Bannockburn, Il) systems for the staining of tissue sections. Method comparison of the various studies is included in Tables 1 and 2.
Immunohistochemical (IHC) staining interpretation criteria varied widely amongst the included studies, see Tables 1 and 2. Some studies used a previously described interpretation criteria developed by Capper et al [18, 24, 26, 32, 33]. This method used the following criteria: staining must be unambiguous, cytoplasmic and observed in a substantial fraction of viable tumor cells. Secondly, positivity was graded as weak, moderate, or strong based on illustrations provided in the paper (from 0–3+, respectively). Lastly, faint diffuse staining, any isolated nuclear staining, or weak staining of single cells was scored as negative [9]. However, some authors set more specific quantitative (percentage) criteria for the number of positively staining tumor cells ranging from ≥ 20% (11) to ≥ 85% (12, 29) to determine positivity. Yet other authors used a cutoff of ≥ 10% positivity of tumor cells staining, but only considered staining intensity of 2+ or greater as truly positive [13]. On the other hand, negative staining was considered by some authors to be weak or focal [13, 19, 22, 28]. Others considering weak (1+) staining as positive, but did not have a cutoff value for the number of positively staining tumor cells [15, 35]. Only one group, two separate published studies, used the Allred scoring system which combines the percentage of cells staining positive and overall intensity [14, 15]. Interpretation of IHC staining was performed by at least two pathologists for most studies (all pathologists were blinded to the molecular results in each study), whereas, one study used only one pathologist [21] and another had as many as five pathologists [27].
Results of the Meta-Analysis
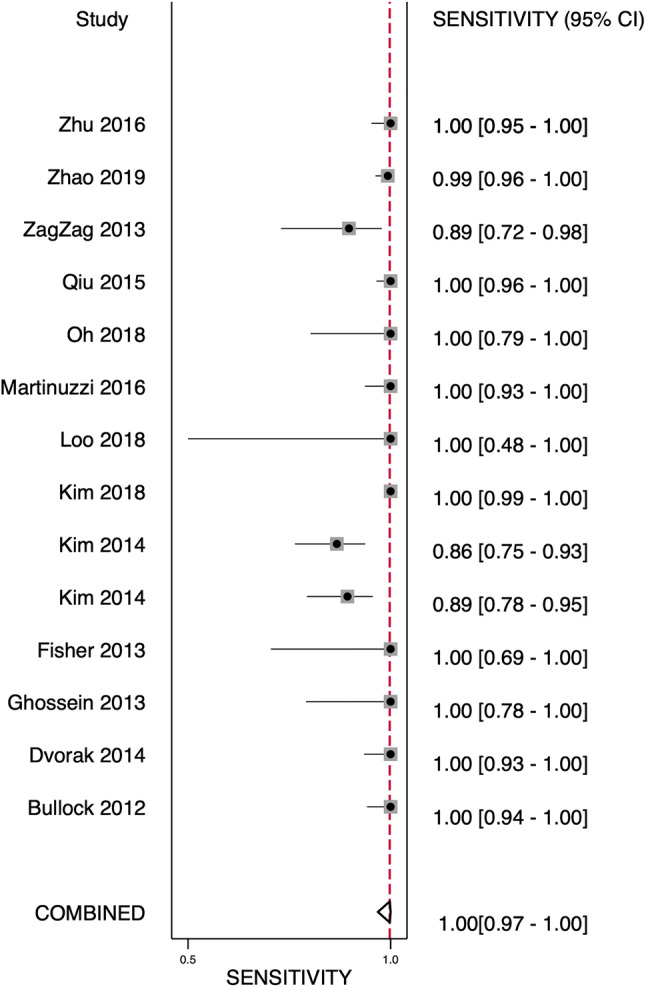
Tables 1, 2, and 3 list the included studies broken down into two groups based on the gold standard molecular method used to compare VE1 IHC staining. These were termed as the following: those studies using direct sequencing (Sanger, Pyrosequencing) were termed the “direct sequencing group” and those using PCR-based methodologies (rt-PCR, PNA-Clamp, SNaPshot, etc.) were termed the “PCR group.” One study using ASLNA-qPCR (by de Biase et al. [25]), which studied 20 PTC specimens, was excluded from the PCR group as the study’s specificity was unable to be calculated given no true negatives or false positives recorded in their results. The remaining studies included in the meta-analysis showed the pooled sensitivity for IHC in detecting a BRAF V600E mutation in the direct sequencing group was 100% (95% confidence interval [CI] 0.97–1.00) and for the PCR group was 98% (95% CI 0.96–0.99) and overall combined methods 99% (95% CI 0.98–1.00). The pooled specificity of the direct sequencing group was 84% (95% CI 0.72–0.91) and for the PCR group was 89% (95% CI 0.82–0.94), and overall combined methods was 87% (95% CI 0.81–0.91) (Figs. 2, 3, 4 and 5). The values of AUC on the SROC curves for the direct sequencing group and PCR group were 0.97 and 0.98, respectively (Figs. 6 and 7). The accuracy rates for the direct sequencing and PCR groups were 91.7% and 93.4%, respectively.
Table 3.
Direct sequencing and PCR group—combined statistics
| Direct sequencing group | |||||||||||
|---|---|---|---|---|---|---|---|---|---|---|---|
| Study | Direct method | Total PTCs | TP | TN | FP | FN | Sensitivity | Specificity | Accuracy | PPV | NPV |
| Bullock (2012) | Direct (Sanger) | 96 | 59 | 28 | 9 | 0 | 100.00% | 75.68% | 90.63% | 86.76% | 100.00% |
| Capper (2011) | Direct (Sanger) | ||||||||||
| Dvorak (2014) | Direct (Sanger) | 73 | 52 | 19 | 2 | 0 | 100.00% | 90.48% | 97.26% | 96.30% | 100.00% |
| Ghossein (2013) | Mass spectrometry | 31 | 15 | 16 | 0 | 0 | 100.00% | 100.00% | 100.00% | 100.00% | 100.00% |
| Fisher (2013) | Pyro | 25 | 10 | 11 | 4 | 0 | 100.00% | 73.33% | 84.00% | 71.43% | 100.00% |
| Kim (2014) | Direct (Sanger) | 91 | 56 | 16 | 12 | 7 | 88.89% | 57.14% | 79.12% | 82.35% | 69.57% |
| Kim (2014) | Pyro Seq | 91 | 56 | 14 | 12 | 9 | 86.15% | 53.85% | 76.92% | 82.35% | 60.87% |
| Kim (2018) | Direct (Sanger) | 697 | 581 | 70 | 46 | 0 | 100.00% | 60.34% | 93.40% | 92.66% | 100.00% |
| Koperek (2012) | Direct (Sanger) | ||||||||||
| Loo (2018) | Direct (Sanger) | 12 | 5 | 7 | 0 | 0 | 100.00% | 100.00% | 100.00% | 100.00% | 100.00% |
| Martinuzzi (2016) | Direct (Sanger) | 85 | 54 | 23 | 8 | 0 | 100.00% | 74.19% | 90.59% | 87.10% | 100.00% |
| Oh (2018) | Direct (Sanger) | 23 | 16 | 5 | 2 | 0 | 100.00% | 71.43% | 91.30% | 88.89% | 100.00% |
| Qiu (2015) | Direct (Sanger) | 127 | 100 | 25 | 2 | 0 | 100.00% | 92.59% | 98.43% | 98.04% | 100.00% |
| ZagZag (2013) | Direct (Sanger) | 37 | 25 | 9 | 0 | 3 | 89.29% | 100.00% | 91.89% | 100.00% | 75.00% |
| Zhao (2019) | Direct (Sanger) | 185 | 140 | 43 | 1 | 1 | 99.29% | 97.73% | 98.92% | 99.29% | 97.73% |
| Zhu (2016) | Direct (Sanger) | 118 | 73 | 37 | 8 | 0 | 100.00% | 82.22% | 93.22% | 90.12% | 100.00% |
| PCR based group | |||||||||||
|---|---|---|---|---|---|---|---|---|---|---|---|
| Study | PCR method | Total PTCs | TP | TN | FP | FN | Sensitivity | Specificity | Accuracy | PPV | NPV |
| Chen (2018) | quant-rtPCR | 40 | 34 | 4 | 2 | 0 | 100.00% | 66.67% | 95.00% | 94.44% | 100.00% |
| de Biase (2014) | ASLNA-qPCR | 20 | 18 | 0 | 0 | 2 | 90.00% | 90.00% | 100.00% | 0.00% | |
| Elmageed (2017) | rt-PCR | 130 | 97 | 28 | 2 | 3 | 97.00% | 93.33% | 96.15% | 97.98% | 90.32% |
| Ilie (2014) | SNaPshot | ||||||||||
| Jung (2015) | PCR | 467 | 392 | 65 | 9 | 1 | 99.75% | 87.84% | 97.86% | 97.76% | 98.48% |
| Kim (2014) | PNA clamp | 91 | 56 | 17 | 12 | 6 | 90.32% | 58.62% | 80.22% | 82.35% | 73.91% |
| Kim (2014) | rt-PCR | 91 | 58 | 15 | 10 | 8 | 87.88% | 60.00% | 80.22% | 85.29% | 65.22% |
| Martinuzzi (2016) | PNA-Clamp | 85 | 58 | 21 | 2 | 4 | 93.55% | 91.30% | 92.94% | 96.67% | 84.00% |
| McKelvie (2013) | C-PCR (SNaPshot) | 71 | 49 | 21 | 1 | 0 | 100.00% | 95.45% | 98.59% | 98.00% | 100.00% |
| Na (2015) | rt-PCR | 104 | 71 | 29 | 4 | 0 | 100.00% | 87.88% | 96.15% | 94.67% | 100.00% |
| PajaFano (2017) | rt-PCR | ||||||||||
| Qiu (2015) | rt-PCR | 127 | 100 | 25 | 2 | 0 | 100.00% | 92.59% | 98.43% | 98.04% | 100.00% |
| Routhier (2013) | SNaPshot | 15 | 9 | 6 | 0 | 0 | 100.00% | 100.00% | 100.00% | 100.00% | 100.00% |
| Sun (2015) | rt-PCR | 556 | 414 | 137 | 0 | 5 | 98.81% | 100.00% | 99.10% | 100.00% | 96.48% |
| Szymonek (2017) | rt-PCR#1 | 137 | 69 | 46 | 9 | 13 | 84.15% | 83.64% | 83.94% | 88.46% | 77.97% |
| rt-PCR#2 | 137 | 80 | 49 | 6 | 2 | 97.56% | 89.09% | 94.16% | 93.02% | 96.08% | |
| Zhang (2018) | ARMS-PCR | 132 | 106 | 21 | 5 | 0 | 100.00% | 80.77% | 96.21% | 95.50% | 100.00% |
| Zhao (2019) | PCR | 185 | 142 | 35 | 4 | 4 | 97.26% | 89.74% | 95.68% | 97.26% | 89.74% |
Fig. 2.
Forest plot—direct sequencing group—sensitivity
Fig. 3.

Forest plot—direct sequencing group—specificity
Fig. 4.

Forest plot—PCR group—sensitivity
Fig. 5.
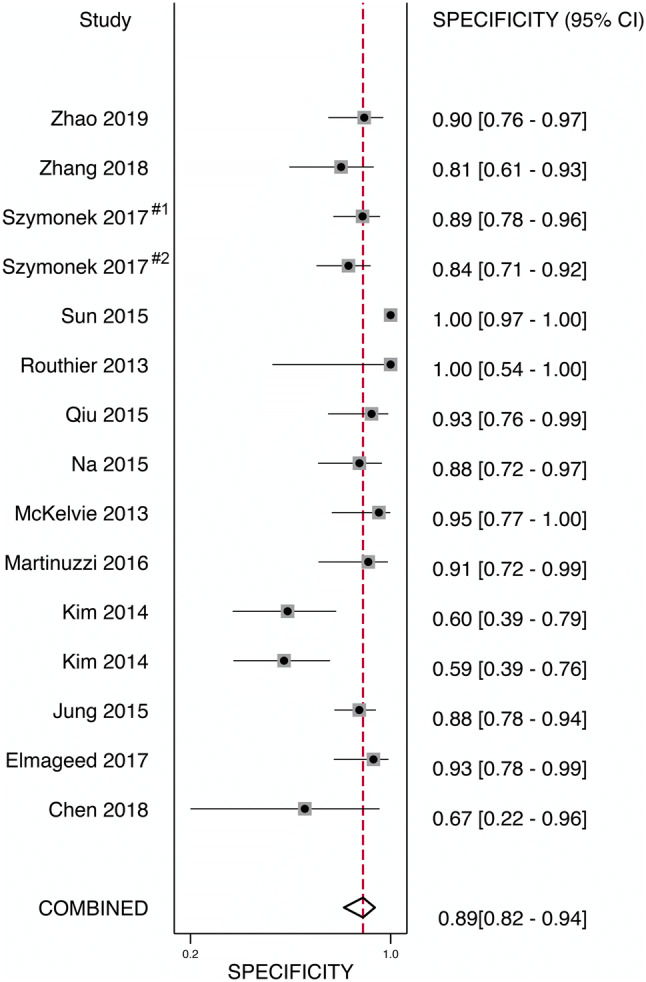
Forest plot—PCR group—specificity
Fig. 6.

Receiver operator curve—direct sequencing group
Fig. 7.
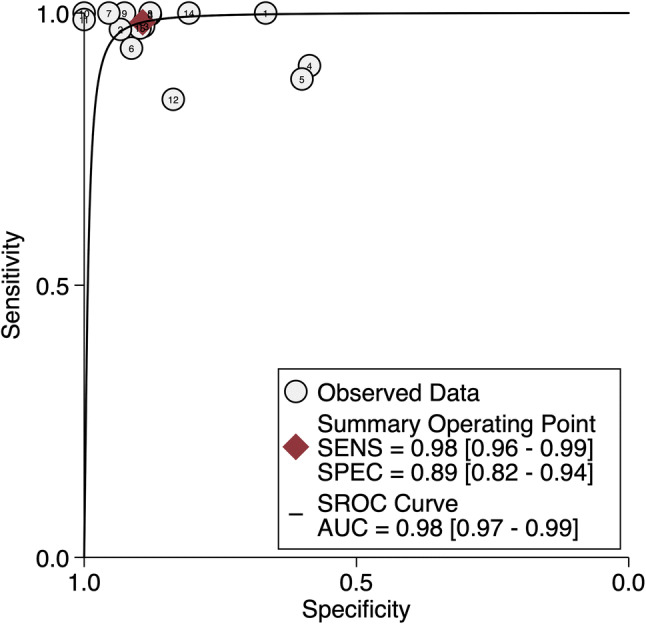
Receiver operator curve—PCR group
To assess for publication bias, a set of Begg’s funnel plots were developed for each group (data not shown). The direct sequencing group showed relative symmetry (p = 0.071), signifying no-publication bias. However, the PCR group showed more asymmetry (p = 0.010), suggesting the existence of some publication bias.
Discussion
The first published meta-analysis review of the utility of BRAF IHC in PTCs by Pyo et al. was performed in 2015, and since then more studies have emerged comparing IHC to various gold standard methods for the detection of BRAF V600E [10]. All studies included in the aforementioned meta-analysis used the VE1 (BRAF V600E specific) antibody clone. Additionally, non-surgical resection specimens (core needle biopsies and cytology FNAs) were included and a critical review of the scoring systems was not performed. Recently, a second systematic review and meta-analysis has also been published on the topic by Singarayer et al. [41]. This meta-analysis included surgical resection and cytology specimens, and other histologic diagnoses beside PTCs [i.e., Follicular Thyroid carcinoma (FTC), Medullary Thyroid Carcinoma (MTC), Poorly Differentiated Thyroid Carcinoma (PDTC), Anaplastic Thyroid Carcinoma (ATC), ectopic thyroid tissue, and benign thyroid tissue]. Additionally, two studies included in this meta-analysis used non-VE1 clones. In order to standardize data, the current meta-analysis focused only on studies using PTCs from surgical resection specimens comparing VE1 IHC to molecular “gold standard” methods with additional evaluation of IHC methodology and scoring criteria.
Pooled sensitivity and specificity combining the direct sequencing and PCR groups were 99% (95% CI 0.98–1.00) and 84% (95% CI 0.72–0.91) respectively. However, there were slightly more false positives amongst the direct sequencing group (6.3%) compared to the PCR group (2.8%). This difference may partially be explained by the need for a sufficient quantity of tumor cells and high-quality DNA to perform successful direct sequencing assays. Conversely, rt-PCR based assays such as the Cobas 4800 BRAF Mutation Test (Roche Diagnostics, Indianapolis, IN), which has been approved by the United States Food and Drug Administration for the in-vitro detection in patients with papillary thyroid carcinoma, can detect BRAF V600E mutations at > 5% allele frequency with 100% accuracy [42]. However, molecular methods are often more labor intensive and costly, making immunohistochemistry a more attractive method for the detection of BRAF V600E mutation.
Immunohistochemistry scoring criteria varied amongst the studies. The most consistently used criteria described by Capper et al., details described above, was specifically used in four separate studies [18, 24, 26, 32, 33]. A scoring system similar to the one describe by Capper et al., was used in the majority of studies: a numerical 4-tier intensity score, ranging from 0 (no staining) to 3+ (strong), details included in Tables 1 and 2. However, various other studies used a quantified number (percentage) of positively staining tumor cells as a cut-off value to determine positivity. For example, Bullock et al. required > 20% of positively staining tumor cells, Zagzag et al. required > 80%, and McKelvie et al. used a cut off of > 85% of tumor cell staining to determine positivity. When assessed for poor performance characteristics, assuming staining methods as equal across all studies, one study performed lower than the overall cohort in both specificity and accuracy in both the direct sequencing and PCR groups. The study performed by Kim et al. 2014, compared VE1 IHC to four different molecular methods (Sanger, Pyrosequencing, PNA clamp and rt-PCR) [14]. Assessment of the supplemental material showed that all four methods had relatively low specificity (Direct 57.1%, Pyro 54.0%, PNA-clamp 59.0%, and rt-PCR 60.0%). Calculated kappa values between the molecular methods were quite poor ranging from 0.53 to 0.79 (all P values < 0.001). When all molecular tests were negative for a single specimen (15 of 91 specimens), only two specimens had positive VE1 IHC staining. Interestingly, this study used the Allred scoring system, using a cutoff of < 4 as negative and ≥ 6 as positive. This Allred scoring system, first developed for the interpretation of estrogen receptor (ER) immunohistochemical stain on breast tissue, combines a 5-tier percentage cutoff for the amount positively staining tumor cells with a 1–3+ intensity score [no staining = 0, < 1% = 1, 1–10% = 2, 10–33% = 3, 33–66% = 4, > 66% = 5; no staining = 0, weak = 1, moderate = 2, strong = 3] [14, 43]. In this study, Allred score of 5 [weak (1+) expression in 33–66% of cells (score 4)] was not predictive of BRAF V600E mutation, as 7 cases were mutated by at least one molecular method and 4 were negative for all molecular methods. Whether the low accuracy in this study is specific to the Allred scoring system or other factors related to molecular methods is uncertain. However, the Allred method was not used in other studies, all of which had higher specificities. Therefore, this method may not be ideal for interpretation of VE1. In the authors’ unpublished experience, positive VE1 staining is almost always diffuse with equal intensity expression in all tumor cells. Comparatively, when assessing the Martinuzzi et al. study, which used the Capper et al. interpretation criteria, only two false positive IHC results were obtained by PCR method showing 2+ and 3+ positivity (2 of 85 specimen, wild-type for both molecular methods) [18]. It is worth noting that both Kim et al. [14] and Martinuzzi et al. [18] studies provided accessible supplementary data that included the results of all molecular studies with immunohistochemical interpretation and score for each individual tested sample. Further studies assessing scoring methods may be helpful, and individual results of the molecular tests in comparison to IHC scores should be provided in the supplementary material to allow for future meta-analysis assessment.
Additional factors such as type of tissue, length and type of fixation are also important to consider when validating immunohistochemical antibodies. The study by Dvorak et al. 2014, included comparative data assessing the effects of time to fixation, length of fixation and type of fixative used on xenograft (A2058 and LS411N xenografts) tissue. They concluded that a cold ischemic time of > 6 h (ideal conditions would be < 2 h) followed by fixation in 10% neutral buffered formalin (NBF) produced membranous and patchy staining in the xenograft tissue (A2058 and LS411N, respectively). Fixation for less than 12 h in 10% NBF produced weaker VE1 staining compared to xenograft tissue that was fixed for 12–72 h. Lastly, fixatives other than 10% NBF, such as 95% ethanol, Prefer, AFA, and Z-5 were recommended not to be used due to poor quality in staining regardless of fixation time [12]. Additional guidance provided by this paper suggested validating each mutation-specific immunohistochemical marker to a specific tumor type. Similar insight was provided by Szymonek et al. and Zhang et al. [34, 35]. Both studies evaluated the performance characteristics when simply doubling the immunohistochemical incubation time and performing the study in duplicate. Szymonek et al. showed improved sensitivity and slightly better specificity by doubling the incubation time from 16 to 32 min (sensitivity 84% to 98%, specificity 84% to 89%) [34]. Zhang et al. 2018 evaluated select PTC specimens positive for BRAF V600E by molecular analysis and concluded that VE1 staining intensity for PTC specimens was improved by doubling the incubation time from 32 to 64 min, thus reducing the number of falsely negative staining PTCs. This study also looked at VE1 staining in colorectal carcinomas (CRC) and concluded that optimal incubation times for VE1 antibody in PTC and CRC differed, CRC best at 32 min and PTC best at 64 min [44]. Similar to Dvorak et al., these findings suggest VE1 antibody validation may be tumor specific and the selection of control tissue used to compare patient specimens may not be as simple as comparing “apples to apples.” Thus, additional consideration for future studies or internal laboratory validation would include the effect of incubation times on sensitivity and specificity.
Although no specific methodology for scoring has been established for the interpretation of VE1 IHC, it is worth mentioning that reproducibility in the form of standardization in IHC protocol may be warranted. Clinical trials are underway using BRAF-inhibitors, vemurafenib and dabrafenib, for patients with BRAF V600E mutated PTCs. It is likely that future clinical management of such patients will depend on their tumors BRAF V600E mutational status. Thus, if BRAF V600E (VE1 clone) IHC is used for mutational screening of PTC, it must be reproducible (good interobserver variability), reliable, and accurate for routine practice. As an ideal screening test, high sensitivity would be desired. The results of this review show the VE1 antibody clone to be highly sensitive and specific for the detection of BRAF V600E mutation in PTC. The findings of this meta-analysis are consistent with previous reports by Pyo et al. [10] and Singarayer et al. [41]. In our opinion as well as stated by Dvorak et al., staining should be considered positive when cytoplasmic, uniform (of any intensity), and diffuse throughout the tumor (Fig. 8).
Fig. 8.

Papillary thyroid carcinoma, classic type (a) showing diffuse cytoplasmic VE1 expression with moderate intensity (b); Papillary thyroid carcinoma, invasive follicular variant (c) showing negative VE1 immunostain (d). Evaluation of VE1 immunostain in papillary thyroid carcinoma at low power (e) may be deceptive. Higher power examination confirms diffuse but weak VE1 positivity (f) in a case with confirmed BRAF V600E mutation by next generation sequencing (unpublished data). These examples utilized prediluted Roche Ventana VE1 monoclonal antibody (Indianapolis, IN, USA) on the Leica Bond Refine System (Buffalo Grove, IL, USA) at 60 min incubation time
In addition to the BRAF V600E mutation in papillary thyroid carcinoma another actionable genetic target, NTRK, is currently being investigated in thyroid carcinomas. Constitutive activation or overexpression of the NTRK1, NTRK2, and NTRK3 transmembrane tyrosine kinases has been implicated in oncogenesis [45]. Constitutive activation or overexpression of these Trk receptors have been implicated in oncogenesis [45]. NTRK fusions are more commonly seen in pediatric PTC (up to 26%) compared to adult [46]. Larotrectinib, a selective TRK inhibitor, was approved by the FDA in November 2018 for the treatment of TRK fusion-positive advanced solid tumors [47]. Recently a pan-Trk monoclonal antibody (Abcam, Cambridge, MA) has been developed. In two studies, pan-Trk was positive 2/4 and 9/11 NTRK-rearranged thyroid carcinomas (sensitivities 50% and 81.8%, respectively), with reported pan-tumor-type specificities ranging from 81.1 to 100% [45, 48, 49]. Additional larger studies to assess the reliability of pan-Trk IHC for the detection of NTRK fusion in thyroid carcinoma are warranted.
Although mutation-specific IHC may not be performed in routine pathology practices as of yet, detection of actionable genetic alterations such as BRAF V600E mutation will likely become incorporated into treatment algorithms for recurrent/metastatic PTC. Recommendations based on this meta-analysis and personal observation include: Fixation should only be performed using 10% neutral buffered formalin, with minimal cold ischemic time (preferably less than 2 h), and at least 12 h of total fixation time (no longer than 72 h). Incubation time for the VE1 antibody should be at least 32 min (up to 64 min) for optimal results. Staining should be considered positive when cytoplasmic, uniform (of any intensity), and diffuse throughout the tumor with ≥ 90% of tumor cells staining (Fig. 8). Isolated nuclear staining or single cell staining should be interpreted as negative. Patchy or inconsistent staining should be repeated and may represent fixation artifact. In summary, VE1 IHC is a rapid, cost effective, sensitive, and specific method for the detection of BRAF V600E mutation and can be used as a reliable screening test. However, individual validation studies should be performed with institutional molecular methods and tissue-specific controls for the tumor of interest, for use in routine clinical practice.
Acknowledgements
The authors would like to give special thanks to Dr. Girish Venkataraman (University of Chicago, Director of the Immunohistochemistry Lab in the Department of Pathology, Section of Hematopathology) for his guidance regarding BRAF immunohistochemical techniques.
Funding
No funding was received for this study.
Compliance with Ethical Standards
Conflict of interest
The authors declare that they have no conflict of interest.
Footnotes
Publisher's Note
Springer Nature remains neutral with regard to jurisdictional claims in published maps and institutional affiliations.
References
- 1.Pellegriti G, Frasca F, Regalbuto C, Squatrito S, Vigneri R. Worldwide increasing incidence of thyroid cancer: update on epidemiology and risk factors. J Cancer Epidemiol. 2013;2013:965212. doi: 10.1155/2013/965212. [DOI] [PMC free article] [PubMed] [Google Scholar]
- 2.Chen AY, Jemal A, Ward EM. Increasing incidence of differentiated thyroid cancer in the United States, 1988–2005. Cancer. 2009;115(16):3801–3807. doi: 10.1002/cncr.24416. [DOI] [PubMed] [Google Scholar]
- 3.Enewold L, Zhu K, Ron E, Marrogi AJ, Stojadinovic A, Peoples GE, et al. Rising thyroid cancer incidence in the United States by demographic and tumor characteristics, 1980–2005. Cancer Epidemiol Biomark Prev. 2009;18(3):784–791. doi: 10.1158/1055-9965.EPI-08-0960. [DOI] [PMC free article] [PubMed] [Google Scholar]
- 4.Agrawal N, Akbani R, Aksoy BA, Ally A, Arachchi H, Asa SL, Auman JT, Balasundaram M, Balu S, Baylin SB, Behera M. Integrated genomic characterization of papillary thyroid carcinoma. Cell. 2014;159(3):676–690. doi: 10.1016/j.cell.2014.09.050. [DOI] [PMC free article] [PubMed] [Google Scholar]
- 5.TCGA study improves understanding of genetic drivers of thyroid cancer - The Cancer Genome Atlas. https://cancer.gov/. Accessed 31 Oct 2019.
- 6.Tufano RP, Teixeira GV, Bishop J, Carson KA, Xing M. BRAF mutation in papillary thyroid cancer and its value in tailoring initial treatment: a systematic review and meta-analysis. Medicine (Baltimore) 2012;91(5):274–286. doi: 10.1097/MD.0b013e31826a9c71. [DOI] [PubMed] [Google Scholar]
- 7.Xing M, Westra WH, Tufano RP, Cohen Y, Rosenbaum E, Rhoden KJ, et al. BRAF mutation predicts a poorer clinical prognosis for papillary thyroid cancer. J Clin Endocrinol Metab. 2005;90(12):6373–6379. doi: 10.1210/jc.2005-0987. [DOI] [PubMed] [Google Scholar]
- 8.Clinical Trials—My Cancer Genoma Atlas. https://llwww.mycancergenome.org/. Accessed 31 Oct 2019.
- 9.Capper D, Preusser M, Habel A, Sahm F, Ackermann U, Schindler G, et al. Assessment of BRAF V600E mutation status by immunohistochemistry with a mutation-specific monoclonal antibody. Acta Neuropathol. 2011;122(1):11–19. doi: 10.1007/s00401-011-0841-z. [DOI] [PubMed] [Google Scholar]
- 10.Pyo JS, Sohn JH, Kang G. BRAF immunohistochemistry using clone VE1 is strongly concordant with BRAF(V600E) mutation test in papillary thyroid carcinoma. Endocr Pathol. 2015;26(3):211–217. doi: 10.1007/s12022-015-9374-7. [DOI] [PubMed] [Google Scholar]
- 11.Bullock M, O'Neill C, Chou A, Clarkson A, Dodds T, Toon C, et al. Utilization of a MAB for BRAF(V600E) detection in papillary thyroid carcinoma. Endocr Relat Cancer. 2012;19(6):779–784. doi: 10.1530/ERC-12-0239. [DOI] [PubMed] [Google Scholar]
- 12.Dvorak K, Aggeler B, Palting J, McKelvie P, Ruszkiewicz A, Waring P. Immunohistochemistry with the anti-BRAF V600E (VE1) antibody: impact of pre-analytical conditions and concordance with DNA sequencing in colorectal and papillary thyroid carcinoma. Pathology. 2014;46(6):509–517. doi: 10.1097/PAT.0000000000000119. [DOI] [PMC free article] [PubMed] [Google Scholar]
- 13.Fisher KE, Neill SG, Ehsani L, Caltharp SA, Siddiqui MT, Cohen C. Immunohistochemical Investigation of BRAF p. V600E mutations in thyroid carcinoma using 2 separate BRAF antibodies. Appl Immunohistochem Mol Morphol. 2014;22(8):562–567. doi: 10.1097/PAI.0b013e3182a2f75f. [DOI] [PubMed] [Google Scholar]
- 14.Kim YH, Choi SE, Yoon SO, Hong SW. A testing algorithm for detection of the B-type Raf kinase V600E mutation in papillary thyroid carcinoma. Hum Pathol. 2014;45(7):1483–1488. doi: 10.1016/j.humpath.2014.02.025. [DOI] [PubMed] [Google Scholar]
- 15.Kim JK, Seong CY, Bae IE, Yi JW, Yu HW, Kim SJ, et al. Comparison of immunohistochemistry and direct sequencing methods for identification of the BRAF(V600E) mutation in papillary thyroid carcinoma. Ann Surg Oncol. 2018;25(6):1775–1781. doi: 10.1245/s10434-018-6460-3. [DOI] [PubMed] [Google Scholar]
- 16.Koperek O, Kornauth C, Capper D, Berghoff AS, Asari R, Niederle B, et al. Immunohistochemical detection of the BRAF V600E-mutated protein in papillary thyroid carcinoma. Am J Surg Pathol. 2012;36(6):844–850. doi: 10.1097/PAS.0b013e318246b527. [DOI] [PubMed] [Google Scholar]
- 17.Loo E, Khalili P, Beuhler K, Siddiqi I, Vasef MA. BRAF V600E mutation across multiple tumor types: correlation Between DNA-based sequencing and mutation-specific immunohistochemistry. Appl Immunohistochem Mol Morphol. 2018;26(10):709–713. doi: 10.1097/PAI.0000000000000516. [DOI] [PubMed] [Google Scholar]
- 18.Martinuzzi C, Pastorino L, Andreotti V, Garuti A, Minuto M, Fiocca R, et al. A combination of immunohistochemistry and molecular approaches improves highly sensitive detection of BRAF mutations in papillary thyroid cancer. Endocrine. 2016;53(3):672–680. doi: 10.1007/s12020-015-0720-9. [DOI] [PubMed] [Google Scholar]
- 19.Oh HS, Kwon H, Park S, Kim M, Jeon MJ, Kim TY, et al. Comparison of immunohistochemistry and direct sanger sequencing for detection of the BRAF(V600E) mutation in thyroid neoplasm. Endocrinol Metab (Seoul) 2018;33(1):62–69. doi: 10.3803/EnM.2018.33.1.62. [DOI] [PMC free article] [PubMed] [Google Scholar]
- 20.Chen J, Qiu H, Zhang M, Gu T, Shao S, Huang Y, et al. Hairpin assembly-triggered cyclic activation of a DNA machine for label-free and ultrasensitive chemiluminescence detection of DNA. Biosens Bioelectron. 2015;68:550–555. doi: 10.1016/j.bios.2015.01.054. [DOI] [PubMed] [Google Scholar]
- 21.Zagzag J, Pollack A, Dultz L, Dhar S, Ogilvie JB, Heller KS, et al. Clinical utility of immunohistochemistry for the detection of the BRAF v600e mutation in papillary thyroid carcinoma. Surgery. 2013;154(6):1199–1204. doi: 10.1016/j.surg.2013.06.020. [DOI] [PMC free article] [PubMed] [Google Scholar]
- 22.Xin WQ, Xin QQ, Yuan Y, Chen S, Gao XL, Zhao Y, et al. Comparison of flow diversion and coiling for the treatment of unruptured intracranial aneurysms. World Neurosurg. 2019;128:464–472. doi: 10.1016/j.wneu.2019.05.149. [DOI] [PubMed] [Google Scholar]
- 23.Zhu X, Luo Y, Bai Q, Lu Y, Lu Y, Wu L, et al. Specific immunohistochemical detection of the BRAF V600E mutation in primary and metastatic papillary thyroid carcinoma. Exp Mol Pathol. 2016;100(1):236–241. doi: 10.1016/j.yexmp.2016.01.004. [DOI] [PubMed] [Google Scholar]
- 24.Chen D, Qi W, Zhang P, Zhang Y, Liu Y, Guan H, et al. Investigation of BRAF V600E detection approaches in papillary thyroid carcinoma. Pathol Res Pract. 2018;214(2):303–307. doi: 10.1016/j.prp.2017.09.001. [DOI] [PubMed] [Google Scholar]
- 25.de Biase D, Cesari V, Visani M, Casadei GP, Cremonini N, Gandolfi G, et al. High-sensitivity BRAF mutation analysis: BRAF V600E is acquired early during tumor development but is heterogeneously distributed in a subset of papillary thyroid carcinomas. J Clin Endocrinol Metab. 2014;99(8):E1530–E1538. doi: 10.1210/jc.2013-4389. [DOI] [PubMed] [Google Scholar]
- 26.Abd Elmageed ZY, Sholl AB, Tsumagari K, Al-Qurayshi Z, Basolo F, Moroz K, et al. Immunohistochemistry as an accurate tool for evaluating BRAF-V600E mutation in 130 samples of papillary thyroid cancer. Surgery. 2017;161(4):1122–1128. doi: 10.1016/j.surg.2016.06.081. [DOI] [PubMed] [Google Scholar]
- 27.Ilie MI, Lassalle S, Long-Mira E, Bonnetaud C, Bordone O, Lespinet V, et al. Diagnostic value of immunohistochemistry for the detection of the BRAF(V600E) mutation in papillary thyroid carcinoma: comparative analysis with three DNA-based assays. Thyroid. 2014;24(5):858–866. doi: 10.1089/thy.2013.0302. [DOI] [PubMed] [Google Scholar]
- 28.Jung YY, Yoo JH, Park ES, Kim MK, Lee TJ, Cho BY, et al. Clinicopathologic correlations of the BRAFV600E mutation, BRAF V600E immunohistochemistry, and BRAF RNA in situ hybridization in papillary thyroid carcinoma. Pathol Res Pract. 2015;211(2):162–170. doi: 10.1016/j.prp.2014.10.005. [DOI] [PubMed] [Google Scholar]
- 29.McKelvie PA, Chan F, Yu Y, Waring P, Gresshoff I, Farrell S, et al. The prognostic significance of the BRAF V600E mutation in papillary thyroid carcinoma detected by mutation-specific immunohistochemistry. Pathology. 2013;45(7):637–644. doi: 10.1097/PAT.0000000000000008. [DOI] [PubMed] [Google Scholar]
- 30.Na JI, Kim JH, Kim HJ, Kim HK, Moon KS, Lee JS, et al. VE1 immunohistochemical detection of the BRAF V600E mutation in thyroid carcinoma: a review of its usefulness and limitations. Virchows Arch. 2015;467(2):155–168. doi: 10.1007/s00428-015-1773-0. [DOI] [PubMed] [Google Scholar]
- 31.Paja Fano M, Ugalde Olano A, Fuertes Thomas E, Oleaga AA. Immunohistochemical detection of the BRAF V600E mutation in papillary thyroid carcinoma. Evaluation against real-time polymerase chain reaction. Endocrinol Diabetes Nutr. 2017;64(2):75–81. doi: 10.1016/j.endinu.2016.12.004. [DOI] [PubMed] [Google Scholar]
- 32.Routhier CA, Mochel MC, Lynch K, Dias-Santagata D, Louis DN, Hoang MP. Comparison of 2 monoclonal antibodies for immunohistochemical detection of BRAF V600E mutation in malignant melanoma, pulmonary carcinoma, gastrointestinal carcinoma, thyroid carcinoma, and gliomas. Hum Pathol. 2013;44(11):2563–2570. doi: 10.1016/j.humpath.2013.06.018. [DOI] [PubMed] [Google Scholar]
- 33.Sun J, Zhang J, Lu J, Gao J, Lu T, Ren X, et al. Immunohistochemistry is highly sensitive and specific for detecting the BRAF V600E mutation in papillary thyroid carcinoma. Int J Clin Exp Pathol. 2015;8(11):15072–15078. [PMC free article] [PubMed] [Google Scholar]
- 34.Szymonek M, Kowalik A, Kopczynski J, Gasior-Perczak D, Palyga I, Walczyk A, et al. Immunohistochemistry cannot replace DNA analysis for evaluation of BRAF V600E mutations in papillary thyroid carcinoma. Oncotarget. 2017;8(43):74897–74909. doi: 10.18632/oncotarget.20451. [DOI] [PMC free article] [PubMed] [Google Scholar]
- 35.Li X, Tian X, Lv L, Hei G, Huang X, Fan X, et al. Microglia activation in the offspring of prenatal Poly I: C exposed rats: a PET imaging and immunohistochemistry study. Gen Psychiatr. 2018;31(1):e000006. doi: 10.1136/gpsych-2018-000006. [DOI] [PMC free article] [PubMed] [Google Scholar]
- 36.Crescenzi A, Guidobaldi L, Nasrollah N, Taccogna S, Cicciarella Modica DD, Turrini L, et al. Immunohistochemistry for BRAF(V600E) antibody VE1 performed in core needle biopsy samples identifies mutated papillary thyroid cancers. Horm Metab Res. 2014;46(5):370–374. doi: 10.1055/s-0034-1368700. [DOI] [PubMed] [Google Scholar]
- 37.da Silva RC, de Paula HS, Leal CB, Cunha BC, de Paula EC, Alencar RC, et al. BRAF overexpression is associated with BRAF V600E mutation in papillary thyroid carcinomas. Genet Mol Res. 2015;14(2):5065–5075. doi: 10.4238/2015.May.12.9. [DOI] [PubMed] [Google Scholar]
- 38.StataCorp. Stata Statistical Software: Release 13. College Station, TX: StataCorp LP; 2013.
- 39.Zhu G, Deng Y, Pan L, Ouyang W, Feng H, Wu J, et al. Clinical significance of BRAFV600E mutation in PTC and its effect on radioiodine therapy. Endocr Connect. 2019;8:754–763. doi: 10.1530/EC-19-0045. [DOI] [PMC free article] [PubMed] [Google Scholar]
- 40.Ghossein RA, Katabi N, Fagin JA. Immunohistochemical detection of mutated BRAF V600E supports the clonal origin of BRAF-induced thyroid cancers along the spectrum of disease progression. J Clin Endocrinol Metab. 2013;98(8):E1414–E1421. doi: 10.1210/jc.2013-1408. [DOI] [PMC free article] [PubMed] [Google Scholar]
- 41.Singarayer R, Mete O, Perrier L, Thabane L, Asa SL, Van Uum S, et al. A systematic review and meta-analysis of the diagnostic performance of BRAF V600E immunohistochemistry in thyroid histopathology. Endocr Pathol. 2019;30(3):201–218. doi: 10.1007/s12022-019-09585-2. [DOI] [PubMed] [Google Scholar]
- 42.Anderson S, Bloom KJ, Vallera DU, Rueschoff J, Meldrum C, Schilling R, et al. Multisite analytic performance studies of a real-time polymerase chain reaction assay for the detection of BRAF V600E mutations in formalin-fixed, paraffin-embedded tissue specimens of malignant melanoma. Arch Pathol Lab Med. 2012;136(11):1385–1391. doi: 10.5858/arpa.2011-0505-OA. [DOI] [PubMed] [Google Scholar]
- 43.Allred DC, Harvey JM, Berardo M, Clark GM. Prognostic and predictive factors in breast cancer by immunohistochemical analysis. Mod Pathol. 1998;11(2):155–168. [PubMed] [Google Scholar]
- 44.Hu S, Xu-Monette ZY, Balasubramanyam A, Manyam GC, Visco C, Tzankov A, et al. CD30 expression defines a novel subgroup of diffuse large B-cell lymphoma with favorable prognosis and distinct gene expression signature: a report from the International DLBCL Rituximab-CHOP Consortium Program Study. Blood. 2013;121(14):2715–2724. doi: 10.1182/blood-2012-10-461848. [DOI] [PMC free article] [PubMed] [Google Scholar]
- 45.Gatalica Z, Xiu J, Swensen J, Vranic S. Molecular characterization of cancers with NTRK gene fusions. Mod Pathol. 2019;32(1):147–153. doi: 10.1038/s41379-018-0118-3. [DOI] [PubMed] [Google Scholar]
- 46.Hsiao SJ, Zehir A, Sireci AN, Aisner DL. Detection of tumor NTRK gene fusions to identify patients who may benefit from tyrosine kinase (TRK) inhibitor therapy. J Mol Diagn. 2019;21(4):553–571. doi: 10.1016/j.jmoldx.2019.03.008. [DOI] [PMC free article] [PubMed] [Google Scholar]
- 47.Penault-Llorca F, Rudzinski ER, Sepulveda AR. Testing algorithm for identification of patients with TRK fusion cancer. J Clin Pathol. 2019;72(7):460–467. doi: 10.1136/jclinpath-2018-205679. [DOI] [PMC free article] [PubMed] [Google Scholar]
- 48.Solomon JP, Linkov I, Rosado A, Mullaney K, Rosen EY, Frosina D, et al. NTRK fusion detection across multiple assays and 33,997 cases: diagnostic implications and pitfalls. Mod Pathol. 2020;33(1):38–46. doi: 10.1038/s41379-019-0324-7. [DOI] [PMC free article] [PubMed] [Google Scholar]
- 49.Hechtman JF, Benayed R, Hyman DM, Drilon A, Zehir A, Frosina D, et al. Pan-Trk immunohistochemistry is an efficient and reliable screen for the detection of NTRK fusions. Am J Surg Pathol. 2017;41(11):1547–1551. doi: 10.1097/PAS.0000000000000911. [DOI] [PMC free article] [PubMed] [Google Scholar]