

Abstract
Background
Type 2 Diabetes Mellitus (T2DM) is a well-known comorbidity to COVID-19 and coagulopathies are a common accompaniment to both T2DM and COVID-19. In addition, patients with COVID-19 are known to develop micro-clots within the lungs. The rapid detection of COVID-19 uses genotypic testing for the presence of SARS-Cov-2 virus in nasopharyngeal swabs, but it can have a poor sensitivity. A rapid, host-based physiological test that indicated clotting severity and the extent of clotting pathologies in the individual who was infected or not would be highly desirable.
Methods
Platelet poor plasma (PPP) was collected and frozen. On the day of analysis, PPP samples were thawed and analysed. We show here that microclots can be detected in the native plasma of twenty COVID-19, as well as ten T2DM patients, without the addition of any clotting agent, and in particular that such clots are amyloid in nature as judged by a standard fluorogenic stain. Results were compared to ten healthy age-matched individuals.
Results
In COVID-19 plasma these microclots are significantly increased when compared to the levels in T2DM.
Conclusions
This fluorogenic test may provide a rapid and convenient test with 100% sensitivity (P < 0.0001) and is consistent with the recognition that the early detection and prevention of such clotting can have an important role in therapy.
Keywords: COVID-19, Coagulopathies, Amyloid, Pathologies
Background
The standard method for detecting infection with SARS-CoV-2 leading to COVID-19 disease involves a genotypic (PCR) test for the virus on nasopharyngeal swabs, but it is unpleasant, requires specific training, and can have poor sensitivity [1–7]. What would be desirable is a rapid and phenotypic test on the host that indicates the presence, and if possible the severity, of clotting pathologies, which is one of the consequences of infection. Presently, the standard method for this is based on CT chest scans for pneumonia, which have high sensitivity but lower specificity (see [7–10] and below), but this is neither cheap nor universally available.
A poor prognosis for recovery, is linked to various comorbidities, of which Type 2 Diabetes Mellitus (T2DM) is probably the most frequently mentioned comorbidity. It is widely recognised [11–21] that extensive blood clotting has a major role in the pathophysiology of COVID-19 disease severity and progression, yet so can excessive bleeding [22, 23]. The solution to this apparent paradox lies in the recognition [24] that these phases are separated in time: the later bleeding is mediated by the earlier clotting-induced depletion of fibrinogen and of von Willebrand factor (VWF). This first phase of hypercoagulability is accompanied by partial fibrinolysis of the formed clots, and an extent of D-dimer formation that is predictive of clinical outcomes [25]. These features, together with the accompanying decrease in platelets (thrombocytopaenia), leads to the subsequent bleeding. Thus it is suggested that the application of suitably monitored levels of anti-clotting agents in the earlier phase provides for a much better outcome [13, 24]. In addition, dysregulated hemostasis in COVID-19-associated disseminated intravascular coagulation is exacerbated by an inhibition of fibrinolysis, indicating the plasminogen-plasmin-system as a potential target to prevent thromboembolic complications in COVID-19 patients [26]. In addition, patients with COVID-19-associated respiratory failure admitted to the intensive care unit exhibit a hypercoagulable state which is not appreciable on conventional tests of coagulation. Supranormal clot firmness, minimal fibrinolysis, and hyperfibrinogenaemia are key findings [27].
As well as the extent of clotting, including states similar to the life-threatening disseminated intravascular coagulation (DIC) [15], a second issue pertains to its nature. Some years ago, we discovered that in the presence of microbial cell wall components [28, 29], and in a variety of chronic, inflammatory diseases [30–32] (including sepsis [33]), blood fibrinogen can clot into an anomalous, amyloid form [34]. These forms are easily detected by a fluorogenic stain such as thioflavin T, or the so-called Amytracker stains [35]. In all cases, however, these experiments were performed in vitro using relevant plasma, with clotting being induced by the addition of thrombin. In our preliminary experiments this was also the case for plasma from COVID-19 patients, but the signals were so massive that they were essentially off the scale. However, as we report here, the plasma of COVID-19 patients carries a massive load of preformed amyloid clots (with no thrombin being added), and this therefore provides a rapid and convenient test for COVID-19. As the presence of T2DM is a well-known co-morbidity, that significantly decreases survival and a positive outcome for COVID-19 patients, we included such a group in our sample cohort too.
Methods
Ethical considerations
Ethical approval for blood collection and analysis of the patients with COVID-19, T2DM and healthy individuals, was given by the Health Research Ethics Committee (HREC) of Stellenbosch University (reference number: 9521). This laboratory study was carried out in strict adherence to the International Declaration of Helsinki, South African Guidelines for Good Clinical Practice and the South African Medical Research Council (SAMRC), Ethical Guidelines for research. Oral consent was obtained from COVID-19 patients to participate in the study. Written consent was obtained from T2DM patients and healthy participants.
Patient sample
Covid-19 patients
20 COVID-19-positive samples (11 males and 9 females) were obtained and blood samples collected before treatment was embarked upon. Blood samples were collected by JS. Platelet poor plasma (PPP) prepared and stored at − 80 °C, until fluorescent microscopy analysis.
Type 2 Diabetes Mellitus (T2DM)
Stored Platelet poor plasma samples were randomly selected from our Laboratory’s stored sample repository. 10 age-matched T2DM (6 Males and 4 females), collected in 2018, were used in this analysis.
Healthy samples
Our healthy sample was 10 age-matched controls (4 males and 6 females), previously collected and stored in our plasma repository. They were non-smokers, with CRP levels within healthy ranges, and not on any anti-inflammatory medication.
Lung CT scans
Amongst the COVID-19 patient sample 10 patients were admitted, but stabilized and blood drawn and sent home for observation. Where patients were clinically deemed as moderate or severely ill, CT scans of the patients were performed to determine the severity of the lung pathology. We divided our sample into mild disease (no CT scan) and moderate to severely ill. The CT scan and severity score [36] confirmed moderate to severely ill patients according to the ‘ground glass’ opacities in the lungs.
Fluorescent Microscopy of patient whole blood and platelet poor plasma (PPP)
A simple fluorescence assay was developed by comparing fluorescent (anomalous) amyloid signals present in PPP from COVID-19 patients, T2DM and those from healthy age-matched individuals, all of whom were studied using PPP that had been stored at −80 °C. On the day of analysis, PPP was thawed and incubated with the dye thioflavin T (ThT; 5 µM final concentration), which detects amyloid-like structures [37]. Following this, the sample was incubated for 30 min (protected from light) at room temperature. PPP smears were then created by transferring a small volume (5 µl) of the stained PPP sample to a microscope slide (similar methods were followed to create a blood smear). A cover slip was placed over the prepared smear and viewed using a Zeiss AxioObserver 7 fluorescent microscope with a Plan-Apochromat 63x/1.4 Oil DIC M27 objective.
For ThT quantification, the excitation was set at 450 to 488 nm and emission at 499 to 529 nm. Unstained samples were also prepared with both healthy and COVID-19 PPP, to assess any autofluorescence. Micrograph analysis was done using ImageJ (version 2.0.0-rc-34/1.5a). The % area of amyloid were calculated using the thresholding method. This method allows a measurement of area of amyloid signal. The RGB images are opened in ImageJ, each image is calibrated by setting the scale (calculated using the image pixel size and the known size of the scale bar). Each image is then converted to black and white (8 bit, this is adjusted under the image type setting). The next step is to threshold the image by adjusting the background intensity to white (255) and then thresholding the now black amyloid signal (in these images between 11 and 15). We used the Huang setting during thresholding. Huang’s method is an optimization method which finds the optimal threshold value by minimizing the measures of fuzziness. The black amyloid area is then analyzed using the analyze particle setting where we use the particle size that is measured from 1 to infinity. The particle size setting allows us to exclude any background signal that might not be true amyloid signal. The area per data per particle size that is generated is then copied into a spreadsheet (see our raw data). Statistical analysis was done using GraphPad Prism 8 (version 8.4.3). Sensitivity and specificity of the data were calculated according to the following calculations:
Results
Age-matched COVID-19 (average age 49.9y) and healthy individuals (58.8y), and T2DM (62.1y) were used in this analysis (p = 0.06). Platelet poor plasma (PPP) was collected and frozen. On the day of analysis, all PPP samples were thawed and analysed. We also confirmed that the same results are visible in freshly prepared PPP samples. Figure 1 shows representative CT scans of four of the COVID-19 patients. Raw data are shared in https://1drv.ms/u/s!AgoCOmY3bkKHirZOu5YKPlq1x5f1AQ?e=xmWGKm.
Fig. 1.
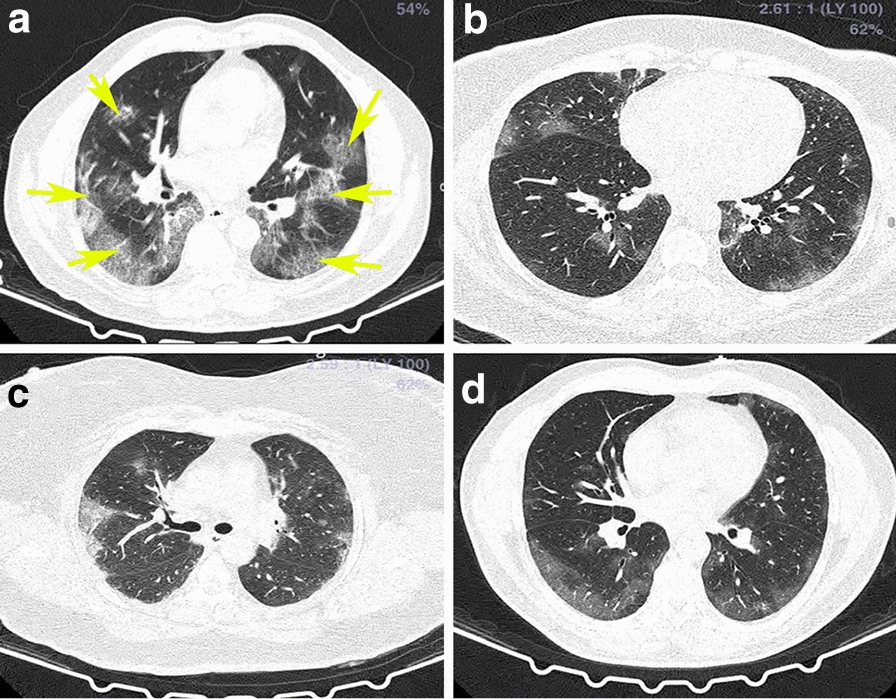
a–d Representative CT scans of a COVID-19 patient. Yellow arrows show ground glass opacities
Figures 2, 3, 4, 5 show representative fluorescence micrographs of PPP from healthy, T2DM and COVID-19 individuals. In healthy PPP smears (Fig. 2), very little ThT fluorescent signal is visible. In plasma smears from T2DM (Fig. 3), individuals, there were a significant increase in signal, compared to controls, and an even more pronounced increase in signal in COVID-19 individuals (Fig. 4), where abundant amyloid signal is noted. Note that these signals were as received; no thrombin was added to induce clotting. Figure 5 shows the additional presence of fibrous or cellular deposits in the PPP smears of COVID-19 patients. There have been reports of extensive endotheliopathy in COVID-19 patients [38, 39], and these deposits might contribute to this endotheliopathy. Figure 6a and b show box plots of the % area of amyloid signal calculated from representative micrographs of each individual. A nonparametric one-way ANOVA test (Kruskal–Wallis test) between all groups showed a highly significant difference (p = < 0.0001). However, a Mann–Whitney analysis between the mild and the moderate to severe COVID-19 individuals showed no significant difference (p = 0.554). Amyloid formation in plasma is therefore present in the early stages of COVID-19, when the patients are sufficiently unwell to visit the hospital and in need of stabilization.
Fig. 2.
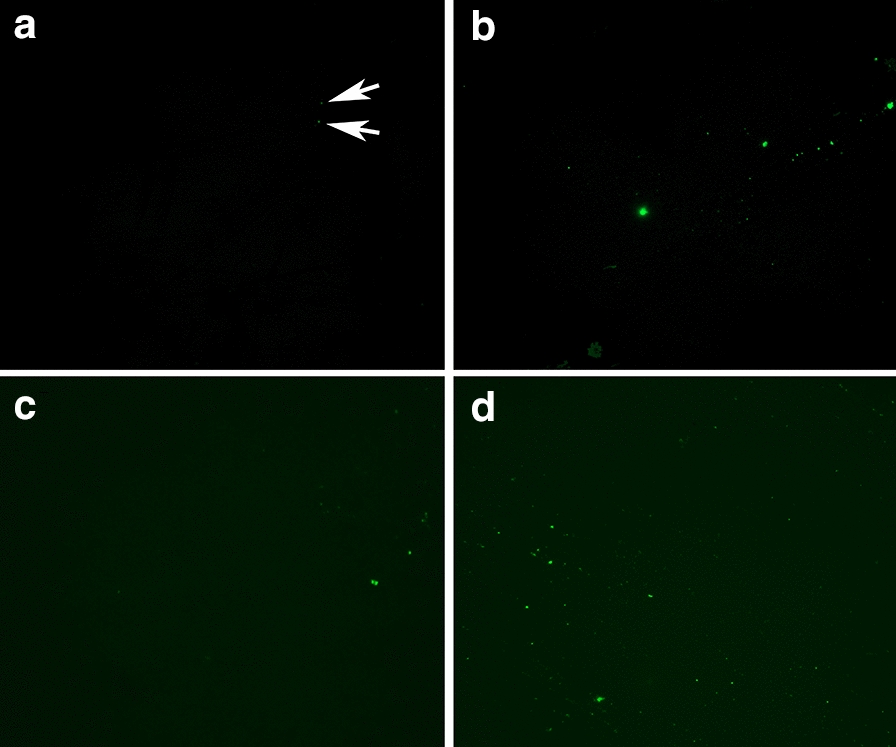
a–d Representative fluorescence micrographs of platelet poor plasma from healthy individuals. Most signals are very weak, as shown by the arrows in a
Fig. 3.
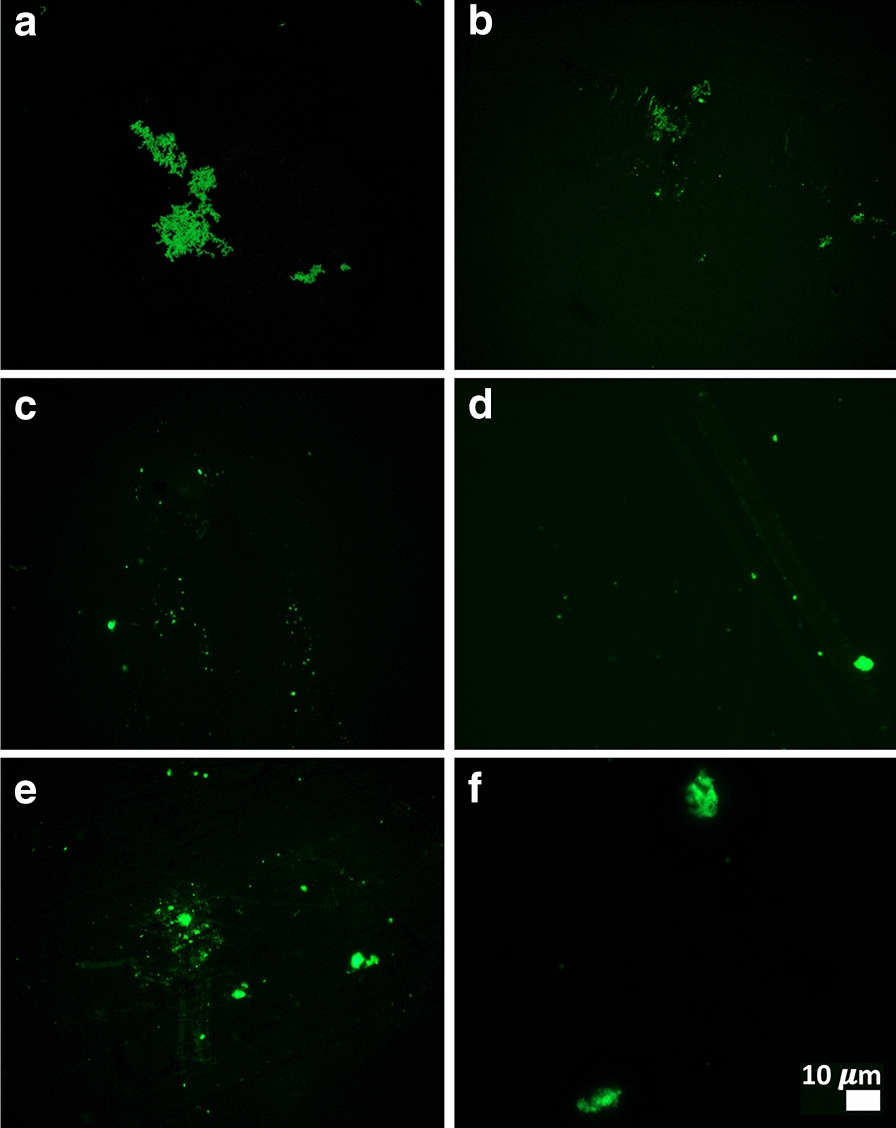
a–f Representative fluorescence micrographs of platelet poor plasma from Type 2 Diabetes Mellitus (T2DM) patients
Fig. 4.
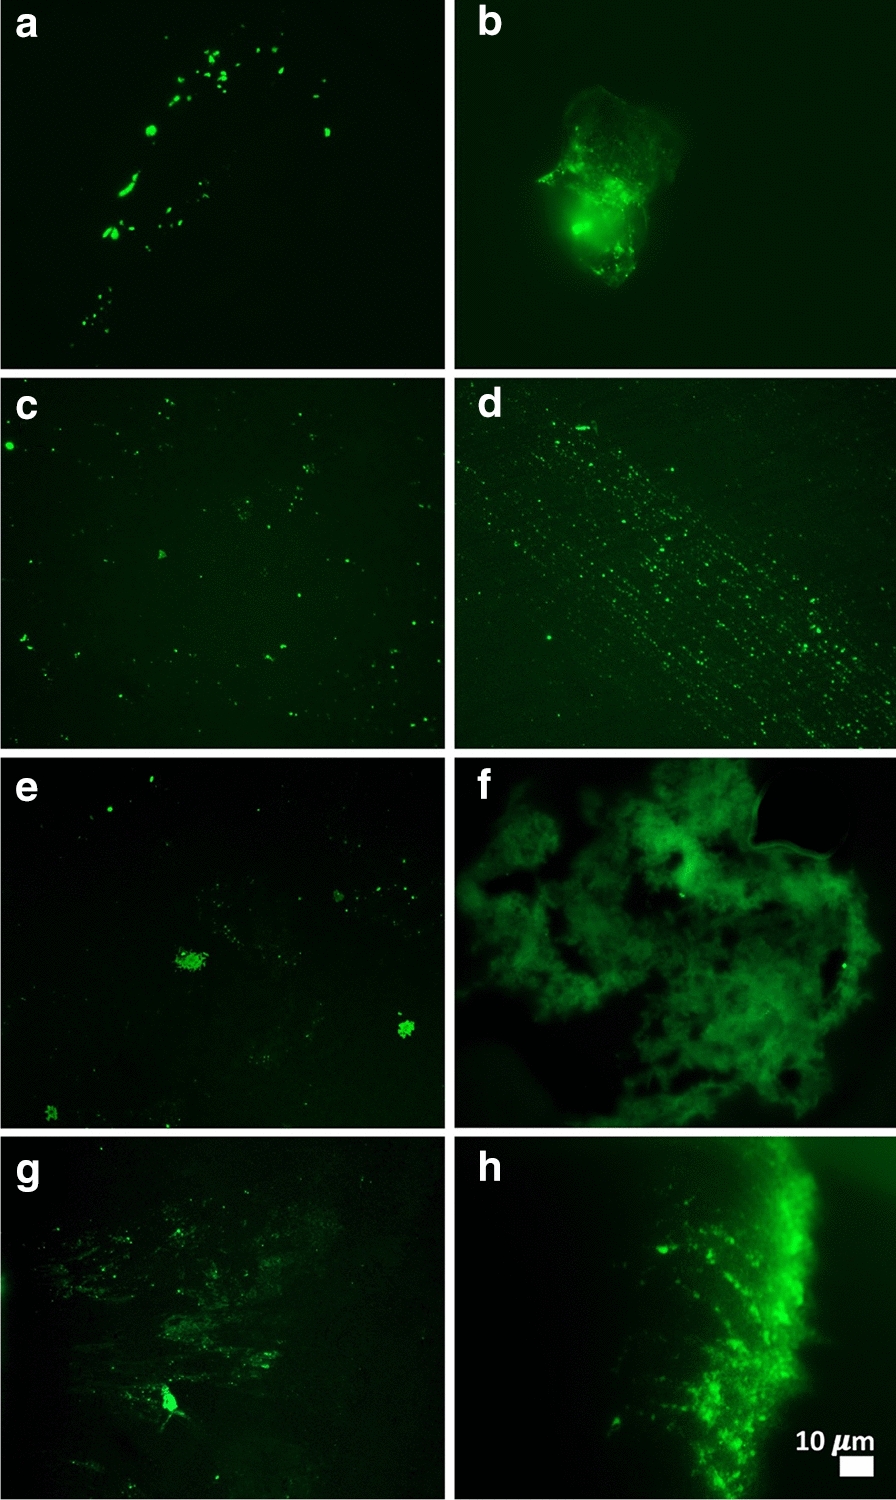
a–h Representative fluorescence micrographs of platelet poor plasma from COVID-19 patients
Fig. 5.
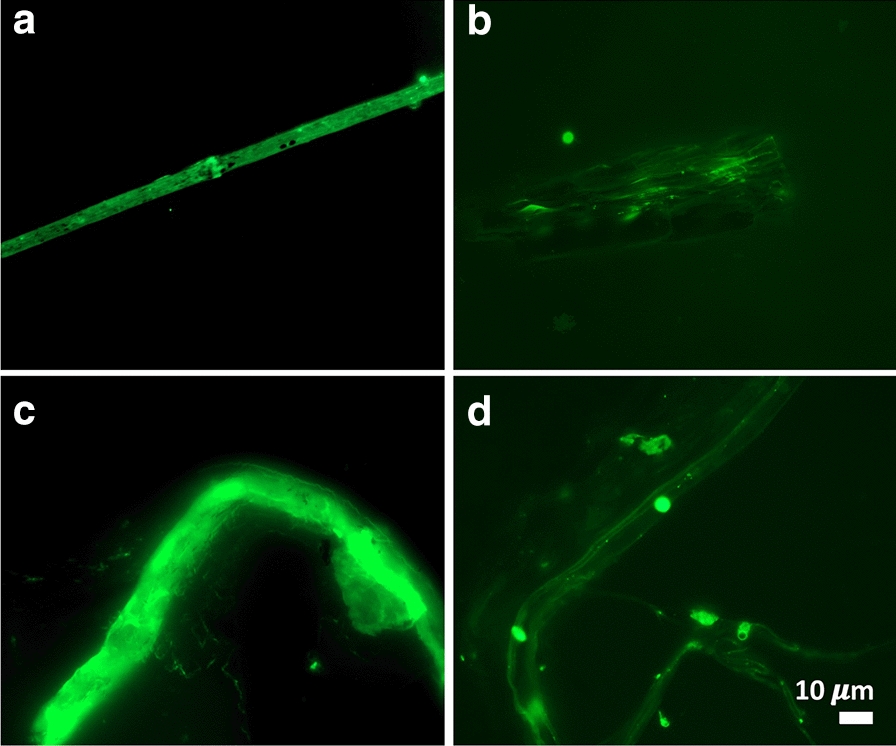
Fibrous or cellular deposits in the plasma smears from COVID-19 patients
Fig. 6.
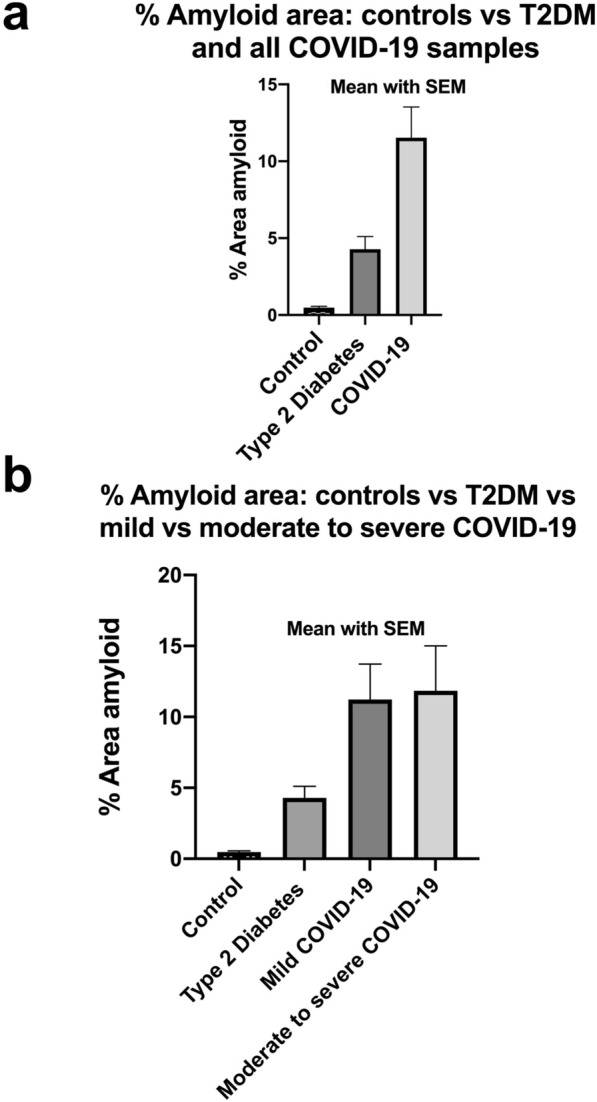
a, b Amyloid % area in platelet poor plasma smears with mean and SEM (p = < 0.0001). a All controls, Type 2 Diabetes Mellitus (T2DM) and all COVID-19 patients. b All controls vs T2DM vs 10 mild and 10 moderate to severely ill COVID-19 patients
Sensitivity and specificity
Table 1 shows the average % amyloid area for each sample, ranked from lowest to highest values, as well as the sensitivity and specificity calculations. We set the cut-off % amyloid area as 1.3% for controls, and 3.05% for T2DM (see Table 1 and raw data file in shared data link). Using these calculations, the % amyloid area sensitivity and specificity in control versus COVID-19 samples is 85% and 100% respectively, and % amyloid sensitivity and specificity in T2DM versus COVID-19 is 69% and 67%, respectively. Similarly, the % amyloid area sensitivity and specificity for controls versus T2DM is 100% and 100% respectively, suggesting that T2DM is potentially a big confounder. These results suggest that T2DM disease increase the propensity for an individual to develop COVID-19.
Table 1.
Sensitivity and specificity of % area amyloid (% amyloid was scaled for each sample type from low to high)
| Controls | T2DM | COVID-19 | Controls vs COVID-19 | |
|---|---|---|---|---|
| 0.09% | T2DM Cut-off % amyloid area set as 3.05% | True positives | 17 × COVID-19 | |
| 0.11% | True negatives | 10 × Controls | ||
| 0.18% | False positives | 0 | ||
| 0.24% | False negatives | 3 × COVID-19 | ||
| 0.36% | Sensitivity | 85% | ||
| 0.37% | Specificity | 100% | ||
| 0.43% | T2DM vs COVID-19 | |||
| 0.48% | True positives | 9 × COVID-19 | ||
| 0.80% | True negatives | 10 × T2DM | ||
| 0.81% | False positives | 5 × T2DM | ||
| 0.96% | 1.07% | False negatives | 4 × COVID-19 | |
| 1.23% | Sensitivity | 69% | ||
| Control cut-off % amyloid area set as 1.3% | 1.47% | Specificity | 67% | |
| Controls vs T2DM | ||||
| 1.86% | True positives | 10 × T2DM | ||
| 2.12% | True negatives | 10 × Controls | ||
| 2.73% | False positives | 0 | ||
| 2.84% | False negatives | 0 | ||
| 3.00% | Sensitivity | 100% | ||
| 3.35% | Specificity | 100% | ||
| 3.60% | ||||
| 3.60% | ||||
| 3.64% | ||||
| 3.87% | ||||
| 4.03% | ||||
| 4.98% | ||||
| 5.08% | ||||
| 5.28% | ||||
| 6.73% | ||||
| 9.29% | ||||
| 9.87% | ||||
| 14.39% | ||||
| 16.29% | ||||
| 18.45% | ||||
| 18.69% | ||||
| 18.91% | ||||
| 21.34% | ||||
| 21.79% | ||||
| 26.05% | ||||
| 36.39% | ||||
Discussion
Strongly bound up with the coagulopathies accompanying severe COVID-19 disease is the presence of hyperferritinaemia (in cases such as the present it is a cell damage marker [40]) and a cytokine storm, [41–45] which usually occurs in the later phase of the disease [24]. In addition, there has been reports of pulmonary vascular endothelialitis, thrombosis, and angiogenesis in Covid-19 [39]. In addition, excess iron has long been known to cause blood to clot into an anomalous form [46], later shown to be amyloid in nature [28–34]. Increased serum ferritin levels are also known to be present in T2DM [47–50]. These kinds of phenomena seem to accompany essentially every kind of inflammatory disease (e.g. [51]), but the amyloidogenic coagulopathies are normally assessed following the ex vivo addition of thrombin to samples of plasma.
Many clinical features of COVID-19 are unprecedented, and here we demonstrate yet another: the presence in PPP to which thrombin has not been added of amyloid microclots. These microclots are also an pathological feature of PPP from T2DM patients, however there is a significant increase of the microclots in COVID-19 patients. This kind of phenomenon explains at once the extensive microclotting that is such a feature of COVID-19 [11], and adds strongly to the view that its prevention via anti-clotting agents should lie at the heart of therapy. In addition, individuals with T2DM are more prone to develop microclots, due to an increased presence of circulating inflammatory biomarkers that cause hypercoagulability. T2DM patients are therefore predisposed due to their condition. When these individuals then contract SARS-CoV-2, they are already prone to hypercoagulation. This hyperocuagulable predisposition, explains why individuals with T2DM are more prone to develop severe hypercoagulability when diagnosed with COVID-19. Although fluorescence microscopy is a specialized laboratory technique, TEG® is a well-known point of care technique, which is cheap and reliable. Samples can be collected and PPP can be analysed immediately, or frozen and thawed for later analysis. All told, the relative ease of fluorescence microscopy, speed (40 min including 30 min ThT incubation time) and cheapness of the assay we describe might be of significant utility in differentiating COVID-19 from other inflammatory diseases.
Of course this must also be monitored (e.g. via Thromboelastography [52–55]) lest the disease enters its later phase in which bleeding rather than clotting is the greater danger [24]. Although not shown here, an important consideration is that TEG® can be used to study the clotting parameters of both whole blood and PPP. Whole blood TEG® gives information on the clotting potential affected by the presence of both platelets and fibrinogen, while PPP TEG® only presents evidence of the clotting potential of the plasma proteins [52–55].
Point-of-care devices and diagnostics like TEG® are also particularly useful to assess fibrinolysis. In COVID-19 patients, Wright and co-workers reported fibrinolysis shutdown, confirmed by complete failure of clot lysis at 30 min on the TEG® [56]. Thus TEG® can therefore predict thromboembolic events in patients with COVID-19 [56].
Conclusion
What we have shown here is that the clotting that is commonly seen in COVID-19 patients is in an amyloid form that forms large deposits that might be able to occlude fine capillaries. In addition, these deposits would interfere with fibrinolysis and cause the decreased ability to pass O2 into the blood that is such a feature of the disease. As T2DM is a significant comorbidity to COVID-19, exceptional care must be taken when such patients are diagnosed with COVID-19. Consequently, the prevention of coagulopathies must lie at the heart of successful therapies.
Acknowledgements
We would like to thank the patients and their families who participated in this study.
Authors’ contributions
EP: Sample analysis, edited the paper, funding, co-corresponding author; CV: Sample analysis and technical assistance; GJV and PJL: Clinicians and patient sample identification; JS: Haematopathologist: sample collection and screening: DBK: Wrote the paper, funding, co-corresponding author. All authors read and approved the final manuscript.
Funding
We thank the Medical Research Council of South Africa (MRC) (Self-Initiated Research Program: A0X331) for supporting this collaboration. DBK thanks the Novo Nordisk Foundation for funding (Grant NNF10CC1016517). The funders had no role in study design, data collection and analysis, decision to publish, or preparation of the manuscript.
Availability of data and materials
The datasets generated as well as figure micrographs analyzed during the current study are available: The raw data supporting the conclusions of this article will be made available by the authors, without undue reservation. https://1drv.ms/u/s!AgoCOmY3bkKHirZOu5YKPlq1x5f1AQ?e=xmWGKm.
Ethics approval and consent to participate
Ethical approval for blood collection and analysis of the patients with COVID-19, T2DM and healthy individuals, was given by the Health Research Ethics Committee (HREC) of Stellenbosch University (reference number: 9521). This laboratory study was carried out in strict adherence to the International Declaration of Helsinki, South African Guidelines for Good Clinical Practice and the South African Medical Research Council (SAMRC), Ethical Guidelines for research. Consent was obtained from all participant. Patients or the public WERE NOT involved in the design, or conduct, or reporting, or dissemination plans of our research.
Consent for publication
All authors approved submission of the paper.
Competing interests
The authors have no competing interests to declare.
Footnotes
Publisher's Note
Springer Nature remains neutral with regard to jurisdictional claims in published maps and institutional affiliations.
Contributor Information
Etheresia Pretorius, Email: resiap@sun.ac.za, http://www.resiapretorius.net/.
Chantelle Venter, Email: chantellev@sun.ac.za.
Gert Jacobus Laubscher, Email: laubscher911@gmail.com.
Petrus Johannes Lourens, Email: wodie22@icloud.com.
Janami Steenkamp, Email: janami.steenkamp@pathcare.com.
Douglas B. Kell, Email: dbk@liv.ac.uk, http://dbkgroup.org/
References
- 1.Wang W, Xu Y, Gao R, Lu R, Han K, Wu G, Tan W. Detection of SARS-CoV-2 in different types of clinical specimens. JAMA. 2020;323(18):1843–4. doi: 10.1001/jama.2020.3786. [DOI] [PMC free article] [PubMed] [Google Scholar]
- 2.Watson J, Whiting PF, Brush JE. Interpreting a covid-19 test result. BMJ. 2020;369:m1808. doi: 10.1136/bmj.m1808. [DOI] [PubMed] [Google Scholar]
- 3.Xiao AT, Tong YX, Gao C, Zhu L, Zhang YJ, Zhang S. Dynamic profile of RT-PCR findings from 301 COVID-19 patients in Wuhan, China: a descriptive study. J Clin Virol. 2020;127:104346. doi: 10.1016/j.jcv.2020.104346. [DOI] [PMC free article] [PubMed] [Google Scholar]
- 4.Woloshin S, Patel N, Kesselheim AS. False Negative Tests for SARS-CoV-2 infection - challenges and implications. N Engl J Med. 2020;383(6):e38. doi: 10.1056/NEJMp2015897. [DOI] [PubMed] [Google Scholar]
- 5.Wölfel R, Corman VM, Guggemos W, Seilmaier M, Zange S, Müller MA, Niemeyer D, Jones TC, Vollmar P, Rothe C, et al. Virological assessment of hospitalized patients with COVID-2019. Nature. 2020;581(7809):465–469. doi: 10.1038/s41586-020-2196-x. [DOI] [PubMed] [Google Scholar]
- 6.Jamal AJ, Mozafarihashjin M, Coomes E, Powis J, Li AX, Paterson A, Anceva-Sami S, Barati S, Crowl G, Faheem A, et al. Sensitivity of nasopharyngeal swabs and saliva for the detection of severe acute respiratory syndrome coronavirus 2 (SARS-CoV-2) Clin Infect Dis. 2020 doi: 10.1093/cid/ciaa848. [DOI] [PMC free article] [PubMed] [Google Scholar]
- 7.Xie X, Zhong Z, Zhao W, Zheng C, Wang F, Liu J. Chest CT for typical coronavirus disease 2019 (COVID-19) pneumonia: relationship to negative RT-PCR testing. Radiology. 2020;296(2):E41–E45. doi: 10.1148/radiol.2020200343. [DOI] [PMC free article] [PubMed] [Google Scholar]
- 8.Fang Y, Zhang H, Xie J, Lin M, Ying L, Pang P, Ji W. Sensitivity of Chest CT for COVID-19: Comparison to RT-PCR. Radiology. 2020;296(2):E115–E117. doi: 10.1148/radiol.2020200432. [DOI] [PMC free article] [PubMed] [Google Scholar]
- 9.Meng H, Xiong R, He R, Lin W, Hao B, Zhang L, Lu Z, Shen X, Fan T, Jiang W, et al. CT imaging and clinical course of asymptomatic cases with COVID-19 pneumonia at admission in Wuhan, China. J Infect. 2020;81(1):e33–e39. doi: 10.1016/j.jinf.2020.04.004. [DOI] [PMC free article] [PubMed] [Google Scholar]
- 10.Xu B, Xing Y, Peng J, Zheng Z, Tang W, Sun Y, Xu C, Peng F. Chest CT for detecting COVID-19: a systematic review and meta-analysis of diagnostic accuracy. Eur Radiol 2020. [DOI] [PMC free article] [PubMed]
- 11.Willyard C. Coronavirus blood-clot mystery intensifies. Nature. 2020;581(7808):250. doi: 10.1038/d41586-020-01403-8. [DOI] [PubMed] [Google Scholar]
- 12.Matacic C. Blood vessel injury may spur disease's fatal second phase. Science. 2020;368(6495):1039–1040. doi: 10.1126/science.368.6495.1039. [DOI] [PubMed] [Google Scholar]
- 13.Kander T: Coagulation disorder in COVID-19. Lancet Haematol 2020. [DOI] [PMC free article] [PubMed]
- 14.Liao D, Zhou F, Luo L, Xu M, Wang H, Xia J, Gao Y, Cai L, Wang Z, Yin P,et al. Haematological characteristics and risk factors in the classification and prognosis evaluation of COVID-19: a retrospective cohort study. Lancet Haematol 2020. [DOI] [PMC free article] [PubMed]
- 15.Teuwen LA, Geldhof V, Pasut A, Carmeliet P. COVID-19: the vasculature unleashed. Nat Rev Immunol. 2020;20(7):389–391. doi: 10.1038/s41577-020-0343-0. [DOI] [PMC free article] [PubMed] [Google Scholar]
- 16.Yuriditsky E, Horowitz JM, Merchan C, Ahuja T, Brosnahan SB, McVoy L, Berger JS: Thromboelastography Profiles of Critically Ill Patients With Coronavirus Disease 2019. Crit Care Med 2020. [DOI] [PMC free article] [PubMed]
- 17.Thachil J, Tang N, Gando S, Falanga A, Cattaneo M, Levi M, Clark C, Iba T. ISTH interim guidance on recognition and management of coagulopathy in COVID-19. J Thromb Haemost. 2020;18(5):1023–1026. doi: 10.1111/jth.14810. [DOI] [PMC free article] [PubMed] [Google Scholar]
- 18.Levi M, Thachil J, Iba T, Levy JH. Coagulation abnormalities and thrombosis in patients with COVID-19. Lancet Haematol. 2020;7(6):e438–e440. doi: 10.1016/S2352-3026(20)30145-9. [DOI] [PMC free article] [PubMed] [Google Scholar]
- 19.Iba T, Levy JH, Levi M, Thachil J: Coagulopathy in COVID-19. J Thromb Haemost. 2020. [DOI] [PMC free article] [PubMed]
- 20.Levi M, Thachil J: Coronavirus Disease 2019 Coagulopathy: Disseminated Intravascular Coagulation and Thrombotic Microangiopathy-Either, Neither, or Both. Semin Thromb Hemost 2020. [DOI] [PMC free article] [PubMed]
- 21.Iba T, Levy JH, Connors JM, Warkentin TE, Thachil J, Levi M. The unique characteristics of COVID-19 coagulopathy. Crit Care. 2020;24(1):360. doi: 10.1186/s13054-020-03077-0. [DOI] [PMC free article] [PubMed] [Google Scholar]
- 22.Al-Samkari H, Karp Leaf RS, Dzik WH, Carlson JC, Fogerty AE, Waheed A, Goodarzi K, Bendapudi P, Bornikova L, Gupta S, et al. COVID and coagulation: bleeding and thrombotic manifestations of SARS-CoV2 infection. Blood. 2020;136(4):489–500. doi: 10.1182/blood.2020006520. [DOI] [PMC free article] [PubMed] [Google Scholar]
- 23.Dorgalaleh A. Bleeding and bleeding risk in COVID-19. Semin Thromb Hemost. 2020;46(7):815–818. doi: 10.1055/s-0040-1713434. [DOI] [PMC free article] [PubMed] [Google Scholar]
- 24.Grobler C, Maphumulo SC, Grobbelaar LM, Bredenkamp J, Laubscher J, Lourens PJ, Steenkamp J, Kell DB, Pretorius E. COVID-19: The Rollercoaster of Fibrin(ogen), D-dimer, von Willebrand Factor, P-selectin and their interactions with endothelial cells, platelets and erythrocytes. Int J Mol Sci. 2020;21:5168. doi: 10.3390/ijms21145168. [DOI] [PMC free article] [PubMed] [Google Scholar]
- 25.Zhang L, Yan X, Fan Q, Liu H, Liu X, Liu Z, Zhang Z. D-dimer levels on admission to predict in-hospital mortality in patients with Covid-19. J Thromb Haemost. 2020;18(6):1324–1329. doi: 10.1111/jth.14859. [DOI] [PMC free article] [PubMed] [Google Scholar]
- 26.Bakchoul T, Hammer S, Lang P, Rosenberger P. Fibrinolysis shut down in COVID-19 patients: Report on two severe cases with potential diagnostic and clinical relevance. Thrmbosis Update. 2020;1:100008. doi: 10.1016/j.tru.2020.100008. [DOI] [PMC free article] [PubMed] [Google Scholar]
- 27.Wallace Collett L, Gluck S, Strickland RM, Reddi BJ: Evaluation of coagulation status using viscoelastic testing in intensive care patients with coronavirus disease 2019 (COVID-19): an observational point prevalence cohort study. Aust Crit Care. 2020. [DOI] [PMC free article] [PubMed]
- 28.Pretorius E, Mbotwe S, Bester J, Robinson CJ, Kell DB. Acute induction of anomalous and amyloidogenic blood clotting by molecular amplification of highly substoichiometric levels of bacterial lipopolysaccharide. J R Soc Interface. 2016;123(13):20160539. doi: 10.1098/rsif.2016.0539. [DOI] [PMC free article] [PubMed] [Google Scholar]
- 29.Pretorius E, Page MJ, Hendricks L, Nkosi NB, Benson SR, Kell DB. Both lipopolysaccharide and lipoteichoic acids potently induce anomalous fibrin amyloid formation: assessment with novel AmytrackerTM stains BioRxiv preprint. BioRxiv. 2017;1:143867. doi: 10.1098/rsif.2017.0941. [DOI] [PMC free article] [PubMed] [Google Scholar]
- 30.de Villiers S, Bester J, Kell DB, Pretorius E. Erythrocyte health and the possible role of amyloidogenic blood clotting in the evolving haemodynamics of female migraine-with-aura pathophysiology: Results from a pilot study. Front Neurol. 2019;10:1262. doi: 10.3389/fneur.2019.01262. [DOI] [PMC free article] [PubMed] [Google Scholar]
- 31.Pretorius E, Page MJ, Engelbrecht L, Ellis GC, Kell DB. Substantial fibrin amyloidogenesis in type 2 diabetes assessed using amyloid-selective fluorescent stains. Cardiovasc Diabetol. 2017;16:141. doi: 10.1186/s12933-017-0624-5. [DOI] [PMC free article] [PubMed] [Google Scholar]
- 32.Pretorius E, Bester J, Page MJ, Kell DB. The potential of LPS-binding protein to reverse amyloid formation in plasma fibrin of individuals with Alzheimer-type dementia. Front Aging Neurosci. 2018;10:257. doi: 10.3389/fnagi.2018.00257. [DOI] [PMC free article] [PubMed] [Google Scholar]
- 33.Kell DB, Pretorius E. To what extent are the terminal stages of sepsis, septic shock, SIRS, and multiple organ dysfunction syndrome actually driven by a toxic prion/amyloid form of fibrin? Semin Thromb Hemost. 2018;44:224–238. doi: 10.1055/s-0037-1604108. [DOI] [PMC free article] [PubMed] [Google Scholar]
- 34.Kell DB, Pretorius E. Proteins behaving badly. Substoichiometric molecular control and amplification of the initiation and nature of amyloid fibril formation: lessons from and for blood clotting. Progr Biophys Mol Biol. 2017;123:16–41. doi: 10.1016/j.pbiomolbio.2016.08.006. [DOI] [PubMed] [Google Scholar]
- 35.Pretorius E, Page MJ, Hendricks L, Nkosi NB, Benson SR, Kell DB. Both lipopolysaccharide and lipoteichoic acids potently induce anomalous fibrin amyloid formation: assessment with novel AmytrackerTM stains. J R Soc Interface. 2018;15(139):20170941. doi: 10.1098/rsif.2017.0941. [DOI] [PMC free article] [PubMed] [Google Scholar]
- 36.Francone M, Iafrate F, Masci GM, Coco S, Cilia F, Manganaro L, Panebianco V, Andreoli C, Colaiacomo MC, Zingaropoli MA et al: Chest CT score in COVID-19 patients: correlation with disease severity and short-term prognosis. Eur Radiol 2020 [DOI] [PMC free article] [PubMed]
- 37.Malmos KG, Blancas-Mejia LM, Weber B, Buchner J, Ramirez-Alvarado M, Naiki H, Otzen D. ThT 101: a primer on the use of thioflavin T to investigate amyloid formation. Amyloid. 2017;24(1):1–16. doi: 10.1080/13506129.2017.1304905. [DOI] [PubMed] [Google Scholar]
- 38.Goshua G, Pine AB, Meizlish ML, Chang CH, Zhang H, Bahel P, Baluha A, Bar N, Bona RD, Burns AJ, et al. Endotheliopathy in COVID-19-associated coagulopathy: evidence from a single-centre, cross-sectional study. Lancet Haematol. 2020;7(8):e575–82. doi: 10.1016/S2352-3026(20)30216-7. [DOI] [PMC free article] [PubMed] [Google Scholar]
- 39.Ackermann M, Verleden SE, Kuehnel M, Haverich A, Welte T, Laenger F, Vanstapel A, Werlein C, Stark H, Tzankov A, et al. Pulmonary vascular endothelialitis, thrombosis, and angiogenesis in covid-19. N Engl J Med. 2020;383(2):120–128. doi: 10.1056/NEJMoa2015432. [DOI] [PMC free article] [PubMed] [Google Scholar]
- 40.Kell DB, Pretorius E. Serum ferritin is an important disease marker, and is mainly a leakage product from damaged cells. Metallomics. 2014;6(4):748–773. doi: 10.1039/C3MT00347G. [DOI] [PubMed] [Google Scholar]
- 41.Chen G, Wu D, Guo W, Cao Y, Huang D, Wang H, Wang T, Zhang X, Chen H, Yu H, et al. Clinical and immunological features of severe and moderate coronavirus disease 2019. J Clin Invest. 2020;130(5):2620–2629. doi: 10.1172/JCI137244. [DOI] [PMC free article] [PubMed] [Google Scholar]
- 42.Gómez-Pastora J, Weigand M, Kim J, Wu X, Strayer J, Palmer AF, Zborowski M, Yazer M, Chalmers JJ. Hyperferritinemia in critically ill COVID-19 patients—is ferritin the product of inflammation or a pathogenic mediator? Clin Chim Acta. 2020;509:249–251. doi: 10.1016/j.cca.2020.06.033. [DOI] [PMC free article] [PubMed] [Google Scholar]
- 43.Vargas-Vargas M, Cortés-Rojo C. Ferritin levels and COVID-19. Rev Panam Salud Publica. 2020;44:e72. doi: 10.26633/RPSP.2020.72. [DOI] [PMC free article] [PubMed] [Google Scholar]
- 44.Mehta P, McAuley DF, Brown M, Sanchez E, Tattersall RS, Manson JJ, Speciality HA. COVID-19: consider cytokine storm syndromes and immunosuppression. Lancet. 2020;395(10229):1033–1034. doi: 10.1016/S0140-6736(20)30628-0. [DOI] [PMC free article] [PubMed] [Google Scholar]
- 45.Ruscitti P, Berardicurti O, Barile A, Cipriani P, Shoenfeld Y, Iagnocco A, Giacomelli R. Severe COVID-19 and related hyperferritinaemia: more than an innocent bystander? Ann Rheum Dis. 2020;79(11):1515–1516. doi: 10.1136/annrheumdis-2020-217618. [DOI] [PubMed] [Google Scholar]
- 46.Pretorius E, Vermeulen N, Bester J, Lipinski B, Kell DB. A novel method for assessing the role of iron and its functional chelation in fibrin fibril formation: the use of scanning electron microscopy. Toxicol Mech Methods. 2013;23(5):352–359. doi: 10.3109/15376516.2012.762082. [DOI] [PubMed] [Google Scholar]
- 47.Buys AV, Van Rooy MJ, Soma P, Van Papendorp D, Lipinski B, Pretorius E. Changes in red blood cell membrane structure in type 2 diabetes: a scanning electron and atomic force microscopy study. Cardiovasc Diabetol. 2013;12(1):25. doi: 10.1186/1475-2840-12-25. [DOI] [PMC free article] [PubMed] [Google Scholar]
- 48.Pretorius E. The adaptability of red blood cells. Cardiovasc Diabetol. 2013;12:63. doi: 10.1186/1475-2840-12-63. [DOI] [PMC free article] [PubMed] [Google Scholar]
- 49.Pretorius E, Bester J, Vermeulen N, Alummoottil S, Soma P, Buys AV, Kell DB. Poorly controlled type 2 diabetes is accompanied by significant morphological and ultrastructural changes in both erythrocytes and in thrombin-generated fibrin: implications for diagnostics. Cardiovasc Diabetol. 2015;14:30. doi: 10.1186/s12933-015-0192-5. [DOI] [PMC free article] [PubMed] [Google Scholar]
- 50.Pretorius E, Bester J, Vermeulen N, Lipinski B. Oxidation inhibits iron-induced blood coagulation. Curr Drug Targets. 2013;14(1):13–19. doi: 10.2174/138945013804806541. [DOI] [PMC free article] [PubMed] [Google Scholar]
- 51.Kell DB, Pretorius E. No effects without causes. The iron dysregulation and dormant microbes hypothesis for chronic, inflammatory diseases. Biol Rev. 2018;93:1518–1557. doi: 10.1111/brv.12407. [DOI] [PMC free article] [PubMed] [Google Scholar]
- 52.Nielsen VG, Audu P, Cankovic L, Lyerly RT, 3rd, Steenwyk BL, Armstead V, Powell G. Qualitative thrombelastographic detection of tissue factor in human plasma. Anesth Analg. 2007;104(1):59–64. doi: 10.1213/01.ane.0000248223.05152.a1. [DOI] [PubMed] [Google Scholar]
- 53.Nielsen VG, Kirklin JK, Hoogendoorn H, Ellis TC, Holman WL. Thrombelastographic method to quantify the contribution of factor XIII to coagulation kinetics. Blood Coag Fibrinol. 2007;18(2):145–150. doi: 10.1097/MBC.0b013e32802f7d91. [DOI] [PubMed] [Google Scholar]
- 54.Nielsen VG. Beyond cell based models of coagulation: analyses of coagulation with clot "lifespan" resistance-time relationships. Thromb Res. 2008;122(2):145–152. doi: 10.1016/j.thromres.2007.09.003. [DOI] [PubMed] [Google Scholar]
- 55.Nielsen VG. Effects of purified human fibrinogen modified with carbon monoxide and iron on coagulation in rabbits injected with Crotalus atrox venom. J Thromb Thrombolysis. 2017;44(4):481–488. doi: 10.1007/s11239-017-1549-2. [DOI] [PubMed] [Google Scholar]
- 56.Wright FL, Vogler TO, Moore EE, Moore HB, Wohlauer MV, Urban S, Nydam TL, Moore PK, McIntyre RC., Jr Fibrinolysis shutdown correlation with thromboembolic events in severe COVID-19 infection. J Am Coll Surg. 2020;231(2):193–203. doi: 10.1016/j.jamcollsurg.2020.05.007. [DOI] [PMC free article] [PubMed] [Google Scholar]
Associated Data
This section collects any data citations, data availability statements, or supplementary materials included in this article.
Data Availability Statement
The datasets generated as well as figure micrographs analyzed during the current study are available: The raw data supporting the conclusions of this article will be made available by the authors, without undue reservation. https://1drv.ms/u/s!AgoCOmY3bkKHirZOu5YKPlq1x5f1AQ?e=xmWGKm.