

Abstract
Activation and migration of regulatory T cells (Treg) into tissue is critical in control of inflammation, but has not been examined extensively in chronic graft versus host disease (cGVHD). In parallel studies of tissues and blood, we determined that FoxP3+ T cells increased in proportion to T effectors (Teff) in tissue infiltrates in oral and cutaneous lichenoid cGVHD. These FoxP3+ cells expressed distinguishing phenotypic and functional markers of Treg (CD3+, CD4+, CD27+, ICOS+ and CD39+), not found on FoxP3− Teff. Both Teff and FoxP3+ Treg expressed T-bet and the chemokine receptor CXCR3, however, consistent with a common mechanism of chemokine-mediated migration into tissue. Furthermore, functional markers (ICOS and CD39) and chemokine receptors (CXCR3) were both present in a higher proportion of FoxP3+ cells in tissues than in peripheral blood, consistent with recruitment and activation of Treg in cGVHD target tissues. Finally, the ‘activated’ CD45RA− FoxP3hi subset of Treg cells, which highly express functional markers, were found in comparable frequencies in cGVHD patients and normal controls, despite a significant deficit in naive ‘resting’ Treg. These findings are consistent with Treg capacity to upregulate functional markers and traffick into tissue in cGVHD.
INTRODUCTION
Chronic graft versus host disease (cGVHD) continues to be the main cause of non-relapse mortality and morbidity in long-term survivors of allogeneic hematopoietic stem cell transplantation.1 This failure to establish donor–host tolerance after transplantation has been linked to dysfunctional regulation of T-cell immunity.2 Deficits have been found in cGVHD patients in the frequency or overall functionality of FoxP3+ regulatory T cells (Treg), a key element in control of autoimmunity,3–6 and therapies that expand Treg populations have shown promise in ameliorating cGVHD.7 Studies evaluating Tregs in cGVHD, however, have focused primarily on the analysis of peripheral blood subsets.4,5,7 These studies may not present a complete picture. T effector (Teff) subpopulations at the tissue sites of disease activity have been selectively recruited from peripheral blood.8–12 Murine studies have similarly demonstrated that the ability of Tregs to emigrate into affected tissue sites is a critical factor for control of autoimmune inflammation and GVHD.9,13 Yet no coordinated analyses of Tregs in human blood and in tissues affected by cGVHD are available. Tissue assessments of Treg have mainly been limited to FoxP3, and need further corroboration because FoxP3 can be transiently expressed on activated T cells in vitro.14 Finally, bulk analyses of Treg functionality do not address recent findings defining the critical functional subpopulations of Treg—resting (naive) and activated Treg—and distinguishing them from nonsuppressive FoxP3+ subpopulations in normal individuals, in systemic autoimmunity and in acute GVHD.15–17 Analysis of the relative ratios of these subsets in cGVHD patients may better reflect the capacity of Treg to control immune dysfunction.
In this study we performed a detailed quantitative and qualitative analysis of Treg in cGVHD-affected tissues in a well-characterized cohort of cGVHD patients. We assessed the frequency of FoxP3+ cells relative to total CD3+ and the ratio of FoxP3+ to CD8+ T cells. Using multiparameter staining on biopsies from oral and cutaneous lichenoid infiltrates, we colocalized FoxP3+ staining with markers that distinguish Treg cells from activated effectors, which are associated with Treg functionality, and that control Treg recruitment to inflammatory sites. We then compared Treg expression of these markers in tissues and in the blood in the 10 patients with severe lichenoid oral and cutaneous cGVHD and 10 patients with severe sclerotic cutaneous cGVHD. Finally, we assessed the frequencies of resting (naive), activated and ‘nonsuppressive’ subsets of Treg in the blood of these lichenoid and sclerotic cGVHD patients, bolstered by comparative subset analysis of a larger cohort of 47 additional cGVHD patients and 29 normal controls.
MATERIALS AND METHODS
Patient population
Patients enrolled in a natural history study of chronic GVHD (clinicaltrials.gov #NCT00092235) underwent comprehensive evaluation including detailed history, clinical examination, laboratory tests and collection of research samples. Demographics and evaluations of oral and cutaneous cGVHD in 35 patients included in the immunohistochemical analyses are summarized in Table 1. Following evaluation of oral cGVHD by an oral medicine specialist (MMI), biopsies were collected from patients with mild or severe oral cGVHD or with no oral symptoms. Cutaneous cGVHD was evaluated by an experienced dermatologist (EWC) according to NIH consensus criteria; biopsies were collected from patients with lichen planus-like (epidermal) cGVHD findings, cGVHD-associated dermal and fascial sclerosis, and patients without clinical skin involvement. In addition, uninvolved areas in patients with cutaneous cGVHD (lichen planus-like or sclerotic) were also biopsied for comparison. Treg populations in cryopreserved leukocytes from 10 of these severe lichenoid oral or cutaneous cGVHD patients were extensively characterized by multiparameter flow cytometry (Table 1). A broader cross-section of 47 cGVHD patients had been assessed for Treg populations on entry to the natural history trial between 2005 and 2008; demographics of these patients are summarized in Table 2. The study was approved by the Institutional Review Board of the National Cancer Institute, and informed consent was obtained from all participants.
Table 1.
CGVHD characteristics of patients in a immunohistochemistry study
| Patient | Age | Months post HSCT | Months post cGVHD diagnosis | Systemic immune suppression at the time of evaluationa | NIH global cGVHD severity scoreb | Number of organ systems affected | Oral cGVHDc,d | Skind,e | PBMC Tregf | Total % BSAg erythema | Total % BSAg sclerosis |
|---|---|---|---|---|---|---|---|---|---|---|---|
| 1 | 53 | 13 | 7 | GC, TL, MMF, ECP | Severe | 4 | Severe | Lichenoid | FACS | 30 | 0 |
| 2 | 50 | 9 | 2 | GC, CSA | Moderate | 4 | Severe | Lichenoid | FACS | 21 | 0 |
| 3 | 47 | 6 | 2 | GC | Moderate | 3 | Severe | Lichenoid | FACS | 5 | 0 |
| 4 | 22 | 9 | 3 | GC, TL, MMF | Moderate | 4 | Severe | (Lichenoid) | FACS | 26 | 0 |
| 5 | 57 | 46 | 33 | GC, TL, MMF, ECP | Severe | 5 | Severe | (Sclerotic) | FACS | 0 | 51 |
| 6 | 40 | 55 | 24 | GC, MMF, SL, R | Severe | 4 | Severe | Sclerotic | 8 | 49 | |
| 7 | 56 | 28 | 10 | GC, TL, MMF | Moderate | 4 | Severe | Lichenoid | 18 | 0 | |
| 8 | 51 | 64 | 61 | GC, CSA, MMF | Severe | 6 | Severe | (Lichenoid) | 3 | 0 | |
| 9 | 45 | 6 | 3 | CSA | Moderate | 6 | (Severe) | Lichenoid | FACS | 1 | 0 |
| 10 | 58 | 5 | 3 | Noneh | Moderate | 2 | Severe | Lichenoid | FACS | 0 | 0 |
| 11 | 41 | 147 | 135 | Noneh | Severe | 5 | Mild | Sclerotic | 0 | 30 | |
| 12 | 44 | 33 | 28 | CSA, MMF | Moderate | 3 | Mild | None | 0 | 0 | |
| 13 | 39 | 58 | 56 | GC, TL, HCQ | Severe | 5 | Mild | Sclerotic | FACS | 5 | 70 |
| 14 | 44 | 205 | 198 | MMF, CSA, ECP | Severe | 7 | Mild | Sclerotic | 0 | 30 | |
| 15 | 42 | 100 | 92 | GC | Moderate | 3 | Mild | (None) | 0 | 0 | |
| 16 | 59 | 22 | 13 | GC, TL | Severe | 4 | Mild | Sclerotic | FACS | 0 | 20 |
| 17 | 36 | 41 | 35 | MMF | Moderate | 5 | Mild | (None) | 0 | 1 | |
| 18 | 36 | 29 | 19 | Noneh | Moderate | 4 | Mild | (None) | 0 | 0 | |
| 19 | 53 | 159 | 147 | GC, CSA | Severe | 3 | Mild | (None) | 0 | 0 | |
| 20 | 55 | 5 | 3 | GC, CSA | Moderate | 6 | Mild | Lichenoid | FACS | 41 | 0 |
| 21 | 39 | 55 | 43 | TL, MMF, ECP | Severe | 6 | Mild | Sclerotic | 1 | 45 | |
| 22 | 52 | 12 | 8 | CSA | Moderate | 6 | Mild | Lichenoid | 6 | 0 | |
| 23 | 58 | 29 | 23 | Noneh | Severe | 3 | Mild | (None) | 0 | 0 | |
| 24 | 45 | 27 | 20 | GC | Severe | 5 | Mild | Sclerotic | FACS | 2 | 64 |
| 25 | 60 | 43 | 25 | GC, TL, MMF | Moderate | 6 | Mild | (Sclerotic) | 0 | 5 | |
| 26 | 56 | 27 | 0 | Noneh | Moderate | 3 | None | Sclerotic | 0 | 29 | |
| 27 | 61 | 39 | 35 | Noneh | Mild | 2 | None | None | 0 | 0 | |
| 28 | 39 | 59 | 34 | TL, MMF | Severe | 6 | None | (None) | 0 | 0 | |
| 29 | 41 | 12 | 0 | GC, MMF, CSA | Mild | 2 | None | None | 0 | 0 | |
| 30 | 49 | 28 | 15 | Noneh | Moderate | 3 | None | None | 0 | 0 | |
| 31 | 40 | 22 | 16 | GC, CSA | Severe | 6 | None | Lichenoid | 7 | 0 | |
| 32 | 62 | 11 | 6 | Noneh | Moderate | 5 | (None) | Lichenoid | FACS | 10 | 0 |
| 33 | 58 | 3 | 6 | MMF | Moderate | 4 | (Mild) | Lichenoid | FACS | 5 | 0 |
| 34 | 58 | 53 | 49 | GC, MMF, ECP | Severe | 2 | (Mild) | Sclerotic | FACS | 0 | 78 |
| 35 | 51 | 22 | 15 | TL, GC | Severe | 3 | (None) | Sclerotic | FACS | 0 | 62 |
| 36 | 42 | 48 | 44 | TL, Imatinib | Severe | 5 | (Mild) | (Sclerotic) | FACS | 1 | 81 |
| 37 | 59 | 24 | 9 | ECP, GC | Severe | 5 | (None) | (Sclerotic) | FACS | 2 | 74 |
| 38 | 34 | 13 | 9 | TL, GC, Imatinib | Severe | 7 | (Mild) | (Sclerotic) | FACS | 0 | 62 |
| 39 | 36 | 40 | 6 | TL, MMF, ECP | Severe | 5 | (Mild) | (Sclerotic) | FACS | 1 | 68 |
| 40 | 24 | 41 | 21 | TL, Imatinib | Severe | 4 | (None) | (Sclerotic) | FACS | 5 | 62 |
Abbreviations: BSA, body surface area; cGVHD, chronic graft versus host disease; CSA, cyclosporine A; ECP, extracorporeal photopheresis; GC, prednisone or other glucocorticoid; HSCT, hematopoietic stem cell transplantation; MMF, mycophenolate mofetil; PBMC, peripheral blood mononuclear cell; R, rituximab; SL, sirolimus; TL, tacrolimus.
Current systemic immunosuppression regimen.
NIH score: Mild—only one or two organs (excluding lungs) with a maximum NIH score of 1 in all organs; Moderate—at least one organ with a score of 2 or lungs with a score of 1, or three or more organs with a max score of 1; Severe—lung score of 2 or any other organ system scoring 3.
Oral cGVHD was evaluated and graded by an oral medicine specialist using the following severity scoring system: normal mucosa, none; hyperkeratotic, lichenoid changes and/or erythema, mild; lichenoid changes and presence of ulcerations, severe.
All patients were evaluated clinically and biopsies were reviewed for GVHD pathology, but biopsies that were not further examined by IHC for FoxP3 are listed in parentheses.
Cutaneous cGVHD was evaluated and graded by an experienced dermatologist as having no evidence of cutaneous cGVHD (None), involving primarily lichen planus-like epidermal changes (Lichenoid) or involving primarily dermal or fascial sclerotic changes (Sclerotic).
Patients with severe lichenoid oral or cutaneous cGVHD (or both) whose cryopreserved PBMC were examined for FoxP3+ Treg subpopulations are noted as FACS.
The percentages of the BSA affected by cutaneous cGVHD are noted.
Three of the eight not currently on therapy had received no prior systemic treatment, but only patient 26 was newly diagnosed with cGVHD.
Table 2.
CGVHD patient demographics
| Patient demographicsa | Median (range) | Number of patients (%) |
|---|---|---|
| Age | 45 (18–67) | |
| Gender | ||
| Male | 23 (49%) | |
| Female | 24 (51%) | |
| Months from transplant | 40 (6–170) | |
| Duration of cGVHD (months) | 25 (1–161) | |
| Donor source | ||
| Related | 29 (62%) | |
| Unrelated | 18 (38%) | |
| Cell source | ||
| Bone marrow | 13 (27%) | |
| Peripheral blood | 34 (72%) | |
| Acute GVHD | 31 (66%) | |
| CGVHD onset | ||
| Progressive | 19 (40%) | |
| Quiescent | 12 (26%) | |
| de novo | 16 (34%) | |
| Global NIH scoreb | ||
| Mild | 1 (2%) | |
| Moderate | 16 (34%) | |
| Severe | 30 (63%) | |
| Number of organs involved | 5 (1–8) | |
| Eyes | 42 (89%) | |
| Genital tract (female) | 13 (28%) | |
| GI tract | 24 (51%) | |
| Joint fascia | 28 (60%) | |
| Liver | 21 (45%) | |
| Lungs | 30 (64%) | |
| Mouth | 34 (72%) | |
| Skinc | 39 (83%) | |
| Erythema (% BSA) | (0.45–80) | 30 (65%) |
| Dermal sclerosis (% BSA) | (0.18–62.1) | 25 (53%) |
| Deep sclerosis (% BSA) | (0.45–66.6) | 22 (47%) |
| Total NIH score | 7 (2–13) | |
| Systemic immunosuppressiond | ||
| None | 8 (17%) | |
| Mild | 3 (6%) | |
| Moderate | 14 (30%) | |
| High | 22 (47%) | |
| Number of prior systemic regimens | 3 (0–8) |
Abbreviations: BSA, body surface area; cGVHD, chronic graft versus host disease; GI, gastrointestinal.
These patients constitute a series of patients whose Treg subpopulations were assessed in comparison with normal controls on day of entry into the protocol. Any patients in Table 1 have been excluded.
cGVHD severity was characterized as mild (only one or two organs (except lung) affected, with a maximum score of 1 in any organs), moderate (lungs with a maximum score of 1, at least one organ with a score of 2, or three or more organs with a maximum score of 1) or severe (a score of 3 in any organ, or a lung score of 2 or 3).
These categories are not mutually exclusive. Some patients were scored as having areas of erythema, as well as dermal and/or deep sclerosis.
Immunosuppression categories: none, mild (single-agent prednisone <0.5mg/kg per day), moderate (prednisone ⩾0.5 mg/kg per day and/or any single agent per modality), high (two or more agents per modalities±prednisone ⩾0.5 mg/kg per day).
Immunofluorescent staining
Five μm sections were prepared from formalin-fixed paraffin-embedded samples. Following deparaffinization and rehydration, high-temperature antigen retrieval was performed in 0.01 M (pH 8.0) EDTA or Tris-EDTA (pH 9.0) solutions in a pressure cooker. Following blocking with 10% normal serum from the secondary antibody species, the primary antibodies (listed in Supplementary Table S1) were applied and incubated for 2 h at room temperature or overnight at 4 °C. AlexaFluor 488-, 555-, 568-, 594-, 633- and 647-labeled donkey and goat secondary antibodies (Invitrogen, Carlsbad, CA, USA) were used for detection. Mounting medium with DAPI (Vector, Burlingame, CA, USA) for nuclear counterstaining was applied.
Confocal laser scanning microscopy and image analysis
Images were acquired on a Leica SP2 confocal system (Leica Microsystems, Bannockburn, IL, USA) equipped with acousto-optical beam splitter and a Leica DM RE-7 upright microscope using a ×40 objective, numerical aperture 1.25. To get an estimate of cell populations in each section, five adjacent non-overlapping images were obtained centering on the basement membrane region. Immune cell populations expressing markers of interest were then quantified visually, using Photoshop CS (Adobe, San Jose, CA, USA).
Flow cytometry of peripheral blood mononuclear cells
Cryopreserved peripheral blood mononuclear cells collected concurrent with the cGVHD tissue biopsies were stained for surface markers, fixed and permeabilized (FoxP3 Fixation and Permeabilization Kit, eBioscience, San Diego, CA, USA) and stained for intracellular proteins. Antibodies are listed on Supplementary Table S2. Cells were analyzed on a Gallios three-laser ten-parameter flow cytometer (Beckman Coulter, Miami, FL, USA) and analyzed using Kaluza 1.2 (Beckman Coulter) and FlowJo 9.6 (Treestar, Ashland, OR, USA) software. Percentage expression was determined relative to full panel-minus-one isotype control tubes for each Treg subset parameter. Analysis of Treg subsets within CD3+ CD4+ T cells was based on gating on ‘resting’ fraction I (FI: CD45RA+ FoxP3lo), ‘activated’ fraction II (FII: CD45RA− FoxP3hi) and ‘nonsuppressive’ fraction III (FIII: CD45RA− FoxP3lo) and using the intensity of FoxP3 in FI to define the division of FII and FIII as previously described.15
Statistical methods
Differences between groups and correlations were assessed using the non-parametric Mann–Whitney and Spearman tests, respectively. P-values <0.05 were considered significant. All calculations were performed on MedCalc version 9.3.0.0 statistical software (Mariakerke, Belgium) or Prism 6.0 (GraphPad Software, La Jolla, CA, USA).
RESULTS
FoxP3+ T cells infiltrate cGVHD target tissues in proportion with other T cells
To assess the number of Treg infiltrating affected tissues in cGVHD, we examined paraffin-embedded biopsies of oral mucosa and skin collected as part of the NIH natural history study of cGVHD (Table 1). Using immunofluorescent labeling for CD3, CD8 and FoxP3, we calculated the average number of FoxP3+ cells per high-powered field in oral mucosa biopsied from 30 patients and in skin biopsies collected from 25 patients (including 20 patients biopsied in both sites). We consistently found that the number of FoxP3+ cells was markedly increased in oral mucosa in patients with oral cGVHD, as compared with oral mucosa from cGVHD patients without oral involvement (Figures 1a–f; Figure 2a, Mann–Whitney test on all cGVHD P = 0.04, as tested on severe cGVHD only (black circles) P = 0.006). FoxP3+ nuclear staining was evident (Figure 1d) in cells located throughout the subepidermal inflammatory infiltrate; this infiltrate was absent in cGVHD patients lacking oral mucosal involvement (Figure 1e). FoxP3+ cells were similarly increased in biopsies collected from areas of affected skin of patients with cutaneous lichenoid cGVHD (Figures 1g–l; Figure 2b, black circles), as compared with FoxP3+ levels in uninvolved skin biopsies collected from the same patients (open circles), or biopsies from cGVHD patients lacking cutaneous involvement (Figure 2b, black triangles). In contrast, FoxP3+ cells were not significantly increased in biopsies of affected or unaffected skin from patients with sclerotic cGVHD (Figure 2b, black and open squares). Furthermore, in multiparameter labeling studies, all FoxP3+ cells co-expressed CD3+ (Figure 1l), but not CD8 (Figures 1g–l).
Figure 1.
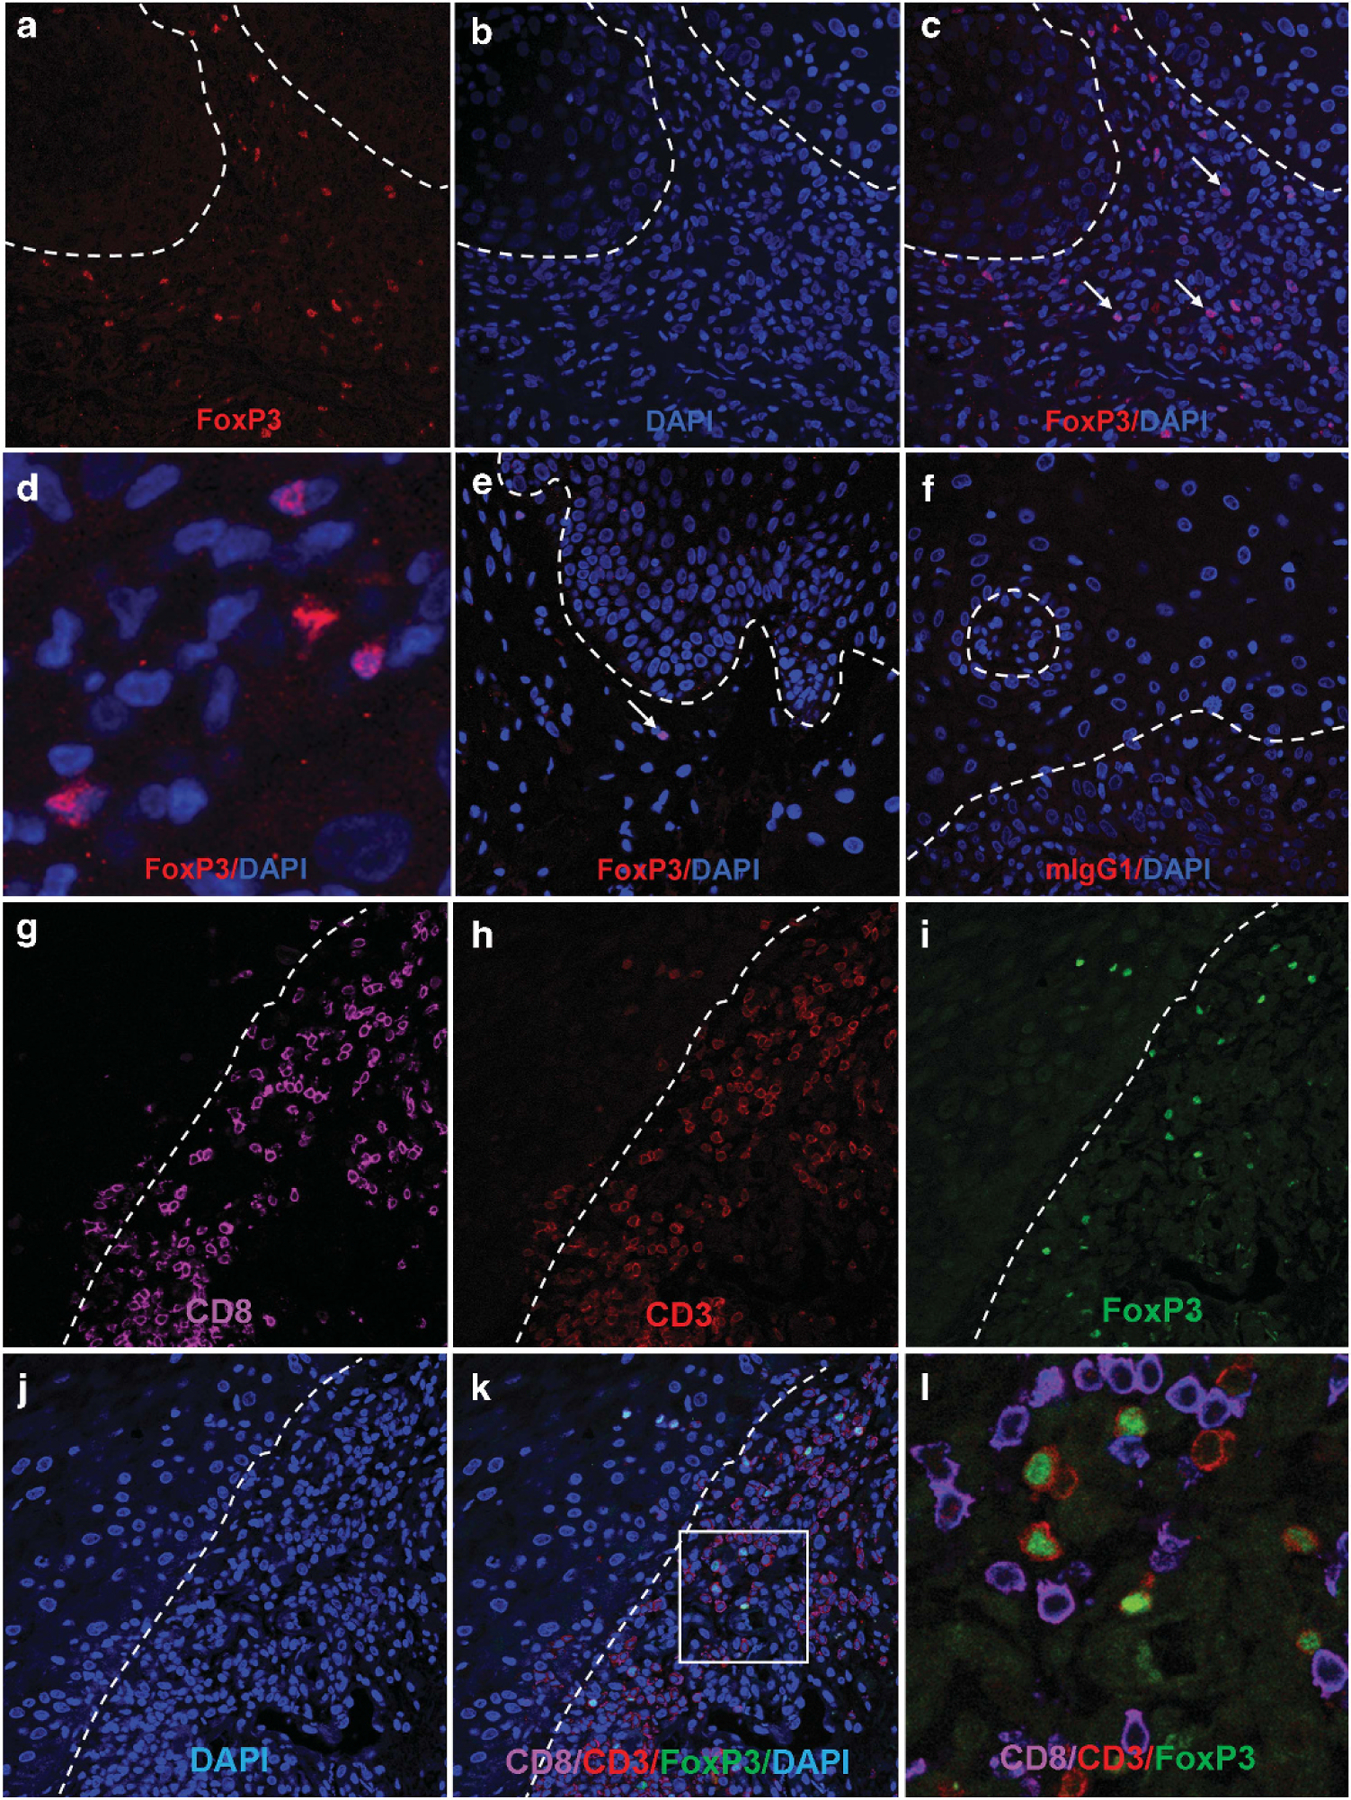
Presence of FoxP3+ T cells in lichenoid oral and cutaneous cGVHD tissues. (a–d) Representative images from a patient with severe oral cGVHD showing high numbers of FoxP3+ cells in subepithelial distribution (indicated by arrows in (c)). (d) Close-up view demonstrating that FoxP3 staining is limited to nuclei, colocalizing with DAPI. (e) Fewer infiltrating cells and smaller numbers of FoxP3 cells were observed in patients with mild cGVHD. (f) Isotype control. Broken line indicates approximate position of basement membrane. (g–l) Representative images of lichenoid cutaneous cGVHD as stained with (g) CD8, (h) CD3, (i) FoxP3, (j) DAPI, (k) overlay, (l) close-up view of marked square in (k), without DAPI. FoxP3 expression (green nuclear signal) was only observed in CD3+ CD8− (that is, CD4) T cells.
Figure 2.
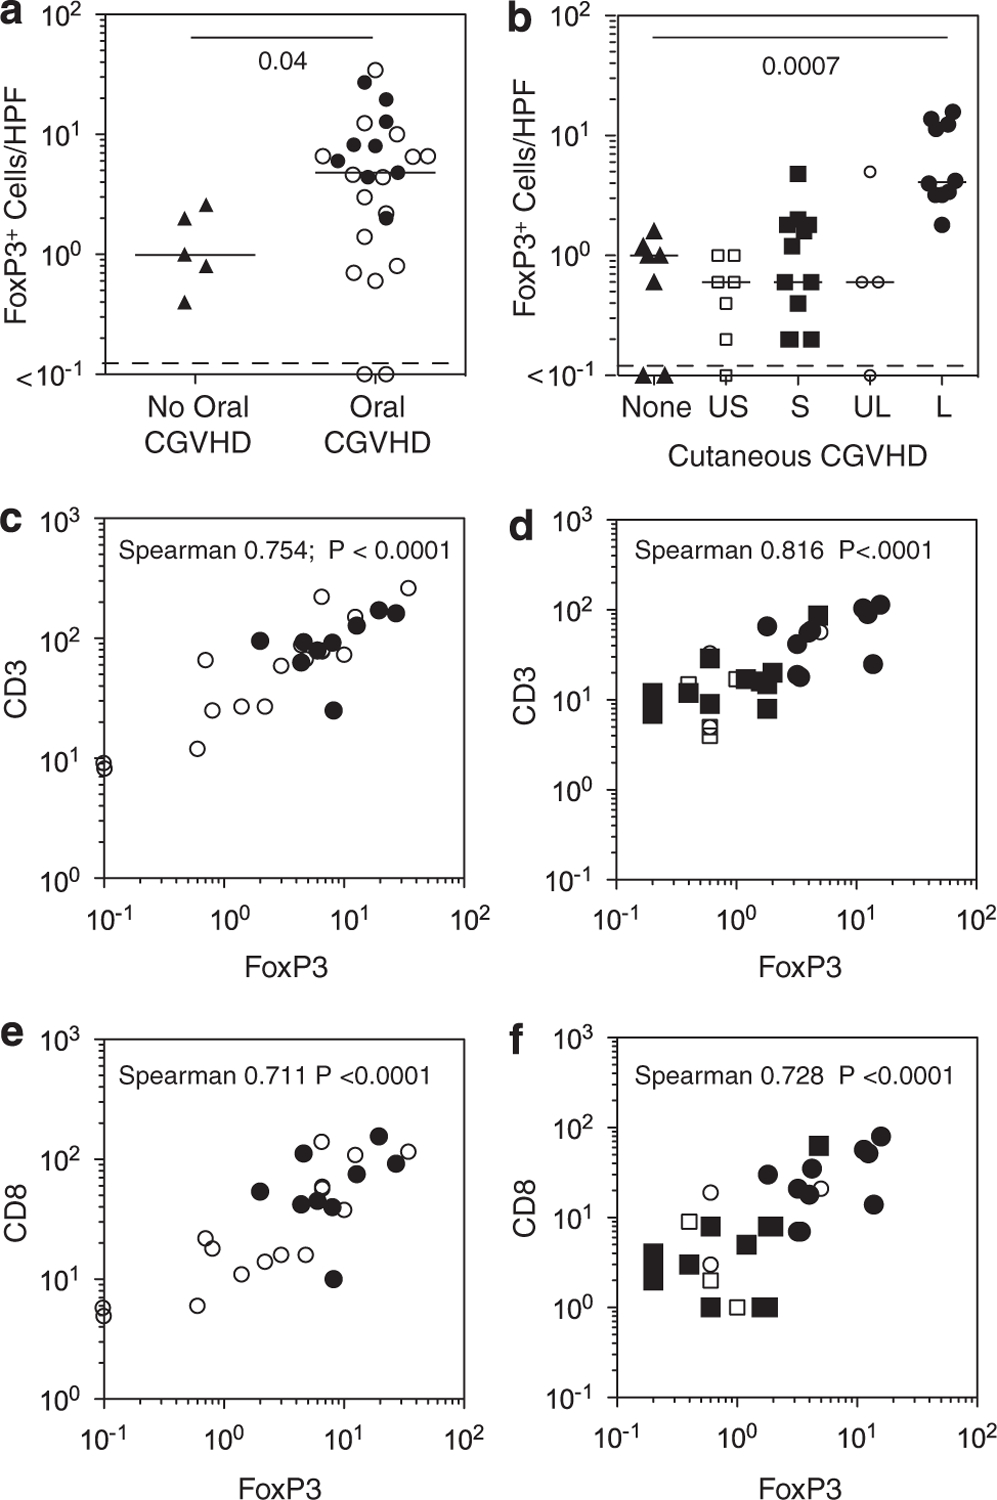
Numbers of FoxP3+ T cells in relationship to other T-cell subsets. (a, b) Mean numbers of FoxP3+ cells averaged over five high-powered fields (HPF) in patients with cGVHD affecting (a) oral mucosa or (b) skin. Bars denote the median values of the set of biopsies examined. In oral mucosa, FoxP3+ cell frequencies in buccal mucosal biopsies from patients with mild (open circles) and severe (black circles) oral cGVHD are compared with those from cGVHD patients with no oral involvement (black triangles). In the skin, FoxP3+ cell frequencies are shown for skin biopsies from patients with no cutaneous cGVHD (none, black triangle), cutaneous sclerotic cGVHD (S, black square) and cutaneous lichenoid cGVHD (L, black circle), as well as uninvolved skin biopsies from sclerotic (US, open square) and lichenoid (UL, open circle) cGVHD patients. (c, d) Correlated increases in FoxP3+ and total CD3+ T cells in patients with cGVHD affecting oral mucosa or skin. Same symbols as in (a, b). (e, f) Correlated increases in FoxP3+ and total CD8+ T cells in patients with cGVHD affecting oral mucosa or skin. L, lichenoid skin biopsy; none, control (cGVHD patients with no clinical skin involvement); S, sclerotic skin biopsy; UL, uninvolved skin in lichenoid cGVHD patient; US, uninvolved skin in sclerotic cGVHD patients.
It has been previously reported that the ratio of FoxP3+ cells to infiltrating CD8 effector cells was lower in GVHD than in non-GVHD biopsies of intestinal mucosa after allogeneic transplantation.18 We therefore examined the numbers of FoxP3+ cells in relation to other infiltrating T-cell populations. Despite the broad range of CD3+ T-cell numbers observed in oral mucosa, or in sclerotic and lichenoid cutaneous cGVHD, FoxP3+ cell numbers increased in direct proportion to total CD3+ cells (Figures 2c and d). Furthermore, the level of CD8+ T cells and FoxP3+ cells was correlated in both tissues (Figures 2e and f). Across the range from sclerotic cGVHD tissues with few infiltrating CD8 T cells to the lichenoid biopsies with the greatest numbers of CD8 cells, no significant skewing was found in the FoxP3/CD8 ratio. Supporting this finding of a consistent FoxP3/CD8 ratio, the slope of a linear regression drawn between CD8 numbers and the ratio of FoxP3/CD8 (both log transformed) was not significantly different from zero in either oral mucosa or skin; that is, the ratio was not altered, as the number of CD8 cells in the infiltrate increased.
Foxp3+ T cells in lichenoid cGVHD tissues express distinctive Treg phenotypic markers
We next sought to confirm that the FoxP3+ cells in tissues affected by cGVHD were Treg, focusing on skin biopsies from sites of severe lichenoid cutaneous cGVHD, which contain abundant FoxP3+ and total T-cell infiltrates. Although both CD4+ and CD8+ T cells may transiently express low levels of FoxP3 on in vitro stimulation,14 FoxP3+ in cGVHD tissues was not found on CD8+ cells (Figure 1l). Furthermore, Ki-67—a marker of activated proliferating cells—was expressed on only a small population of FoxP3+ T cells (Figures 3a–c), at a frequency similar to the overall T-cell proliferative rate (median 7%, range 0–23% versus median 5%, range 0–26%). This finding is consistent with the observation that FoxP3+ and FoxP3− cells proliferate at similar rates in inflammatory sites in tissue.19
Figure 3.
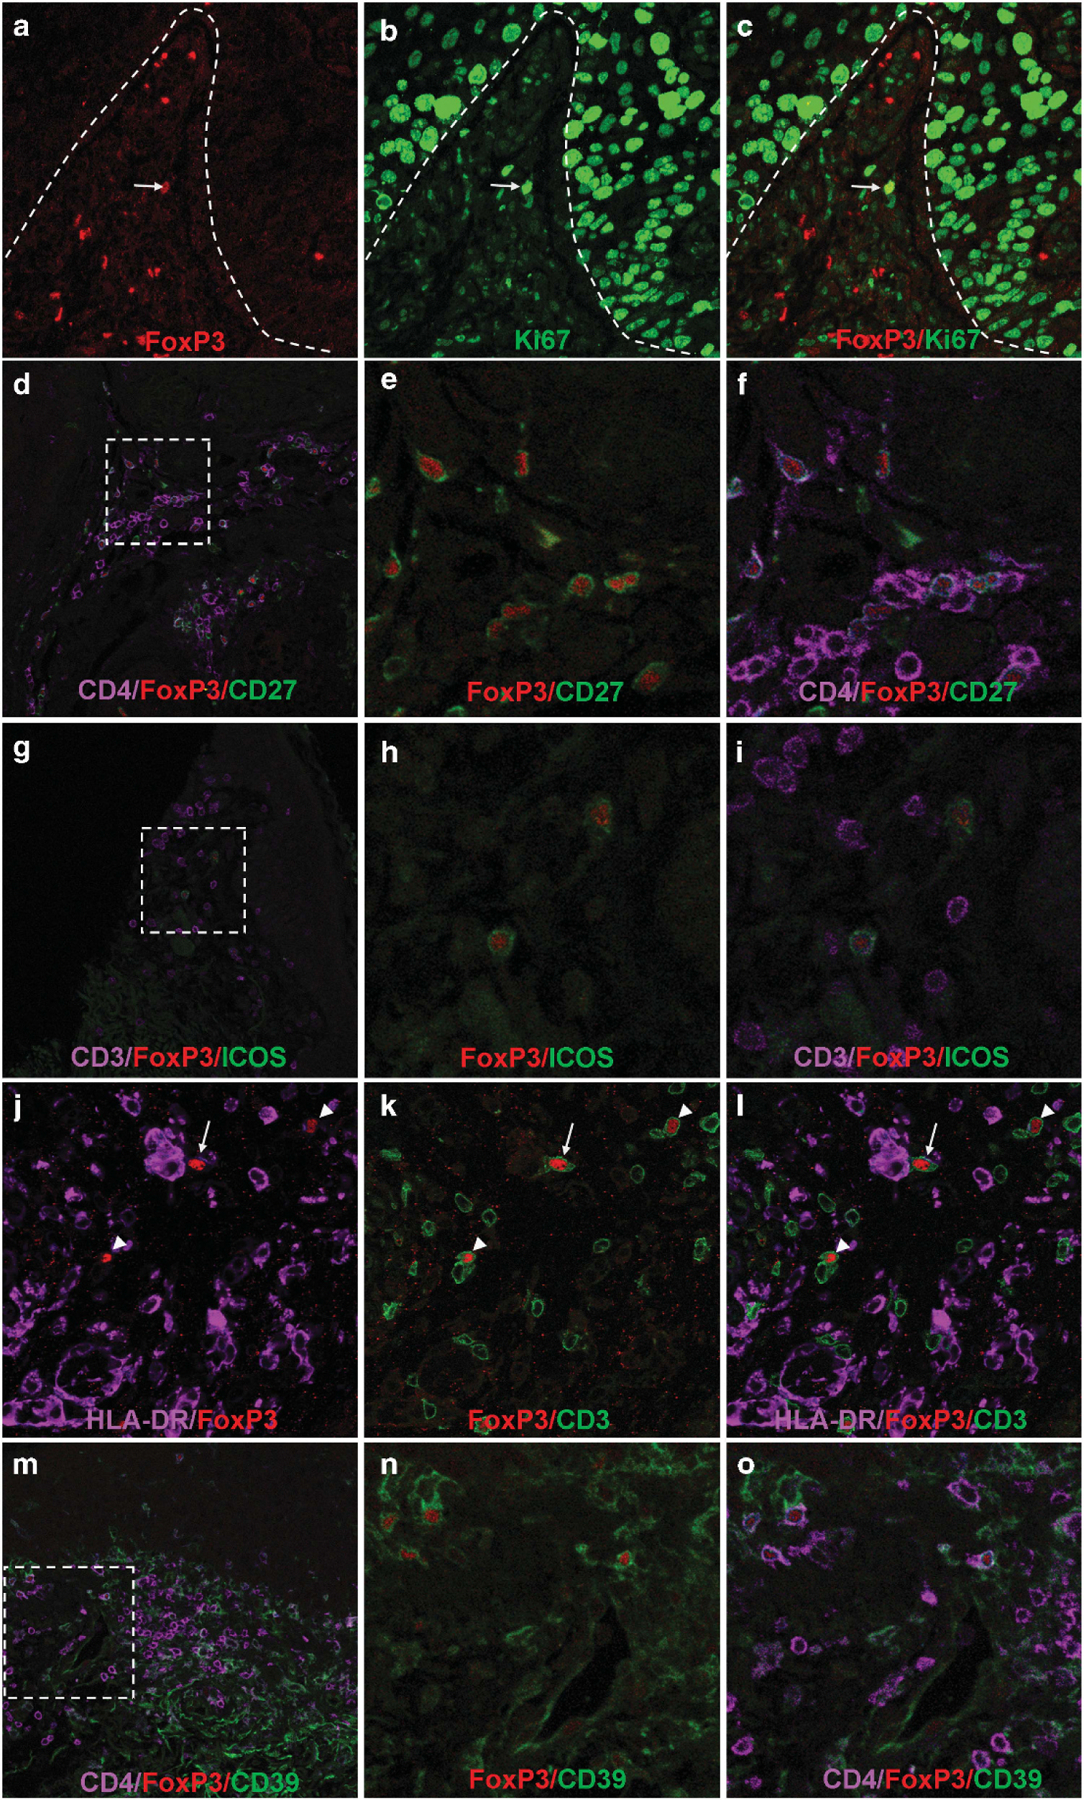
Characterization of FoxP3+ T cells in cGVHD. (a–c) Biopsy from skin affected with lichenoid cutaneous cGVHD, showing labeling with FoxP3 (red), Ki-67 (green) and image overlay. FoxP3+ T cells in oral mucosa proliferate at the rates similar to overall T-cell proliferation. Note proliferating FoxP3+ in the middle of the field (arrow). The majority of FoxP3+ T cells are not in cycle. Broken line indicates demarcation of dermis from highly proliferative epithelial mucosal keratinocytes above. Many basal keratinocytes are in cycle in oral mucosa (large Ki-67+ nuclei). Results are typical of seven patient biopsies examined. (d–f) Lichenoid cutaneous cGVHD biopsy stained for FoxP3 (red), CD27 (green) and CD4 (lavender). (e, f) close-up views of the broken line square in (d). FoxP3+ T cells (red nuclear signal) express CD27 (green) in cGVHD whereas non-FoxP3+ (effector) CD4+ T cells (lavender) do not. Results typical for six patient biopsies examined. (g–i) Lichenoid cutaneous cGVHD biopsy stained for FoxP3 (red), ICOS (green) and CD3 (lavender). FoxP3+ T cells but not FoxP3− T cells co-express ICOS. Results typical of five patients examined showing ICOS expression. (j–l) Lichenoid cutaneous cGVHD biopsy stained for FoxP3 (red), ICOS (green) and HLA-DR (lavender). Infiltrating FoxP3+ T cells did not express detectable levels of HLA-DR but were observed in contacts with DR+ cells (dendritic cells and macrophages, arrow) and with FoxP3- T cells (arrowheads). (m–o) Lichenoid cutaneous cGVHD biopsy stained for FoxP3 (red), CD39 (green) and CD4 (lavender). (n, o) close-up views of the broken line square in (m). FoxP3+ cells co-expressed both CD4 and CD39, an ectonucleotidase. Results typical of five patients examined.
CD27 and CD28 are costimulatory molecules, whose expression is lost during activation and differentiation of human Teff cells, but remain present on Treg in blood and inflammatory sites.19–21 In cGVHD tissues, CD27 was consistently expressed on FoxP3+ CD4 T cells, but was not found on FoxP3− CD4+ T cells (Figures 3d–f).
Tregs have been reported to employ a variety of methods to control immune-mediated inflammation, including production of immunosuppressive cytokines (interleukin (IL)-10 and transforming growth factor beta) and contact-dependent inhibition. IL-10 in particular has been found to be critical for control of autoimmune inflammation in the skin and the mucosal surfaces.22 We used ICOS (inducible T-cell co-stimulator, CD278) as a surrogate marker of IL-10 production; ICOS-expressing FoxP3+ cells have been shown to suppress through both IL-10- and transforming growth factor beta-dependent mechanisms, whereas ICOS− Tregs relied primarily on transforming growth factor beta for suppression.23 We observed patient-to-patient variation in ICOS expression in FoxP3+ T cells in cGVHD tissues. In some patients, FoxP3+ cells were uniformly ICOS+ (Figures 3g–i), whereas ICOS+ FoxP3+ T cells were not observed in others. Notably, when present, ICOS was expressed solely on FoxP3+ T cells and not expressed in FoxP3− T cells, providing further support for identifying FoxP3+ T cells as Treg cells rather than activated conventional T cells (Figures 3g–i).
Contact-mediated suppression has been a well-established mechanism of Treg function. In vivo imaging of murine models of type I diabetes demonstrated the importance of contact of Tregs with conventional T cells and with dendritic cells.24,25 In our study, we demonstrated FoxP3+ T cells in contact both with large HLA-DR+ CD3− cells (presumably dendritic cells and macrophages) and with FoxP3− CD3+ T cells (Figures 3j–l). ATP hydrolysis via CD39 and CD73 ectonucleotidases is a major contact-dependent mechanism employed by Tregs. CD39 is more frequently expressed on human Tregs as compared with conventional CD4+ T cells.19,21,26 In our cohort, CD39 expression was observed on most CD4+ FoxP3+ cells but few CD4+ FoxP3− cells (Figures 3m–o).
FoxP3+ T cells express CXCR3 and T-bet
Chemokine receptors are critical for directed migration of infiltrating cells into target tissues. We have previously reported CXCR3 expression on the majority of infiltrating T cells in oral cGVHD.10 Similarly, CXCR3 expression has been reported on infiltrating T cells in skin and conjunctiva in cGVHD patients.11,12 CXCR3 has also been shown to be important for Treg migration into inflamed tissues, including skin and liver,13,27 which are commonly affected by cGVHD. In this study, we found that CXCR3 was expressed on the FoxP3+ cells in the infiltrates, as well as on adjacent FoxP3− T cells. (Figures 4a–c).
Figure 4.
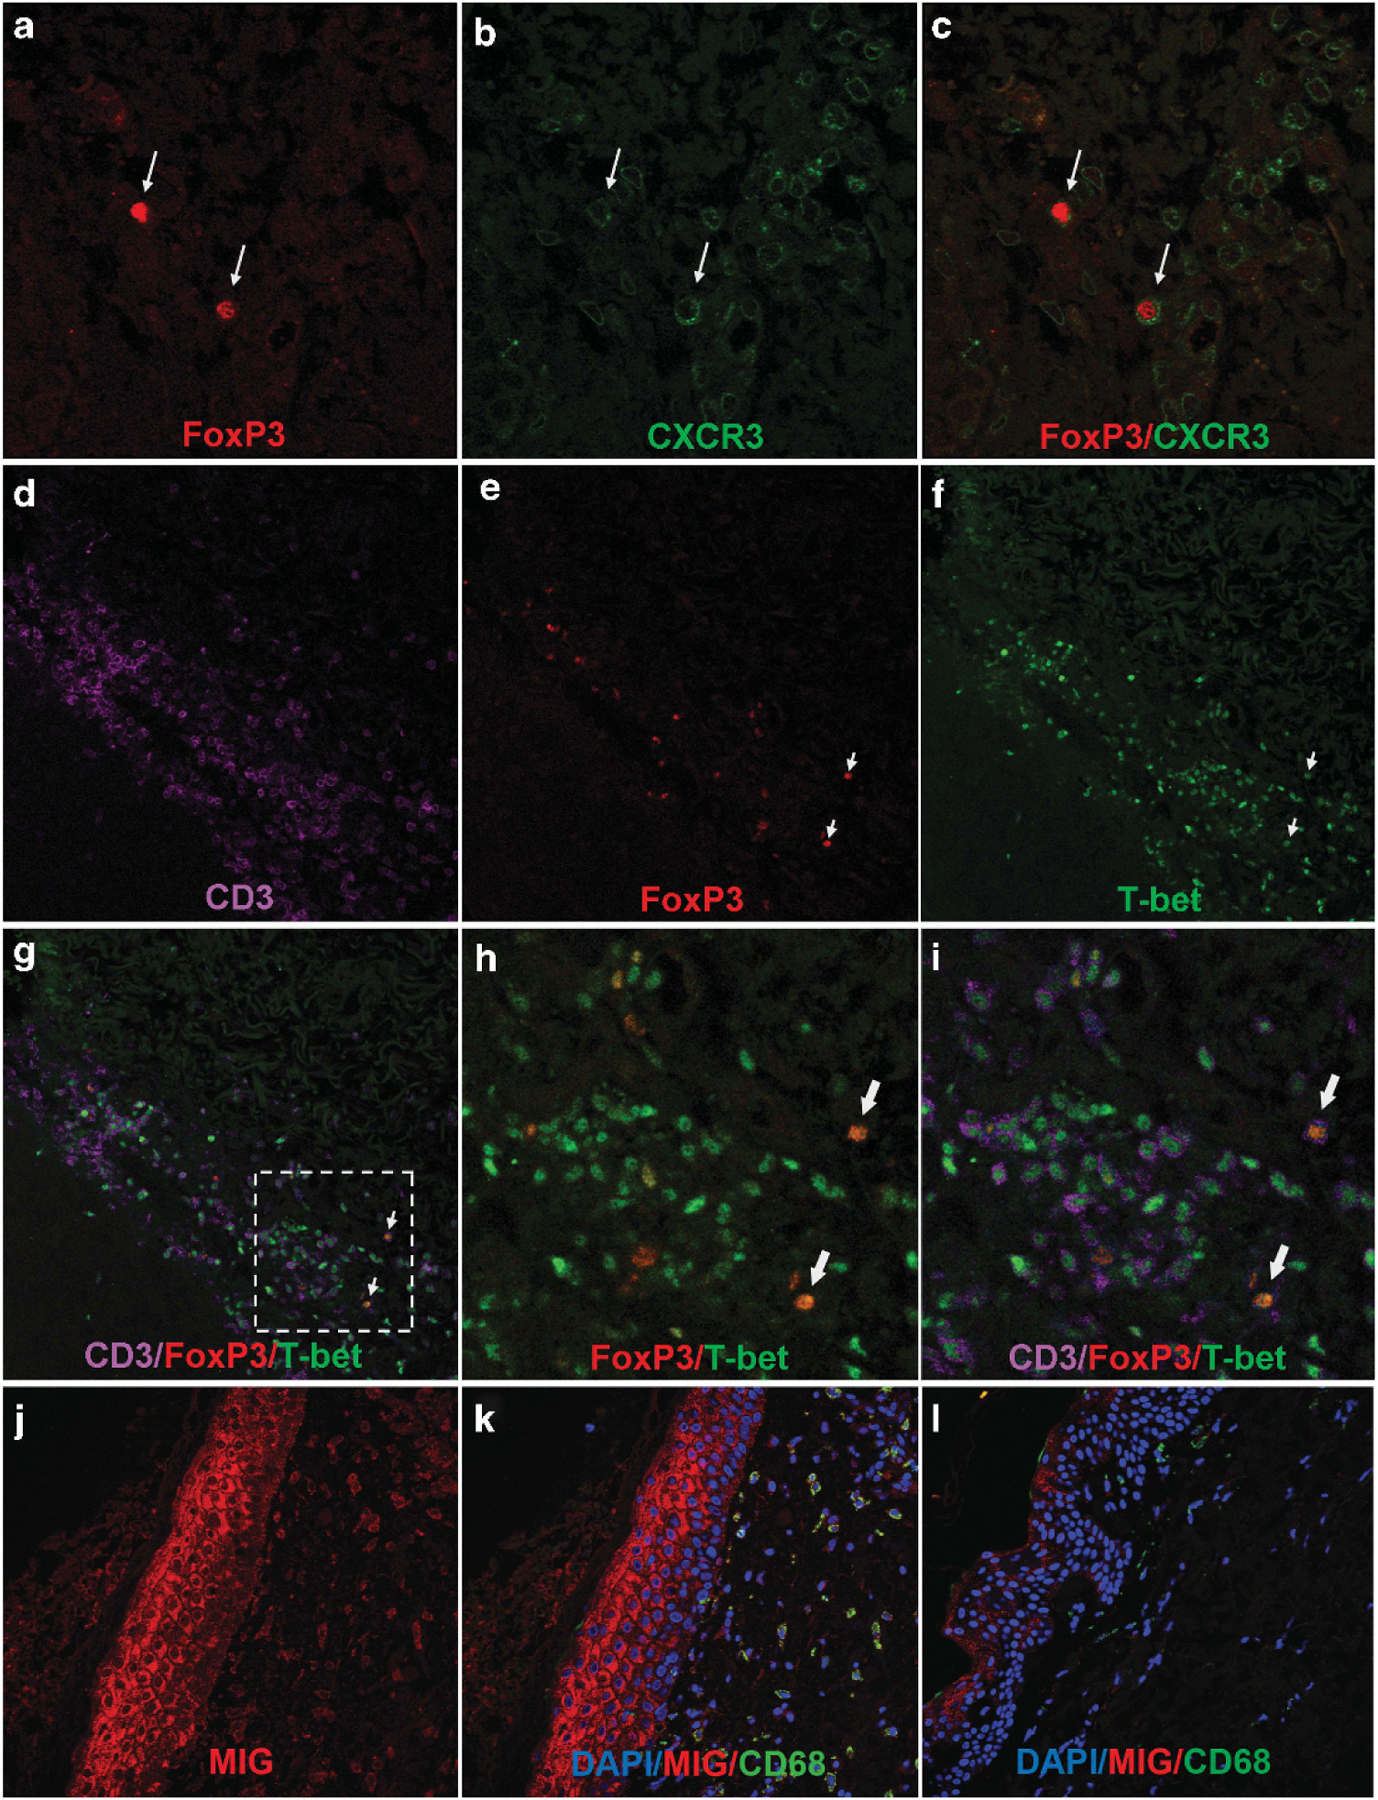
Expression of CXCR3 and T-bet on FoxP3+ T cells in human cGVHD. (a–c) Lichenoid cutaneous cGVHD biopsy stained for FoxP3 (red) and CXCR3 (green). FoxP3+ T cells (arrows) co-express CXCR3. Results typical of seven patients examined. (d–i) Lichenoid cutaneous cGVHD biopsy stained for FoxP3 (red), T-bet (green) and CD3 (lavender). Results typical of seven patients examined. (d–g) Lower magnification showing the dense infiltrate of T-Bet+ CD3+ T cells in lichenoid cGVHD biopsies with scattered FoxP3+ nuclei. (h, i) close-up views of the broken line square in (g) showing colocalization of FoxP3 and T-Bet (combined color orange) (arrows). (j, k) Lichenoid cutaneous cGVHD biopsy (from the tissue block shown in (a–c), stained for MIG (CXCL9) (red), CD68 (green) and DAPI (blue). (j) Both keratinocytes and cells in the dermal infiltrate express MIG (CXCL9). (k) MIG expression co-localizes with CD68, a marker of myeloid cells in the infiltrate. (l) Unaffected skin biopsy collected from a patient with lichenoid cutaneous cGVHD, stained for MIG (CXCL9) (red), CD68 (green) and DAPI (blue). Keratinocytes and the rare infiltrating cells in the dermis express little MIG.
CXCR3 is known to be under direct control of T-bet, a transcription factor also critical to Th1 polarization.28 We therefore examined the transcription factor expression in infiltrating Tregs by concurrent staining for FoxP3 and T-bet. T-bet nuclear staining, colocalized with CD3+, dominated the T-cell infiltrate in lichenoid skin (Figures 4d–i), similar to our previous findings in oral mucosa,10 confirming the dominant presence of T-bet+ Th1 T cells in lichenoid cGVHD tissue infiltrates. We determined that FoxP3+ cells were also positive for T-bet (Figures 4d–i). This is consistent with previous studies of murine Tregs upregulating T-bet and consequently expressing CXCR3 to support efficient migration into and control of sites of Th1-induced inflammation and autoimmunity.13,29
We have previously demonstrated that cGVHD-affected oral mucosal tissues are sites of production of interferon (IFN)-induced chemokines such as CXCL9.10 In the lichenoid cGVHD skin biopsies, myeloid (CD68+) cells in the infiltrate and overlying keratinocytes expressed the IFN-inducible chemokine MIG (CXCL9) (Figures 4j and k). In unaffected skin biopsies, the levels of MIG expression in keratinocytes was much lower, and few infiltrating cells were observed (Figure 4l). Because the chemokine receptor CXCR3, which binds IFN-induced chemokines such as MIG, is upregulated on T-bet+ T cells, the elevated local production of MIG may contribute to both Teff and Treg trafficking to the site.
Characterization of FoxP3+ cells in the blood
We analyzed T cells in the peripheral blood in 10 patients with severe lichenoid oral or cutaneous cGVHD (noted as ‘FACS’ in Table 1), to compare the frequency of FoxP3+ CD4 cells expressing markers of functional differentiation and trafficking to those found in other circulating T-cell subsets and in the tissue infiltrates (Figures 5a–d). Although the low frequency of T cells in sclerotic cGVHD biopsies precluded extensive characterization of Treg in the tissue, we performed the same FACS analyses on circulating T cells from five of the patients with sclerotic cutaneous cGVHD and supplemented these with five additional patients with severe cutaneous sclerotic changes (median sclerotic body surface of 64%) (Table 1; Figures 5e and f). These analyses found very similar circulating Treg populations in the 10 lichenoid and 10 severe sclerotic cGVHD patients. Three common markers of Treg, the ectonucleotidase CD39, CD25 and CTLA4, were expressed on a high percentage of FoxP3+ cells; all three were significantly less common on FoxP3− CD4 and CD8 cells (Figures 5a, c and e). ICOS expression was low in circulating FoxP3+ CD4 cells, even in those individuals in whom it was consistently co-expressed on FoxP3+ cells in tissue (Figure 3i), but significantly higher than that on other T cells (Figures 5c and e). A relatively low percentage of Treg in tissues were found to express Ki-67, comparable to that of other T cells. In contrast, a higher percentage of FoxP3+ CD4 cells were in cycle (Ki-67+) than were FoxP3− CD4 in the blood; no significant difference was observed with CD8 T cells (Figures 5c and e).
Figure 5.
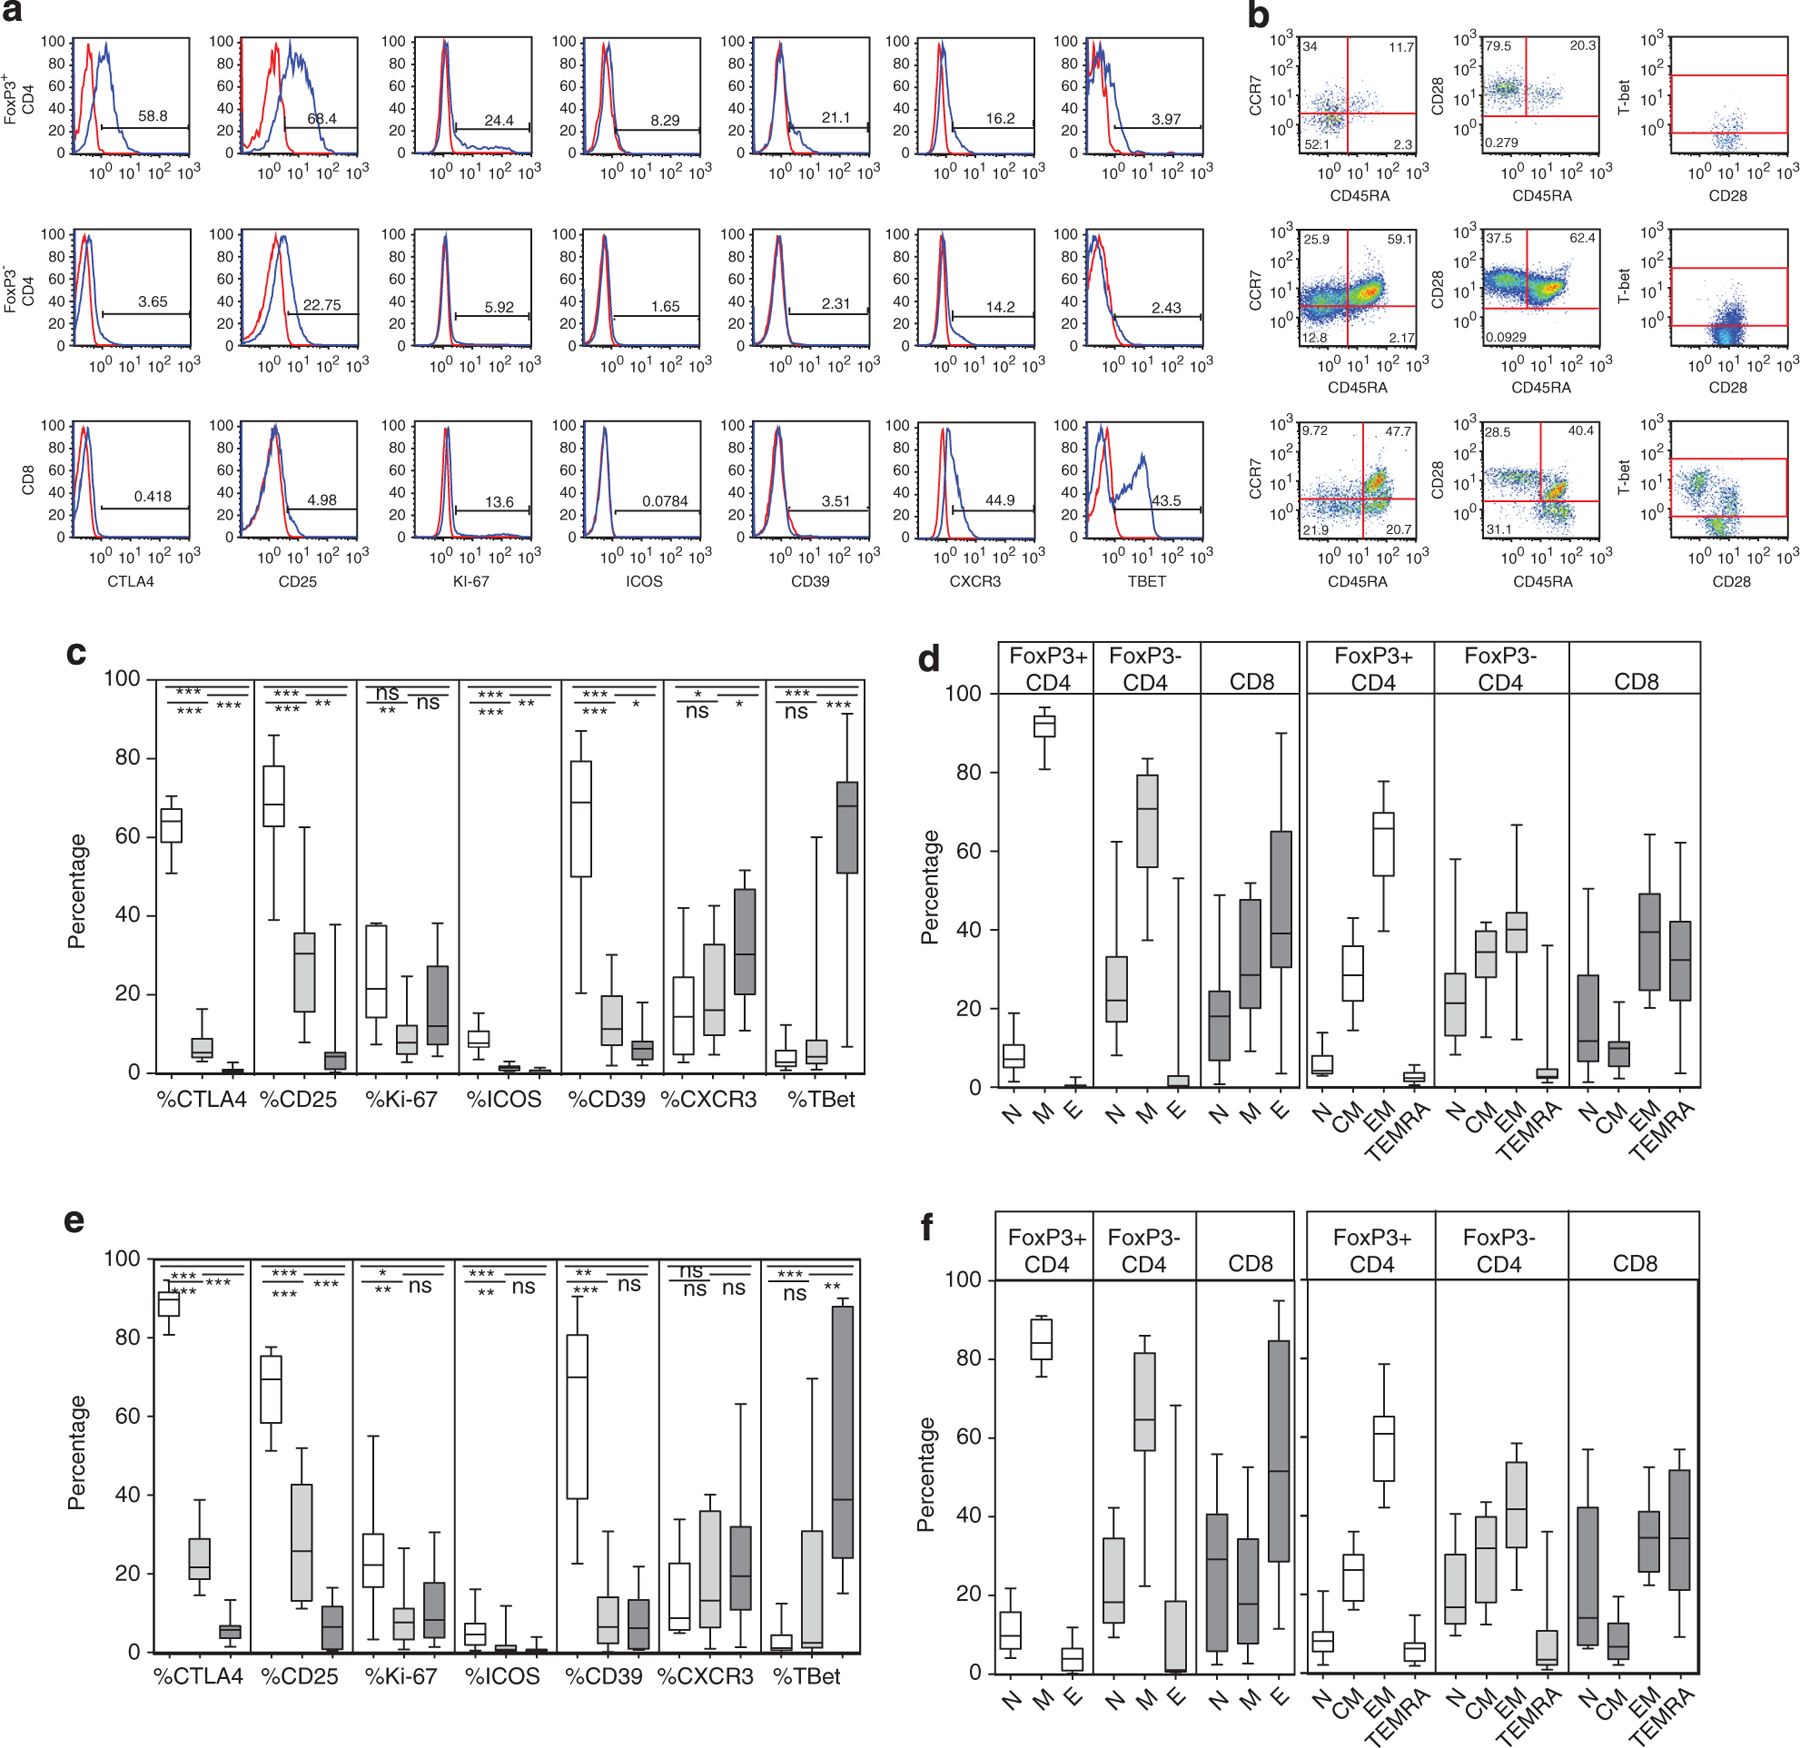
Comparison of peripheral blood Treg, non-Treg CD4 and CD8 cells. (a, b) Peripheral blood T cells were examined in 10 of the patients with severe lichenoid cGVHD affecting oral mucosa and skin and in 10 patients with sclerotic skin. A representative patient (no. 2) is shown. CD3+ T cells were gated on FoxP3+ CD4+, FoxP3− CD4+ and CD8+ T cells and assessed for markers of cytokine receptor expression (CD25), proliferation (Ki-67), naive, memory and effector status (CD45RA versus CCR7 and CD45RA versus CD28), Treg function (CTLA4, ICOS, CD39), transcription factors and chemokine receptors affecting trafficking to inflammatory sites (T-bet, CXCR3). Isotype controls for each marker shown in red. Percentage expression was determined relative to full-minus-one isotype control tubes for each Treg subset parameter. (c–f) The differential expression of these markers in the patient FoxP3+ CD4+ (white), FoxP3− CD4+ (light gray) and CD8+ (dark gray) populations were assessed in the lichenoid (c, d) and in the sclerotic (e, f) patients.
Because the presence of FoxP3+ cells co-expressing T-bet and CXCR3 in the tissues is consistent with a differential migration of Tregs into inflammatory sites,8,13,27 we examined expression of these markers on Tregs and other T subsets in the blood. CXCR3+ cells were found at a low frequency (median 14.4% (3–42)) in FoxP3+ CD4+ cells (Figure 5c), in contrast to the consistent colocalization of CXCR3 and FoxP3 in the tissues. Expression of CXCR3 on FoxP3− CD4+ and on CD8+ T cells also was much lower than that found in the tissues (Figures 4 and 5a, c and e). Similarly, T-bet was expressed on a relatively small proportion of circulating CD28+ memory FoxP3+ or FoxP3− CD4 cells (Figures 5b and c), but T-bet was co-expressed with CD3 on the infiltrating T cells in the tissues (Figures 4d–i). The highest levels of T-bet among the circulating T cells were found on CCR7− CD28− CD45RA+ effector CD8 cells (Figures 5a and b) The frequency of T-bet+ CD28− effector CD8 cells varied over a broad range in these patients (Figures 5c and e); this variation is consistent with antiviral activation occurring in CD8 cells only in the cytomegalovirus seropositive transplant patients.30,31
Naive T cells, whether defined as CCR7+ CD45RA+ or as CD28+ CD45RA+, were lowest in frequency in the FoxP3+ CD4 cells, as compared with other T subsets (Figures 5d and f). Effector memory cells (CCR7− CD45RA−) consistently formed the largest proportion of FoxP3+ CD4 cells (Figures 5b and d). FoxP3+ T cells in blood were CD28+, however, just as FoxP3+ cells retained CD27 expression in tissue (Figure 3e). In contrast, FoxP3− CD4 effectors lacking CD27 were commonly found in the tissue infiltrates (Figure 3f), but the corresponding CD4+ effector populations (CD28− or CCR7− CD45RA+ TEMRA) were rare in the blood. Finally, effector and effector-memory cells were common in both tissue-infiltrating and circulating CD8+ populations in cGVHD patients (Figure 5d). These studies substantiate that FoxP3+ populations in affected tissue express higher levels of markers of Treg functionality and inflammatory chemokine responsiveness than those in the blood.
Recently, Miyara and Sakaguchi have proposed that resting, activated and nonsuppressive Treg can be distinguished by CD45RA expression and FoxP3 intensity.15 We used this analysis to investigate the frequency of resting (CD45RA+ FoxP3dim; fraction I), activated (CD45RA− FoxP3hi; fraction II) and nonsuppressor (CD45RA− FoxP3dim; fraction III) Treg cell subsets.15 The distinction between FoxP3dim and FoxP3hi was defined by the FoxP3 staining intensity of the resting fraction I population (Figure 6a), but the identification of fraction II as activated effector Treg was substantiated by elevated expression of Ki-67, CD39, ICOS and CTLA4 in fraction II as compared with the other two fractions in both lichenoid and severe sclerotic patients (Figures 6b–i).15
Figure 6.

Comparison of resting, activated and nonsuppressive fractions of Treg. (a) Gated CD4+ T cells were analyzed according to Miyara and Sakaguchi to assess the frequency of fraction I ‘resting’ (CD45RA+, FoxP3lo), fraction II ‘activated’ (CD45RA−, FoxP3hi) and fraction III ‘nonsuppressive’ (CD45RA−, FoxP3lo) Treg subsets. (b–i) Graphs of the frequency of expression of markers of Treg functional activity in the three Miyara fractions in each of the 10 lichenoid (b–e) and 10 sclerotic (f–i) cGVHD patients: (b, f) CTLA4, (c, g) CD39, (d, h) ICOS and (e, i) Ki-67. (j, k) Graphs comparing Treg populations in patients with severe lichenoid oral or cutaneous cGVHD (Lich; n = 10; white), severe sclerotic skin (Scl; n = 6; light gray); cGVHD patients from the NIH natural history cohort (cGVHD; n = 47; medium gray) and normal healthy controls (ND; n = 29; black). (f) Graph of the percentages of FoxP3+ Treg within CD3+ CD4+ T cells in peripheral blood. (g) Graph of the proportions of FoxP3+ Treg cells in each of the three Miyara fractions in these patients. In all box and whisker plots, medians are indicated by horizontal bars, quartiles by box outline and minimum and maximum values by whiskers. Mann–Whitney comparisons with P-values <0.05 are indicated by *, <0.005 as ** and <0.0005 as ***. All tests were two sided. NS, nonsignificant.
We then compared the lichenoid and severe sclerotic cGVHD patients to a larger group of 47 additional cGVHD patients who were assessed for Treg (with 29 normal controls) on entry to the cGVHD study (Table 2; Figures 6j and k). FoxP3+ cells were present at comparable frequencies in all of cGVHD patients assessed and in normal controls (Figure 6j). Using the Miyara analysis, we found that the nonsuppressive fraction III Treg was the largest population in all four analysis groups, but was not significantly increased in cGVHD above the normal controls. In contrast, the ‘resting’ fraction I was significantly reduced in the lichenoid, the sclerotic and the overall cGVHD cohorts, as compared with normal donors (Figure 6k). Despite the reduced frequency of these ‘resting’ naive Treg, however, the key functional fraction II-activated Treg population, which is derived from these resting cells,15 was present at frequencies not significantly different from normal (Figure 6k).
DISCUSSION
In this report, we have characterized the frequency and functional markers of Treg in the blood and tissues in patients with cGVHD. Identification of FoxP3+ cells as Treg has been problematic due to reported upregulation of FoxP3 in activated CD4+ and CD8+ T cells.14 FoxP3 staining in alloreactive graft rejection and in tumor sites, however, has been found to correlate closely with Treg-specific DNA demethylation, the ‘gold standard’ marker of Tregs.32–35 In this report, we substantiated identification of FoxP3+ cells as Treg populations in cGVHD tissues by extensive colocalization studies. We demonstrated FoxP3 expression in the tissues colocalized to CD4+ T cells, and not to CD8+ T cells, and was not associated with an elevated frequency of Ki-67+ proliferating cells.19,36 FoxP3 expression colocalized with nuclei (Figure 1d), unlike transient cytoplasmic expression in activated T cells.37 FoxP3+ cells were found closely apposed to FoxP3− T cells and to large HLA-DR+ CD3− cells, probable dendritic cells or macrophages (Figures 4d–f). Finally, we determined that FoxP3+ cells expressed markers distinguishing Treg and effector populations, including the costimulatory molecule CD27 and Treg functional markers ICOS and CD39.19–21,23,26 In contrast, FoxP3− CD4+ T cells lacked expression of ICOS or CD27, consistent with identifying these cells as effector cells. Taken together, our findings distinguish FoxP3+ T cells from activated effectors and provide support for identifying FoxP3+ cells as Treg in severely affected tissues in lichenoid cGVHD.
A second key finding was not only that FoxP3+ cells were present in cGVHD-affected tissues, consistent with other reports,18,38,39 but also that the absolute number increased with increasing T-cell infiltration (Figure 2). This is distinct from findings in the intestinal mucosa, where increases in T-cell infiltrates occur in all post-transplant patients, with and without cGVHD;38 in lichenoid skin and oral mucosa, however, an infiltrate was observed only in sites of clinically evident cGVHD (Figure 1e, Figures 2a and b). This concurrent migration of both Teff cells and Tregs into inflammatory sites is consistent with shared mechanisms of trafficking by both T-cell populations. Expression of IFN-induced chemokines, such as CXCL9,10 has been found in conjunctiva and lichenoid skin and oral mucosa in cGVHD, as well as in the tissue shown in Figures 4j and k.8,11,12 Indeed, IFN-inducible chemokines can be detected in the plasma of patients with extensive cutaneous cGVHD.8 Furthermore, effector CD4 and CD8 T cells expressing the CXCR3 receptor are present at lower frequencies in the blood than in the tissues (Figures 4 and 5c and e), consistent with recruitment of CXCR3-expressing Teff cells out of the blood and into targeted tissues.8,10–12 Expression of CXCR3, as induced by the transcription factor T-bet, has been demonstrated to support recruitment of Treg to sites of inflammation and autoimmunity.13 Furthermore, elevated levels of IFN in tissues can induce expression of T-bet in Treg cells, without converting these cells into Th1 effectors.29 When we compared the expression of both T-bet and CXCR3 on FoxP3+ T cells in the blood and in the tissues, we found a much higher frequency of expression in the tissues (Figures 4 and 5). This disparity in CXCR3 expression between tissue and blood is consistent with comparable chemokine-mediated processes controlling regulatory as well as effector lymphocyte trafficking in cGVHD.
In murine models, resolution of autoimmunity or acute GVHD has been demonstrated to be dependent on the ability of Treg to traffic to the target tissue sites.9,13,40 In this study, we provided evidence that FoxP3+ Treg cells not only were present in the target tissues of severely affected cGVHD patients in proportion to effector populations, but also highly expressed markers associated with suppressive function. Expression of ICOS and CD39 may represent recruitment of activated Treg to inflamed sites, or, alternatively, may represent a capacity for functional activation of FoxP3+ T cells at the sites of cGVHD tissue damage; upregulation of ICOS has been shown to be sensitive to IL-2 levels and may therefore be independently regulated compared with T-bet and CXCR3 expression.29,41 Furthermore, even in the circulation, cGVHD patients demonstrated a capacity to generate the fraction II cells (CD45− FoxP3hi) that have been described as the main suppressive Treg population.15 We determined that a high percentage of fraction II cells in lichenoid and sclerotic cGVHD patients expressed functional markers (Figures 6b–i) and that the proportion of these fraction II cells was not reduced in the circulating Treg population in cGVHD patients compared with normal (Figure 6k). In contrast, the proportion of naive or ‘resting’ (CD45RA+ FoxP3+) fraction I Treg (Figures 5g and 6a and k) was significantly reduced in the lichenoid and sclerotic patients as well as in the overall cGVHD cohort, compared with normal controls. This fraction I deficit may be critical to the problem of controlling cGVHD effectors. Miyara has demonstrated that ‘resting’ fraction I cells are considered to be the source of expansion and persistence of short-lived fraction II Tregs.15 Similar findings of both the heterogeneity of circulating Treg populations and the consistent deficit in fraction I naive Treg have recently been reported in acute GVHD.16
These findings were also similar to analyses of blood and tissue in systemic autoimmune disorders. FoxP3+ cells have been identified in T-cell infiltrates in oral lichen planus, cutaneous and discoid lupus erythematosus, and dermatomyositis.42,43 These disorders have also been shown to have elevated levels of expression of CXCR3 on tissue-infiltrating T cells and increased production of IFN-induced chemokines in the tissues.44 In systemic sclerosis, both Treg and total T cells were less common in skin than those in the more inflammatory autoimmune disorders.17,45 Importantly, both fraction I and fraction II Treg in the blood were reduced in systemic sclerosis, with a progressive decline in fraction I with disease progression.17,46
Several factors limit this study. First, biopsies were selected from affected tissue sites for diagnostic confirmation of cGVHD, limiting potential association of Treg or Teff levels with severity. The cGVHD organ severity scale reflects both intensity of local changes and the overall proportion of the skin or mouth that is affected; for example, T-cell levels overlap in mild and severe oral cGVHD because of this sampling bias (Figures 2c and e). Second, full phenotyping of tissue Treg was performed only in lichenoid cGVHD, due to limits in assessing co-expression of markers in rare populations by immunohistochemistry. Furthermore, Treg functional studies cannot be performed on paraffin-embedded tissues, but assays on circulating Treg may not reflect Treg functional capacities in tissue, given the disparities in expression of functional markers. Finally, this study was limited by the single-visit structure of the trial so that serial changes in blood and tissue, effects of changes in disease activity or immunosuppressive therapies could not be observed in infiltrates.
Nevertheless, our comparison of tissue-infiltrating and circulating FoxP3+ cells may have implications for Treg-based therapies in cGVHD. Our studies have corroborated reports of a deficit in naive CD45RA+ FoxP3+ T cells in cGVHD patients.4,6 Owing to cytoreductive therapies in transplant conditioning and diminished thymopoietic capacity in adults, all naive T-cell populations are markedly reduced after hematopoietic stem cell transplantation, a problem that is exacerbated in patients with GVHD.47 In cGVHD, the deficit of Miyara’s fraction I Treg, which phenotypically corresponds to naive Treg, may be the key parameter limiting generation of activated fraction II Treg. Recent clinical studies have demonstrated that IL-2 cytokine therapy can ameliorate active cGVHD in steroid refractory patients.7 IL-2 markedly increased Treg levels systemically, including specific increases in CD45RA+ Treg and enhanced overall Treg function in assays.6 These findings are consistent with expansion in fraction I Treg, supporting increased levels of fraction II Treg.15 Our combined analysis of Treg cells in tissue and blood suggests that, even in severely affected patients, Treg retain the ability to become activated (appearing as fraction II Treg with elevated functional markers), to migrate into inflamed tissues and to express functional molecules at these affected tissue sites. These results support the continued exploration of cGVHD therapies expanding the naive, fraction I Treg population to enhance this capacity.
Supplementary Material
ACKNOWLEDGEMENTS
This research was supported by the Intramural Research Program of the Center for Cancer Research, National Cancer Institute, NIH. We would like to thank the cGVHD clinical team for their continuing support of cGVHD patient evaluation and care, and the staff of the Preclinical Development and Clinical Monitoring Core for supporting the collection and archiving of patient materials. Finally, we are grateful to all patients who volunteered for this study.
Footnotes
CONFLICT OF INTEREST
The authors declare no conflict of interest.
Supplementary Information accompanies this paper on the Leukemia website (http://www.nature.com/leu)
REFERENCES
- 1.Filipovich AH, Weisdorf D, Pavletic S, Socie G, Wingard JR, Lee SJ et al. National Institutes of Health consensus development project on criteria for clinical trials in chronic graft-versus-host disease: I. Diagnosis and staging working group report. Biol Blood Marrow Transplant 2005; 11: 945–956. [DOI] [PubMed] [Google Scholar]
- 2.Blazar BR, Murphy WJ, Abedi M. Advances in graft-versus-host disease biology and therapy. Nat Rev Immunol 2012; 12: 443–458. [DOI] [PMC free article] [PubMed] [Google Scholar]
- 3.Sakaguchi S, Miyara M, Costantino CM, Hafler DA. FOXP3+ regulatory T cells in the human immune system. Nat Rev Immunol 2010; 10: 490–500. [DOI] [PubMed] [Google Scholar]
- 4.Matsuoka K, Kim HT, McDonough S, Bascug G, Warshauer B, Koreth J et al. Altered regulatory T cell homeostasis in patients with CD4+ lymphopenia following allogeneic hematopoietic stem cell transplantation. J Clin Invest 2010; 120: 1479–1493. [DOI] [PMC free article] [PubMed] [Google Scholar]
- 5.Zorn E, Kim HT, Lee SJ, Floyd BH, Litsa D, Arumugarajah S et al. Reduced frequency of FOXP3+ CD4+ CD25+ regulatory T cells in patients with chronic graft-versus-host disease. Blood 2005; 106: 2903–2911. [DOI] [PMC free article] [PubMed] [Google Scholar]
- 6.Matsuoka K, Koreth J, Kim HT, Bascug G, McDonough S, Kawano Y et al. Low-dose interleukin-2 therapy restores regulatory T cell homeostasis in patients with chronic graft-versus-host disease. Sci Transl Med 2013; 5: 179ra143. [DOI] [PMC free article] [PubMed] [Google Scholar]
- 7.Koreth J, Matsuoka K, Kim HT, McDonough SM, Bindra B, Alyea EP 3rd et al. Interleukin-2 and regulatory T cells in graft-versus-host disease. N Engl J Med 2011; 365: 2055–2066. [DOI] [PMC free article] [PubMed] [Google Scholar]
- 8.Croudace JE, Inman CF, Abbotts BE, Nagra S, Nunnick J, Mahendra P et al. Chemokine-mediated tissue recruitment of CXCR3+ CD4+ T cells plays a major role in the pathogenesis of chronic GVHD. Blood 2012; 120: 4246–4255. [DOI] [PubMed] [Google Scholar]
- 9.Choi J, Ziga ED, Ritchey J, Collins L, Prior JL, Cooper ML et al. IFNgammaR signaling mediates alloreactive T-cell trafficking and GVHD. Blood 2012; 120: 4093–4103. [DOI] [PMC free article] [PubMed] [Google Scholar]
- 10.Imanguli MM, Swaim WD, League SC, Gress RE, Pavletic SZ, Hakim FT. Increased T-bet+ cytotoxic effectors and type I interferon-mediated processes in chronic graft-versus-host disease of the oral mucosa. Blood 2009; 113: 3620–3630. [DOI] [PMC free article] [PubMed] [Google Scholar]
- 11.Wenzel J, Lucas S, Zahn S, Mikus S, Metze D, Stander S et al. CXCR3 <-> ligand-mediated skin inflammation in cutaneous lichenoid graft-versus-host disease. J Am Acad Dermatol 2008; 58: 437–442. [DOI] [PubMed] [Google Scholar]
- 12.Westekemper H, Meller S, Citak S, Schulte C, Steuhl KP, Homey B et al. Differential chemokine expression in chronic GVHD of the conjunctiva. Bone Marrow Transplant 2010; 45: 1340–1346. [DOI] [PubMed] [Google Scholar]
- 13.Koch MA, Tucker-Heard G, Perdue NR, Killebrew JR, Urdahl KB, Campbell DJ. The transcription factor T-bet controls regulatory T cell homeostasis and function during type 1 inflammation. Nat Immunol 2009; 10: 595–602. [DOI] [PMC free article] [PubMed] [Google Scholar]
- 14.Gavin MA, Torgerson TR, Houston E, DeRoos P, Ho WY, Stray-Pedersen A et al. Single-cell analysis of normal and FOXP3-mutant human T cells: FOXP3 expression without regulatory T cell development. Proc Natl Acad Sci USA 2006; 103: 6659–6664. [DOI] [PMC free article] [PubMed] [Google Scholar]
- 15.Miyara M, Yoshioka Y, Kitoh A, Shima T, Wing K, Niwa A et al. Functional delineation and differentiation dynamics of human CD4+ T cells expressing the FoxP3 transcription factor. Immunity 2009; 30: 899–911. [DOI] [PubMed] [Google Scholar]
- 16.Dong S, Maiella S, Xhaard A, Pang Y, Wenandy L, Larghero J et al. Multiparameter single-cell profiling of human CD4+ FOXP3+ regulatory T-cell populations in homeostatic conditions and during graft-versus-host disease. Blood 2013; 122: 1802–1812. [DOI] [PubMed] [Google Scholar]
- 17.Mathian A, Parizot C, Dorgham K, Trad S, Arnaud L, Larsen M et al. Activated and resting regulatory T cell exhaustion concurs with high levels of interleukin-22 expression in systemic sclerosis lesions. Ann Rheum Dis 2012; 71: 1227–1234. [DOI] [PubMed] [Google Scholar]
- 18.Rieger K, Loddenkemper C, Maul J, Fietz T, Wolff D, Terpe H et al. Mucosal FOXP3+ regulatory T cells are numerically deficient in acute and chronic GvHD. Blood 2006; 107: 1717–1723. [DOI] [PubMed] [Google Scholar]
- 19.Vukmanovic-Stejic M, Agius E, Booth N, Dunne PJ, Lacy KE, Reed JR et al. The kinetics of CD4+ Foxp3+ T cell accumulation during a human cutaneous antigen-specific memory response in vivo. J Clin Invest 2008; 118: 3639–3650. [DOI] [PMC free article] [PubMed] [Google Scholar]
- 20.Ruprecht CR, Gattorno M, Ferlito F, Gregorio A, Martini A, Lanzavecchia A et al. Coexpression of CD25 and CD27 identifies FoxP3+ regulatory T cells in inflamed synovia. J Exp Med 2005; 201: 1793–1803. [DOI] [PMC free article] [PubMed] [Google Scholar]
- 21.Sagoo P, Ali N, Garg G, Nestle FO, Lechler RI, Lombardi G. Human regulatory T cells with alloantigen specificity are more potent inhibitors of alloimmune skin graft damage than polyclonal regulatory T cells. Sci Transl Med 2011; 3: 83ra42. [DOI] [PMC free article] [PubMed] [Google Scholar]
- 22.Rubtsov YP, Rasmussen JP, Chi EY, Fontenot J, Castelli L, Ye X et al. Regulatory T cell-derived interleukin-10 limits inflammation at environmental interfaces. Immunity 2008; 28: 546–558. [DOI] [PubMed] [Google Scholar]
- 23.Ito T, Hanabuchi S, Wang YH, Park WR, Arima K, Bover L et al. Two functional subsets of FOXP3+ regulatory T cells in human thymus and periphery. Immunity 2008; 28: 870–880. [DOI] [PMC free article] [PubMed] [Google Scholar]
- 24.Tadokoro CE, Shakhar G, Shen S, Ding Y, Lino AC, Maraver A et al. Regulatory T cells inhibit stable contacts between CD4+ T cells and dendritic cells in vivo. J Exp Med 2006; 203: 505–511. [DOI] [PMC free article] [PubMed] [Google Scholar]
- 25.Tang Q, Adams JY, Tooley AJ, Bi M, Fife BT, Serra P et al. Visualizing regulatory T cell control of autoimmune responses in nonobese diabetic mice. Nat Immunol 2006; 7: 83–92. [DOI] [PMC free article] [PubMed] [Google Scholar]
- 26.Deaglio S, Dwyer KM, Gao W, Friedman D, Usheva A, Erat A et al. Adenosine generation catalyzed by CD39 and CD73 expressed on regulatory T cells mediates immune suppression. J Exp Med 2007; 204: 1257–1265. [DOI] [PMC free article] [PubMed] [Google Scholar]
- 27.Oo YH, Weston CJ, Lalor PF, Curbishley SM, Withers DR, Reynolds GM et al. Distinct roles for CCR4 and CXCR3 in the recruitment and positioning of regulatory T cells in the inflamed human liver. J Immunol 2010; 184: 2886–2898. [DOI] [PubMed] [Google Scholar]
- 28.Lord GM, Rao RM, Choe H, Sullivan BM, Lichtman AH, Luscinskas FW et al. T-bet is required for optimal proinflammatory CD4+ T-cell trafficking. Blood 2005; 106: 3432–3439. [DOI] [PMC free article] [PubMed] [Google Scholar]
- 29.Koch MA, Thomas KR, Perdue NR, Smigiel KS, Srivastava S, Campbell DJ. T-bet(+) Treg cells undergo abortive Th1 cell differentiation due to impaired expression of IL-12 receptor beta2. Immunity 2012; 37: 501–510. [DOI] [PMC free article] [PubMed] [Google Scholar]
- 30.Mendes AV, Kallas EG, Benard G, Pannuti CS, Menezes R, Dulley FL et al. Impact of cytomegalovirus and grafts versus host disease on the dynamics of CD57+ CD28- CD8+ T cells after bone marrow transplant. Clinics (Sao Paulo) 2008; 63: 667–676. [DOI] [PMC free article] [PubMed] [Google Scholar]
- 31.Hertoghs KM, Moerland PD, van Stijn A, Remmerswaal EB, Yong SL, van de Berg PJ et al. Molecular profiling of cytomegalovirus-induced human CD8+ T cell differentiation. J Clin Invest 2010; 120: 4077–4090. [DOI] [PMC free article] [PubMed] [Google Scholar]
- 32.Bestard O, Cunetti L, Cruzado JM, Lucia M, Valdez R, Olek S et al. Intragraft regulatory T cells in protocol biopsies retain foxp3 demethylation and are protective biomarkers for kidney graft outcome. Am J Transplant 2011; 11: 2162–2172. [DOI] [PubMed] [Google Scholar]
- 33.Wieczorek G, Asemissen A, Model F, Turbachova I, Floess S, Liebenberg V et al. Quantitative DNA methylation analysis of FOXP3 as a new method for counting regulatory T cells in peripheral blood and solid tissue. Cancer Res 2009; 69: 599–608. [DOI] [PubMed] [Google Scholar]
- 34.Kryczek I, Liu R, Wang G, Wu K, Shu X, Szeliga W et al. FOXP3 defines regulatory T cells in human tumor and autoimmune disease. Cancer Res 2009; 69: 3995–4000. [DOI] [PubMed] [Google Scholar]
- 35.Baron U, Floess S, Wieczorek G, Baumann K, Grutzkau A, Dong J et al. DNA demethylation in the human FOXP3 locus discriminates regulatory T cells from activated FOXP3(+) conventional T cells. Eur J Immunol 2007; 37: 2378–2389. [DOI] [PubMed] [Google Scholar]
- 36.Taflin C, Miyara M, Nochy D, Valeyre D, Naccache JM, Altare F et al. FoxP3+ regulatory T cells suppress early stages of granuloma formation but have little impact on sarcoidosis lesions. Am J Pathol 2009; 174: 497–508. [DOI] [PMC free article] [PubMed] [Google Scholar]
- 37.Magg T, Mannert J, Ellwart JW, Schmid I, Albert MH. Subcellular localization of FOXP3 in human regulatory and nonregulatory T cells. Eur J Immunol 2012; 42: 1627–1638. [DOI] [PubMed] [Google Scholar]
- 38.Fondi C, Nozzoli C, Benemei S, Baroni G, Saccardi R, Guidi S et al. Increase in FOXP3+ regulatory T cells in GVHD skin biopsies is associated with lower disease severity and treatment response. Biol Blood Marrow Transplant 2009; 15: 938–947. [DOI] [PubMed] [Google Scholar]
- 39.Ratajczak P, Janin A, Peffault de Latour R, Leboeuf C, Desveaux A, Keyvanfar K et al. Th17/Treg ratio in human graft-versus-host disease. Blood 2010; 116: 1165–1171. [DOI] [PMC free article] [PubMed] [Google Scholar]
- 40.Rosenblum MD, Gratz IK, Paw JS, Lee K, Marshak-Rothstein A, Abbas AK. Response to self antigen imprints regulatory memory in tissues. Nature 2011; 480: 538–542. [DOI] [PMC free article] [PubMed] [Google Scholar]
- 41.Kornete M, Sgouroudis E, Piccirillo CA. ICOS-dependent homeostasis and function of Foxp3+ regulatory T cells in islets of nonobese diabetic mice. J Immunol 2012; 188: 1064–1074. [DOI] [PubMed] [Google Scholar]
- 42.Magro CM, Segal JP, Crowson AN, Chadwick P. The phenotypic profile of dermatomyositis and lupus erythematosus: a comparative analysis. J Cutan Pathol 2010; 37: 659–671. [DOI] [PubMed] [Google Scholar]
- 43.Tao XA, Xia J, Chen XB, Wang H, Dai YH, Rhodus NL et al. FOXP3 T regulatory cells in lesions of oral lichen planus correlated with disease activity. Oral Dis 2010; 16: 76–82. [DOI] [PubMed] [Google Scholar]
- 44.Abe R, Donnelly SC, Peng T, Bucala R, Metz CN. Peripheral blood fibrocytes: differentiation pathway and migration to wound sites. J Immunol 2001; 166: 7556–7562. [DOI] [PubMed] [Google Scholar]
- 45.Klein S, Kretz CC, Ruland V, Stumpf C, Haust M, Hartschuh W et al. Reduction of regulatory T cells in skin lesions but not in peripheral blood of patients with systemic scleroderma. Ann Rheum Dis 2011; 70: 1475–1481. [DOI] [PubMed] [Google Scholar]
- 46.Liu X, Gao N, Li M, Xu D, Hou Y, Wang Q et al. Elevated levels of CD4(+) CD25(+)FoxP3(+) T cells in systemic sclerosis patients contribute to the secretion of IL-17 and immunosuppression dysfunction. PLoS One 2013; 8: e64531. [DOI] [PMC free article] [PubMed] [Google Scholar]
- 47.Weinberg K, Blazar BR, Wagner JE, Agura E, Hill BJ, Smogorzewska M et al. Factors affecting thymic function after allogeneic hematopoietic stem cell transplantation. Blood 2001; 97: 1458–1466. [DOI] [PubMed] [Google Scholar]
Associated Data
This section collects any data citations, data availability statements, or supplementary materials included in this article.