

Abstract
BACKGROUND:
The purpose of this study was to assess the trends in clinical diagnosis use and its impact on treatment outcomes in patients receiving radiation therapy for early stage lung cancer.
METHODS:
The Surveillance, Epidemiology, and End Results registry was queried from 2004–2012 for patients ≥18 years old diagnosed with Stage I (clinical T1a-T2a) lung cancer who underwent radiation therapy alone. Trends in diagnostic confirmation patterns were characterized. Cox proportional hazards model was used to assess overall survival (OS), competing risk regression analysis was used to assess cancer specific survival (CSS).
RESULTS:
A total of 7,050 patients were included; 6,399 (90.8%) were pathologically diagnosed and 651 (9.2%) were clinical diagnosed. There was no significant change in the utilization of clinical versus pathologic diagnosis (p=0.172) over time. Patients with T1 disease (p<0.001), tumors 0–1.9 cm in size (p<0.001), and upper lobe tumors (p=0.004) were more likely to be clinically diagnosed. On multivariable analysis, clinical diagnosis was associated with an improved CSS (HR 0.82 95% CI 0.71–0.96) but was not associated with an improved OS (HR 1.01 95% CI 0.90–1.13). When stratifying by T-stage, clinically diagnosed T1a patients had an improved CSS (HR 0.75 95% CI 0.58–0.96 p=0.022). There was a trend towards improved CSS in patients with clinical T1b tumors (HR 0.74 95% CI 0.55–1.00 p=0.052).
CONCLUSION(S):
The improved CSS in clinically diagnosed patients suggests treatment of benign disease particularly in smaller tumors. Prudent patient selection is needed to reduce the potential for overtreatment.
Keywords: SBRT, lung cancer, early stage, biopsy, radiation therapy
INTRODUCTION
Lung cancer is the most common cause of cancer mortality in the United States with 158,040 expected deaths in 20151. Approximately 15% of new lung cancer cases are clinically localized. For patients with early stage disease, surgical resection has long been considered the “gold standard” treatment. Poor lung function or multiple comorbidities may preclude a patient from undergoing surgical resection. Stereotactic body radiotherapy (SBRT) is an acceptable alternative treatment option for medically inoperable patients at high risk for surgical morbidity or mortality2.
In patients with poor pulmonary function or multiple comorbidities, obtaining pathologic confirmation of a presumed lung cancer may be difficult. Furthermore, tumor location or patient refusal to an invasive procedure may encourage a clinician to treat without a pathologic diagnosis. Moreover, imaging may be equivocal, as benign etiologies (e.g. infection) may appear as false positives on both CT and PET3. As a result, physicians often rely on a patient’s clinical history and imaging studies to identify whether a lung nodule is a presumed malignancy. Multiple studies have demonstrated that SBRT may be a safe and effective treatment option in patients without pathologic confirmation of their disease4–7. The purpose of this analysis was to identify the trends in the utilization of a clinical diagnosis for lung cancer using a large national registry, and to identify whether the method of diagnosis impacts treatment outcomes for patients undergoing radiotherapy for Stage I lung cancer. We hypothesized that patients receiving a clinical diagnosis may have improved treatment outcomes due to a larger proportion of these patients not having a malignancy.
MATERIALS AND METHODS
Patient Selection
The Surveillance, Epidemiology, and End Results (SEER) program is sponsored by the National Cancer Institute and collects cancer incidence, survival, and treatment information. The SEER registry covers approximately 28% of the United States population8. Specifically, the database includes clinical (age, race, gender, stage, grade) and treatment (lymph nodes evaluated, type of surgery, type of radiation) information. The SEER registry does not include data on comorbidities, performance status, margin status, radiation dose, or chemotherapy use. All data regarding treatment represents the first course of therapy and excludes treatment delivered at recurrence or progression.
The SEER registry was queried from 2004 to 2012 for patients ≥18 years old undergoing external beam radiation therapy for Stage I lung (C34.0-C34.9) cancer according to the American Joint Committee for Cancer Staging Version 7 staging system9. Patients undergoing surgery, with tumors > 5 cm, with any previous cancer diagnosis, ≤ 1 month follow-up, or missing treatment information were excluded from the analysis. The SEER registry codes for method of diagnostic confirmation; patients with a positive histology, positive cytology, or positive microscopic confirmation were considered to have a pathologic diagnosis. Patients with a positive laboratory test/marker, direct visualization without microscopic confirmation, radiologic and other imaging techniques without microscopic confirmation, or clinical diagnosis only were considered to have a clinical diagnosis. Patients with an unknown confirmation status were excluded from the analysis.
Statistical Analysis
The primary outcomes were to assess trends in diagnostic confirmation patterns in patients with Stage I lung cancer and to assess whether the method of diagnostic confirmation impacts overall survival (OS) or cancer specific survival (CSS). Demographic and clinical characteristics were compared between patients diagnosed pathologically or clinically using Chi-square tests. Trends in rates of radiotherapy use over time were examined using the Chi-square test for trend. Cause of death was classified as lung cancer mortality or non-cancer mortality. Survival estimates were generated using the Kaplan-Meier method with comparisons between groups via the log-rank test. Multivariable survival analyses for OS was performed using the Cox proportional hazards model controlling for type of diagnosis, age, race, gender, marital status, clinical T stage, laterality, tumor location, poverty level, income level, education status, and tumor size (according to quintiles). Given that Cox proportional hazards estimates for CSS may overestimate risk, we performed a Fine and Gray competing risk regression model to assess whether patients receiving a clinical diagnosis versus a pathologic diagnosis had a decreased CSS (presented as standardized hazard ratio [sHR]) after adjusting for age, race, gender, marital status, clinical T stage, laterality, tumor location, poverty level, income level, education status10. Statistical analysis was performed using STATA software (version 14.1). A p-value ≤0.05 was considered statistically significant. All statistical tests were two sided.
RESULTS
Patient Population
A total of 7050 patients were included in the analysis of which 6399 (90.8 %) were pathologically diagnosed and 651 (9.2 %) received a clinical diagnosis. The median age was 75 (range 28–98) and the median follow-up was 17 months (range 2–107). Most patients had clinical T1 disease (57.7%) and had an upper lobe lesion (60.4%). Overall more patients underwent radiation therapy as the study time period progressed, from 598 cases in 2004 to 959 in 2012. There was no significant change in the utilization of clinical diagnosis versus pathologic diagnosis (Figure 1, p=0.172) during this time period. For patients without a pathologic diagnosis, 554 (85.1%) were diagnosed based on imaging, 93 (14.3%) were coded as diagnosed clinically only, and 4 (0.6%) were diagnosed with direct visualization, without microscopic confirmation. No patients were diagnosed utilizing a positive laboratory test/marker.
Figure 1:
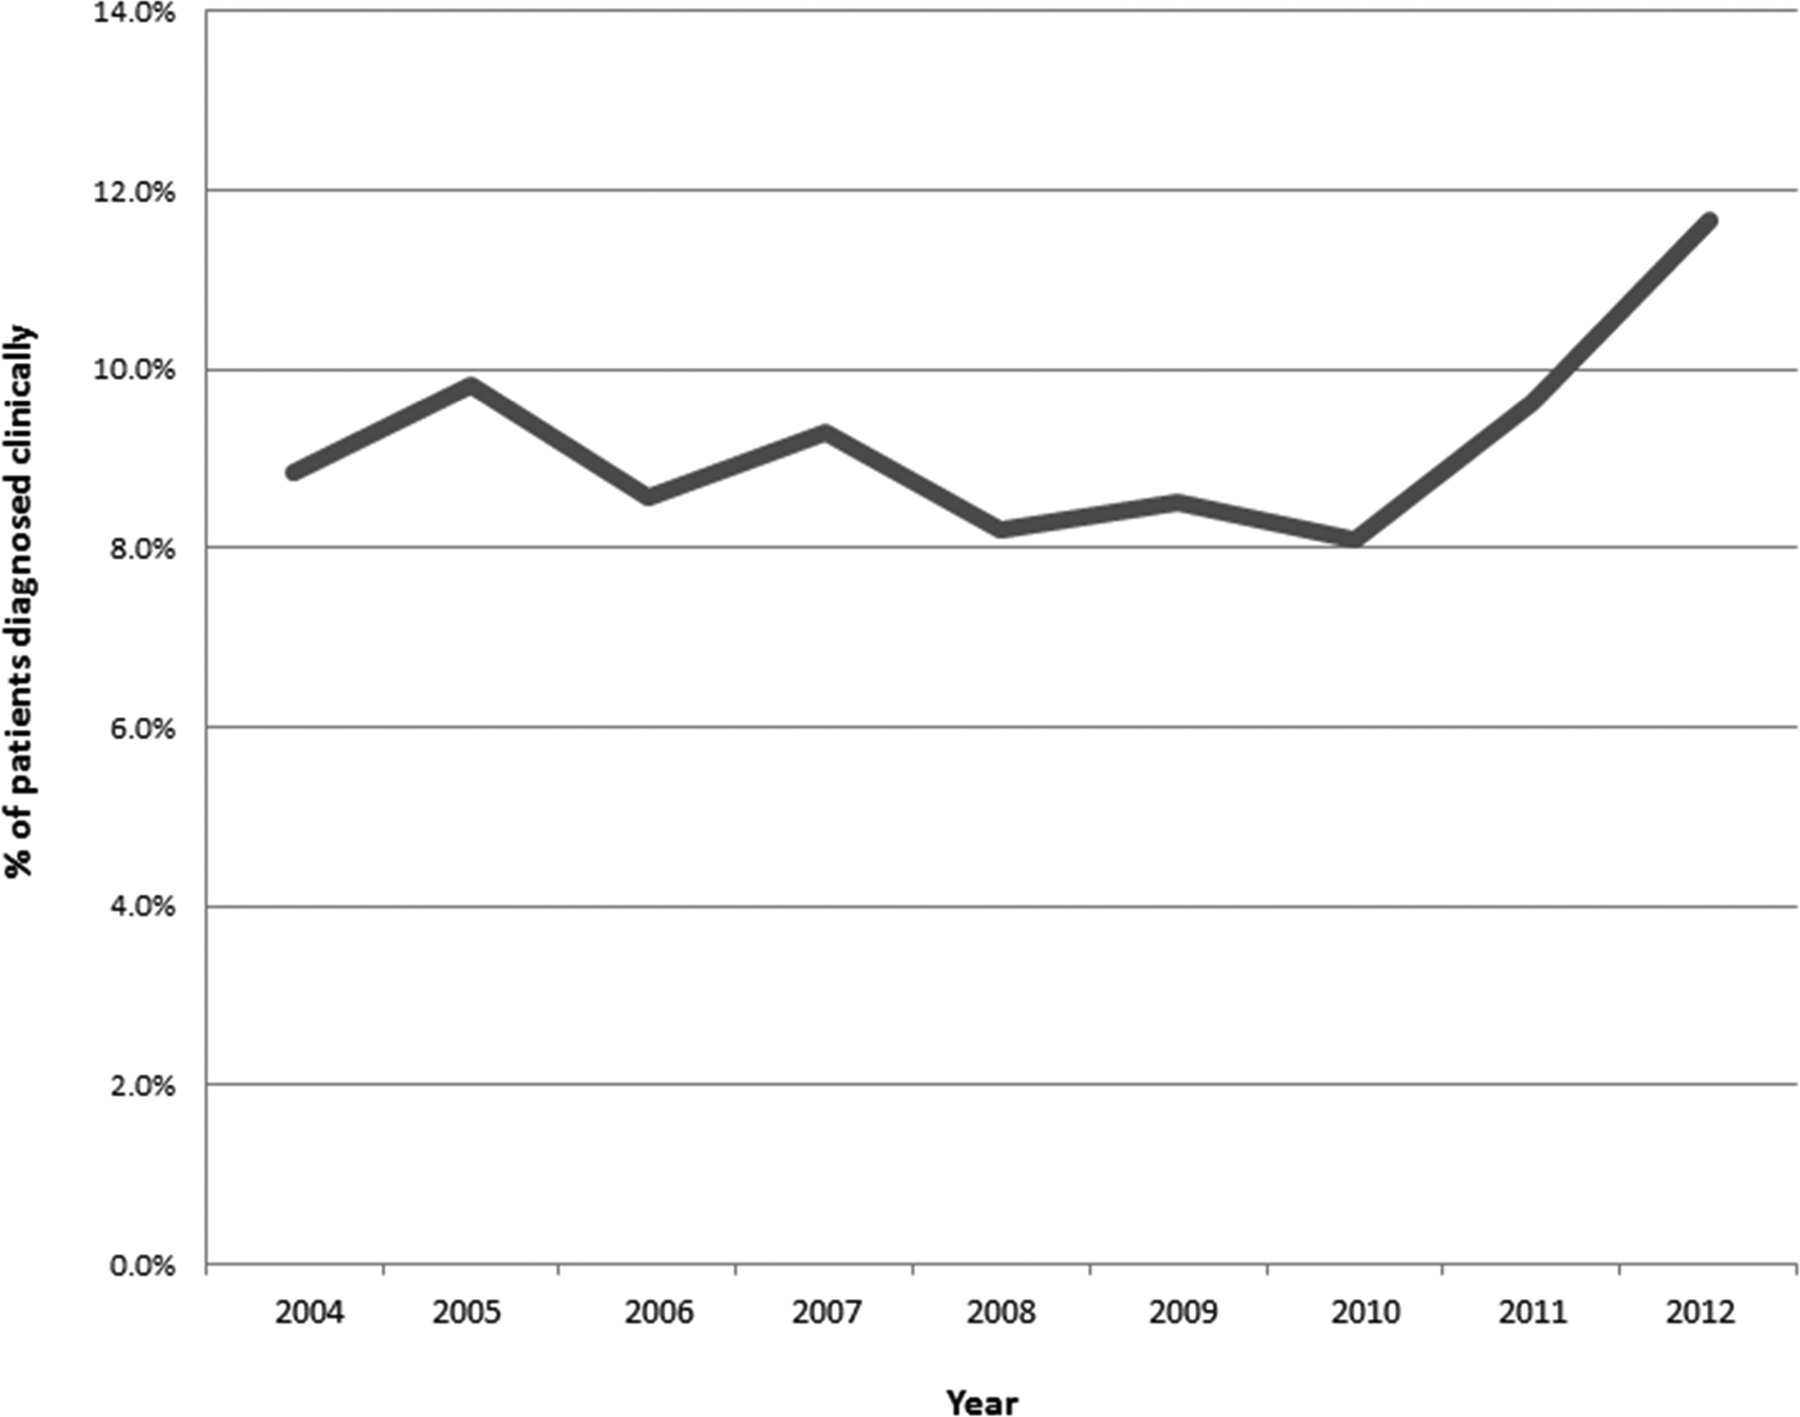
Trends in receipt of clinical diagnosis
Patients with clinical T1 disease (p<0.001), tumors 0 to 1.9 cm in size (p<0.001), and upper lobe tumors (p=0.004) were more likely to be clinically diagnosed. Other small differences were seen between patients based on characteristics such as race, poverty level, and education; although many of these differences reached statistical significance the difference in rates was very small (Table 1). For patients receiving a pathologic diagnosis, 29.2% had a not otherwise specified histology, 34.8% had a squamous cell carcinoma, and 34.3% had an adenocarcinoma. The majority of patients with pathologic diagnosis had either a grade 3–4 (27.8%) or unknown/other grade (50.7%) cancer.
Table 1:
Patient characteristics according to diagnosis type
| All Patients | Diagnosis Type | p-value | ||||
|---|---|---|---|---|---|---|
| n=7050 | Clinical (n=651) | % | Pathologic (n=6399) | % | ||
| Age | ||||||
| ≤65 years old | 1354 | 126 | (19.4%) | 1228 | (19.2%) | 0.274 |
| 66–80 years old | 3803 | 334 | (51.3%) | 3469 | (54.2%) | |
| >80 years old | 1893 | 191 | (29.3%) | 1702 | (26.6%) | |
| Race | ||||||
| White | 6019 | 577 | (88.6%) | 5442 | (85.0%) | 0.042 |
| Black | 725 | 50 | (7.7%) | 675 | (10.5%) | |
| Other/Unknown | 306 | 24 | (3.7%) | 282 | (4.4%) | |
| Gender | ||||||
| Female | 3681 | 334 | (51.3%) | 3347 | (52.3%) | 0.627 |
| Male | 3369 | 317 | (48.7%) | 3052 | (47.7%) | |
| Marital Status | ||||||
| Married | 3186 | 293 | (45.0%) | 2893 | (45.2%) | <0.001 |
| Single/Separated/Divorced/Widowed | 3587 | 314 | (48.2%) | 3273 | (51.1%) | |
| Unknown, Unmarried or domestic partner | 277 | 44 | (6.8%) | 233 | (3.6%) | |
| Clinical Stage | ||||||
| T1 | 4070 | 505 | (77.6%) | 3565 | (55.7%) | <0.001 |
| T2 | 2980 | 146 | (22.4%) | 2834 | (44.3%) | |
| Hospital Location | ||||||
| Metropolitan | 6004 | 557 | (85.6%) | 5447 | (85.1%) | 0.689 |
| Rural | 142 | 9 | (1.4%) | 133 | (2.1%) | |
| Urban | 894 | 84 | (12.9%) | 810 | (12.7%) | |
| Unknown | 10 | 1 | (.2%) | 9 | (.1%) | |
| Laterality | ||||||
| Right | 3839 | 334 | (51.3%) | 3505 | (54.8%) | 0.09 |
| Left | 3211 | 317 | (48.7%) | 2894 | (45.2%) | |
| Tumor Size | ||||||
| 0 – 1.9 cm | 1695 | 274 | (42.1%) | 1421 | (22.2%) | <0.001 |
| 2.0 – 2.7 cm | 1903 | 174 | (26.7%) | 1729 | (27.0%) | |
| 2.8 – 3.7 cm | 1714 | 129 | (19.8%) | 1585 | (24.8%) | |
| 3.8 – 5.0 cm | 1373 | 59 | (9.1%) | 1314 | (20.5%) | |
| Tumor Location | ||||||
| Main Bronchus | 209 | 9 | (1.4%) | 200 | (3.1%) | 0.007 |
| Upper Lobe | 4261 | 436 | (67.0%) | 3825 | (59.8%) | |
| Middle Lobe | 319 | 25 | (3.8%) | 294 | (4.6%) | |
| Lower Lobe | 2071 | 166 | (25.5%) | 1905 | (29.8%) | |
| Overlapping Lung | 32 | 2 | (.3%) | 30 | (.5%) | |
| Lung, NOS | 158 | 13 | (2.0%) | 145 | (2.3%) | |
| % of families below poverty level | ||||||
| 0–20th Percentile | 1386 | 128 | (19.7%) | 1258 | (19.7%) | <0.001 |
| 21–40th Percentile | 1131 | 109 | (16.7%) | 1022 | (16.0%) | |
| 41–60th Percentile | 1857 | 206 | (31.6%) | 1651 | (25.8%) | |
| 61–80th Percentile | 1046 | 63 | (9.7%) | 983 | (15.4%) | |
| 81–100th Percentile | 1630 | 145 | (22.3%) | 1485 | (23.2%) | |
| % with less than high school education | ||||||
| 0–20th Percentile | 1525 | 145 | (22.3%) | 1380 | (21.6%) | 0.013 |
| 21–40th Percentile | 1592 | 174 | (26.7%) | 1418 | (22.2%) | |
| 41–60th Percentile | 1623 | 141 | (21.7%) | 1482 | (23.2%) | |
| 61–80th Percentile | 1285 | 120 | (18.4%) | 1165 | (18.2%) | |
| 81–100th Percentile | 1025 | 71 | (10.9%) | 954 | (14.9%) | |
| Histology | ||||||
| NSCLC, NOS | 1868 | 0 | (.0%) | 1868 | (29.2%) | <0.001 |
| Squamous Cell Carcinoma | 2208 | 0 | (.0%) | 2208 | (34.5%) | |
| Adenocarcinoma | 2195 | 0 | (.0%) | 2195 | (34.3%) | |
| Other Histology | 128 | 0 | (.0%) | 128 | (2.0%) | |
| Not Available | 651 | 651 | (100.0%) | 0 | (.0%) | |
| Grade | ||||||
| 1 | 399 | 0 | (.0%) | 399 | (6.2%) | <0.001 |
| 2 | 978 | 0 | (.0%) | 978 | (15.3%) | |
| 3–4 | 1776 | 0 | (.0%) | 1776 | (27.8%) | |
| Unknown/Other | 3897 | 651 | (100.0%) | 3246 | (50.7%) | |
NSCLC – non-small cell lung cancer; NOS – not otherwise specified
Survival Outcomes for Entire Cohort
On univariate analysis, patients with a clinical diagnosis had an improved OS, the 2-year OS for patients with a clinical diagnosis was 57.3% versus 50.7% for patients with a pathologic diagnosis (p=0.026). The 5-year OS was 21.2% versus 21% for patients with a clinical versus pathologic diagnosis, respectively. Patients with a clinical diagnosis had a 2-year CSS of 74.1% versus 63.1% for patients with a pathologic diagnosis (p<0.001). The 5-year CSS was 48.8% versus 38.1% for patients with a clinical or pathologic diagnosis, respectively. On multivariable analysis, clinical diagnosis was no longer associated with an improved OS (Figure 2, HR 1.01 95% CI 0.90–1.13, p=0.872) but was associated with an improved CSS (sHR 0.82 95% CI 0.71–0.96 p=0.013) (Table 2). Factors associated with an inferior CSS included male gender (sHR 1.11 95% CI 1.02–1.21 p=0.015), T2 disease (sHR 1.20 95% CI 1.06–1.37 95% p=0.005), tumor size 2.0–2.7 cm (sHR 1.27 95% CI 1.12–1.43 p<0.001), tumor size 2.8–3.7 cm (sHR 1.47 95% CI 1.28–1.71 p<0.001), and tumor size 3.8–5.0 cm (sHR 1.91 95% CI 1.60–2.28 p<0.001). Patients with an upper lobe tumor had an improved CSS (sHR 0.76 95% CI 0.60–0.96 p=0.020).
Figure 2: Adjusted overall survival curves using Cox proportional hazards model stratified by method of diagnosis (p=0.872).
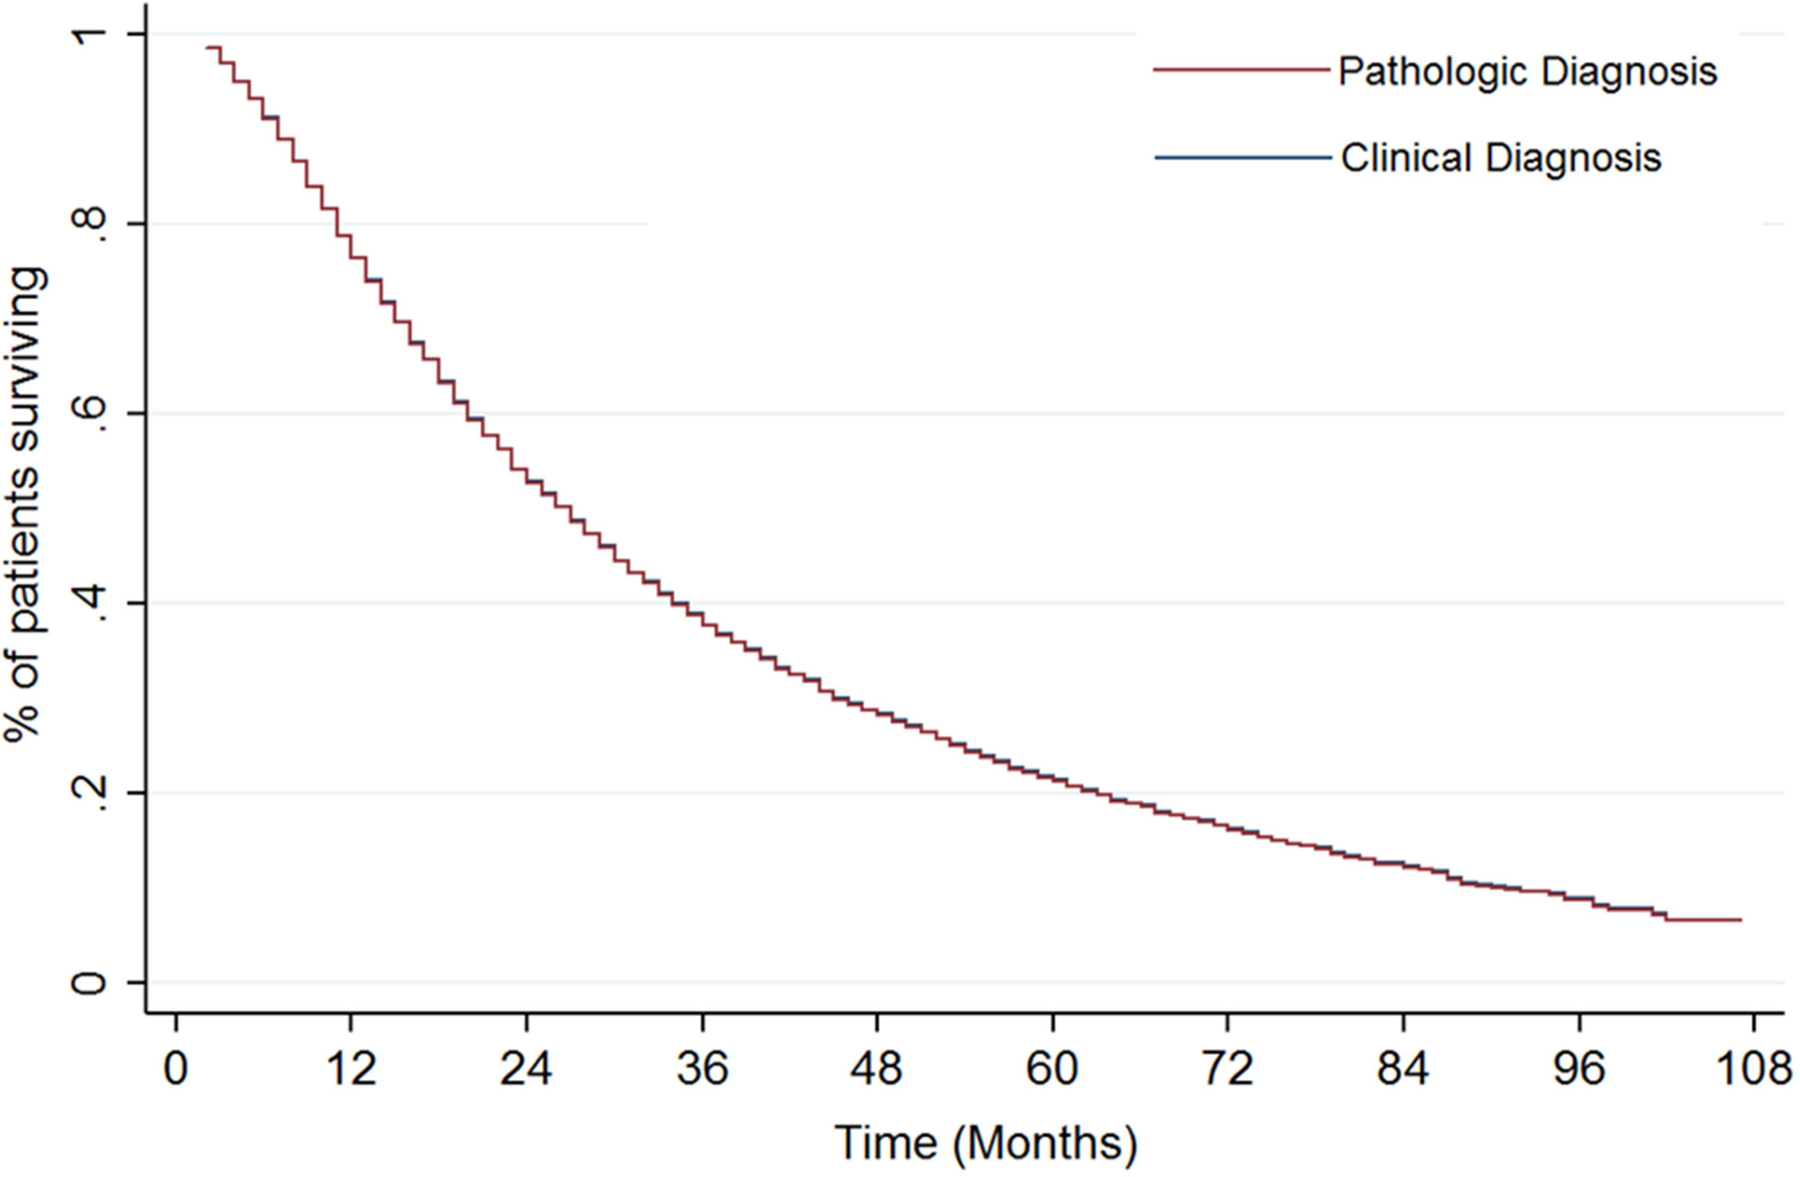
*Model controlling for age, race, gender, marital status, laterality, tumor location, poverty level, income level, education status. Note: Adjusted survival curves according to diagnosis type (clinical versus diagnosis) superimposed due to Hazard Ratio of 1.01.
Table 2:
Cox proportional hazards model for overall survival and competing risk regression for cause specific survival
| Overall Survival | Cause Specific Survival | |||||||
|---|---|---|---|---|---|---|---|---|
| HR | 95% CI | p-value | sHR | 95% CI | p-value | |||
| Age | ||||||||
| ≤65 years old | Reference | Reference | ||||||
| 66–80 years old | 1.22 | 1.12 | 1.33 | <0.001 | 0.99 | 0.88 | 1.08 | 0.673 |
| >80 years old | 1.28 | 1.16 | 1.41 | <0.001 | 0.91 | 0.81 | 1.03 | 0.139 |
| Diagnosis Type | ||||||||
| Pathologic | Reference | Reference | ||||||
| Clinical | 1.01 | 0.90 | 1.13 | 0.872 | 0.83 | 0.71 | 0.96 | 0.013 |
| Race | ||||||||
| White | Reference | Reference | ||||||
| Black | 1.14 | 0.97 | 1.35 | 0.108 | 0.90 | 0.79 | 1.03 | 0.134 |
| Other/Unknown | 1.04 | 0.86 | 1.26 | 0.675 | 1.01 | 0.84 | 1.22 | 0.887 |
| Gender | ||||||||
| Female | Reference | Reference | ||||||
| Male | 1.30 | 1.22 | 1.39 | <0.001 | 1.11 | 1.02 | 1.21 | 0.015 |
| Marital Status | ||||||||
| Married | Reference | Reference | ||||||
| Single/Separated/Divorced/Widowed | 1.06 | 0.89 | 1.27 | 0.526 | 1.04 | 0.95 | 1.13 | 0.371 |
| Unknown, Unmarried or domestic partner | 1.12 | 0.94 | 1.33 | 0.223 | 0.87 | 0.70 | 1.09 | 0.226 |
| Clinical Stage | ||||||||
| T1 | Reference | Reference | ||||||
| T2 | 1.06 | 0.96 | 1.18 | 0.256 | 1.20 | 1.06 | 1.37 | 0.005 |
| Laterality | ||||||||
| Right | Reference | Reference | ||||||
| Left | 1.02 | 0.96 | 1.09 | 0.565 | 1.02 | 0.99 | 1.07 | 0.128 |
| Tumor Size | ||||||||
| 0 – 1.9 cm | Reference | Reference | ||||||
| 2.0 – 2.7 cm | 1.22 | 1.11 | 1.33 | <0.001 | 1.27 | 1.12 | 1.43 | <0.001 |
| 2.8 – 3.7 cm | 1.37 | 1.22 | 1.53 | <0.001 | 1.47 | 1.28 | 1.71 | <0.001 |
| 3.8 – 5.0 cm | 1.63 | 1.42 | 1.87 | <0.001 | 1.91 | 1.60 | 2.28 | <0.001 |
| Tumor Location | ||||||||
| Main Bronchus | Reference | Reference | ||||||
| Upper Lobe | 0.77 | 0.64 | 0.93 | 0.007 | 0.76 | 0.60 | 0.96 | 0.020 |
| Middle Lobe | 0.86 | 0.68 | 1.08 | 0.198 | 0.81 | 0.61 | 1.09 | 0.173 |
| Lower Lobe | 0.82 | 0.68 | 0.99 | 0.044 | 0.83 | 0.65 | 1.05 | 0.124 |
| Overlapping Lung | 0.74 | 0.43 | 1.27 | 0.277 | 0.68 | 0.35 | 1.33 | 0.265 |
| Lung, NOS | 0.74 | 0.56 | 0.99 | 0.046 | 0.79 | 0.55 | 1.13 | 0.190 |
| % of families below poverty level | ||||||||
| 0–20th Percentile | Reference | Reference | ||||||
| 21–40th Percentile | 0.91 | 0.81 | 1.02 | 0.094 | 1.06 | 0.92 | 1.22 | 0.426 |
| 41–60th Percentile | 0.96 | 0.86 | 1.08 | 0.518 | 1.03 | 0.89 | 1.19 | 0.712 |
| 61–80th Percentile | 1.07 | 0.94 | 1.23 | 0.290 | 1.18 | 1.00 | 1.40 | 0.057 |
| 81–100th Percentile | 1.06 | 0.93 | 1.22 | 0.378 | 1.11 | 0.94 | 1.31 | 0.228 |
| % with less than high school education | ||||||||
| 0–20th Percentile | Reference | Reference | ||||||
| 21–40th Percentile | 1.10 | 0.99 | 1.22 | 0.071 | 1.03 | 0.90 | 1.17 | 0.715 |
| 41–60th Percentile | 0.95 | 0.84 | 1.07 | 0.380 | 1.02 | 0.88 | 1.19 | 0.755 |
| 61–80th Percentile | 1.02 | 0.90 | 1.16 | 0.703 | 1.10 | 0.94 | 1.28 | 0.255 |
| 81–100th Percentile | 1.01 | 0.87 | 1.16 | 0.934 | 1.04 | 0.87 | 1.25 | 0.646 |
Impact of Tumor Size and Clinical T-Stage
Stratifying patients into quartiles according to tumor size resulted in the following groups: 0 to 1.9 cm, 2 to 2.7 cm, 2.8 to 3.7 cm, 3.8 to 5 cm. There was no difference in OS according to a clinical or pathologic diagnosis between the quartile groups. Patients with tumors between 0 to 1.9 cm had an improved CSS (Figure 3A; sHR 0.74 95% CI 0.58–0.99 p=0.040) in the clinical diagnosis group after adjusting for all covariates. There was a trend towards an improved CSS in patients with 2.0 to 2.7 cm tumors (sHR 0.78 95% CI 0.58–1.03 p=0.083). No other statistically significant associations were found, although there was a stepwise increase in the hazard ratio for CSS according to tumor size when comparing clinically diagnosed versus pathologically diagnosed tumors (2.8–3.7 cm: sHR 0.80 95% CI 0.58–1.10 p=0.163; 3.8–5 cm: sHR 1.13 95% CI 0.50–1.59 p=0.680).
Figure 3: Cumulative incidence estimates of cancer specific mortality using competing risk analysis stratified by method of diagnosis (p=0.013).
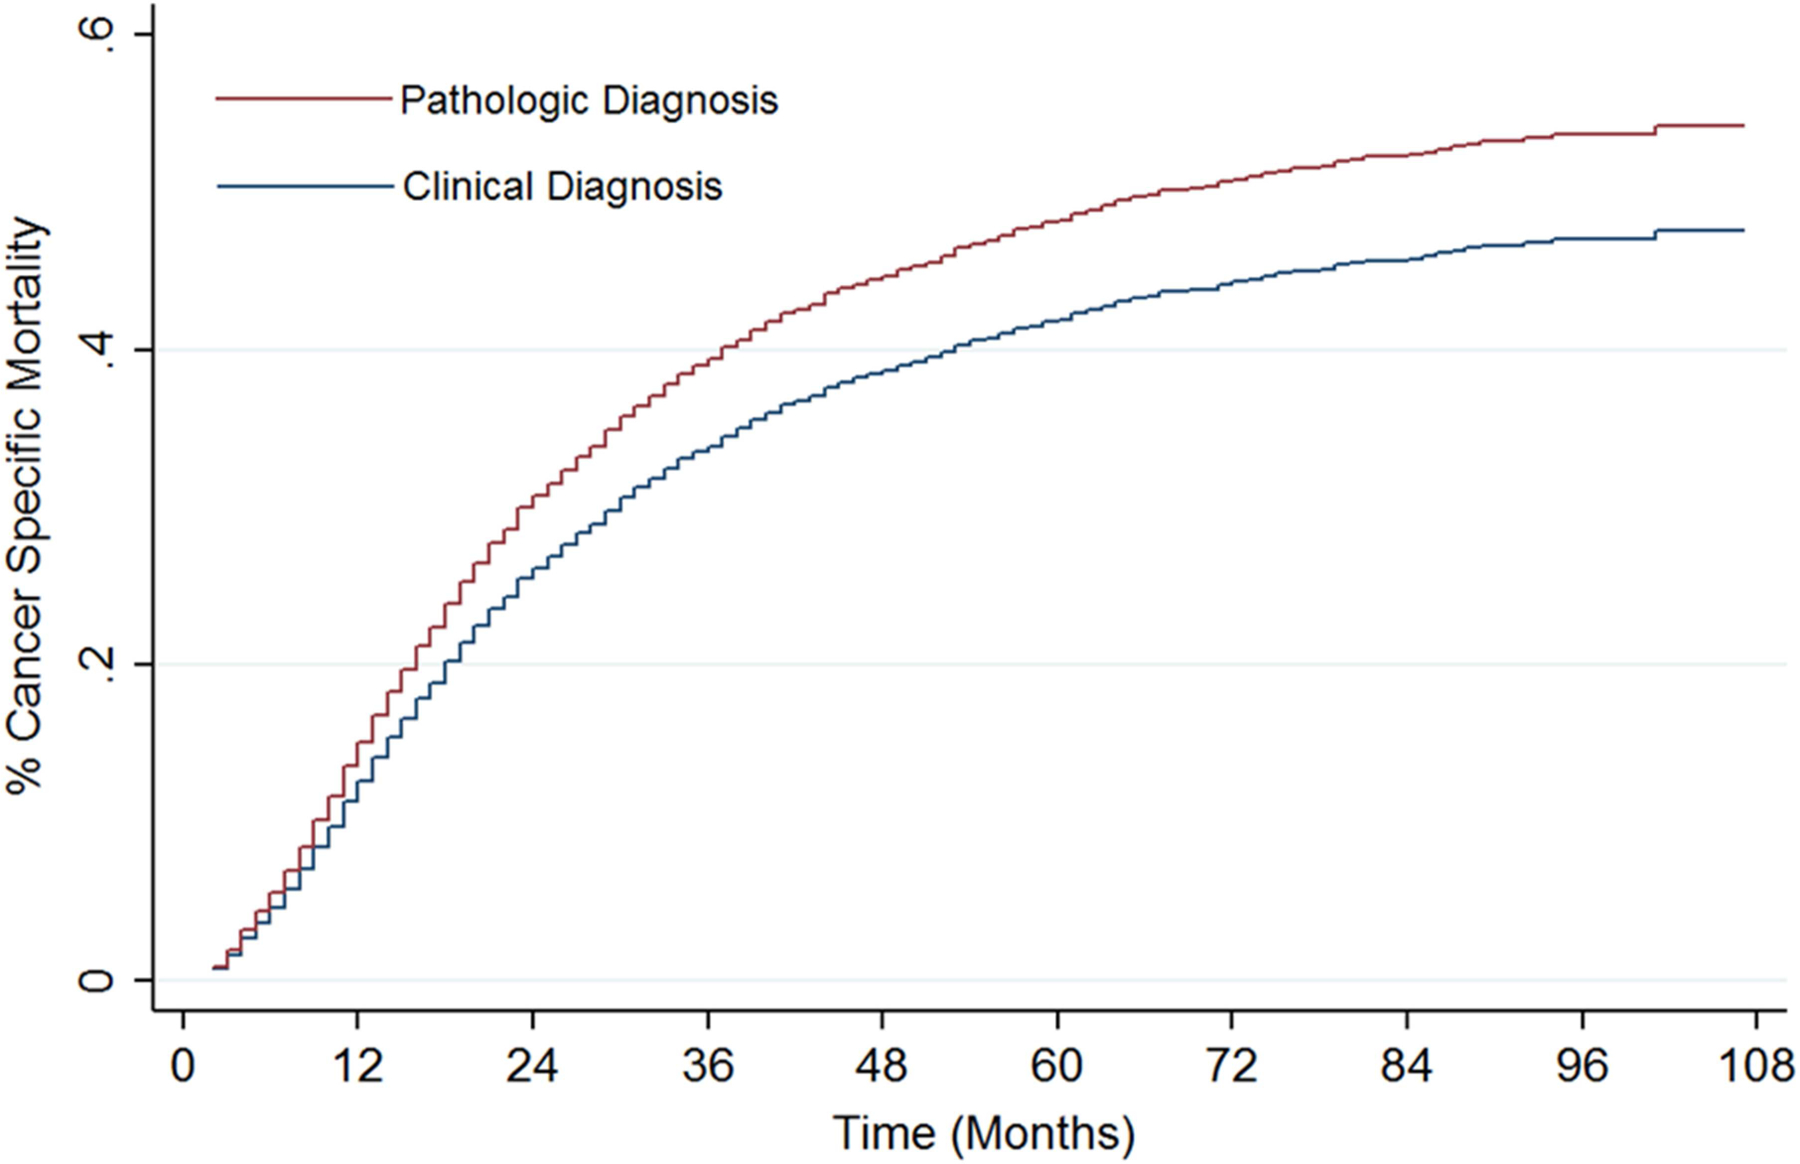
*Model controlling for age, race, gender, marital status, laterality, tumor location, poverty level, income level, education status.
When examining clinical T1a, T1b, or T2b tumors, there was no difference in OS according to whether a patient received a pathologic or clinical diagnosis. When examining CSS, patients with T1a disease receiving a clinical diagnosis had an improved CSS (sHR 0.75 95% CI 0.58–0.96 p=0.022) after adjusting for all covariates (Figure 3B). There was a trend towards improved CSS in patients with clinical T1b tumors (sHR 0.74 95% CI 0.55–1.00 p=0.052). There was no impact on CSS in patients with clinical T2a tumors (sHR 0.99 95% CI 0.77–1.26 p=0.906).
DISCUSSION
The main finding of this study is the difference in CSS in patients undergoing clinical versus pathologic diagnosis for Stage I lung cancer without any difference in OS. We hypothesize that the disparity in CSS between patients diagnosed clinically versus pathologically may be due to a greater number of patients in the clinical diagnosis arm having benign disease (e.g. infection), which precludes them from developing a cancer related death. With an increasing number of early stage lung cancers being diagnosed with the adoption of national lung screening guidelines, this becomes an increasingly important observation and potential limitation of current clinical practice. Although a certain percentage of false positive results are expected when treating non-biopsied lung cancer, careful observation and verification is needed to ensure proper management of smaller lesions in particular.
After noting a difference in CSS according to the method of diagnosis, we examined patients according to tumor size and clinical T stage. In our subgroup analysis, there was a stepwise increase in the hazard ratio according to tumor size with an improved CSS in patients with smaller tumors and no difference in CSS in patients with larger lesions. Similarly, patients with clinical T1a disease had an improved CSS without an impact on OS on multivariable analysis. Patients with T1b disease had a trend towards improved CSS while there was no difference in outcomes when examining the clinical T2a cohort. Our results are not surprising; increasing tumor size has been associated with an increased risk of malignancy in multiple analyses11–13. In the NELSON trial, patients with tumor nodules ≥ 2 cm had a lung cancer probability of 25–31.6% versus 0.3–19.6% in patients with tumors <2 cm14. As there is no scientific basis to hypothesize that omission of a biopsy would improve oncologic outcomes, the disparity in CSS outcomes between patients with smaller tumors may be due to the higher rate of benign lung nodules in patients with smaller pulmonary nodules. A previous analysis of the Amsterdam Cancer Registry demonstrated that patients without pathologic staging had an inferior OS, likely due to a higher rate of underlying comorbidities in these patients which precluded them from undergoing a biopsy15. Data regarding CSS was not presented in this analysis. In our analysis, the method of diagnosis did not have an impact on OS on multivariable analysis. A large retrospective series by Verstegen et al evaluated the impact of pathologic versus clinical diagnosis on a cohort of 591 patients undergoing SBRT4. In the analysis by Verstegen et al, there was no difference in survival or recurrence rates between the two cohorts. An important distinction in this analysis is the utilization of PET-directed therapy and the low rates of benign disease in the Netherlands population16. Additionally, the Netherlands is a more homogeneous population of 16.8 million people, 78% of Dutch ethnicity, occupying approximately 16,000 square miles. It may be that it is more difficult to predict malignancy in the United States, with more varied geography extending over approximately 3.7 million square miles, and a diverse population of 319 million.
We identified no change in the percentage of patients undergoing clinical diagnosis during the study time period. Our results are contrary to those published by Rutter et al which demonstrated a trend towards an increase in patients undergoing SBRT without pathologic confirmation in the National Cancer Database (NCDB)17. In their analysis of patients treated from 2003 to 2011, 4.5% did not have a pathologic confirmation versus 9.2% in the present analysis. The disparity between these analyses may be due to the differences in registry coding as well as the increasing number of reporting facilities in the NCDB from 2003 to 2011. Furthermore, NCDB specifically codes for radiation dose and treatment modality and is limited to commission on cancer accredited facilities, therefore generally reporting data of higher volume centers. Regardless, with the increasing adoption of radiation therapy for early stage lung cancer, the total absolute number of patients being diagnosed clinically has increased. Identifying better ways to identify a malignancy clinically is imperative to avoid unnecessary overtreatment.
Overtreatment of presumed malignant lung nodules has also been demonstrated in the surgical literature. Cerfolio et al examined 2171 patients who presented with presumed, resectable non-small cell lung cancer. Of the 721 patients with clinical stage I disease, 14% were found to have benign pathology after surgery18. Similarly, a large retrospective surgical series reported on outcomes of patients without a histologic diagnosis before surgery19. Of 516 patients without pre-operative pathology, surgical resection demonstrated a benign etiology in 13.4% of cases. In a joint analysis of the STARS/ROSEL trials, one of the 27 (3.7%) patients undergoing surgery for presumed malignancy had benign disease20. Our results are consistent with the above literature. The benefit in CSS in patients with a clinical diagnosis suggests that a subset of these patients may not have had an underlying malignancy. The results presented in this analysis are akin to those demonstrated in the genitourinary literature; contemporary reports have suggested that up to 16% of small renal masses are benign at surgery21. Because of the growing recognition of overtreatment of small renal masses, the American Urological Association released guidelines for the management of such nodules. A recent analysis demonstrated a decrease in aggressive surgical management of such lesions22.
Due to the patient population being referred for SBRT, identifying non-invasive means of diagnosing cancer is increasingly important. Multiple validated predictive models exist that attempt to identify a malignancy based on clinical and imaging characteristics11, 23, 24. Despite this, evaluation and management of pulmonary nodules is not consistently performed according to guidelines. An analysis of 300 patients evaluated at Veterans Affairs hospitals demonstrated that 44.7% of patients received care inconsistent with guidelines25. Current guidelines state that patients being considered for SBRT should ideally have pathologic confirmation of a lung cancer although it is reasonable to consider treatment if the pretest probability of a malignancy is greater than 65%26. As a result, it is expected that treating a certain number of benign nodules outweighs the risk of subjecting all patients to an invasive biopsy, with the risk of pneumothorax, bleeding, and other complications. In addition, simply observing patients who are not candidates for undergoing an invasive procedure may result in disease progression and death if untreated. Due to the relatively low morbidity and mortality from SBRT, treating potentially benign disease appears acceptable. A decision analysis by Louie et al, suggested that treatment of solitary pulmonary nodule is justified if there is >85% likelihood of disease based on clinical history and imaging27. Our data suggests that particularly in patients with small tumors, better ways to discriminate between benign and malignant lesions is important. Patients with clinical T1a tumors may be at a higher risk for overtreatment due to the difficulty in differentiating between benign and malignant lesions in this group of patients.
There are several limitations to this study. As with all large cancer registries, the available data is limited by possible misclassification due to coding errors and incomplete patient and treatment information. Therefore, inaccuracies may have resulted in more clinically diagnosed patients as being coded as having a non-cancer death. The registry also does not include information regarding patient comorbidities or performance status. It is likely that the patients who underwent clinical diagnosis were not able to tolerate an invasive procedure due to comorbidities or patient preference. Furthermore, the SEER database does not include specific details regarding radiation treatment modality or dose. As a result, although SBRT is the recommended radiation technique in patients with early stage disease, we are unable to verify the method of treatment. However, this would be expected to be similar in both groups. Finally, our study does not include specific imaging details. As a result, we are not able to control for positron emission tomography or nodule growth characteristics use that have been increasingly adopted in patients with early stage disease to estimate likelihood of malignancy. Despite these limitations, the present data suggests that patients undergoing radiation therapy for a presumed early stage lung cancer may be over treated.
In conclusion, our results suggest that patients undergoing radiation therapy who are diagnosed with clinical T1a disease are at risk of overtreatment, particularly if they have smaller lesions. Attempting to obtain pathologic confirmation in these patients is important to avoid treatment in patients who may not have a malignancy. For patients who are not candidates for a histologic diagnosis, the potential for overtreatment should be discussed prior to proceeding with definitive therapy and weighed against potential toxicity. Use of a validated predictive model in those patients where pathologic confirmation is unduly risky may aid this discussion. With the increasing number of early stage lung cancers being diagnosed with the adoption of national lung screening guidelines, identifying non-invasive means to establish malignancy has become increasingly important.
Figure 4: Competing risk regression model for cause specific survival stratified by quartile tumor size (A) and clinical stage (B) for patients with a clinical or pathologic diagnosis.
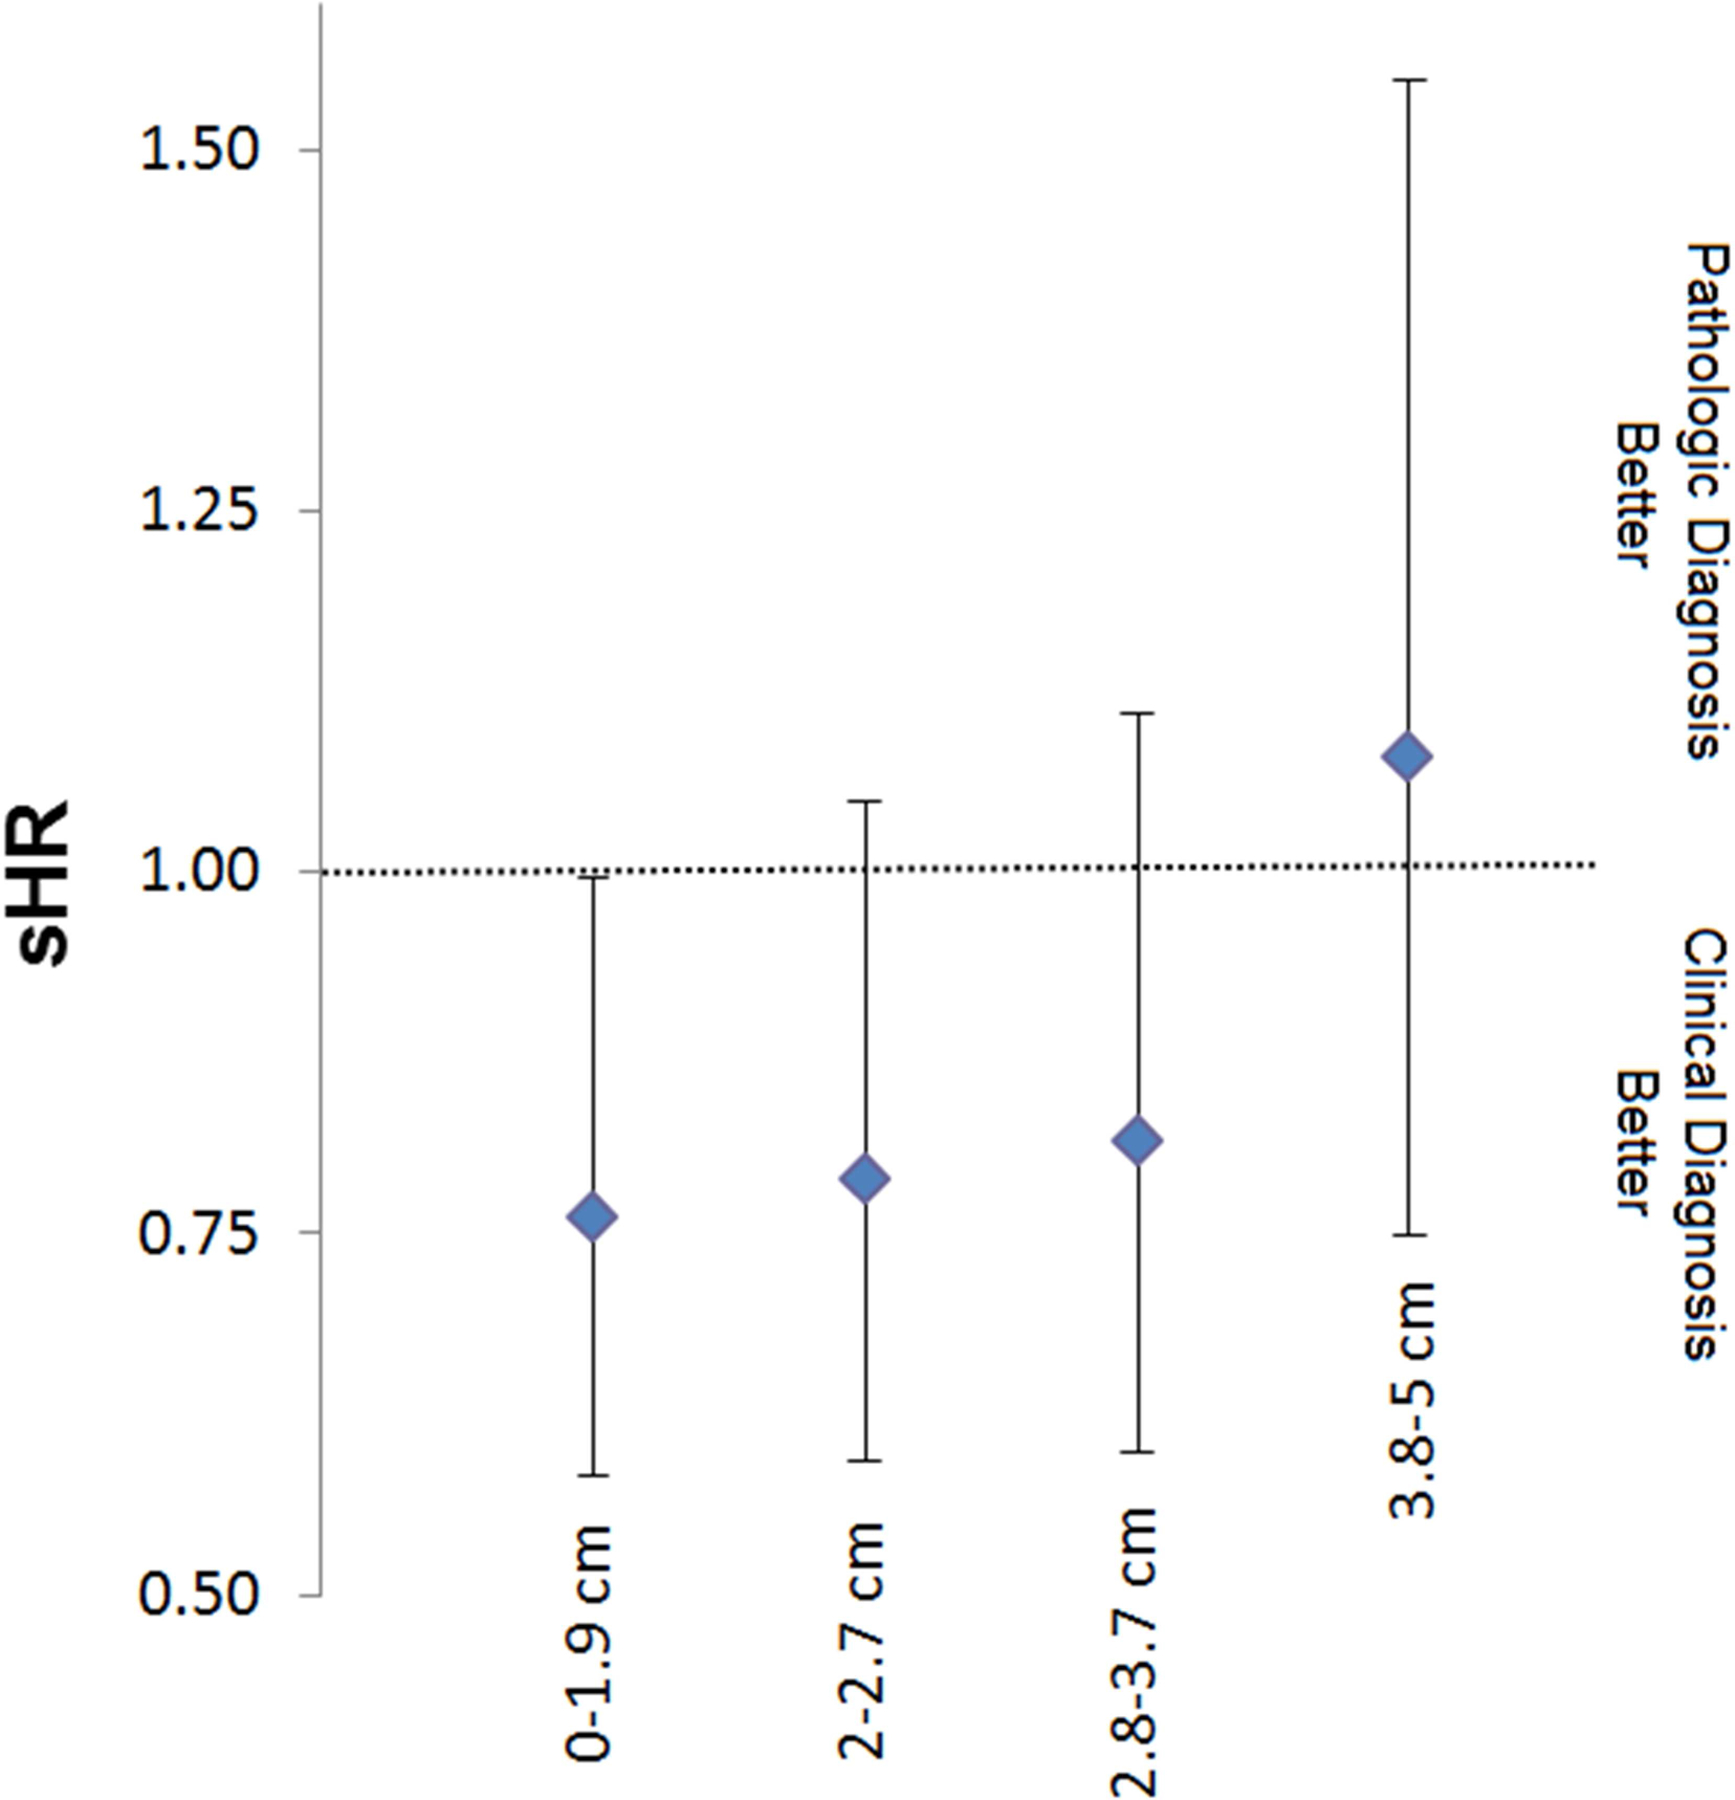
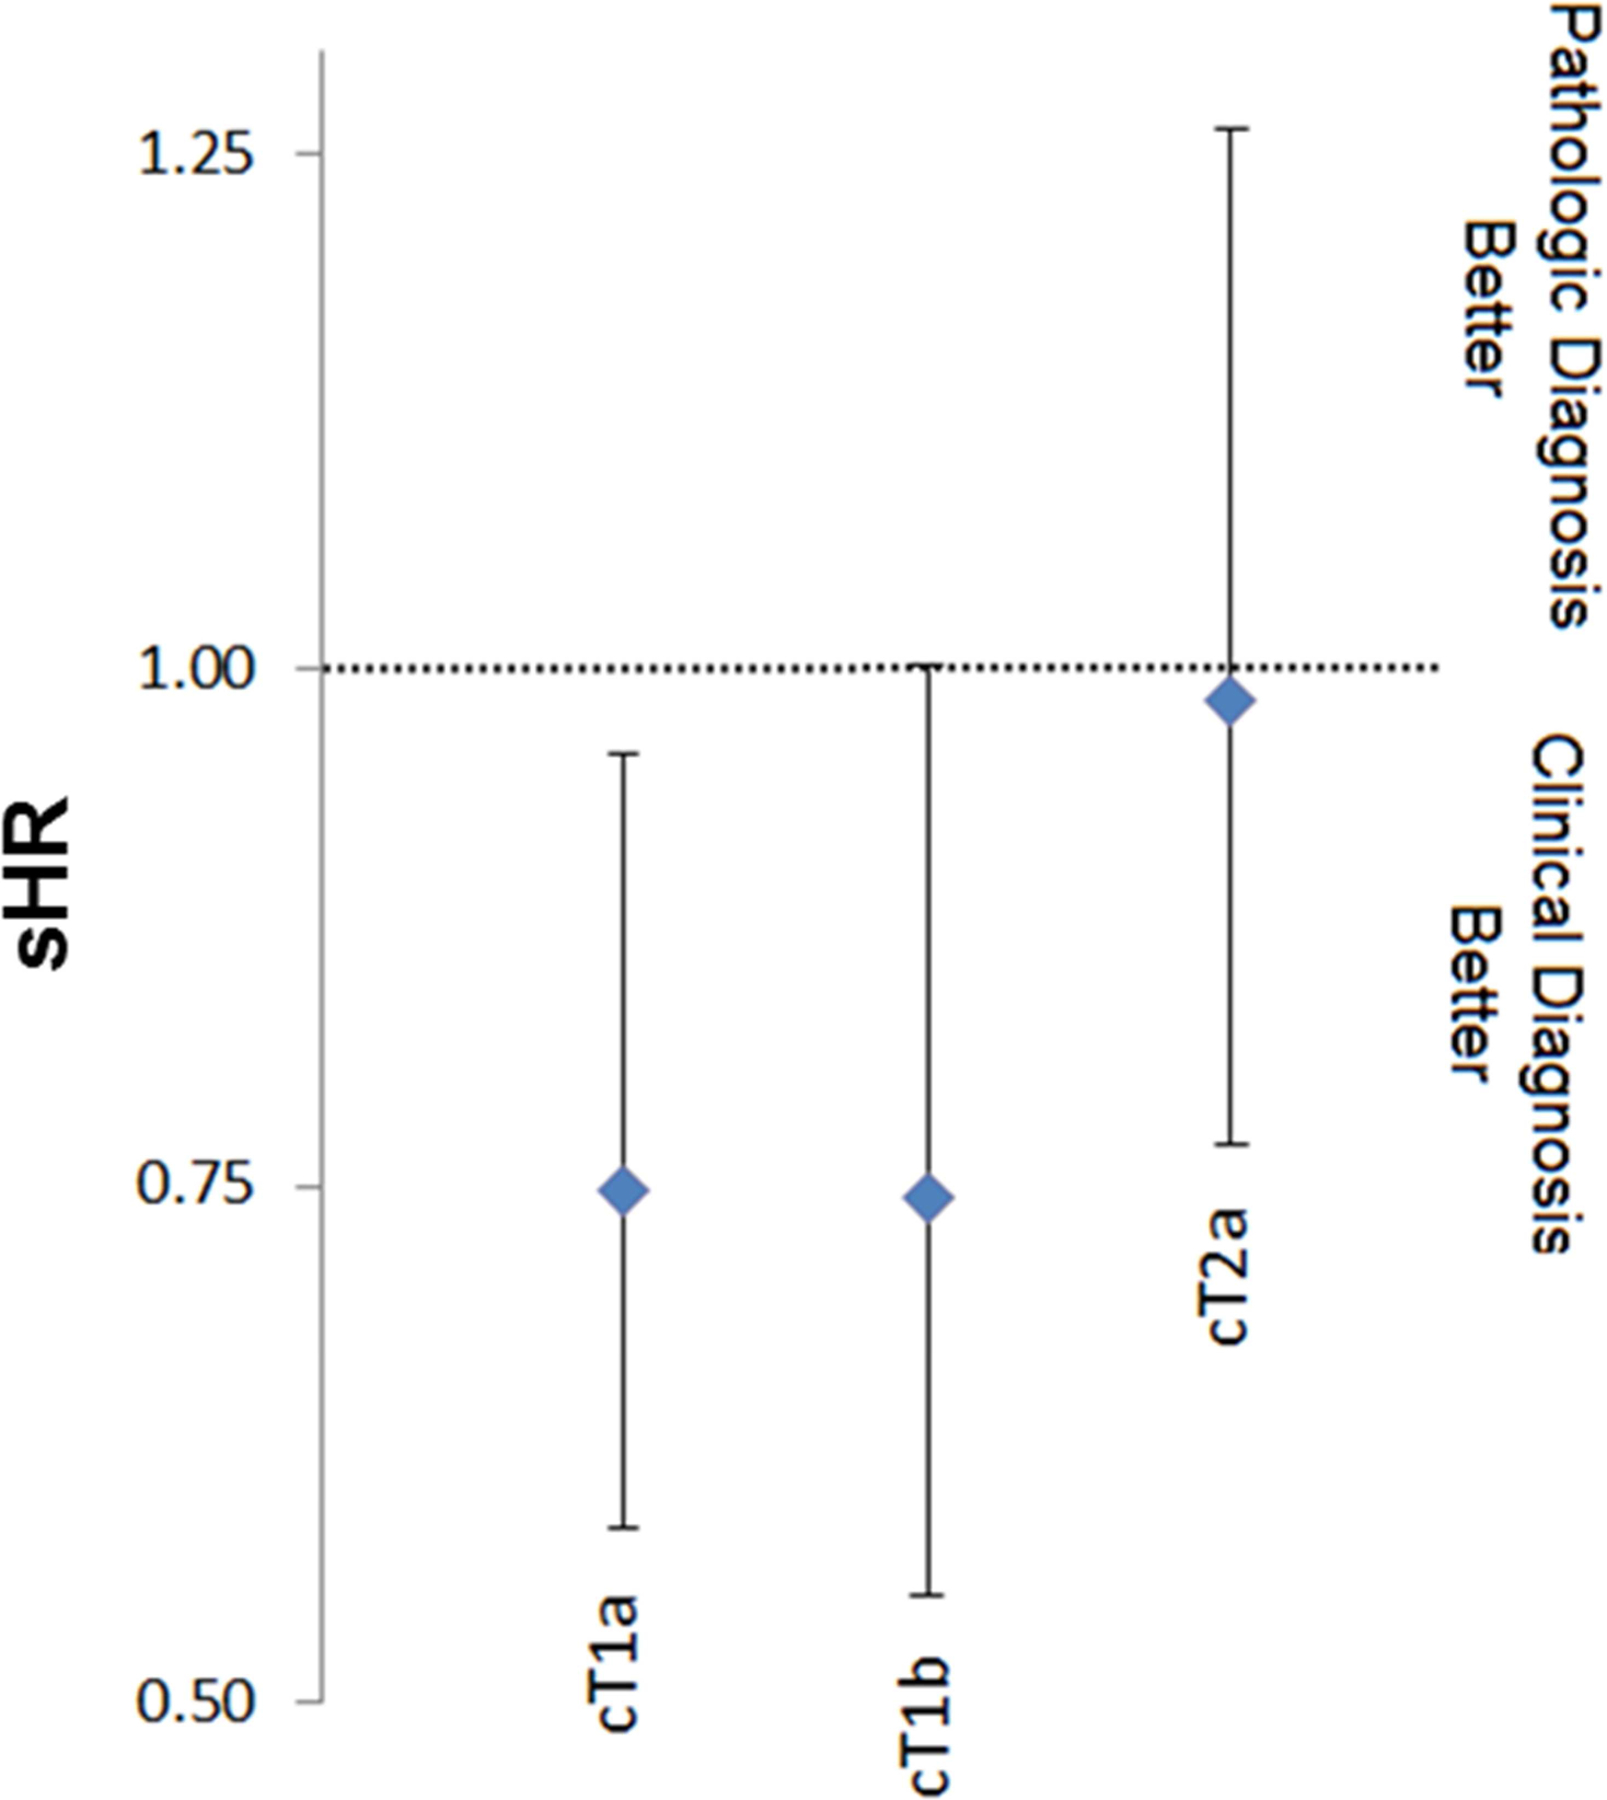
*Model controlling for age, race, gender, marital status, laterality, tumor location, poverty level, income level, education status.
Acknowledgements:
This publication was supported by grant number P30 CA006927 from the National Cancer Institute, NIH. Its contents are solely the responsibility of the authors and do not necessarily represent the official views of the National Cancer Institute or the National Institutes of Health.
Footnotes
Publisher's Disclaimer: This is a PDF file of an unedited manuscript that has been accepted for publication. As a service to our customers we are providing this early version of the manuscript. The manuscript will undergo copyediting, typesetting, and review of the resulting proof before it is published in its final citable form. Please note that during the production process errors may be discovered which could affect the content, and all legal disclaimers that apply to the journal pertain.
Conflicts of Interest: None
References
- 1.Siegel RL, Miller KD, Jemal A. Cancer statistics, 2015. CA: a cancer journal for clinicians 2015;65:5–29. [DOI] [PubMed] [Google Scholar]
- 2.Ettinger DS, Wood DE, Akerley W, et al. Non-Small Cell Lung Cancer, Version 6.2015. Journal of the National Comprehensive Cancer Network: JNCCN 2015;13:515–524. [DOI] [PubMed] [Google Scholar]
- 3.De Wever W, Stroobants S, Coolen J, et al. Integrated PET/CT in the staging of nonsmall cell lung cancer: technical aspects and clinical integration. Eur Respir J 2009;33:201–212. [DOI] [PubMed] [Google Scholar]
- 4.Verstegen NE, Lagerwaard FJ, Haasbeek CJ, et al. Outcomes of stereotactic ablative radiotherapy following a clinical diagnosis of stage I NSCLC: comparison with a contemporaneous cohort with pathologically proven disease. Radiotherapy and oncology: journal of the European Society for Therapeutic Radiology and Oncology 2011;101:250–254. [DOI] [PubMed] [Google Scholar]
- 5.Harkenrider MM, Bertke MH, Dunlap NE. Stereotactic body radiation therapy for unbiopsied early-stage lung cancer: a multi-institutional analysis. American journal of clinical oncology 2014;37:337–342. [DOI] [PubMed] [Google Scholar]
- 6.Sakanaka K, Matsuo Y, Nagata Y, et al. Safety and effectiveness of stereotactic body radiotherapy for a clinically diagnosed primary stage I lung cancer without pathological confirmation. Int J Clin Oncol 2014;19:814–821. [DOI] [PubMed] [Google Scholar]
- 7.Yoshitake T, Nakamura K, Shioyama Y, et al. Stereotactic body radiation therapy for primary lung cancers clinically diagnosed without pathological confirmation: a single-institution experience. Int J Clin Oncol 2015;20:53–58. [DOI] [PubMed] [Google Scholar]
- 8.Warren JL, Klabunde CN, Schrag D, et al. Overview of the SEER-Medicare data: content, research applications, and generalizability to the United States elderly population. Med Care 2002;40:IV-3–18. [DOI] [PubMed] [Google Scholar]
- 9.Edge SB, American Joint Committee on Cancer., American Cancer Society. AJCC cancer staging handbook: from the AJCC cancer staging manual. New York: Springer; 2010. [Google Scholar]
- 10.Fine JP, Gray RJ. A proportional hazards model for the subdistribution of a competing risk. J Am Stat Assoc 1999;94:496–509. [Google Scholar]
- 11.Gould MK, Ananth L, Barnett PG, et al. A clinical model to estimate the pretest probability of lung cancer in patients with solitary pulmonary nodules. Chest 2007;131:383–388. [DOI] [PMC free article] [PubMed] [Google Scholar]
- 12.Henschke CI, Yankelevitz DF, Naidich DP, et al. CT screening for lung cancer: suspiciousness of nodules according to size on baseline scans. Radiology 2004;231:164–168. [DOI] [PubMed] [Google Scholar]
- 13.Henschke CI, Yankelevitz DF, Mirtcheva R, et al. CT screening for lung cancer: frequency and significance of part-solid and nonsolid nodules. AJR Am J Roentgenol 2002;178:1053–1057. [DOI] [PubMed] [Google Scholar]
- 14.Horeweg N, van Rosmalen J, Heuvelmans MA, et al. Lung cancer probability in patients with CT-detected pulmonary nodules: a prespecified analysis of data from the NELSON trial of low-dose CT screening. The lancet oncology 2014;15:1332–1341. [DOI] [PubMed] [Google Scholar]
- 15.Palma D, Visser O, Lagerwaard FJ, et al. Impact of introducing stereotactic lung radiotherapy for elderly patients with stage I non-small-cell lung cancer: a population-based time-trend analysis. Journal of clinical oncology: official journal of the American Society of Clinical Oncology 2010;28:5153–5159. [DOI] [PubMed] [Google Scholar]
- 16.van Tinteren H, Hoekstra OS, Smit EF, et al. Effectiveness of positron emission tomography in the preoperative assessment of patients with suspected non-small-cell lung cancer: the PLUS multicentre randomised trial. Lancet 2002;359:1388–1393. [DOI] [PubMed] [Google Scholar]
- 17.Rutter CE, Corso CD, Park HS, et al. Increase in the use of lung stereotactic body radiotherapy without a preceding biopsy in the United States. Lung Cancer 2014;85:390–394. [DOI] [PubMed] [Google Scholar]
- 18.Cerfolio RJ, Bryant AS. Survival of patients with true pathologic stage I non-small cell lung cancer. The Annals of thoracic surgery 2009;88:917–922; discussion 922–913. [DOI] [PubMed] [Google Scholar]
- 19.Sawada SY M; Komori E; Nogami N; Oze I; Segawa Y; Shinkai T. Evaluation of resected tumors that were not diagnosed histologically but were suspected of lung cancer preoperatively. Journal of Thoracic Oncology 2007;2:S422. [Google Scholar]
- 20.Chang JY, Senan S, Paul MA, et al. Stereotactic ablative radiotherapy versus lobectomy for operable stage I non-small-cell lung cancer: a pooled analysis of two randomised trials. The lancet oncology 2015;16:630–637. [DOI] [PMC free article] [PubMed] [Google Scholar]
- 21.Kutikov A, Fossett LK, Ramchandani P, et al. Incidence of benign pathologic findings at partial nephrectomy for solitary renal mass presumed to be renal cell carcinoma on preoperative imaging. Urology 2006;68:737–740. [DOI] [PubMed] [Google Scholar]
- 22.Huang WC, Atoria CL, Bjurlin M, et al. Management of Small Kidney Cancers in the New Millennium: Contemporary Trends and Outcomes in a Population-Based Cohort. JAMA Surg 2015;150:664–672. [DOI] [PubMed] [Google Scholar]
- 23.McWilliams A, Tammemagi MC, Mayo JR, et al. Probability of cancer in pulmonary nodules detected on first screening CT. The New England journal of medicine 2013;369:910–919. [DOI] [PMC free article] [PubMed] [Google Scholar]
- 24.Herder GJ, van Tinteren H, Golding RP, et al. Clinical prediction model to characterize pulmonary nodules: validation and added value of 18F-fluorodeoxyglucose positron emission tomography. Chest 2005;128:2490–2496. [DOI] [PubMed] [Google Scholar]
- 25.Wiener RS, Gould MK, Slatore CG, et al. Resource use and guideline concordance in evaluation of pulmonary nodules for cancer: too much and too little care. JAMA Intern Med 2014;174:871–880. [DOI] [PMC free article] [PubMed] [Google Scholar]
- 26.Gould MK, Donington J, Lynch WR, et al. Evaluation of individuals with pulmonary nodules: when is it lung cancer? Diagnosis and management of lung cancer, 3rd ed: American College of Chest Physicians evidence-based clinical practice guidelines. Chest 2013;143:e93S–120S. [DOI] [PMC free article] [PubMed] [Google Scholar]
- 27.Louie AV, Senan S, Patel P, et al. When is a biopsy-proven diagnosis necessary before stereotactic ablative radiotherapy for lung cancer?: A decision analysis. Chest 2014;146:1021–1028. [DOI] [PubMed] [Google Scholar]