

Abstract
Background
Exosomes are small extracellular vesicles that function as intercellular messengers and effectors. Exosomal cargo contains regulatory small molecules, including miRNAs, mRNAs, lncRNAs, and small peptides that can be modulated by different pathological stimuli to the cells. One of the main mechanisms of action of drug therapy may be the altered production and/or content of the exosomes.
Methods and Results
We studied the effects on exosome production and content by neprilysin inhibitor/angiotensin receptor blockers, sacubitril/valsartan and valsartan alone, using human‐induced pluripotent stem cell‐derived cardiomyocytes under normoxic and hypoxic injury model in vitro, and assessed for physiologic correlation using an ischemic myocardial injury rodent model in vivo. We demonstrated that the treatment with sacubitril/valsartan and valsartan alone resulted in the increased production of exosomes by induced pluripotent stem cell‐derived cardiomyocytes in vitro in both conditions as well as in the rat plasma in vivo. Next‐generation sequencing of these exosomes exhibited downregulation of the expression of rno‐miR‐181a in the sacubitril/valsartan treatment group. In vivo studies employing chronic rodent myocardial injury model demonstrated that miR‐181a antagomir has a beneficial effect on cardiac function. Subsequently, immunohistochemical and molecular studies suggested that the downregulation of miR‐181a resulted in the attenuation of myocardial fibrosis and hypertrophy, restoring the injured rodent heart after myocardial infarction.
Conclusions
We demonstrate that an additional mechanism of action of the pleiotropic effects of sacubitril/valsartan may be mediated by the modulation of the miRNA expression level in the exosome payload.
Keywords: exosomes, mechanism of action, miRNAs, sacubitril/valsartan
Subject Categories: Myocardial Regeneration, Chronic Ischemic Heart Disease, Heart Failure, Myocardial Infarction, Remodeling
Nonstandard Abbreviations and Acronyms
- DEMRI
delayed gadolinium enhancement MRI
- DMSO
dimethyl sulfoxide
- HF
heart failure
- iCMs
induced pluripotent stem cell‐derived cardiomyocytes
- LAD
left anterior descending
- LV
left ventricular
- MEMRI
manganese‐enhanced MRI
- MI
myocardial infarction
- MRI
magnetic resonance imaging
- NC
negative control
Clinical Perspective
What Is New?
A novel mechanism of action of the pleiotropic effects of sacubitril/valsartan is mediated by the increased production of exosomes and the modulation of their molecular payload.
Sacubitril/valsartan treatment resulted in the downregulation of miR‐181a expression in the payload of circulating exosomes in a rodent model of chronic myocardial infarction.
The downregulation of miR‐181a resulted in the attenuation of myocardial fibrosis and pathological hypertrophy, restoring the rodent chronic heart failure model.
What Are the Clinical Implications?
The pharmacologic effects of sacubitril/valsartan in modulating exosome production and molecular payload describe a novel mechanism of action of the physiologic effects and provide a novel platform for pharmacogenomics.
Heart failure (HF) is the leading cause of hospital admission in the United States with an increasing mortality rate worldwide.1, 2, 3 The renin‐angiotensin‐aldosterone system is one of the key regulators of cardiovascular homeostasis that exerts its action through the angiotensin II–aldosterone axis. Abnormal cardiac function in HF activates the renin‐angiotensin‐aldosterone system and the sympathetic nervous system. The other counterregulatory pathway activated in HF includes the natriuretic peptide system. One of the key components of the natriuretic peptide system is neprilysin, which catalyzes the degradation of bradykinin, adrenimedullin, endothelin‐1, substance P, and angiotensin II. The inhibition of neprilysin increases the levels of salutary natriuretic peptide, causing vasodilation, diuresis, natriuresis, and reduced extracellular volume, which decreases the pathological fibrosis and myocardial hypertrophy. Sacubitril/valsartan, formerly known as LCZ696, was developed to address these 2 pathophysiological mechanisms of HF. It is a first‐in‐class angiotensin receptor inhibitor that simultaneously suppresses the renin‐angiotensin‐aldosterone system through blockade of angiotensin II type 1 receptors and the activation of vasoactive peptides through the inhibition of neprilysin, the enzyme responsible for their degradation.4
A double‐blind randomized trial, PARADIGM‐HF (Prospective Comparison of ARNI With ACEI to Determine Impact on Global Mortality and Morbidity in Heart Failure), demonstrated the benefit of sacubitril/valsartan in reducing the risk of death and hospitalization of patients with HF with reduced ejection fraction.5 Furthermore, all‐cause death decreased significantly; however, this analysis was not included in the study's primary end point. Sacubitril/valsartan treatment was reported to attenuate cardiac remodeling and dysfunction, inhibit fibrosis, and reduce hypertrophy in a rat model of HF after myocardial infarction (MI).6 Sacubitril/valsartan treatment prevented maladaptive cardiac fibrosis and dysfunction in a mouse model of left ventricular (LV) pressure overload.7 However, the molecular mechanism of this pleiotropic effect was not fully understood.
Exosomes are nano‐sized vesicles with a diameter ranging from 30 to 150 nm released from all cell types.8, 9 Exosomes contain biologically active cargo such as miRNAs, mRNAs, DNAs, small molecules, and proteins to mediate local and systemic cell‐to‐cell communication through the delivery of their cargo to the recipient cells to induce physiological and homeostatic changes.9, 10, 11, 12, 13 In the cardiovascular system, exosomes from different cell types have been shown to promote physiological processes, such as cardiac proliferation, hypertrophy, embryonic development, and angiogenesis as well as pathological states, including inflammation, ischemia‐reperfusion injury, apoptosis, and cardiac remodeling/fibrosis, contributing to both restoration and impairment of heart function. Cellular origin, physiologic condition, and pathologic stimuli dictate the compositions of exosomal cargo. In this study, we hypothesized that sacubitril/valsartan treatment alters the molecular and cellular features of the target cells. These modifications are reflected in the quantity of exosome production and the content of exosomal molecular payload. Novel experimental designs, employing human induced pluripotent stem cell‐derived cardiomyocytes (iCMs) in vitro and a rodent chronic myocardial injury model in vivo, established the scientific premise for the functional assessment of exosome‐derived miR‐181 and their related molecules.
METHODS
In accordance to the Transparency and Openness Promotion Guidelines, the data that support the findings of this study are available from the corresponding author upon reasonable request. This study has been approved by Stanford University School of Medicine institutional review board committee and Institutional Animal Care and Use Committee (institutional review board approval number 31517, APLAC‐31689).
Induced Pluripotent Stem Cells and iCMs
An induced pluripotent stem cell line (ATCC‐BXS0116 human [non‐Hispanic white female] induced pluri‐potent stem cells, ATCC ACS‐1030) was used in the study. Differentiation of the induced pluripotent stem cell line into a pure population of iCMs was performed as described earlier.14, 15, 16 Briefly, the induced pluripotent stem cell line (passage >20) was passaged between 1:6 to 1:8 split ratio and grown for 4 days until they reached ≈85% confluence. From day 0 to day 2, medium was changed to RPMI1640 (Thermo Fisher Scientific; 61870036) medium supplemented with B27 minus insulin (Thermo Fisher Scientific; A1895601) and 6 μmol/L CHIR99021 (Selleckhem; S2924). On day 2, medium was changed to RPMI1640 supplemented with B27 minus insulin only. From day 3 to day 5, medium was changed to RPMI1640 supplemented with B27 minus insulin and 2 μmol/L Wnt‐C59 (Selleckhem; S7037). The medium was changed on day 5 and every other day for RPMI1640 supplemented with B27 (Thermo Fisher Scientific; 17504044). Contractile iCMs were noted from day 7. To purify the iCMs, a variant of the RPMI1640 medium without D‐glucose (Thermo Fisher Scientific;11879020) was used in the media formula to select the iCMs.
Inducing Hypoxia in iCMs
iCMs were preincubated with 10 μmol/L of LBQ657 (LBQ, the active metabolite of sacubitril)/valsartan, valsartan, LBQ, and dimethyl sulfoxide (DMSO; vehicle) for 30 minutes. Then the medium was replaced by the RPMI1640 medium without D‐glucose. The iCMs were treated concurrently with 10 μmol/L of LBQ/valsartan, valsartan, LBQ, and DMSO (vehicle) and exposed to hypoxic condition. To mimic a hypoxic environment, in vitro iCMs were cultured in the Hypoxic Incubator Chamber (Stem Cell Technologies; 27310) (O2 <1%, CO2 5%) for 24 hours unless otherwise stated. All experiments were performed 3 times (biological triplicates).
Induction of MI
Female Sprague‐Dawley rats were purchased from Charles River. The rats selected for surgeries were 6 to 8 weeks old, nonpregnant, and demonstrated normal grooming and ambulatory behaviors. An unblinded researcher labeled control/treatment injections in an Eppendorf tube labeled with random numbers. The surgeons were blinded and labeled the rats using ear cuts. The rats were subjected to chronic MI model by permanent left anterior descending (LAD) ligation. The rats were then randomly allocated to the following treatment groups: sacubitril/valsartan (n=6), valsartan (n=7), vehicle (n=5), miRNA‐181a antagomir (n=9), miRNA‐181a mimic (n=10), miRNA mismatch control (negative control [NC]; n=8). The sham rats underwent thoracotomy without LAD ligation (no MI). The experimental groups were randomized across multiple cages, litters, and location of rat cages in the husbandry room.
Preparation, Doses, and Treatment
All compounds, sacubitril/valsartan, valsartan, and LBQ, were obtained from Novartis Pharma AG in the form of powder. For in vitro studies, LBQ/valsartan (acting as surrogate of sacubitril/valsartan), valsartan, and LBQ were dissolved in 100% DMSO as 10 mmol/L stock solutions and stored at −80°C before use. Then the compound stock solution was diluted in cell culture to a final concentration (10 μmol/L). Sacubitril is converted to LBQ in vivo, so in the in vitro experiments, LBQ replaced sacubitril. In all of the experiments, the effect of DMSO as a vehicle was tested. For the in vivo studies, sacubitril/valsartan and valsartan were prepared according to “Guidance to investigators for formulating and administering LCZ696‐ABA and valsartan to rats” (Novartis). Sacubitril/valsartan was formulated in water at a concentration required for administration (68 mg/kg body weight per oral). Valsartan was first dissolved in 1 N NaOH to generate a stock solution of 200 mg/mL. Then water was added to generate a solution at a concentration required for administration (31 mg/kg body weight per oral). pH was adjusted for both sacubitril/valsartan and valsartan to approximately equal to pH 8 to 9. The treatment with sacubitril/valsartan and valsartan was performed by administration of the compounds orally once per day. The treatment commenced 1 week after surgery to avoid interference with reparative scar formation and potential hemodynamic compromise and followed for 7 weeks. miR‐181a antagomir, miR‐181a mimic, and NC were injected intramyocardially in the peri‐infarct region at the time of LAD ligation. miR‐181a antagomir, miR‐181a mimic, and NC were purchased from ThermoFisher and dissolved in PBS (15.6 nmol/L per dose) according to the manufacturer's instruction.
Isolation of the Exosomes
Exosomes were isolated from the conditioned medium of iCMs by polyethylene glycol (PEG) precipitation. Cell culture media were filtered and centrifuged at 1500g for 10 minutes to remove cells, debris, and apoptotic bodies. PEG800 (Sigma; 89510) was added to the supernatant at 1:3 ratio (PEG:supernatant), mixed gently, and incubated at 4°C. The next day, the mixture was centrifuged at 1500g for 30 minutes to isolate the exosomes. From rat plasma, the exosomes were isolated at weeks 0, 1, 2, 4, and 8; 1 mL of blood samples were collected into EDTA‐coated tubes followed by centrifugation at 1500g for 10 minutes to separate the plasma from the red blood cells. Plasma samples were diluted with PBS while PEG800 was added to the supernatant at 1:3 ratio (PEG:supernatant). The solution was mixed gently and incubated at 4°C. The next day, the mixture was recentrifuged at 1500g for 30 minutes to isolate the exosomes. In addition, 70 nm qEV columns (iZON; qEVoriginal/70 nm) were used to purify the exosomes.
Nanoparticle Tracking Analysis of the Exosomes
Nanoparticle tracking analysis permits the determination of both the size distribution and relative concentration of nanoparticles by recording the scattering of the laser light by the particles in the solution undergoing Brownian motion and tracking particle movement. Briefly, the exosome pellets were resuspended in 1000 μL of PBS and loaded into the sample chamber of an LM10 unit (Nanosight Technology), and measurements were performed with a 405‐nm 65‐mW laser. The analysis settings were optimized and kept identical for each sample.
The Viability Assay
The effects of the combination of LBQ/valsartan, valsartan, LBQ, DMSO (vehicle), and the exosomes on cell viability were determined by the MTT (3‐(4,5‐dimethylthiazol‐2‐yl)‐2,5‐diphenyltetrazolium bromide) assay. A total of 500 000 cells/well were seeded in 12‐well plates in triplicate. At 24 to 48 hours later, the cells were pretreated with a 10 μmol/L combination of LBQ/valsartan, valsartan, LBQ, and DMSO for 30 minutes or exosomes (500 exosomes per well) for 24 hours.17 Then the medium was replaced by the RPMI1640 medium without d‐glucose. The iCMs were concurrently treated with a 10 μmol/L combination of LBQ/valsartan, valsartan, LBQ, DMSO, and exosomes (500 exosomes per cell) and exposed to a hypoxic condition for 18 hours. After incubation under the hypoxic condition, 200 μL of MTT (5 mg/mL in PBS) were added to 800 μL of the media, and the cells were incubated further for 1 hour. Then the medium was aspirated and 1 mL of MTT solvent/well was added for another 15 minutes. The absorbance was recorded on a microplate reader at the wavelength of 590 nm.
Flow Cytometry Analysis of Cell Apoptosis
Cell apoptosis rates were detected by flow cytometry using an Annexin V/Dead Cell Apoptosis Kit (Thermo Fisher Scientific; V13242) according to the manufacturer's instruction. After hypoxia treatment, the cells were dissociated with TrypLE Express and collected by centrifugation at 300g for 5 minutes. Each sample was double stained for 10 minutes with annexin and propidium iodide and then analyzed by flow cytometry on BD LSRII in the Stanford shared FACS (Flourescence‐activated cell sorting) facility. Flow cytometry data were then analyzed by FlowJo Software for Windows version V10 (Becton, Dickinson and Company, 2019).
Evaluation of Myocardial Viability and Cardiac Function
Cardiac magnetic resonance imaging (MRI) was performed using a Signa 3T EXCITE scanner (GE Healthcare) and a phased array 4‐channel surface coil (Rapid MR International). The rats were imaged at weeks 2 and 8 following the LAD ligation. During the entire scan, the rats were anesthetized using 1.0% to 3.0% of isoflurane, ECG, respiratory gating, and body temperature monitoring were performed using PC‐SAM (SA Instruments). LV function was evaluated on short axis serial slices obtained by ECG‐triggered fast spoiled gradient‐recalled sequence (flip angle 45°, echo time 10 ms, repetition time 20 ms, number of excitations (NEX 4), matrix 256×192, field of view 7 cm, slice thickness 1 mm, slice gap 0 mm, band width (BW) 122 Hz/pixel, phases to reconstruct 20). Nonviable and viable myocardium were discriminated by manganese‐enhanced MRI (MEMRI). MEMRI was obtained using ECG‐triggered inversion recovery–fast spoiled gradient‐recalled sequence (inversion recovery–fast spoiled gradient‐recalled: flip angle 30°, echo time 8.4 ms, repetition time 16 ms, effective repetition time 500–600 ms, NEX 5, matrix 256×192, field of view 7 cm, thickness 1 mm, slice gap 0 mm, BW 61 Hz/pixel, inversion time (TI) 400 ms) performed about 60 minutes after the intraperitoneal injection of 8 mL/kg of EVP103 (Eagle Vision Pharmaceutical). Fibrotic scar was discriminated by delayed gadolinium enhancement MRI (DEMRI). Gadolinium‐diethylenetriamine pentaacetic acid (DTPA) (0.4 mmol/kg of magnevist; Byer Health Care) was injected intraperitoneally, and DEMRI was obtained using the ECG‐triggered inversion recovery–fast spoiled gradient‐recalled sequence described previously with 1 imaging adjustment of TI 180 ms obtained around 15 to 30 minutes following intravenous injection. The images were analyzed using Osirix (Pixmeo). LV contours were traced manually to calculate LV end‐diastolic volume and LV end‐systolic volume. The LV ejection fraction was determined by the following: (LV end‐diastolic volume−LV end‐systolic volume)/LV end‐diastolic volume×100 (%). A manganese‐based contrast agent (EVP103) is taken up by calcium channels to confer the T1‐shortening and positive signal on the viable myocardium. Myocardial viability was calculated by tracing MEMRI enhancement: MEMRI viable myocardial volume (%)=(MEMRI enhancement volume×100)/total LV volume. Infarct scar size was calculated by tracing DEMRI enhancement: DEMRI infarct volume (%)=(DEMRI enhancement volume×100)/total LV volume.
Hematoxylin‐Eosin and Masson Trichrome Staining
The 10‐μm frozen sample sections and staining were performed by Stanford Animal Histology Services. Images were acquired using a BZ‐X710 microscope (Keyence). To measure the fibrotic area and volume fraction, the frozen sections were stained with Masson trichrome. The fibrotic area was stained blue, and the normal tissue was stained red. The fibrotic area was calculated by taking the percent ratio of the mean area of connective tissue to the total tissue area in all measured cross‐sections by using Image J (http://imagej.hih.gov). A total of 3 rats and 3 slides per rat per treatment group were used for analysis.
RNA Isolation, cDNA Synthesis, and Quantitative Reverse Transcription–Polymerase Chain Reaction
The iCM and peri‐infarct regions were isolated and homogenized and RNA was isolated using an RNeasy Plus kit (Qiagen; 74034), cDNA was produced using a high‐capacity cDNA reverse transcription kit (Applied Biosystems; 4368814), and real‐time polymerase chain reaction was performed using the SYBR Green Real‐Time PCR Master Mix (Thermo Fisher Scientific; 4309155) and a StepOnePlus Real‐Time PCR System (Applied Biosystems). GAPDH‐actin was used as the internal control gene to normalize the target genes. The 2−ΔΔCt method was used to analyze the quantity. Sequencing of the primers are listed in Table 1.
Table 1.
List of Primer Sequences Used for Reverse Transcription Polymerase Chain Reaction Analysis in This Study
| Gene | Forward Primer (5′‐3′) | Reverse Primer (5′‐3′) |
|---|---|---|
| Gapdh | TGCACCACCAACTGCTTAG | GATGCAGGGATGATGTTC |
| Nppa | CCGGTACCGAAGATAACAGC | CTCCAGGAGGGTATTCACCA |
| Nppb | TAATCTGTCGCCGCTGGGAGG | CAGCTGGGGAAAGAAGAGCCG |
| Col1 | CTCCTGACGCATGGCCAAGA | TGGGTCCCTCGACTCCTATG |
| Fn | AGCAAATCGTGCAGCCTCCG | CCCCCTTCATGGCAGCGATT |
| Vim | GCACCCTGCAGTCATTCAGA | GCAAGGATTCCACTTTACGTTCA |
| Postn | CGTGGCAGCACCTTCAAAGA | GGCTGAAGACTGCCTTGAATGAC |
| Ctgf | TCCCGTTAGCCTCGCCTTGG | CGGTACACGGACCCACCGAA |
| Myh6 | GAGTCGGTGAAGGGCATGAG | CCTCATCGTGCATTTTCTGCTT |
| Myh7 | ACAGAGGAAGACAGGAAGAACCTACTG | GCACAAGATCTACTCCTCATTCAGG |
| Fbxo | AGCTTGTGCGATGTTACCCA | GGTGAAAGTGAGACGGAGCA |
| Acta1 | GTACCACCGGCATCGTGTT | GATGTCGCGCACAATCTCAC |
| Actc1 | AAAGCACGCCTACAGATCCC | TCTGAGCCTCGTCACCTACA |
Exosome Total RNA Isolation
Total RNA isolation was performed using SeraMir Exosome RNA Purification Column kit (System Biosciences; RA808A‐1) according to the manufacturer's instructions. For each sample, 1 μL of the final RNA eluate was used for the measurement of small RNA concentration by the Agilent Bioanalyzer Small RNA Assay using the Bioanalyzer 2100 Expert instrument (Agilent Technologies).
Next‐Generation Sequencing Library Generation and Sequencing
Small RNA libraries were constructed with the CleanTag Small RNA Library Preparation Kit (TriLink; L‐3206) according to the manufacturer's protocol. The final purified library was quantified with high‐sensitivity DNA reagents (Agilent Technologies; G2933‐85004) and high‐sensitivity DNA chips (Agilent Technologies; 5067‐4626). The sequencing performed included ncRNAs (miRNAs, tRNAs, rRNAs, lincRNAs, piRNAs, snoRNAs), antisense transcripts, coding genes, and repeat elements (LTR [Long terminal repeats], LINE [Long interspersed nuclear elements], SINE [Short‐interspersed nuclear elements], and tandem repeats). Small RNAs have a major peak ≈140 to 200 bp, whereas long RNAs peak ≈300 bp. The libraries were pooled, and the 140 to 300 bp region was size selected on 8% TBE (Tris/Borate/EDTA) gel (Life Technologies; EC6215). The size‐selected library was quantified with high‐sensitivity DNA 1000 screen tape (Agilent Technologies; 5067‐5584), high‐sensitivity D1000 reagents (Agilent Technologies; 5067‐5585), and the TailorMix HT1 quantitative polymerase chain reaction assay (SeqMatic; TM‐505) followed by a NextSeq High Output single‐end sequencing run at SR75 using NextSeq 500/550 High Output v2 kit (Illumina; FC‐404‐2005).
Next‐Generation Sequencing–Exosome Data Analysis
The FastQC tool18 (http://www.bioinformatics.babraham.ac.uk/projects/fastqc/) was used for the initial assessment of sequence length distribution and quality.18 Then Bowtie19 was used to map the spike‐in DNA followed by the trimming and filtering steps.19 The open‐source tools used for trimming of adapters were FastqMcf, part of the ea‐utils package (http://code.google.com/p/ea-utils) and cutadapt (http://journal.embnet.org/index.php/embnetjournal/article/view/200/479), with PRINSEQ20 used in the quality filtering step.20 The reads were aligned to the reference rat genome (rn5). Finally, abundance determination and differential expression analysis was performed by DEseq.21 Counts were normalized across samples, and the variance among samples was determined. Differentially expressed miRNAs were identified based on a model using the negative binomial distribution. Normalized log10 miRNA expression values were used to generate a heatmap using Morpheus from the Broad Institute (software.broadinstitute.org/morpheus/). Values were hierarchically clustered by Euclidean distance for the metric, average for linkage method, and rows (miRNAs) and columns (sacubitril/valsartan, valsartan, and vehicle).
Statistical Analysis
Replicates in this study are biological (not technical) unless specifically noted otherwise. Values are expressed as mean±SEM. One‐way ANOVA with Bonferroni post hoc analysis was used for comparisons among all groups unless otherwise stated.
RESULTS
In Vitro Sacubitril/Valsartan and Exosome Effects on Human iCM Viability
In vitro assessment of the effects of LBQ (an active metabolite of the prodrug sacubitril), LBQ/valsartan (act as a surrogate for sacubitril/valsartan for in vitro experiments), and valsartan alone on the exosome production and cellular function by the iCMs was performed. First, particle size was assessed by nanoparticle tracking analysis and confirmed the abundant population of vesicles consistent with the size of exosomes (Figure 1A). The production of the exosomes was studied in the iCMs exposed to normoxic and hypoxic conditions. The findings show a significant increase in the exosome production in all 3 treatment groups versus the control arms (Figure 1B). The effects of LBQ/valsartan, valsartan, LBQ, and exosomes to modulate gene expression during hypertrophy/remodeling, fibrosis, and oxidatve stress (hypoxic condition) processes were investigated. LBQ/Valsartan, valsartan, and LBQ demonstrated no modulation of apoptosis genes, hypertrophy, or pro‐fibrotic‐associated genes. The exosome arm, however, showed suppression of apoptosis‐associated genes (Figure 2A). iCM viability was also assessed. We tested 2 different hypoxic conditions: 6 hours, 0% O2, and 18 hours, 1% O2. An analysis of cell viability after 6 hours showed that the combination of LBQ/Valsartan, valsartan, and LBQ demonstrated a trend toward improved live and decreased apoptotic iCMs, whereas after 18 hours of hypoxia only valsartan exhibited this feature. Finally, exosome treatment demonstrated significantly improved live and a trend toward decreased apoptotic iCMs (Figure 2B). iCM viability was also assessed in normoxic and hypoxic and 1‐hour pretreatment conditions by MTT assay. No significant improvement in iCM viability in any of the pharmacologic treatment arms was detected. The exosome treatment arm, however, demonstrated significantly higher survival benefit. Furthermore, the percentage improvement in survival of the hypoxia‐injured iCMs is higher in the exosome treatment group in comparison with the LBQ/valsartan, valsartan, and LBQ treatment arms (Figure 2C).
Figure 1. Exosome production in prehypoxia and posthypoxia conditions by induced pluripotent stem cell‐derived cardiomyocytes in vitro.
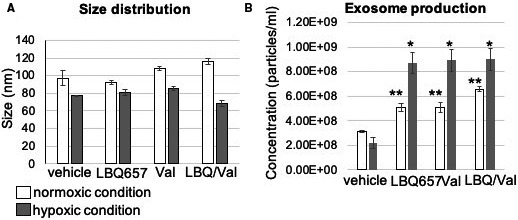
A, Size distribution of the induced pluripotent stem cell‐derived cardiomyocytes derived exosomes in prehypoxia and posthypoxia conditions. B, A significant increase in the exosome production (particles/mL) was seen in the LBQ657/valsartan (LBQ/val), valsartan (val), and LBQ657 treatment groups vs the control arms in comparison with both prehypoxic and posthypoxic control arms (*P<0.05; **P<0.01).
Figure 2. In vitro LBQ657/valsartan (LBQ/val), valsartan (val), LBQ657 (LBQ), and exosome effects on human‐induced pluripotent stem cell‐derived cardiomyocytes viability.
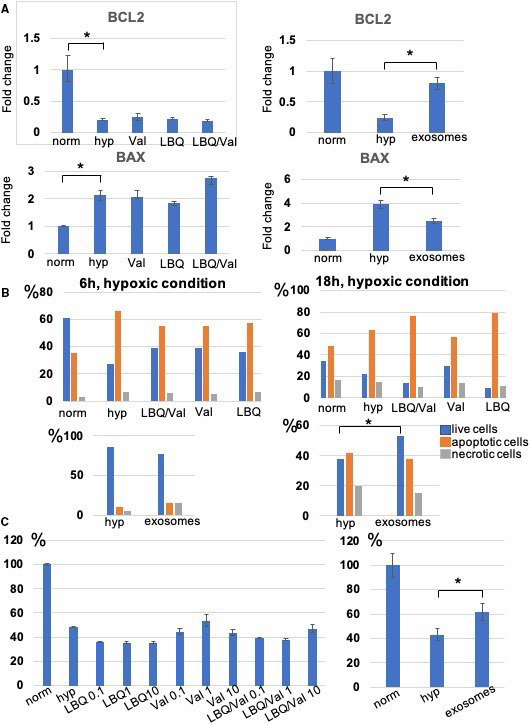
A, qRT (quantitative reverse transcription)–polymerase chain reaction demonstrated no significant difference in apoptosis‐associated gene expressions between the drug treatment vs untreated (negative) control arms while the exosome treatment arm significantly reversed the expression of the Bcl‐2 and Bax genes. B, FACS (fluorescence‐activated cell sorting) analysis of induced pluripotent stem cell‐derived cardiomyocytes viability measured live, apoptotic, and necrotic cells after 6 and 18 hours of hypoxia. C, The survival rate of induced pluripotent stem cell‐derived cardiomyocytes after hypoxic insult measured by MTT (3‐(4,5‐dimethylthiazol‐2‐yl)‐2,5‐diphenyltetrazolium bromide) analysis is shown. The viability values were represented as a percent of the untreated cells cultured under normoxic condition (regarded as 100% viability). The bars demonstrate the mean of triplicate experiments with SD. The exosome treatment group of the hypoxia‐injured induced pluripotent stem cell‐derived cardiomyocytes demonstrated significantly improved viability (*P<0.05). hyp indicates hypoxic; and norm, normoxic.
Sacubitril/Valsartan and Valsartan Improves Cardiac Function and Remodeling
To compare the effect of sacubitril/valsartan and valsartan on cardiac function and remodeling, we used a chronic HF model post MI in Sprague‐Dawley rats. The body, heart, and lung weights of all groups were examined. No difference in the body weight among groups was found, but the body weight gain was statistically higher in the sham and sacubitril/valsartan treatment groups (P<0.05). When compared with the sham‐operated group, the heart/body weight in all MI groups (treated and nontreated groups) was significantly reduced. No significant difference was found in the lung weight. These findings confirm significant myocardial injury in the rodents that underwent LAD ligation (Table 2).
Table 2.
Body, Heart, and Lung Weight in Sham and Infarcted Rats With and Without Treatment
| Sham | Vehicle | Sacubitril/Valsartan | Valsartan | NC | mir‐181a antagomr | miR‐181a mimic | miR‐181a mimic +Sacubitril/Valsartan | |
|---|---|---|---|---|---|---|---|---|
| Body weight (g) at week 2 | 272.2±24.5 | 226.8±23.1 | 196.6±16.9 | 214.8±23.0 | 269.4±12.3 | 251.8±11.1 | 248.0±21.7 | 233.4±22.6 |
| Body weight (g) at week 8 | 332.6±44.76 | 264.0±17.5 | 261.4±24.8 | 260.0±18.9 | 309.8±22.5 | 283.8±13.4 | 280.5±17.6 | 272.6±22.7 |
| Heart weight/body weight, mg/g | 2.75±0.14 | 3.35±0.2a | 3.35±0.3a | 3.14±0.2a | 3.16±0.4a | 3.12±0.1a | 3.51±0.2a | 3.07±0.2a |
| Weight gain, g | 60.4±21.8 | 37.2±15.3a | 64.8±21.4 | 45.16±29.6a | 40.4±19.0a | 32.0±13.9a | 32.5±7.8a | 26.8±12.3a |
| Lung weight, g | 1.16±0.1 | 1.28±0.2 | 1.24±0.2 | 1.18±0.1 | 1.25±0.2 | 1.15±0.1 | 1.19±0.1 | 1.29±0.12 |
NC indicates negative control.
P<0.05 relative to sham group.
Cardiac function was assessed by MRI at weeks 2 and 8. When compared with baseline (sham group), all rats with MI demonstrated a significant decrease in LV ejection fraction at weeks 2 and 8. However, both sacubitril/valsartan and valsartan treatment groups demonstrated improved LV ejection fraction compared with the vehicle group at week 8 (41.42±3.4 and 40.68±4.8 versus 36.79±2.1; P<0.05) (Figure 3A, Table 3). Similarly, both groups demonstrated a trend toward reduction in LVM (Table 3). We did not find statistically significant differences in LV end‐diastolic volume, LV end‐systolic volume, or stroke volume (SV). Thus, these data demonstrated that both sacubitril/valsartan and valsartan improved cardiac function in a rat model of chronic myocardial injury.
Figure 3. The effect of sacubitril/valsartan (sac/val) and valsartan (val) on cardiac function and remodeling.
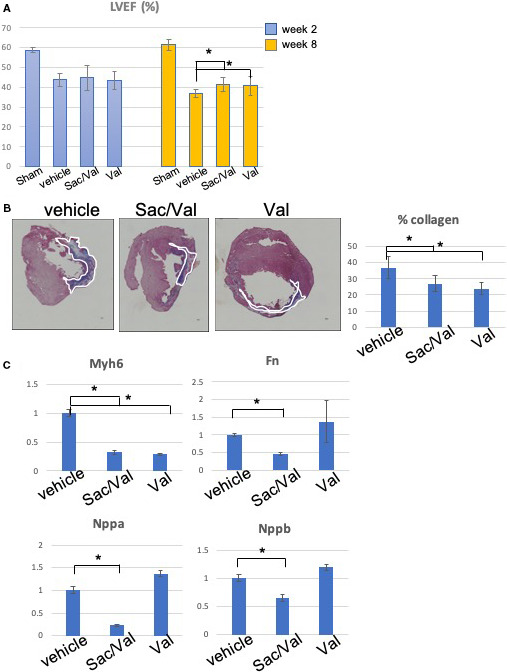
A, Left ventricular ejection fraction (LVEF) at weeks 2 and 8. B, Representative Masson‐Trichrome stain images of cardiac tissues in rat model of myocardial infarction. The myocardial fibers and collagen are colored blue and indicated by white lines. Scale bar=300 μm. Quantitative analysis demonstrated significant reduction of % collagen in the sacubitril/valsartan and valsartan treatment groups when compared with the vehicle group. C, Quantitative polymerase chain reaction analysis for the gene expression of rat hearts related to myocardial fibrosis and hypertrophy, demonstrating the significant effects of sacubitril/valsartan vs the vehicle and valsartan treatment groups (*P<0.05).
Table 3.
Cardiac Functional Parameters Determined by Magnetic Resonance Imaging
| Sham | Vehicle | Sacubitril/Valsartan | Valsartan | NC | mir‐181a antagomir | miR‐181a mimic | miR‐181a mimic +Sacubitril/Valsartan | |
|---|---|---|---|---|---|---|---|---|
| LVEF (%) w2 | 58.76±1.2 | 43.68±3.2 | 44.80±6.24 | 43.24±4.5 | 41.28±5.7 | 44.51±2.9 | 42.24±3.7 | 40.89±3.6 |
| LVEF (%) w8 | 61.32±2.9 | 36.79±2.1 | 41.42±3.4a | 40.68±4.8a | 40.22±6.7 | 44.75±3.7b | 40.81±3.74 | 39.13±4.5 |
| LVEDV (μL) w2 | 333.53±54.1 | 508.7±99.3 | 523.49±138.7 | 519.7±53.13 | 574.07±126.2 | 482.74±58.0 | 499.19±99.13 | 525.11±112.3 |
| LVEDV (μL) w8 | 411.69±23.7 | 578.82±99.9 | 584.74±158.0 | 522.69±68.4 | 712.28±154.5 | 533.16±47.0 | 614.85±102.6 | 654.16±126.20 |
| LVESV (μL) w2 | 137.20±19.2 | 285±50.8 | 295.92±105.62 | 276.05±64.95 | 342.93±104.9 | 268.01±37.2b | 288.74±63.4 | 312.50±79.0 |
| LVESV (μL) w8 | 159.45±17.6 | 365.64±63.1 | 300.45±115.2 | 269.03±64.9 | 428.89±138.4 | 295.12±138.4b | 295.12±102.5 | 401.26±98.3 |
| LVM (mg) w2 | 332.38±11.7 | 426.25±34.7 | 391.43±62.1 | 384.9±45.7 | 448.28±67.11 | 392.51±27.7b | 392.51±55.5 | 383.94±65.9 |
| LVM (mg) w8 | 365.52±18.4 | 426.25±34.7 | 391.4±62.1 | 369.7±45.7 | 508.66±47.2 | 413.31±5.7b | 504.36±85.9 | 532.16±115.1 |
LVEDV indicates left ventricular end‐diastolic volume; LVEF, left ventricular ejection fraction; LVESV, left ventricular end systolic volume; LVM, left ventricular mass; NC, negative control.
P<0.05 relative to sham group.
P<0.05 relative to NC.
Immunohistochemical analysis demonstrated that both sacubitril/valsartan and valsartan reduced the fibrosis burden in the myocardium (33.2±7.9% versus 29.5±9.2% versus 42.9±11.2%, sacubitril/valsartan, valsartan, and vehicle, respectively; P<0.05; Figure 3B). Interestingly, although both sacubitril/valsartan and valsartan treatment groups significantly reduced fibrosis compared with the vehicle treatment group, sacubitril/valsartan demonstrated significantly decreased extracellular matrix gene expression of Fn1 as well as both Nppa and Nppb (natriuretic peptide A and B, respectively) gene expressions relative to both vehicle and valsartan treatment groups. Both sacubitril/valsartan and valsartan demonstrated repression of pathological remodeling gene Myh6 (Figure 3C). The exosome treatment did not show improvement in cardiac functional parameters (Figure S1).
These data indicated that in a rat model of chronic HF, both sacubitril/valsartan and valsartan improved cardiac function and reduced cardiac fibrosis and hypertrophy. Furthermore, sacubitril/valsartan exhibited significant modulation of gene expression related to extracellular matrix and natriuretic peptides when compared with the valsartan treatment group.
rno‐miR‐181a is Downregulated In Vivo in the Plasma‐Derived Exosomes of the Sacubitril/Valsartan Treatment Group
To examine if sacubitril/valsartan or valsartan treatment changes exosomal payload, plasma was collected at weeks 0, 1, 2, 4, and 8 followed by exosome isolation and characterization by Nanosight. In both treatment groups, increased exosomal production was observed. Following per‐oral treatment, the sacubitril/valsartan group demonstrated peak exosome production from week 1 to week 2, whereas the valsartan group peaked from week 2 to 4 to 590% and 410%, respectively, when normalized to the control group (Figure S2). Next, the next‐generation sequencing of the rat plasma‐derived exosomes was performed. Pair‐group comparison of the miRNAs between sacubitril/valsartan versus valsartan and sacubitril/valsartan versus vehicle groups was performed. Differentially expressed miRNAs were identified using the DESeq package. First, counts were normalized across samples, and the variance among samples was determined. Differentially expressed miRNAs were identified based on a model using the negative binomial distribution. We determined that the exosomal rno‐mir‐181a was downregulated in sacubitril/valsartan treatment group in comparison to both the valsartan and vehicle groups (Figure 4, Table 4). The pathological role of miR‐181a/b/c/d family members during HF have been highlighted in a number of studies.22 These data suggest that sacubitril/valsartan may act via downregulation of miR‐181a, which is mediated by the exosomes in vivo.
Figure 4. Heatmap of hierarchical clustering of the top 15 differentially expressed miR in the sacubitril/valsartan (sac/val), valsartan (val), and vehicle treatment groups.
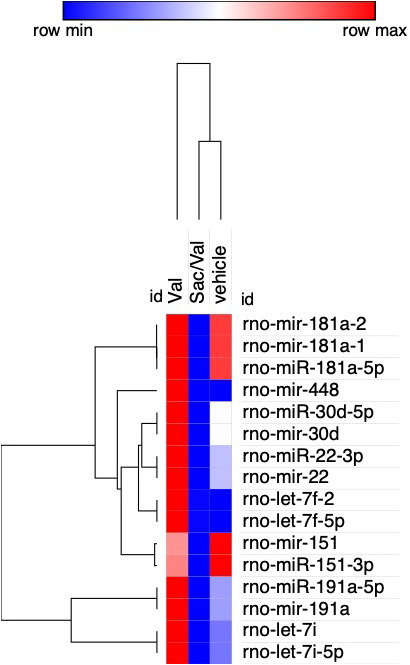
rno‐miR‐181a‐1, rno‐miR‐181a‐2, and rno‐miR‐181a‐5p demonstrate the highest expression difference between the exosomes derived from the plasma of sacubitril/valsartan–treated vs valsartan‐treated and vehicle‐treated rats. Red denotes high and blue denotes low expression levels.
Table 4.
Top 15 Differentially Expressed miRNA Between Sacubitril/Valsartan and Valsartan Treatment Groups. Expression of miR‐181in sacubitril/valsartan treatment group vs vehicle
| Id | Chrom | Start | End | Type | Strand | Sacubitril/Valsartan | Valsartan | Log2 Fold Change |
|---|---|---|---|---|---|---|---|---|
| rno‐miR‐191a‐5p | chr8 | 116698881 | 116698903 | miRNA | + | 362.26 | 1467.68 | 2.0184 |
| rno‐mir‐191a | chr8 | 116698867 | 116698957 | miRNA | + | 362.26 | 1467.68 | 2.0184 |
| rno‐miR‐30d‐5p | chr7 | 109228690 | 109228711 | miRNA | − | 61.51 | 273.17 | 2.1509 |
| rno‐mir‐30d | chr7 | 109228641 | 109228722 | miRNA | − | 61.51 | 273.17 | 2.1509 |
| rno‐mir‐448 | chrX | 118420170 | 118420281 | miRNA | + | 104.31 | 485.07 | 2.2173 |
| rno‐mir‐181a‐2 | chr3 | 28374769 | 28374885 | miRNA | + | 107.52 | 512.43 | 2.2527 |
| rno‐miR‐181a‐1 | chr13 | 59986075 | 59986174 | miRNA | + | 105.99 | 511.62 | 2.2712 |
| rno‐miR‐181a‐5p | chr13 | 59986089 | 59986111 | miRNA | + | 105.7 | 511.28 | 2.2741 |
| rno‐let‐7f‐2 | chrX | 21868509 | 21868591 | miRNA | − | 63.16 | 317.44 | 2.3293 |
| rno‐let‐7f‐5p | chr17 | 18474341 | 18474362 | miRNA | + | 63.16 | 317.44 | 2.3293 |
| rno‐mir‐151 | chr7 | 114421107 | 114421203 | miRNA | − | 48.24 | 257.27 | 2.4151 |
| rno‐miR‐151‐3p | chr7 | 114421133 | 114421153 | miRNA | − | 47.23 | 255.14 | 2.4336 |
| rno‐miR‐22‐3p | chr10 | 62013698 | 62013719 | miRNA | + | 36.91 | 205.67 | 2.4782 |
| rno‐mir‐22 | chr10 | 62013642 | 62013736 | miRNA | + | 36.91 | 205.67 | 2.4782 |
| rno‐let‐7i | chr7 | 67000236 | 67000320 | miRNA | + | 186.96 | 1052.41 | 2.4929 |
| rno‐let‐7i‐5p | chr7 | 67000241 | 67000262 | miRNA | + | 186.96 | 1052.41 | 2.4929 |
| Id | Chrom | Start | End | Type | Strand | Sacubitril/Valsartan | Vehicle | Log2 Fold Change |
| rno‐miR‐181a‐5p | chr13 | 59986089 | 59986111 | miRNA | + | 105.7 | 464.72 | 2.1363 |
| rno‐miR‐181a‐1 | chr13 | 59986075 | 59986174 | miRNA | + | 105.99 | 465.29 | 2.1343 |
| rno‐miR‐181a‐2 | chr3 | 28374769 | 28374885 | miRNA | + | 107.52 | 464.72 | 2.1117 |
Chrom indicates chromosome.
Downregulation of rno‐miR‐181a Improves Cardiac Function and Myocardial Remodeling Processes
We next aimed to test the therapeutic effect of rno‐miR‐181a to restore the injured myocardium. To this end, the rats underwent intramyocardial injection of the following small molecules in the peri‐infarct region at the time of LAD ligation: (1) miR‐181a antagomir to simulate the gain of function effects of the exosomes, (2) rmiR‐181a mimic+sacubitril/valsartan to demonstrate the loss of function of sacubitril/valsartan, (3) miR‐181a mimic for negative control, and (4) miR mismatch also for NC. The body, heart, and lung weights of all groups were examined (Table 2). No difference in the body weight among groups was found, but the body weight gain was statistically higher in the sham group (P<0.05). When compared with the sham‐operated group, the heart/body weight in all MI groups (treated and nontreated groups) was significantly reduced. No significant difference was found in the lung weight. Cardiac function was estimated by MRI at weeks 2 and 8. Notably, the miR‐181a antagomir treatment group demonstrated significantly improved LV ejection fraction compared with the control group (44.7±3.7 versus 40.22±6.7), significantly reduced LV end‐diastolic volume (533.2±47.0 versus 712.3±154.5) at week 8, significantly reduced LV end‐systolic volume at weeks 2 (268.1±37.2 versus 342.93±104.9) and 8 (295.12±138.4 versus 428.89±138.4), and significantly reduced LVM at weeks 2 (392.51±27.7 versus 448.28±67.11) and 8 (413.31±5.7 versus 508.66±47.2) (Table 3, Figure 5A). These findings confirmed the significant improvement in myocardial function by miR‐181a antagomir, which may underlie the effects of the exosomes. These salutary effects were reversed in the miR‐181a mimic+sacubitril/valsartan treatment group. No significant change was seen in the miR‐181a mimic or NC treatment groups.
Figure 5. Downregulation of rno‐miR‐181a (mir‐181a antagomir) improves cardiac function and myocardial remodeling processes.
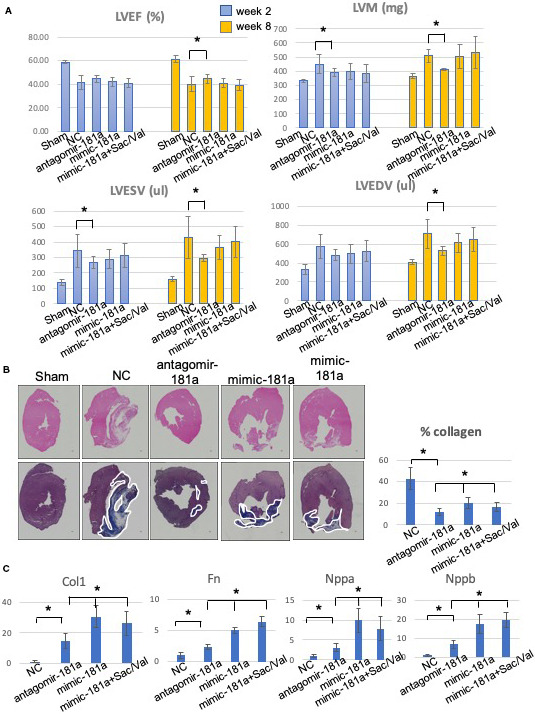
A, Left ventricular ejection fraction (LVEF), left ventricular end‐diastolic volume (LVEDV), left ventricular end systolic volume (LVESV), left ventricular mass (LVM) at weeks 2 and 8. The mir‐181a antagomir treatment group demonstrates significant salutary effects vs the negative control (NC) group. B, Representative images of cardiac tissues in myocardial infarction rats stained with hematoxylin‐eosin (upper panel) and Masson trichrome (lower panel). The myocardial fibers and collagen are colored blue and indicated by white lines. Scale bar=300 μm. Quantitative analysis demonstrated a significant reduction in the percentage of collagen in the miR‐181a antagomir treatment group when compared with NC and the other treatment groups. C, Quantitative polymerase chain reaction analysis for myocardial hypertrophy and fibrosis gene expression in the mir‐181a antagomir treatment group *P<0.05.
These beneficial effects in myocardial physiology were confirmed by immunohistochemical analysis of cardiac tissues at week 8. Masson trichrome staining was used to quantify the level of collagen production. The finding demonstrated a markedly reduced region of collagen‐rich tissue in miR‐181a antagomir treatment group versus NC (11.86±3.54 versus 42.74±10.31%, P<0.05) (Figure 5B). To confirm the immunohistochemistry data, we tested the modulation of gene expression known to be associated with myocardial fibrosis and hypertrophy. Molecular analysis of the rodent peri‐infarct region demonstrated a significant reduction of the expression level of Fn1, Col1, and Vim genes in the miR‐181a antagomir treatment group as confirmed by quantitative polymerase chain reaction. In addition, we found that the expression of Nppa and Nppb were significantly downregulated in the miR‐181a antagomir treatment group. These data support the important role of miR‐181a in cardiac remodeling processes (Figure 5C).
DISCUSSION
In this study, we tested the hypothesis that sacubitril/valsartan treatment results in increased production of exosomes and modulation of their molecular payload to confirm the role of exosomes in the mechanism of action of sacubitril/valsartan's therapeutic effects. We demonstrated that the treatment with sacubitril/valsartan and valsartan resulted in the increased production of exosomes by iCMs in vitro under normoxic and hypoxic conditions as well as in rat plasma in vivo. These findings are in line with previous investigations, which reported that various medications increase exosome secretion, including cisplatin,23 tunicamycin,24 and ethanol treatments25 as well as exposure to hypoxia.26 There are no clear data why the cells respond to stress by releasing more exosomes. However, published data do demonstrate that the exosomes reflect the cellular phenotype.8, 12, 27, 28, 29 Pathophysiological stimuli increase intracellular stress, metabolism, and energy production. This response increases cellular endosomal production, which triggers the release of extracellular vesicles to communicate with their neighboring cells. The released exosomes contain varying levels of proteins, lipids, and nucleic acids. Their composition represents the cell‐specific response, which is influenced by the cell type, physiologic condition, and pharmacologic treatment. Studies have shown that the molecular payloads are enriched with certain miRNAs from the endoplasmic reticulum, depending on the cell of origin and pathologic stimuli, resulting in the sorting of specific intracellular miRNAs into the endosomal vesicles, which are released as exosomes27, 28
Exosome treatment demonstrated significant improvements in iCM viability and apoptosis‐associated genes, whereas LBQ/valsartan, valsartan, and LBQ demonstrated no modulation of apoptosis genes, hypertrophy, or pro‐fibrosis‐associated genes. However, we also demonstrated that both sacubitril/valsartan and valsartan have beneficial effects on LV function, volumes, and mass with concomitant reduction in fibrosis and hypertrophy in an in vivo rodent model of chronic myocardial injury. These data confirmed the salutary effects of sacubitril/valsartan, consistent with previous reports.6, 7, 30, 31
Next‐generation sequencing of these exosomes exhibited downregulation of rno‐miR‐181a expression. In vivo studies employing chronic rodent myocardial injury model validated our findings by confirming gain of function by miR‐181a antagomir treatment, which exhibited beneficial effects on cardiac function, volumes, and morphology. Nevertheless, the treatment groups, consisting of miR‐181a mimic and miR‐181a mimic+sacubitril/valsartan, confirmed loss of function of sacubitril/valsartan, which further validated the specificity of the role of miR‐181a. Subsequent, immunohistochemical, and molecular studies suggested that the attenuation of fibrosis and hypertrophy restored the chronically injured rodent heart after MI. Thus, we speculate that the molecular mechanism of the physiologic action of sacubitril/valsartan action may be mediated by the modulation of the miRNA expression level in the exosome payload.
The changes in the exosome content attributed to different cell types, physiologic conditions, and treatment approaches have been widely described both in vitro and in vivo.32, 33, 34 This study pioneered the in vivo demonstration of pharmacologic modulation of the exosomal cargo to enhance the cardiovascular function post myocardial injury. Furthermore, the role of miR‐181a in progression of myocardial fibrosis has been confirmed in a rodent model of chronic HF, providing additional support of our findings reported in this study.35
Changes in the exosome content mediated by sacubitril/valsartan may serve as potential biomarkers to predict human drug response, enabling the promise of precision medicine. Circulating miR‐181a levels have been described in MI patients with a significant change in a time‐dependent manner, indicating the potential value of plasma mir‐181a as a novel biomarker of HF progression and for the prediction of treatment response.36 Interestingly, comparison with established biomarkers for cardiac ischemia such as troponins (Troponin I and troponin T) demonstrated that the expression levels of exosomal miRNAs peak much faster and earlier in circulation.37
In conclusion, our study represents novel data on additional molecular mechanisms of action of the pleiotropic effects of sacubitril/valsartan in a rodent model of chronic myocardial injury. The pharmacologic effects on exosome production and molecular payload describe a potentially novel mechanism of their underlying physiological mechanism of action and may provide an alternative and innovative platform for pharmacogenomics.
Limitations of the Study
Sex differences cannot be determined from the current study. However, a specific focus on the role of exosomes from human female line of iCMs in female rodent model was conducted. For in vitro experiments, all treatment groups (valsartan, LBQ, LBQ/valsartan, and exosomes) were tested under the same experimental condition. The differential exposure time and dose dependence for the mechanism of action for each treatment arm have not been determined.
Source of Funding
This was an Investigator Initiated Trial (LCZ696BUSNC18T) funded by Novartis Pharmaceutical Corporation.
Disclosures
None.
Supporting information
Figures S1–S2
Acknowledgments
Novartis Pharma AG provided the pharmaceutical material (sacubitril/valsartan, valsartan, and LBQ657).
(J Am Heart Assoc. 2020;9:e015640 DOI: 10.1161/JAHA.119.015640.)
For Sources of Funding and Disclosures, see page 14.
References
- 1. Benjamin EJ, Muntner P, Alonso A, Bittencourt MS, Callaway CW, Carson AP, Chamberlain AM, Chang AR, Cheng S, Das SR, et al. Heart disease and stroke statistics‐2019 update: a report from the American Heart Association. Circulation. 2019;139:e56–e66. [DOI] [PubMed] [Google Scholar]
- 2. Ziaeian B, Fonarow GC. Epidemiology and aetiology of heart failure. Nat Rev Cardiol. 2016;13:368–378. [DOI] [PMC free article] [PubMed] [Google Scholar]
- 3. Savarese G, Lund LH. Global public health burden of heart failure. Card Fail Rev. 2017;03:7–11. [DOI] [PMC free article] [PubMed] [Google Scholar]
- 4. Khder Y, Shi V, McMurray JJV, Lefkowitz MP. Sacubitril/valsartan (LCZ696) in heart failure In: Bauersachs J, Butler J, Sandner P, eds. Heart Failure. Cham: Springer International Publishing; 2017:133–165. [Google Scholar]
- 5. Karch R, Neumann F, Ullrich R, Neumüller J, Podesser BK, Neumann M, Schreiner W. The spatial pattern of coronary capillaries in patients with dilated, ischemic, or inflammatory cardiomyopathy. Cardiovasc Pathol. 2005;14:135–144. [DOI] [PubMed] [Google Scholar]
- 6. Von Lueder TG, Wang BH, Kompa AR, Huang L, Webb R, Jordaan P, Atar D, Krum H. Angiotensin receptor neprilysin inhibitor LCZ696 attenuates cardiac remodeling and dysfunction after myocardial infarction by reducing cardiac fibrosis and hypertrophy. Circ Heart Fail. 2015;8:71–78. [DOI] [PubMed] [Google Scholar]
- 7. Burke RM, Lighthouse JK, Mickelsen DM, Small EM. Sacubitril/valsartan decreases cardiac fibrosis in left ventricle pressure overload by restoring PKG signaling in cardiac fibroblasts. Circ Heart Fail. 2019;12:e005565. [DOI] [PMC free article] [PubMed] [Google Scholar]
- 8. Théry C, Zitvogel L, Amigorena S. Exosomes: composition, biogenesis and function. Nat Rev Immunol. 2002;2:569–579. [DOI] [PubMed] [Google Scholar]
- 9. Simons M, Raposo G. Exosomes—vesicular carriers for intercellular communication. Curr Opin Cell Biol. 2009;21:575–581. [DOI] [PubMed] [Google Scholar]
- 10. Dougherty JA, Mergaye M, Kumar N, Chen CA, Angelos MG, Khan M. Potential role of exosomes in mending a broken heart: nanoshuttles propelling future clinical therapeutics forward. Stem Cells Int. 2017;2017:5785436. [DOI] [PMC free article] [PubMed] [Google Scholar]
- 11. Gennebäck N, Hellman U, Malm L, Larsson G, Ronquist G, Waldenström A, Mörner S. Growth factor stimulation of cardiomyocytes induces changes in the transcriptional contents of secreted exosomes. J Extracell Vesicles. 2013;2:20167. [DOI] [PMC free article] [PubMed] [Google Scholar]
- 12. Bellin G, Gardin C, Ferroni L, Chachques J, Rogante M, Mitrečić D, Ferrari R, Zavan B. Exosome in cardiovascular diseases: a complex world full of hope. Cells. 2019;8:166. [DOI] [PMC free article] [PubMed] [Google Scholar]
- 13. Jung JH, Fu X, Yang PC. Exosomes generated from iPSC‐derivatives: new direction for stem cell therapy in human heart diseases. Circ Res. 2017;120:407–417. [DOI] [PMC free article] [PubMed] [Google Scholar]
- 14. Ge X, Wang I‐NE, Toma I, Sebastiano V, Liu J, Butte MJ, Reijo Pera RA, Yang PC. Human amniotic mesenchymal stem cell‐derived induced pluripotent stem cells may generate a universal source of cardiac cells. Stem Cells Dev. 2012;21:2798–2808. [DOI] [PMC free article] [PubMed] [Google Scholar]
- 15. Burridge PW, Matsa E, Shukla P, Lin ZC, Churko JM, Ebert AD, Lan F, Diecke S, Huber B, Mordwinkin NM, et al. Chemically defned generation of human cardiomyocytes. Nat Methods. 2014;11:855–860. [DOI] [PMC free article] [PubMed] [Google Scholar]
- 16. Tachibana A, Santoso MR, Mahmoudi M, Shukla P, Wang L, Bennett M, Goldstone AB, Wang M, Fukushi M, Ebert AD, et al. Paracrine effects of the pluripotent stem cell‐derived cardiac myocytes salvage the injured myocardium. Circ Res. 2017;121:e22–e36. [DOI] [PMC free article] [PubMed] [Google Scholar]
- 17. Santoso MR, Ikeda G, Tada Y, Jung J, Vaskova E, Sierra RG, Gati C, Goldstone AB, von Bornstaedt D, Shukla P, et al. Exosomes from induced pluripotent stem cell‐derived cardiomyocytes promote autophagy for myocardial repair. J Am Heart Assoc. 2020;9:e014345 DOI: 10.1161/JAHA.119.014345. [DOI] [PMC free article] [PubMed] [Google Scholar]
- 18. Kuhn RM, Haussler D, James Kent W. The UCSC genome browser and associated tools. Brief Bioinform. 2013;14:144–161. [DOI] [PMC free article] [PubMed] [Google Scholar]
- 19. Langmead B, Salzberg SL. Fast gapped‐read alignment with Bowtie 2. Nat Methods. 2012;9:357–359. [DOI] [PMC free article] [PubMed] [Google Scholar]
- 20. Schmieder R, Edwards R. Quality control and preprocessing of metagenomic datasets. Bioinformatics. 2011;27:863–864. [DOI] [PMC free article] [PubMed] [Google Scholar]
- 21. Anders S, Huber W. Differential expression analysis for sequence count data. Genome Biol. 2010;11:R106. [DOI] [PMC free article] [PubMed] [Google Scholar]
- 22. Kent OA, Steenbergen C, Das S. In vivo nanovector delivery of a heart‐specific MicroRNA‐sponge. J Vis Exp. 2018;136:1–8. [DOI] [PMC free article] [PubMed] [Google Scholar]
- 23. Xiao X, Yu S, Li S, Wu J, Ma R, Cao H, Zhu Y, Feng J. Exosomes: decreased sensitivity of lung cancer A549 cells to cisplatin. PLoS One. 2014;9:e89534. [DOI] [PMC free article] [PubMed] [Google Scholar]
- 24. Kanemoto S, Nitani R, Murakami T, Kaneko M, Asada R, Matsuhisa K, Saito A, Imaizumi K. Multivesicular body formation enhancement and exosome release during endoplasmic reticulum stress. Biochem Biophys Res Commun. 2016;480:166–172. [DOI] [PubMed] [Google Scholar]
- 25. Chen L, Chen R, Kemper S, Brigstock DR. Pathways of production and delivery of hepatocyte exosomes. J Cell Commun Signal. 2018;12:343–357. [DOI] [PMC free article] [PubMed] [Google Scholar]
- 26. King HW, Michael MZ, Gleadle JM. Hypoxic enhancement of exosome release by breast cancer cells. BMC Cancer. 2012;12:421. [DOI] [PMC free article] [PubMed] [Google Scholar]
- 27. Villarroya‐Beltri C, Baixauli F, Gutiérrez‐Vázquez C, Sánchez‐Madrid F, Mittelbrunn M. Sorting it out: regulation of exosome loading. Semin Cancer Biol. 2014;28:3–13. [DOI] [PMC free article] [PubMed] [Google Scholar]
- 28. Hessvik NP, Llorente A. Current knowledge on exosome biogenesis and release. Cell Mol Life Sci. 2018;75:193–208. [DOI] [PMC free article] [PubMed] [Google Scholar]
- 29. György B, Szabó TG, Pásztói M, Pál Z, Misják P, Aradi B, László V, Pállinger É, Pap E, Kittel Á, et al. Membrane vesicles, current state‐of‐the‐art: emerging role of extracellular vesicles. Cell Mol Life Sci. 2011;68:2667–2688. [DOI] [PMC free article] [PubMed] [Google Scholar]
- 30. Kompa AR, Lu J, Weller TJ, Kelly DJ, Krum H, von Lueder TG, Wang BH. Angiotensin receptor neprilysin inhibition provides superior cardioprotection compared to angiotensin converting enzyme inhibition after experimental myocardial infarction. Int J Cardiol. 2018;258:192–198. [DOI] [PubMed] [Google Scholar]
- 31. Pfau D, Thorn SL, Zhang J, Mikush N, Renaud JM, Klein R, deKemp RA, Wu X, Hu X, Sinusas AJ, et al. Angiotensin receptor neprilysin inhibitor attenuates myocardial remodeling and improves infarct perfusion in experimental heart failure. Sci Rep. 2019;9:5791. [DOI] [PMC free article] [PubMed] [Google Scholar]
- 32. Duan P, Tan J, Miao Y, Zhang Q. Potential role of exosomes in the pathophysiology, diagnosis, and treatment of hypoxic diseases. Am J Transl Res. 2019;11:1184–1201. [PMC free article] [PubMed] [Google Scholar]
- 33. Conigliaro A, Fontana S, Raimondo S, Alessandro R. Exosomes: nanocarriers of biological messages In: Xiao J, Cretoiu S, eds. Exosomes in Cardiovascular Diseases: Biomarkers, Pathological and Therapeutic Effects. Cham: Springer Nature Singapore Pte Ltd; 2017:23–43. [DOI] [PubMed] [Google Scholar]
- 34. de Jong OG, Verhaar MC, Chen Y, Vader P, Gremmels H, Posthuma G, Schiffelers RM, Gucek M, van Balkom BWM. Cellular stress conditions are reflected in the protein and RNA content of endothelial cell‐derived exosomes. J Extracell Vesicles. 2012;1:18396. [DOI] [PMC free article] [PubMed] [Google Scholar]
- 35. Chen P, Pan J, Zhang X, Shi Z, Yang X. The role of MicroRNA‐181a in myocardial fibrosis following myocardial infarction in a rat model. Med Sci Monit. 2018;24:4121–4127. [DOI] [PMC free article] [PubMed] [Google Scholar]
- 36. Yi J, An Y. Circulating miR‐379 as a potential novel biomarker for diagnosis of acute myocardial infarction. Eur Rev Med Pharmacol Sci. 2018;22:540–546. [DOI] [PubMed] [Google Scholar]
- 37. Subra C, Grand D, Laulagnier K, Stella A, Lambeau G, Paillasse M, De Medina P, Monsarrat B, Perret B, Silvente‐Poirot S, et al. Exosomes account for vesicle‐mediated transcellular transport of activatable phospholipases and prostaglandins. J Lipid Res. 2010;51:2105–2120. [DOI] [PMC free article] [PubMed] [Google Scholar]
Associated Data
This section collects any data citations, data availability statements, or supplementary materials included in this article.
Supplementary Materials
Figures S1–S2