Abstract
Background
Hormones are crucial to plant life and development. Being able to follow the plants hormonal response to various stimuli and throughout developmental processes is an important and increasingly widespread tool. The phytohormone cytokinin (CK) has crucial roles in the regulation of plant growth and development.
Results
Here we describe a version of the CK sensor Two Component signaling Sensor (TCS), referred to as TCSv2. TCSv2 has a different arrangement of binding motifs when compared to previous TCS versions, resulting in increased sensitivity in some examined tissues. Here, we examine the CK responsiveness and distribution pattern of TCSv2 in arabidopsis and tomato.
Conclusions
The increased sensitivity and reported expression pattern of TCSv2 make it an ideal TCS version to study CK response in particular hosts, such as tomato, and particular tissues, such as leaves and flowers.
Keywords: Cytokinin, Imaging, Two-component sensor (TCS), TCSv2, Tomato, Arabidopsis
Background
Cytokinins (CKs) are a class of adenine-derived plant hormones that control multiple processes throughout the plant life cycle. They provide positional information for growth and patterning, and integrate biotic and abiotic cues from the environment. Notable examples are meristem maintenance in both the shoot apical meristem (SAM) and root apical meristem (RAM), cell division and cell differentiation. CK is also involved in regulating traits that affect yield and fruit quality. The roles of CK in plant growth and development have been reviewed extensively [1–6]. Cytokinin signalling is mediated via a two-component multistep phosphorelay cascade. As the final step, type-B response regulators (RRs) activate transcription in response to phosphorelay signalling activity, while type-A response regulators are rapidly induced by CK via Type-B RRs, and, in turn, repress signalling via a negative-feedback loop [6–10].
There are many CK derivatives, and methods for the detection of a large number of them have emerged in recent years [11–20]. However, it is often difficult to know for certain which of these derivatives represent active CKs, and not all of them are detectable. In parallel to the advances made in hormone substance detection, efforts have also been invested in the detection of CK signalling via transcriptional sensors that mark the site of CK-derived response within a specific tissue or organ. Whereas specific genes and promoters involved in the CK pathway served as markers for CK response in the past [7, 8, 10, 21, 22], limitations in the ability to detect cytokinins and decipher the biosynthetic pathways culminating in active variants of CK molecules led to the necessity for accurate and robust sensors allowing us to follow CK response dynamics in planta. The search for a robust and sensitive CK sensor led to the creation of the TWO-COMPONENT OUTPUT SENSOR, TCS, which was designed based on the CK phosphorelay network. The TCS sensor was designed using the conserved DNA binding domain in the promoter of type A RRs that is recognized by type-B response regulator family members of arabidopsis. With the goal of designing a universal CK reporter, different synthetic reporter designs were optimized using luciferase (LUC) activity in an arabidopsis mesophyll protoplast assay system [7, 8, 23]. The first generation TCS, TCS::LUC, harboured concatemerized type-B arabidopsis response regulator (ARR) binding motifs and a minimal 35S promoter [7, 8]. The second version of TCS, named TCSn, was optimized to better reflect the natural arrangement of binding motifs [24]. To minimize transcriptional silencing triggered by repeats, sequence variations in non-relevant residues were introduced in TCSn. Since its introduction, TCSn-based reporters have proven essential tools to report cytokinin responses in different plant species, including monocots [25, 26].
TCS and TCSn design were based on analysis of binding motifs in verified cytokinin targets. This analysis revealed that tandem, head-to-head and tail-to-tail motif orientations are all equally frequent [24]. Therefore, both TCS and TCSn reporters were designed to harbour a motif arrangement that provides all these relative orientations. However, in cellular assays, increased sensitivity was detected in head-to-head and tail-to-tail motif orientations. This led to the design of another TCS version, which is described here. The corresponding synthetic promoter, named TCSv2 (version2) shows increased cytokinin sensitivity in planta, in particular in the shoot meristem, making it an ideal choice for detecting CK response in shoot organs. Here, we report the TCSv2::NLS-3XVenus expression pattern in transgenic tomato and arabidopsis.
Results
TCSv2 design and increased sensitivity
TCSv2 is a variant of TCSn, with alternating head-to-head and tail-to-tail orientations of type B ARR-binding sites compared with the tandem tail-to-tail and head-to-head orientation of sites in TCSn (Fig. 1a). TCSv2 demonstrated increased sensitivity in mesophyll protoplast transient assays (Fig. 1a), as well as in arabidopsis floral meristems (Fig. 1b).
Fig. 1.
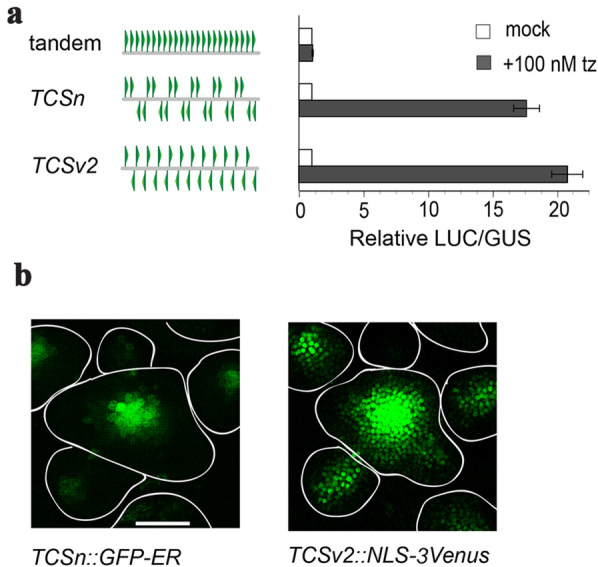
TCSv2 possesses increased sensitivity. a Design scheme of TCSn and TSCv2, displaying the arrangement of the motifs in the synthetic promoter, alongside activity of the construct (Luciferease/GUS staining) in mock and 100 nM transZeatin (tz) treated samples. b Expression of TCSn and TCSv2 driven VENUS in the floral meristem of arabidopsis. Bar = 50 µM
CK responsiveness of TCSv2 in various tissues in both arabidopsis and tomato
We cloned TCSv2 according to the description in the methods section, and introduced constructs in which TCSv2 drives VENUS or GUS (β-glucuronidase) expression into tomato and arabidopsis. To examine CK responsiveness of TCSv2 in vivo, we conducted a series of experiments examining TCSv2 driven expression with and without CK treatment in a variety of plant tissues in both arabidopsis and tomato (Fig. 2). For VENUS analyses conducted in arabidopsis, two representative transgenic lines exhibiting moderate (TCSv2:3XVENUS#2) and strong (TCSv2:3XVENUS#7) VENUS expression were selected for the analysis. For VENUS analyses conducted in tomato, several lines were screened, which demonstrated similar VENUS expression levels. One of these was selected for further analyses.
Fig. 2.
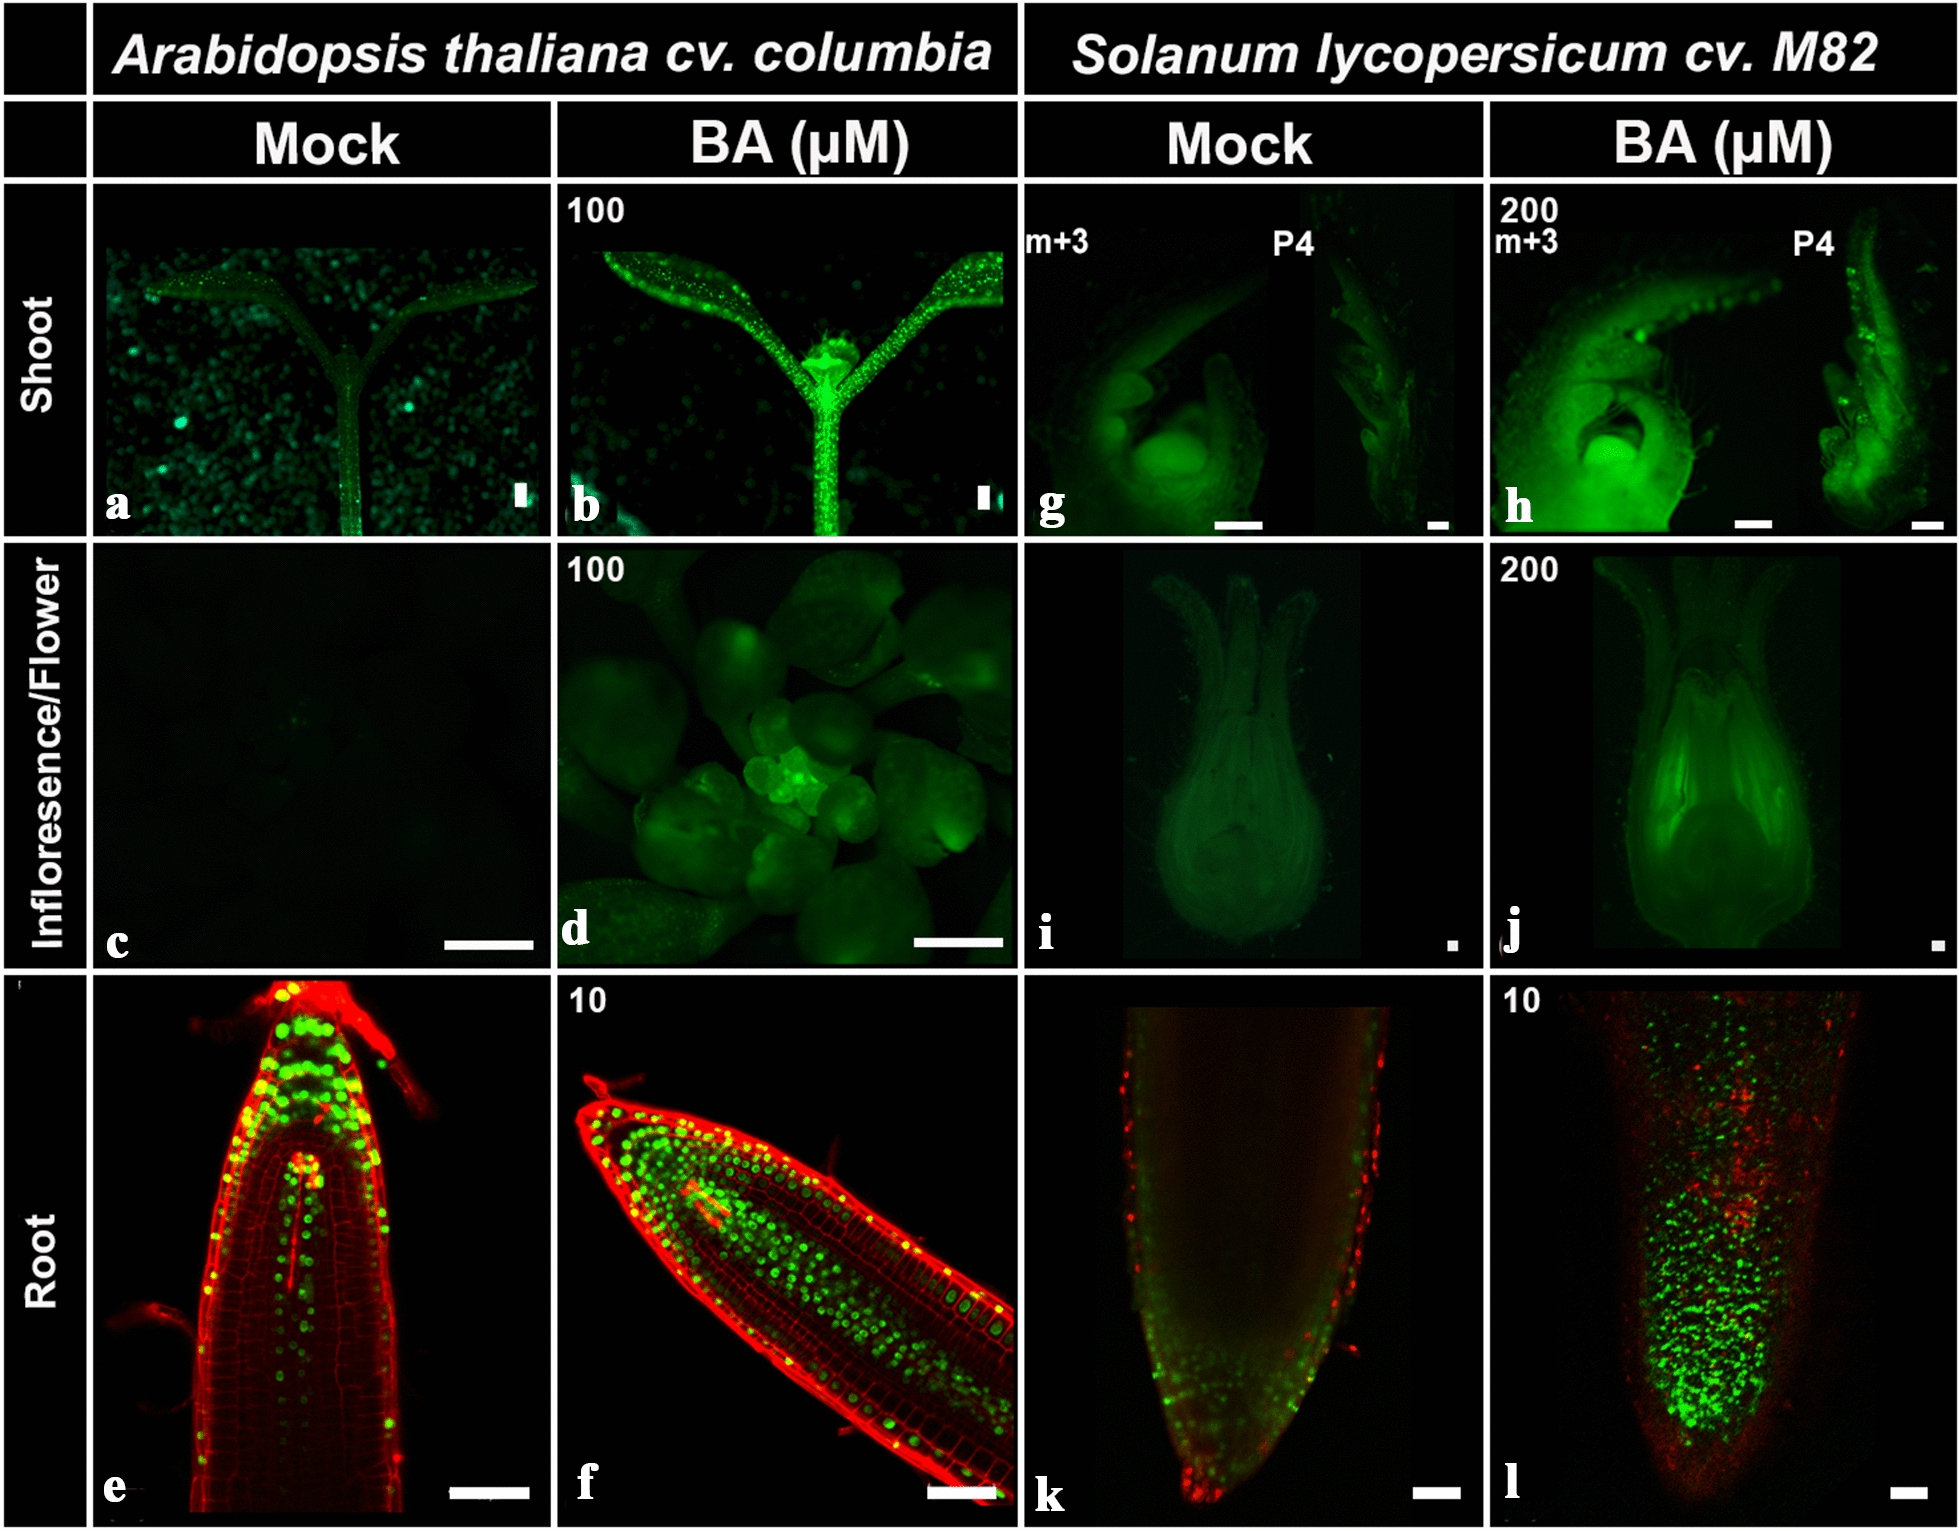
TCSv2:3XVENUS responds to CK treatment. Arabidopsis (A. thaliana Columbia) seedlings (a, b), inflorescences (c, d), and roots (e, f), and Tomato (S. lycopersicum M82) apexes (g, h, developmental stages indicated), flower primordia (i, j) and roots (k, l) were treated with mock or indicated 6-benzylaminopurine (BA) concentrations. Images of TCSv2 driven VENUS expression were captured 24 h after treatment with a Nikon stereomicroscope (a–d, g, h), a Leica SPX confocal microscope (e, f) or a lsm510-META confocal microscope (K-L). Parameters and settings are described in the materials and methods section. Bars = 100 µM
TCS driven VENUS expression is observed primarily in meristematic tissues in the arabidopsis shoot and root, as was reported for previous TCS versions (Fig. 2a, e). Similarly, strong expression was observed in tomato SAM and RAM (Fig. 2g, k). Interestingly, in tomato, strong expression was also observed in the leaf marginal blastozone (Fig. 2g), a meristematic region present in leaf margins and expanded in margin of compound leaves [27]. Upon CK treatment, the VENUS pattern of expression expands to the cotyledons and hypocotyl in arabidopsis (Fig. 2b), and becomes stronger in tomato shoot apexes (Fig. 2h). In roots of both arabidopsis and tomato, TCS driven VENUS expression is observed in the root apex, presumably localized to the root apical meristem, as well as in the columella and internal stele (Fig. 2e, k). This pattern is strengthened and expanded following CK treatment (Fig. 2f, l). TCSv2:NLS-3XVENUS may respond to CK treatment in a dose dependent manner (Additional file 1: Figure S1). Results obtained with TCSv2 in a Ler arabidopsis background were similar (Additional file 1: Figure S2). For some tissues, such as shoot apices, tomato may require a higher concentration of CK to achieve a similar strength response in the same time frame as arabidopsis.
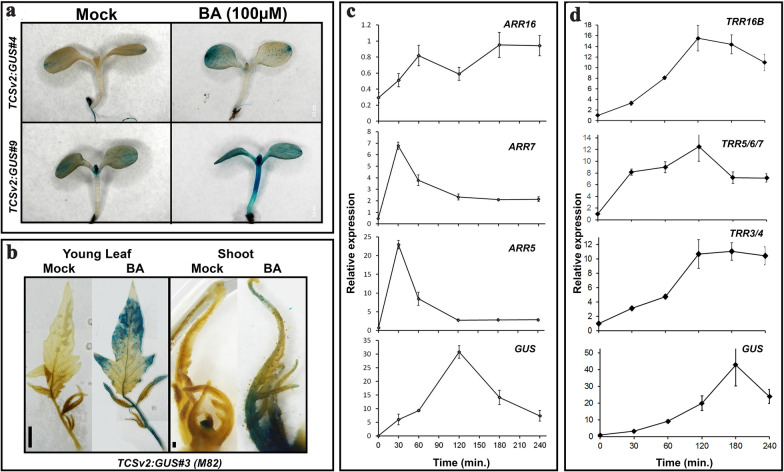
In order to examine the time course of the response of TCSv2 to CK treatment, we utilized a TCSv2:GUS construct (the VENUS construct contains 3 repeats of the VENUS sequence and is therefore unsuitable for qPCR analysis). We first characterized GUS expression in arabidopsis and tomato (Fig. 3). Time course experiments show that TCS-driven GUS mRNA peaks 2 h after CK treatment in arabidopsis (Fig. 3c), and declines soon thereafter. Examination of TypeA ARR genes in the same samples, shows that, as previously reported [28, 29], ARR5 and ARR7 respond earliest, within half an hour of CK treatment (Fig. 3c). In tomato, TCS-driven GUS mRNA peaks 3 h after CK treatment (Fig. 3d), rising and falling slightly slower than in arabidopsis, perhaps reflecting the higher amount of CK needed to elicit a similar response. When comparing TRR expression in tomato to that of the TCS-GUS mRNA, GUS mRNA expression rises in a manner similar to that of TRR16B and TRR3/4, but to a greater degree, rising slowly and peaking 2–3 h from CK treatment, while TRR5/6/7 rises more quickly, showing significant increase in expression 30 min after CK treatment, similar to arabidopsis ARR7 (Fig. 3c, d). TCSv2 can thus be viewed as an “averaging” output of Type A ARR response in terms of time course, representing a response to CK that is later than the earliest responding ARRs but earlier than the later responding ones. Also of note is that in both arabidopsis and tomato, TCSv2 responds more strongly to CK treatment than any one individual RR, perhaps reflecting a combined response output that is normally “divided” between several RR genes. This should be taken into account when conducting analyses using TCSv2.
Fig. 3.
TCSv2 time course following CK treatment. Arabidopsis (A. thaliana Columbia) seedlings (a), and Tomato (S. lycopersicum M82) leaves and apexes (b) were assayed for GUS accumulation with and without CK treatment (6-benzylaminopurine, BA; 100 µM) tissues were harvested 2 and 4 h after treatment respectively). Images were captured with a Nikon stereomicroscope. Bars = 1 cm. GUS and response regulator ARR/TRR relative expression were assayed at indicated time points after CK treatment in arabidopsis (c) and tomato (d). Each point represents at least 3 biological replicas ± SE
TCSv2 driven expression is affected by alterations in endogenous CK levels in tomato
To examine whether TCSv2-driven expression responds to alterations in endogenous CK level alterations in tomato, we backcrossed the tomato VENUS line into transgenic plants overexpressing the arabidopsis CK biosynthesis enzyme Isopentenyltransferase-7 (IPT7) or CK catabolic enzyme Cytokinin Oxidase/Dehydrogenase -3 (CKX3) [30], driven by the FIL promoter. As can be seen in Fig. 4, the TCSv2 sensor responds to an increase in endogenous CK with elevation of VENUS expression (Fig. 4d–f) and to a decrease in endogenous CK with a decrease in VENUS expression (Fig. 4g–i), indicating that the sensor is useful for examining both exogenous and endogenous changes in CK levels. Indeed, we recently successfully utilized the TCSv2 sensor to analyse endogenous effects of different genetic background manipulations on the CK pathway [31–33].
Fig. 4.
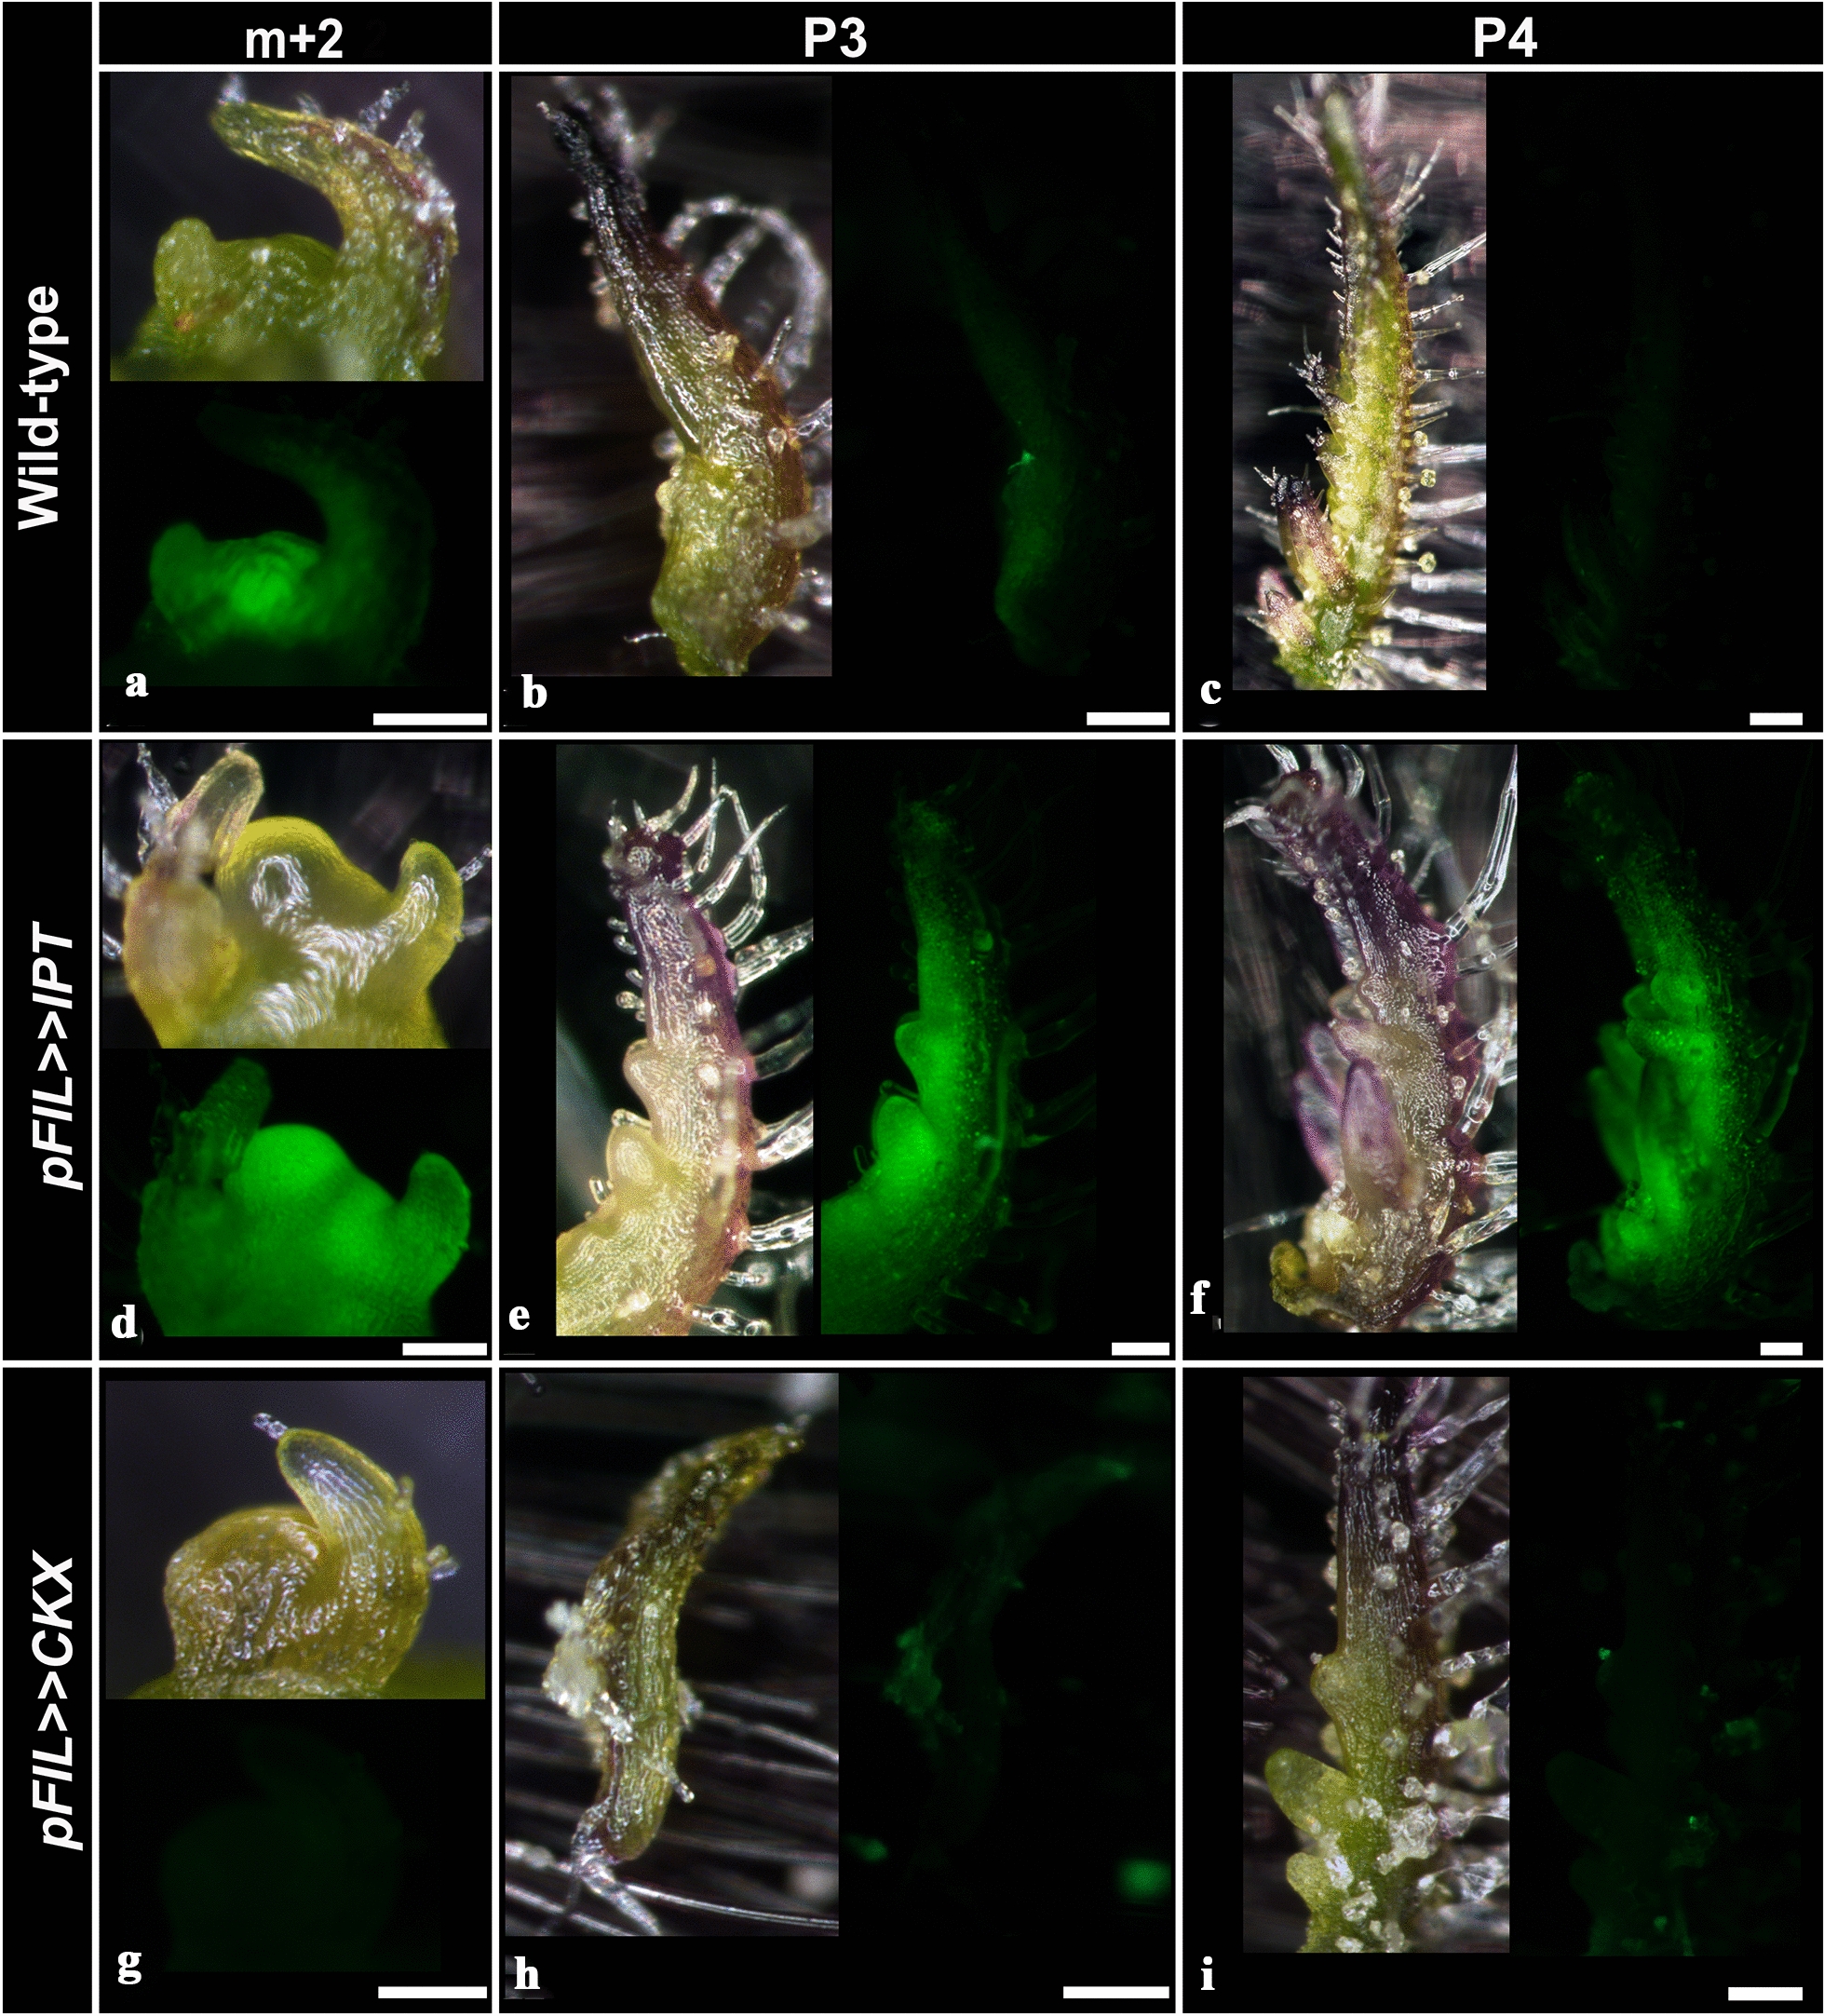
Endogenous CK alterations affect TCSv2 driven expression. Characterization of TCS driven VENUS expression in wild type (WT) Tomato shoot apexes and leaf primordia (S. lycopersicum M82) (a–c), in comparison with apexes and primordia of tomato plants overexpressing pFIL > > IPT7 (d–f) and pFIL > > CKX3 (g–i). Images were captured with a Nikon stereomicroscope. Bars = 100 µM
TCSv2 responds primarily to CK treatment
The balance between different hormones is one of the underlying mechanisms serving plant development, growth, and response to various cues. Cytokinin and gibberellin, as well as cytokinin and auxin, can antagonize each other or act in concert in a variety of processes throughout plant development [30, 34–43]. We therefore tested whether the TCS sensor could possibly respond to additional cues other than CK treatment. Figure 5 demonstrates that TCSv2 responds specifically to CK and does not respond significantly to additional tested hormones at the applied concentrations and within the indicated time frames, in both tomato (VENUS protein expression 12 h after CK treatment, Fig. 5a and Additional file 1: Figure S3A–E) and arabidopsis (GUS mRNA expression 2 h after CK treatment, Fig. 5b). This indicates that the TCSv2 sensor is specific and accurate, in addition to being robust, in the detection of CK response in plants.
Fig. 5.
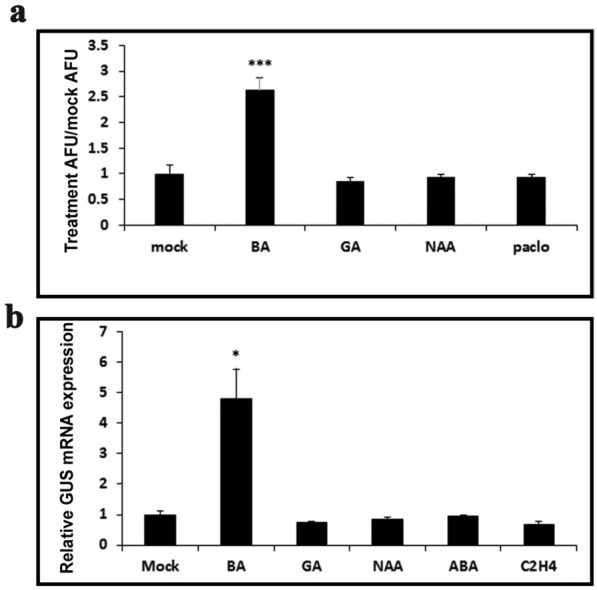
TCSv2 responds primarily to CK. a Quantification of TCS driven VENUS expression in wild type Tomato shoot apexes following treatment with indicated hormones. VENUS expression was quantified as arbitrary fluorescent units (AFU) using ImageJ software [62], using images captured with a Nikon stereomicroscope (5–8 shoots per sample). Representative images are shown in Additional file 1: Figure S3. b GUS relative expression was assayed 2 h after treatment with indicated hormones in arabidopsis. Each point represents at least 3 biological replicas ± SE. In both a and b, Student’s t-test (two-tailed) was used for comparison of means, which were deemed significantly different at P ≤ 0.05
Characterization of TCSv2 driven expression throughout development
The observation that TCSv2 is primarily visible in meristematic tissues, along with published analyses of previous TCS versions in arabidopsis development, prompted a more in depth examination of TCSv2 in various developmental contexts. Figure 6 presents an analysis of TCSv2 driven expression throughout shoot and leaf development in tomato (Fig. 6a–e) and arabidopsis (Fig. 6f–j). In tomato, TCSv2 is expressed in the SAM and at the margin of young leaf primordia. The TCS expression domain, which likely correlates with the marginal blastozone [27], appears to be wider in younger leaf primordia (Fig. 6a–c), and becomes localized and quite thin in older leaf primordia (Fig. 6d, e), consistent with the notion that the young leaf undergoes morphogenesis and reaches maturation concurrently with the loss of its morphogenetic potential and meristematic tissues. This is evident in Additional file 1: Figure S4, which shows older tomato leaves in which the TCS driven signal is localized to the margins of the developing leaflets only (Additional file 1: Figure S4E, the VENUS signal was color coded in dark blue to make it more visible). In contrast, in arabidopsis, which has a simple leaf, the limited morphogenetic potential retained by young leaf primordia serves in the execution of leaf marginal patterning. As such, TCSv2 driven expression can be observed in the SAM (Fig. 6f), and at the adaxial side of the leaf base in young leaf primordia (P1–P3, Fig. 6g). The TCSv2 driven signal is restricted as the leaf matures, in-line with the basipetal differentiation of the arabidopsis leaf. TCSv2 is also present throughout the young leaf venation (Fig. 6h–j), and localized to a small number of cells which mark the leaf tip and the peak/tip of a nascent marginal serration (Fig. 6h–j, marked with asterisks), which presumably maintain some form of meristematic qualities to allow for subsequent leaf marginal patterning, which is dependent on CK response. Consistent with the short marginal blastozone activity, TCSv2 is not observed throughout the leaf margin in arabidopsis.
Fig. 6.
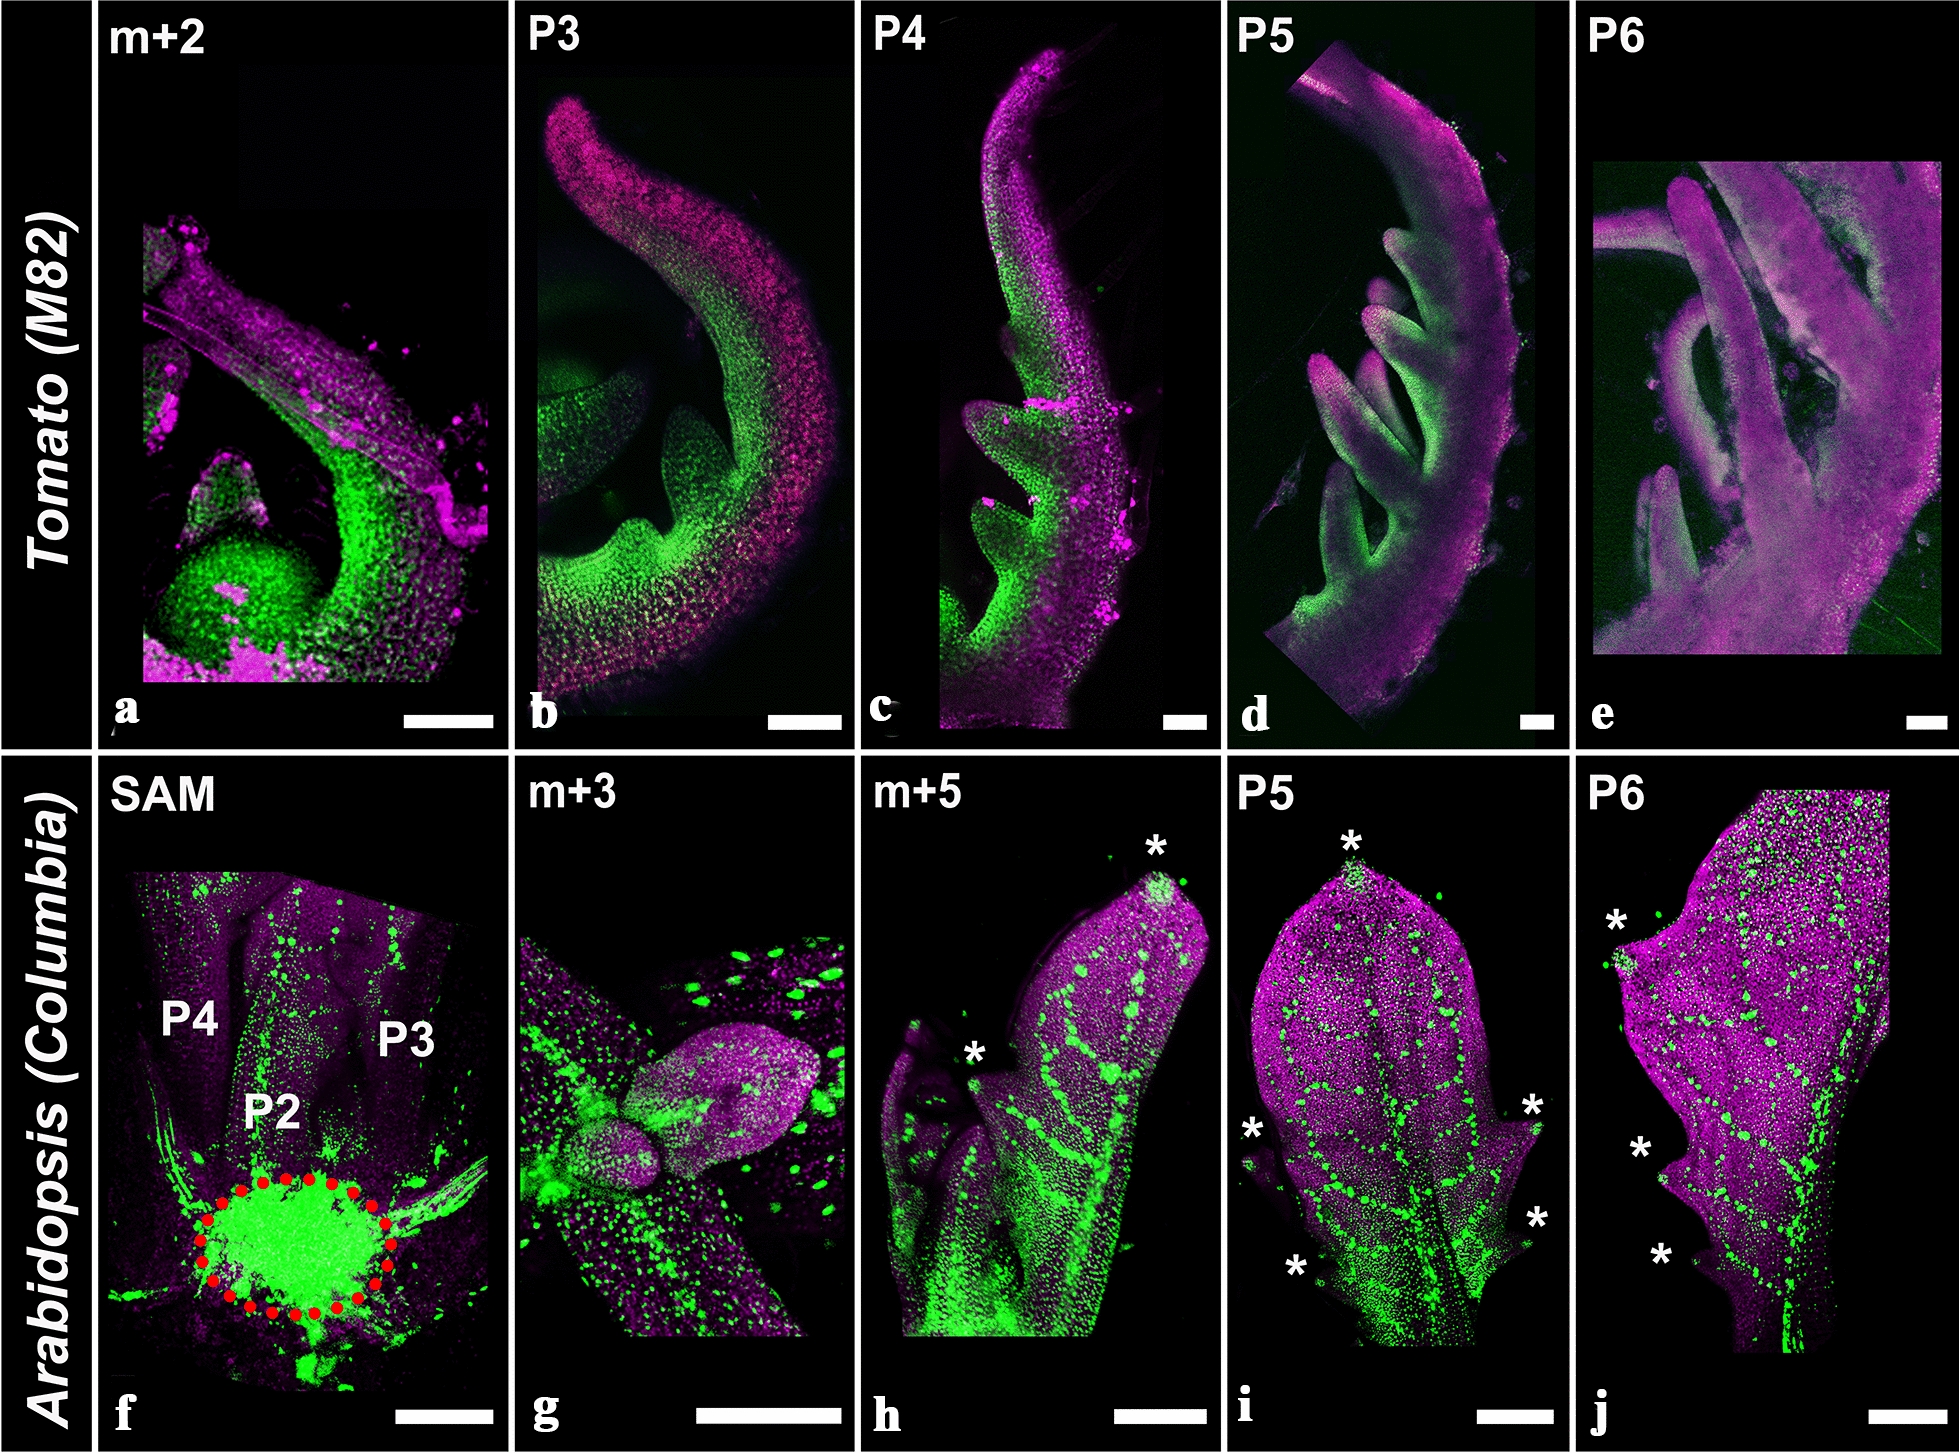
TCSv2 driven expression during leaf development. TCSv2 driven expression at various stages of leaf development in tomato (a–e) and arabidopsis (f–j). The dotted red circle in F marks the shoot apical meristem. Images were taken with a lsm780 confocal microscope. Bars = 100 µM
TCSv2 marks the zone of the incipient axillary bud
CK response has been reported to be crucial in the establishment of the axillary bud [44, 45]. Utilizing TCSv2, we followed the generation of the axillary shoot in tomato. We were able to observe CK response signal in the axils of leaf primordia from the P7 stage onward (Fig. 7). At P7, the TCSv2 signal is present in the leaf axil, though no axillary bud or axillary meristem dome has yet formed (Fig. 7b). At later stages, in the P8-P10 axil, an activated bud with a characteristic TCSv2 signal in the meristem and the margins of the developing leaf primordia can be observed (Fig. 7c, d). Interestingly, after induction of flowering, we see TCSv2-driven expression in the axils of younger, P6 primordia (Fig. 7e). When the reproductive transition state is coupled with elevation of endogenous Cytokinin present in pFIL > > IPT7 overexpressing plants, the TCSv2 signal is observed in the axils of even younger primordia—P4 and P5 (Fig. 7f). Notably, TCS driven GFP expression using the first TCS version [8] was observed in the leaf axils of P6 and older leaf primordia in arabidopsis [46].
Fig. 7.
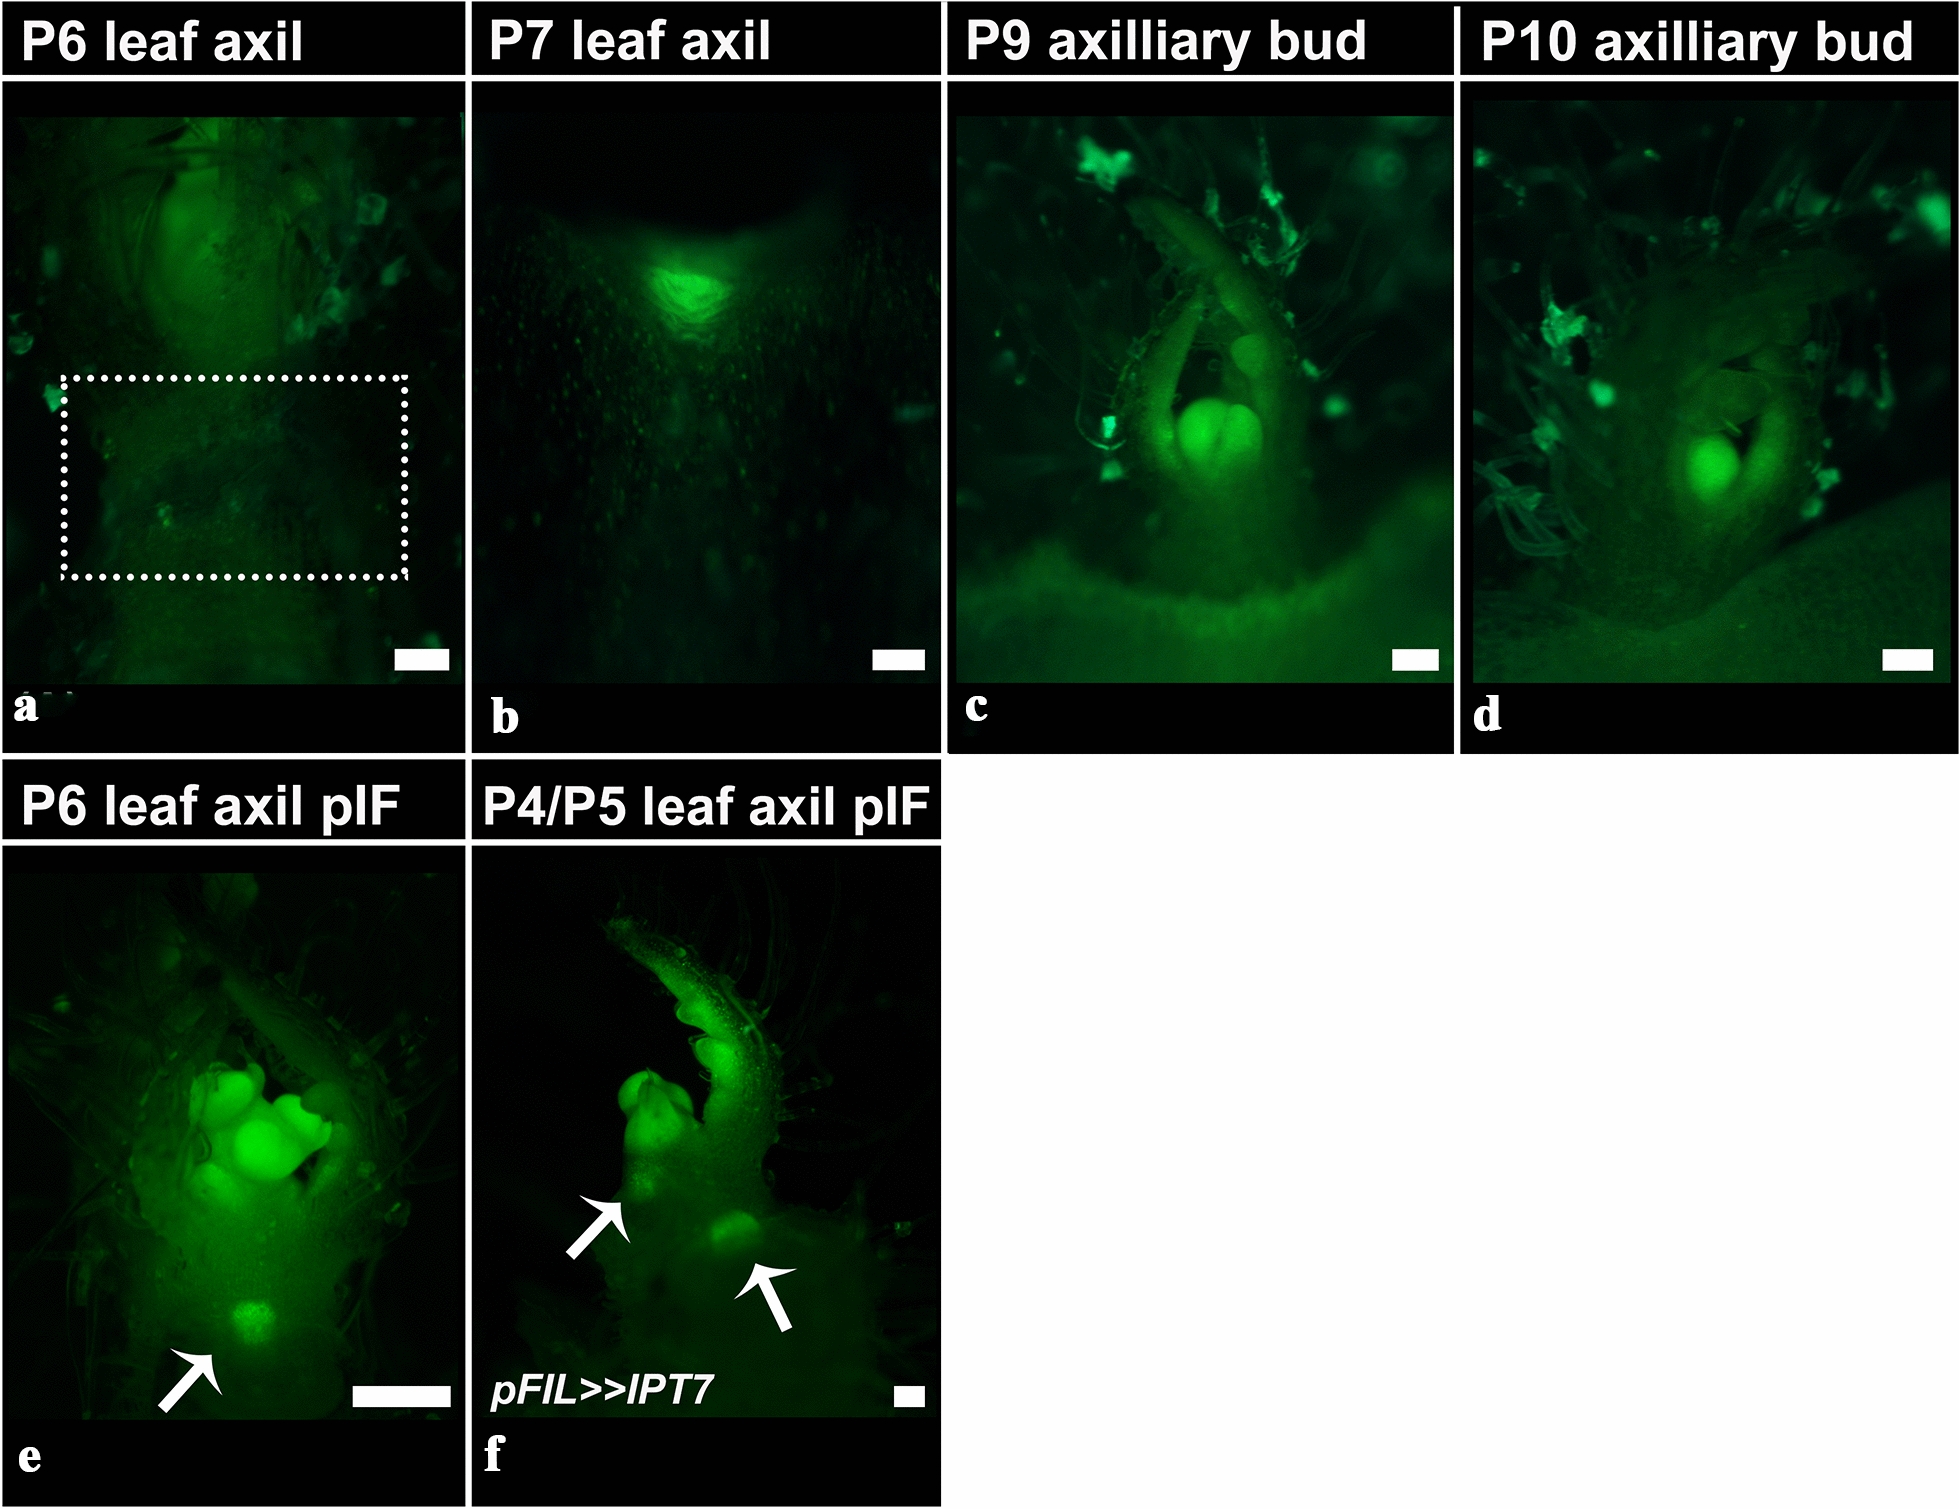
TCSv2 driven expression during axillary bud/shoot activation in tomato. TCSv2 driven expression in tomato leaf axils of leaves at different developmental stages, before (a–d) and after (e, f) flowering induction. Dotted box in A marks the axil of the removed P6. Arrows in e and f indicate the axils of leaves that were removed. Images were taken with a Nikon stereomicroscope. Bars = 100 µM
TCSv2 driven expression is observed in all stages of reproductive organ development
As reported previously and here above, CK response and TCSv2 driven expression are primarily observed in meristematic tissues. This is the case also in reproductive organ development (Fig. 8). TCSv2 is observed during the transition to flowering in the domed meristem (Fig. 8a), the transitional meristem (Fig. 8b), and the inflorescence and floral meristems (Fig. 8c). Once reproductive organs have formed, we can observe TCSv2 in the anthers and filaments (Fig. 8d, e) and the ovules (Fig. 8e), indicating that CK response is required for proper reproductive organ development.
Fig. 8.
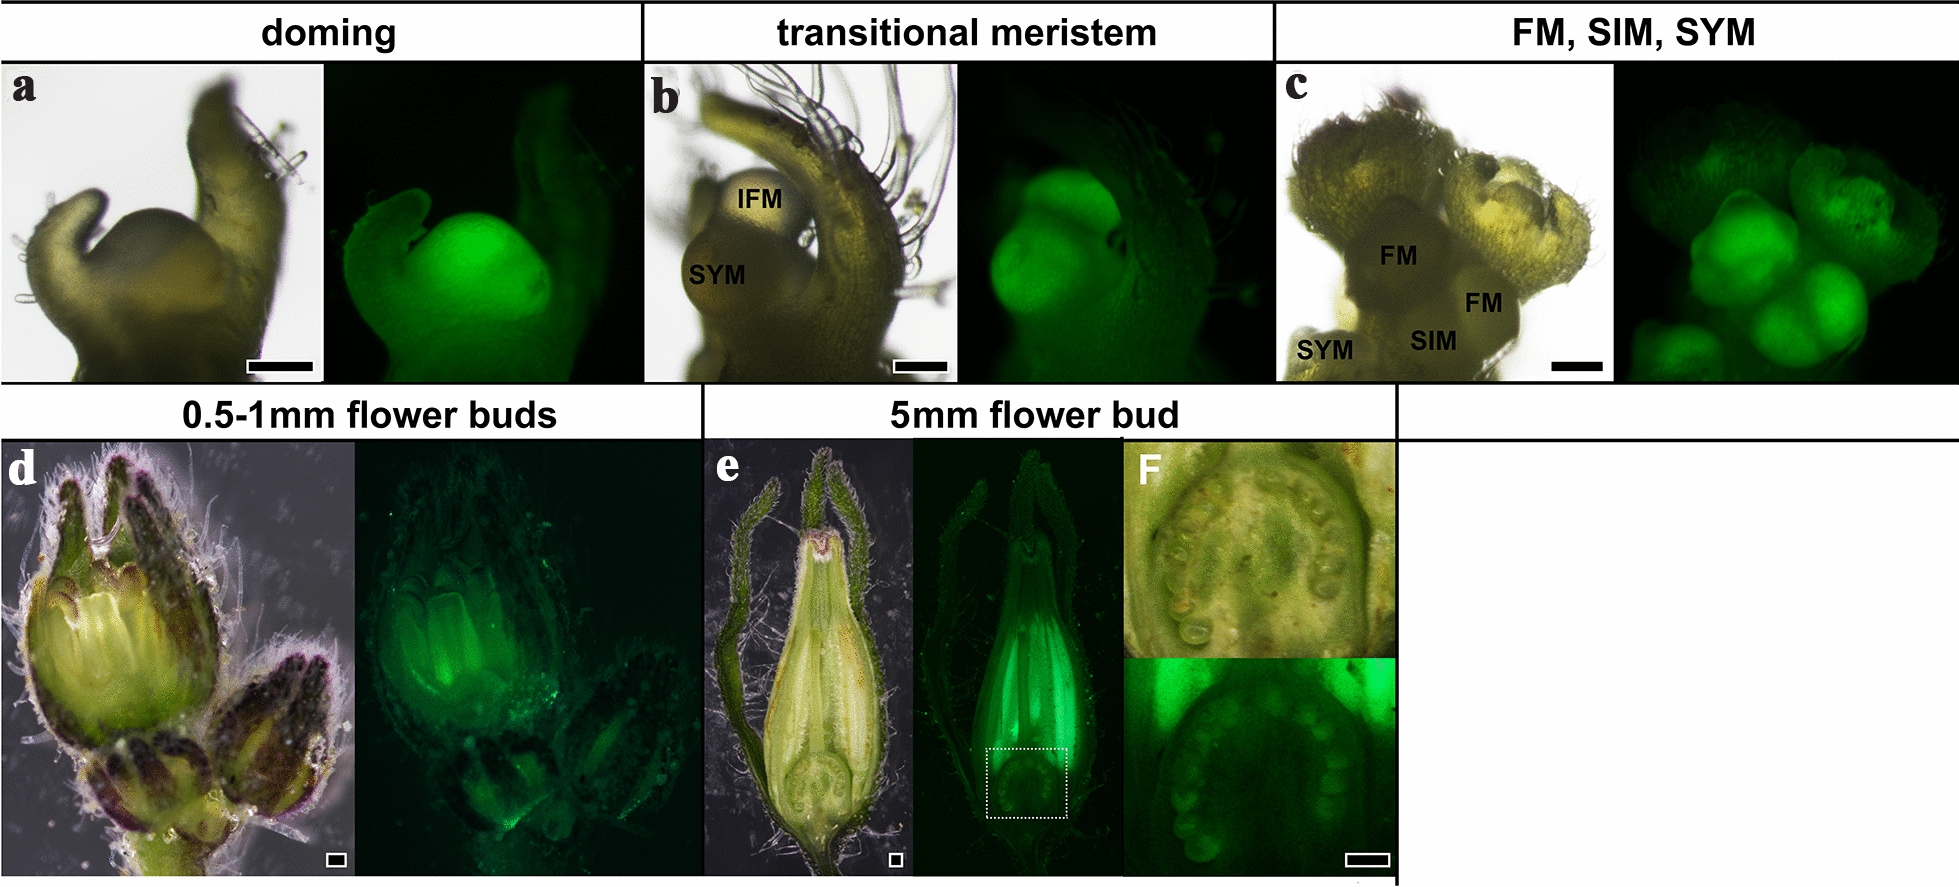
TCSv2 driven expression during flower development in tomato. TCSv2 driven expression at various stages of flower development in tomato. Images were taken with a Nikon stereomicroscope. FM floral meristem, IFM inflorescence meristem, SIM sympodial inflorescence meristem, SYM sympodial meristem. Bars = 100 µM
In mature embryos, TCSv2 driven expression is observed very strongly in the region of the RAM (Additional file 1: Figure S5A–C), but, interestingly, can barely be seen in the progenitor cells of the SAM, both in desiccated and imbibed seeds, even after germination (Additional file 1: Figure S5A–C). Following cotyledon expansion and generation of the nascent SAM structure, TCSv2 driven expression can be observed in the meristem and young P1 (L2) and P2 (L1) leaves (Additional file 1: Figure S5D, E). Different versions of TCS can therefore be used in order to obtain a full picture of CK response in plant tissues. A combination of different TCS promoters could be useful, depending on the exact nature of the processes being observed.
Discussion
Here we report a new version of the CK sensor TCS, which is more sensitive than previous versions, and characterize its expression patterns in response to CK treatment and during developmental processes in both arabidopsis and tomato. The differences between the TCS versions should be taken into account when considering which version of TCS to work with.
During leaf development, the young leaf undergoes morphogenesis and reaches the maturation stage of its development concurrently with the loss of its morphogenetic potential. The morphogenetic potential of tomato leaves serves to model compound leaves bearing leaflets, from a meristematic region termed the marginal blastozone [27], while in arabidopsis the more limited morphogenetic potential of young leaf primordia serves in the execution of leaf marginal patterning, resulting in serrations at the leaf margin. The leaf morphogenetic potential is marked by meristematic / totipotent / stem/ cells, which respond to CK and exhibit TCS driven expression. The tomato compound leaf retains morphogenetic potential, and expresses TCSv2 throughout the leaf margin. The older the leaf becomes, the lower its morphogenetic potential, and thus, the weaker and more localized the TCS signal becomes. TCSv2, and likely other TCS versions, could therefore serve as a marginal blastozone marker in tomato. In arabidopsis, TCSv2 driven expression is absent from the leaf margins, but is retained in the leaf base, where undifferentiated cells remain for a longer time during development. Leaf differentiation is a gradual process, and in many plant species, cell differentiation and expansion progress from the leaf tip towards the base in a moving “cell cycle arrest front” [47, 48].
TCSv2 also marks CK response in axillary bud formation and activation in tomato. CK is known to be required for axillary bud activation [49]. CK biosynthesis was suggested to correlate with bud outgrowth [44], and auxin was demonstrated to regulate the synthesis of CKs [50] and negatively regulate local biosynthesis of CKs by controlling the expression of isopentenyltransferase (IPT) genes [51], suggesting that auxin-dependent apical dominance is exerted, at least in part, by inhibiting axillary bud growth via CK inhibition. However, this is likely more complex, as recently it was reported that defects in bud CK response do not affect auxin-mediated bud inhibition in arabidopsis [52]. Observing TCSv2 driven expression in tomato leaf axils, we were able to determine that axil CK response is activated in developmentally younger leaf axils after the plant has undergone an induction to flowering, perhaps suggesting that the apical dominance of the plant is somewhat reduced after it has transitioned to its reproductive stage. Indeed, it was recently demonstrated that increased CK levels in subapical axillary buds coincide with a release from apical dominance after floral transition in chrysanthemum [49]. We also showed that apical dominance is reduced further when the CK pathway is manipulated, consistent with published data that overproduction of CK in leaf axils can rescue axillary meristem initiation deficiency in rax mutants in arabidopsis [53], and that CK application to tomato seedlings promotes axillary bud outgrowth [54].
TCSv2 driven expression was observed in ovules and stamens, demonstrating that CK response is required for proper reproductive organ development during the reproductive stage in tomato. Indeed, mutants impaired in the CK pathway have varying degrees of reduced fertility [55–58]. It will be interesting to examine TCSv2 driven expression during the various stages of flower and fruit development in tomato.
Conclusions
We present here a new version of the TCS CK sensor, TCSv2, which responds to CK in various tissues in both arabidopsis and tomato. TCSv2 proved very useful in following several developmental processes and is an important addition to those interested in following CK responses in planta, with the exception of embryo development.
Materials and methods
Cloning and plant transformation
The CK responsive promoter-reporter TWO-COMPONENT OUTPUT SENSOR VERSION2 (TCSv2) harbours concatamerized type B ARR-binding motifs and is a variant of TCSn [24], with alternating head-to-head and tail-to-tail orientations of type B ARR-binding sites compared with the tandem tail-to-tail and head-to-head orientation of sites in TCSn. TCSv2 reflects the activity of the CK phosphorelay cascade. The sequence of TCSv2 is 5′-CAAAGATTTTGCAAAATCTTTTAAAGGATTTTGAAAGATCTTTGCAAAGATCTTTATAAATCTTTTCAAAGATTTTTCAAGATCCGATTAAAGATTTTGCAAAATCTTTAGAGAGATCTTTCAAAATCCAACGCTAGTCAAAGATTTTGCAAAATCTTTTAAAGGATTTTGAAAGATCTTTGCAAAGATCTTTATAAATCTTTTCAAAGATTTTTCAAGATCCGATTAAAGATTTTGCAAAATCTTTAGAGAGATCTTTCAAAATCCAAC-3′.
For TCSv2:3XVENUS, the DNA sequence of TCSv2 was synthesized with flanking NsiI and BamHI restriction sites [32]. The synthetic promoter was then cloned adjacent to 3xVENUS-N7 in the pBJ36 vector [59]. The construct was subcloned into the pGREEN binary vector. For TCSv2::GUS, TCSv2 was ligated to the β-galactosidase (GUS) gene from Escherichia coli to generate a TCSv2:GUS fusion in pART27 [33]. Constructs were introduced into arabidopsis Ler and Col backgrounds by floral dipping, and into tomato M82 according to [60]. Kanamycin resistant transformants were selected.
Transgenic tomato plants overexpressing pFIL > > IPT7 and pFIL > > CKX3 have been described previously [30].
Transient protoplast expression
Protoplast isolation and transfection experiments were performed as reported [23, 24]. All protoplast experiments were performed in duplicates, and independent biological replicates yielded similar results.
CK and hormone treatments
All exogenous applications of the synthetic CK 6-benzylaminopurine (BA) (Sigma-Aldrich, St Louis, MO, USA) were performed by spraying or immersing the plants for 5 min. Absicic acid (ABA, 100 µM), 1-Naphthaleneacetic acid (NAA, 100 µM), gibberellic acid (GA, 100 µM) paclobutrazol (paclo, 10 mg/mL), all from Sigma-Aldrich, and Ethylene (Ethrel, Bayer Cropscience) were applied by spraying. All hormone treatments included the surfactant Tween 20 (100 μl l−1).
Tissue preparation and imaging
Dissected whole-leaf primordia, shoots, leaves, leaf axils, inflorescences, flowers, roots and embryos were placed into drops of water on glass microscope slides and covered with cover slips. Roots and embryos were stained with PI (Propidium iodide, Sigma-Aldrich P4170, 10-20ug/mL final concentration in water for 2 min with subsequent washing) prior to mounting. GUS staining was carried out essentially as described in Ori et al., 2000 [61]: Plant tissue was vacuum infiltrated for 1 min in a solution containing 25 mM phosphate buffer, pH 7, 0.25% Triton X-100, 1.25 mM potassium ferricyanide, 1.25 mM potassium ferrocyanide, 0.25 mM EDTA, 1 mg/ml 5 bromo-4 chloro-3-indolyl-β-D-glucuronide (X-Glucoside, Inalco Pharmaceuticals), and incubated overnight at 37 °C. Tissue was then cleared in 95% ethanol, gradually brought to 50% ethanol and then to 50% glycerol. Tissue was photographed in 50% glycerol.
The pattern of VENUS expression was detected by a confocal laser scanning microscope (CLSMmodel SP8; Leica), with the solid-state laser set at 514 nm for excitation and 530 nm for emission. Chlorophyll-A was detected at 488 nm for excitation and 700 nm for emission. Alternatively, the pattern of VENUS expression was also observed with a Leica CLSM model SP5 or a Zeiss lsm780 confocal microscope (VENUS excitation: 488 nm; emission: 536 nm. Chlorophyll-A excitation: 561 nm; emission: 680 nm. PI excitation: 561 nm; emission: 648 nm). VENUS expression and GUS staining were further observed with a Nikon SMZ1270 stereomicroscope equipped with a Nikon DS-RI2 camera and NIS elements software. The expression of VENUS was also quantified using ImageJ software [62].
Tissue collection, RNA preparation and analysis
Arabidopsis RNA was extracted using the RNeasy Mini Kit (Qiagen) according to the manufacturer’s instructions, except that samples were incubated for 30 min at room temperature after addition of the lysis buffer. cDNA synthesis was performed using the SuperScript™ II Reverse Transcriptase cDNA Kit (invitrogen) with 3 µg of RNA. Tomato RNA preparation and qRT-PCR analysis were performed as previously described [63]. Quantitative reverse transcription-PCR analysis was performed using the Absolute Blue qPCR SYBR Green ROX Mix (AB-4162/B) kit (Thermo Fisher Scientific). Reactions were performed using a Rotor-Gene 6000 cycler (Corbett Research). A standard curve was obtained for each gene using dilutions of a cDNA sample. Each gene was quantified using Corbett Research Rotor-Gene software. Values are means of at least three biological repeats, each containing for tomato: the above ground tissue of 2 week-old seedlings treated as indicated (4–6 seedlings per sample), and for arabidopsis: ~ 30 µg of ten day-old seedlings treated as indicated.
Expression of tomato genes was normalized relative to tomato EXPRESSED (EXP), and expression of arabidopsis genes was normalized relative to arabidopsis TUBULIN BETA CHAIN3 (B-TUB3). Primer sequences used for the qRT-PCR analyses are detailed in Additional file 1: Table S1. Student’s t-test (two-tailed) was used for comparison of means, which were deemed significantly different at P ≤ 0.05.
Supplementary information
Additional file 1: Figure S1. Possible dose effects of the TCSv2:3XVENUS response to CK treatment. Arabidopsis (top, Columbia seedlings are depicted) and tomato (bottom, M82 shoots are depicted) were treated with mock or indicated concentrations of BA (6-benzylaminopurine) for 24-48 hours. Images were taken with a Nikon stereomicroscope. Bars= 100 µM. Figure S2. TCSv2 driven expression in arabidopsis in the Ler background. Arabidopsis seedlings in the Ler background expressing TCSv2 driven VENUS (top) or GUS (bottom), with or without (mock) BA (6-benzylaminopurine) treatment, were photographed 24 hours after CK treatment or subjected to GUS staining 24 hours after CK treatment. Images were taken with a Nikon stereomicroscope. Bars= 100 µM. Figure S3. TCSv2 responds primarily to CK. Characterization of TCS driven VENUS expression in wild type tomato shoot apexes following treatment with indicated hormones. Images were captured with a Nikon stereomicroscope. Bars= 100 µM. Figure S4. Stereomicroscope analysis of TCSv2 driven expression in tomato leaves. Tomato seedlings expressing TCSv2 driven VENUS at various stages of leaf development as indicated. Images were taken with a Nikon stereomicroscope. The VENUS channel was hue-masked using Adobe photoshop to a dark blue color in order to better visualize it when superimposed on light microscopy images of the young developing leaves. Bars= 100 µM. Figure S5. TCSv2 driven expression in the tomato embryo. TCSv2 driven expression in mature tomato embryos. Images were taken with a Nikon stereomicroscope. The root apical meristem is indicated with an asterisk (A-C) and the shoot apical meristem is marked with a dotted box (A-D). The area in the dotted box in D is enlarged in E. Bars= 100 µM. Table S1. Primer pairs used in this work.
Acknowledgements
MB thanks members of the Bar, Ori, Weiss and Eshed groups, for continuous discussion and support.
Authors’ contributions
ES, NO, BM and MB conceived and designed the study. ES, AI, RG, IS, IN, M-LM, LT, ZA, MF and MB formulated the methodology and carried out the experiments. ES, AI, RG, IS, IN, M-LM, and MB analyzed the data. All authors contributed to the writing of the manuscript. All authors read and approved the final manuscript.
Funding
No funding received for this work.
Availability of data and materials
All data generated or analysed during this study are included in this published article and its supplementary information files.
Ethics approval and consent to participate
Not applicable.
Consent for publication
Not applicable.
Competing interests
The authors declare that they have no competing interests.
Footnotes
Publisher's Note
Springer Nature remains neutral with regard to jurisdictional claims in published maps and institutional affiliations.
Supplementary information
Supplementary information accompanies this paper at 10.1186/s13007-020-00694-2.
References
- 1.Werner T, Schmülling T. Cytokinin action in plant development. Curr Opin Plant Biol. 2009;12:527–538. doi: 10.1016/j.pbi.2009.07.002. [DOI] [PubMed] [Google Scholar]
- 2.Sakakibara H. Cytokinins: activity, biosynthesis, and translocation. Annu Rev Plant Biol. 2006;57:431. doi: 10.1146/annurev.arplant.57.032905.105231. [DOI] [PubMed] [Google Scholar]
- 3.Keshishian EA, Rashotte AM. Plant cytokinin signalling. Essays Biochem. 2015;58:13–27. doi: 10.1042/bse0580013. [DOI] [PubMed] [Google Scholar]
- 4.Mok DW, Mok MC. Cytokinin metabolism and action. Ann Rev Plant Physiol Plant MolBiol. 2001;52:89–118. doi: 10.1146/annurev.arplant.52.1.89. [DOI] [PubMed] [Google Scholar]
- 5.Wybouw B, De Rybel B. Cytokinin—a developing story. Trends Plant Sci. 2019;24:177–185. doi: 10.1016/J.TPLANTS.2018.10.012. [DOI] [PubMed] [Google Scholar]
- 6.Kieber JJ, Schaller GE. Cytokininsignaling in plant development. Development. 2018 doi: 10.1242/dev.149344. [DOI] [PubMed] [Google Scholar]
- 7.Hwang I, Sheen J. Two-component circuitry in Arabidopsis cytokinin signal transduction. Nature. 2001;413:383–389. doi: 10.1038/35096500. [DOI] [PubMed] [Google Scholar]
- 8.Müller B, Sheen J. Cytokinin and auxin interaction in root stem-cell specification during early embryogenesis. Nature. 2008;453:1094–1097. doi: 10.1038/nature06943. [DOI] [PMC free article] [PubMed] [Google Scholar]
- 9.Zubo YO, Schaller GE. Role of the cytokinin-activated type-B response regulators in hormone crosstalk. Plants. 2020 doi: 10.3390/plants9020166. [DOI] [PMC free article] [PubMed] [Google Scholar]
- 10.Huo R, Liu Z, Yu X, Li Z. The interaction network and signaling specificity of two-component system in arabidopsis. Int J Mol Sci. 2020;21:4898. doi: 10.3390/ijms21144898. [DOI] [PMC free article] [PubMed] [Google Scholar]
- 11.Béres T, Gemrotová M, Tarkowski P, Ganzera M, Maier V, Friedecký D, et al. Analysis of cytokinin nucleotides by capillary zone electrophoresis with diode array and mass spectrometric detection in a recombinant enzyme in vitro reaction. Anal Chim Acta. 2012;751:176–181. doi: 10.1016/j.aca.2012.08.049. [DOI] [PubMed] [Google Scholar]
- 12.Cai B-D, Zhu J-X, Shi Z-G, Yuan B-F, Feng Y-Q. A simple sample preparation approach based on hydrophilic solid-phase extraction coupled with liquid chromatography-tandem mass spectrometry for determination of endogenous cytokinins. J Chromatogr B Anal Technol Biomed Life Sci. 2013;942–943:31–36. doi: 10.1016/j.jchromb.2013.10.024. [DOI] [PubMed] [Google Scholar]
- 13.Chen W, Gai Y, Liu S, Wang R, Jiang X. Quantitative analysis of cytokinins in plants by high performance liquid chromatography: electronspray ionization ion trap mass spectrometry. J Integr Plant Biol. 2010;52:925–932. doi: 10.1111/j.1744-7909.2010.00989.x. [DOI] [PubMed] [Google Scholar]
- 14.Du F, Sun L, Zhen X, Nie H, Zheng Y, Ruan G, et al. High-internal-phase-emulsion polymeric monolith coupled with liquid chromatography-electrospray tandem mass spectrometry for enrichment and sensitive detection of trace cytokinins in plant samples. Anal Bioanal Chem. 2015;407:6071–6079. doi: 10.1007/s00216-015-8782-3. [DOI] [PubMed] [Google Scholar]
- 15.Liang Y, Zhu X, Zhao M, Liu H. Sensitive quantification of isoprenoid cytokinins in plants by selective immunoaffinity purification and high performance liquid chromatography-quadrupole-time of flight mass spectrometry. Methods. 2012;56:174–179. doi: 10.1016/j.ymeth.2011.08.006. [DOI] [PubMed] [Google Scholar]
- 16.Liu Z, Yuan B-F, Feng Y-Q. Tandem solid phase extraction followed by online trapping-hydrophilic interaction chromatography-tandem mass spectrometry for sensitive detection of endogenous cytokinins in plant tissues. Phytochem Anal. 2012;23:559–568. doi: 10.1002/pca.2353. [DOI] [PubMed] [Google Scholar]
- 17.Novák O, Hauserová E, Amakorová P, Dolezal K, Strnad M. Cytokinin profiling in plant tissues using ultra-performance liquid chromatography-electrospray tandem mass spectrometry. Phytochemistry. 2008;69:2214–2224. doi: 10.1016/j.phytochem.2008.04.022. [DOI] [PubMed] [Google Scholar]
- 18.Tarkowski P, Floková K, Václavíková K, Jaworek P, Raus M, Nordström A, et al. An improved in vivo deuterium labeling method for measuring the biosynthetic rate of cytokinins. Molecules. 2010;15:9214–9229. doi: 10.3390/molecules15129214. [DOI] [PMC free article] [PubMed] [Google Scholar]
- 19.Novák O, Tarkowski P, Tarkowská D, Doležal K, Lenobel R, Strnad M. Quantitative analysis of cytokinins in plants by liquid chromatography–single-quadrupole mass spectrometry. Anal Chim Acta. 2003;480:207–218. doi: 10.1016/S0003-2670(03)00025-4. [DOI] [Google Scholar]
- 20.Kisiala A, Kambhampati S, Stock NL, Aoki M, Emery RJN. Quantification of cytokinins using high-resolution accurate-mass orbitrap mass spectrometry and parallel reaction monitoring (PRM) Anal Chem. 2019;91:15049–15056. doi: 10.1021/acs.analchem.9b03728. [DOI] [PubMed] [Google Scholar]
- 21.Yamada H, Suzuki T, Terada K, Takei K, Ishikawa K, Miwa K, et al. The Arabidopsis AHK4 histidine kinase is a cytokinin-binding receptor that transduces cytokinin signals across the membrane. Plant Cell Physiol. 2001;42:1017–1023. doi: 10.1093/pcp/pce127. [DOI] [PubMed] [Google Scholar]
- 22.Wang L, Chong K. The essential role of cytokininsignaling in root apical meristem formation during somatic embryogenesis. Front Plant Sci. 2016;6:1196. doi: 10.3389/fpls.2015.01196. [DOI] [PMC free article] [PubMed] [Google Scholar]
- 23.Yoo S-D, Cho Y-H, Sheen J. Arabidopsis mesophyll protoplasts: a versatile cell system for transient gene expression analysis. Nat Protoc. 2007;2:1565–1572. doi: 10.1038/nprot.2007.199. [DOI] [PubMed] [Google Scholar]
- 24.Zürcher E, Tavor-Deslex D, Lituiev D, Enkerli K, Tarr PT, Müller B. A robust and sensitive synthetic sensor to monitor the transcriptional output of the cytokinin signaling network in planta. Plant Physiol. 2013;161:1066–1075. doi: 10.1104/pp.112.211763. [DOI] [PMC free article] [PubMed] [Google Scholar]
- 25.Tao J, Sun H, Gu P, Liang Z, Chen X, Lou J, et al. A sensitive synthetic reporter for visualizing cytokinin signaling output in rice. Plant Methods. 2017;13:89. doi: 10.1186/s13007-017-0232-0. [DOI] [PMC free article] [PubMed] [Google Scholar]
- 26.Kirschner GK, Stahl Y, Imani J, von Korff M, Simon R. Fluorescent reporter lines for auxin and cytokinin signalling in barley (Hordeum vulgare) PLoS ONE. 2018;13:e0196086. doi: 10.1371/journal.pone.0196086. [DOI] [PMC free article] [PubMed] [Google Scholar]
- 27.Hagemann W, Gleissberg S. Organogenetic capacity of leaves: the significance of marginal blastozones in angiosperms. Plant Syst Evol. 1996;199:121–152. doi: 10.1007/BF00984901. [DOI] [Google Scholar]
- 28.Lee DJ, Park J-Y, Ku S-J, Ha Y-M, Kim S, Kim MD, et al. Genome-wide expression profiling of Arabidopsis Response Regulator 7(ARR7) overexpression in cytokinin response. Mol Genet Genom. 2007;277:115–137. doi: 10.1007/s00438-006-0177-x. [DOI] [PubMed] [Google Scholar]
- 29.Ren B, Liang Y, Deng Y, Chen Q, Zhang J, Yang X, et al. Genome-wide comparative analysis of type-A Arabidopsis response regulator genes by overexpression studies reveals their diverse roles and regulatory mechanisms in cytokinin signaling. Cell Res. 2009;19:1178–1190. doi: 10.1038/cr.2009.88. [DOI] [PubMed] [Google Scholar]
- 30.Shani E, Ben-Gera H, Shleizer-Burko S, Burko Y, Weiss D, Ori N. Cytokinin regulates compound leaf development in tomato. Plant Cell. 2010;22:3206–3217. doi: 10.1105/tpc.110.078253. [DOI] [PMC free article] [PubMed] [Google Scholar]
- 31.Bar M, Israeli A, Levy M, Ben Gera H, Jiménez-Gómez JM, Kouril S, et al. CLAUSA is a MYB transcription factor that promotes leaf differentiation by attenuating cytokininsignaling. Plant Cell. 2016;28:1602–1615. doi: 10.1105/tpc.16.00211. [DOI] [PMC free article] [PubMed] [Google Scholar]
- 32.Steiner E, Livne S, Kobinson-Katz T, Tal L, Pri-Tal O, Mosquna A, et al. SPINDLY inhibits class I TCP proteolysis to promote sensitivity to cytokinin. Plant Physiol. 2016 doi: 10.1104/pp.16.00343. [DOI] [PMC free article] [PubMed] [Google Scholar]
- 33.Farber M, Attia Z, Weiss D. Cytokinin activity increases stomatal density and transpiration rate in tomato. J Exp Bot. 2016;67:6351–6362. doi: 10.1093/jxb/erw398. [DOI] [PMC free article] [PubMed] [Google Scholar]
- 34.Vidaurre DP, Ploense S, Krogan NT, Berleth T. AMP1 and MP antagonistically regulate embryo and meristem development in Arabidopsis. Development. 2007;134:2561–2567. doi: 10.1242/dev.006759. [DOI] [PubMed] [Google Scholar]
- 35.Chandler JW, Werr W. Cytokinin-auxin crosstalk in cell type specification. Trends Plant Sci. 2015;20:291–300. doi: 10.1016/j.tplants.2015.02.003. [DOI] [PubMed] [Google Scholar]
- 36.Zhao Y. Auxin biosynthesis and its role in plant development. Annu Rev Plant Biol. 2010;61:49–64. doi: 10.1146/annurev-arplant-042809-112308. [DOI] [PMC free article] [PubMed] [Google Scholar]
- 37.Zhao Z, Andersen SU, Ljung K, Dolezal K, Miotk A, Schultheiss SJ, et al. Hormonal control of the shoot stem-cell niche. Nature. 2010;465:1089–1092. doi: 10.1038/nature09126. [DOI] [PubMed] [Google Scholar]
- 38.Greenboim-Wainberg Y, Maymon I, Borochov R, Alvarez J, Olszewski N, Ori N, et al. Cross talk between gibberellin and cytokinin: the Arabidopsis GA response inhibitor SPINDLY plays a positive role in cytokininsignaling. Plant Cell. 2005;17:92–102. doi: 10.1105/tpc.104.028472. [DOI] [PMC free article] [PubMed] [Google Scholar]
- 39.Fleishon S, Shani E, Ori N, Weiss D. Negative reciprocal interactions between gibberellin and cytokinin in tomato. New Phytol. 2011;190:609–617. doi: 10.1111/j.1469-8137.2010.03616.x. [DOI] [PubMed] [Google Scholar]
- 40.Steiner E, Efroni I, Gopalraj M, Saathoff K, Tseng TS, Kieffer M, et al. The Arabidopsis O-linked N-acetylglucosamine transferase SPINDLY interacts with class I TCPs to facilitate cytokinin responses in leaves and flowers. Plant Cell. 2012;24:96–108. doi: 10.1105/tpc.111.093518. [DOI] [PMC free article] [PubMed] [Google Scholar]
- 41.Weiss D, Ori N. Mechanisms of cross talk between gibberellin and other hormones. Plant Physiol. 2007;144:1240–1246. doi: 10.1104/pp.107.100370. [DOI] [PMC free article] [PubMed] [Google Scholar]
- 42.Jasinski S, Piazza P, Craft J, Hay A, Woolley L, Rieu I, et al. KNOX action in Arabidopsis is mediated by coordinate regulation of cytokinin and gibberellin activities. Curr Biol. 2005;15:1560–1565. doi: 10.1016/j.cub.2005.07.023. [DOI] [PubMed] [Google Scholar]
- 43.Lee B, Johnston R, Yang Y, Gallavotti A, Kojima M, Travençolo BAN, et al. Studies of aberrant phyllotaxy1 mutants of maize indicate complex interactions between auxin and cytokinin signaling in the shoot apical meristem. Plant Physiol. 2009;150:205–216. doi: 10.1104/pp.109.137034. [DOI] [PMC free article] [PubMed] [Google Scholar]
- 44.Ferguson BJ, Beveridge CA. Roles for auxin, cytokinin, and strigolactone in regulating shoot branching. Plant Physiol. 2009;149:1929–1944. doi: 10.1104/pp.109.135475. [DOI] [PMC free article] [PubMed] [Google Scholar]
- 45.Yang M, Jiao Y. Regulation of axillary meristem initiation by transcription factors and plant hormones. Front Plant Sci. 2016;7:183. doi: 10.3389/fpls.2016.00183. [DOI] [PMC free article] [PubMed] [Google Scholar]
- 46.Wang Y, Wang J, Shi B, Yu T, Qi J, Meyerowitz EM, et al. The stem cell niche in leaf axils is established by auxin and cytokinin in arabidopsis. Plant Cell. 2014;26:2055–2067. doi: 10.1105/tpc.114.123083. [DOI] [PMC free article] [PubMed] [Google Scholar]
- 47.Nath U, Crawford BC, Carpenter R, Coen E. Genetic control of surface curvature. Science. 2003;299:1404–1407. doi: 10.1126/science.1079354. [DOI] [PubMed] [Google Scholar]
- 48.Poethig RS, Sussex IM. The cellular parameters of leaf development in tobacco: a clonal analysis. Planta. 1985;165:170–184. doi: 10.1007/BF00395039. [DOI] [PubMed] [Google Scholar]
- 49.Dierck R, De Keyser E, De Riek J, Dhooghe E, Van Huylenbroeck J, Prinsen E, et al. Change in auxin and cytokinin levels coincides with altered expression of branching genes during axillary bud outgrowth in chrysanthemum. PLoS ONE. 2016;11:e0161732. doi: 10.1371/journal.pone.0161732. [DOI] [PMC free article] [PubMed] [Google Scholar]
- 50.Li C-J, Guevara E, Herrera J, Bangerth F. Effect of apex excision and replacement by 1-naphthylacetic acid on cytokinin concentration and apical dominance in pea plants. Physiol Plant. 1995;94:465–469. doi: 10.1111/j.1399-3054.1995.tb00955.x. [DOI] [Google Scholar]
- 51.Tanaka M, Takei K, Kojima M, Sakakibara H, Mori H. Auxin controls local cytokinin biosynthesis in the nodal stem in apical dominance. Plant J. 2006;45:1028–1036. doi: 10.1111/j.1365-313X.2006.02656.x. [DOI] [PubMed] [Google Scholar]
- 52.Müller D, Waldie T, Miyawaki K, To JPC, Melnyk CW, Kieber JJ, et al. Cytokinin is required for escape but not release from auxin mediated apical dominance. Plant J Cell MolBiol. 2015;82:874–886. doi: 10.1111/tpj.12862. [DOI] [PMC free article] [PubMed] [Google Scholar]
- 53.Wang Q, Kohlen W, Rossmann S, Vernoux T, Theres K. Auxin depletion from the leaf axil conditions competence for axillary meristem formation in arabidopsis and tomato. Plant Cell. 2014;26:2068–2079. doi: 10.1105/tpc.114.123059. [DOI] [PMC free article] [PubMed] [Google Scholar]
- 54.Steiner E, Yanai O, Efroni I, Ori N, Eshed Y, Weiss D. Class I TCPs modulate cytokinin-induced branching and meristematic activity in tomato. Plant Signal Behav. 2012;7:807–810. doi: 10.4161/psb.20606. [DOI] [PMC free article] [PubMed] [Google Scholar]
- 55.Muller B, Sheen J. Arabidopsis cytokininsignaling pathway. SciSTKE. 2007 doi: 10.1126/stke.4072007cm5. [DOI] [Google Scholar]
- 56.Hutchison CE, Li J, Argueso C, Gonzalez M, Lee E, Lewis MW, et al. The Arabidopsis histidine phosphotransfer proteins are redundant positive regulators of cytokinin signaling. Plant Cell. 2006;18:3073–3087. doi: 10.1105/tpc.106.045674. [DOI] [PMC free article] [PubMed] [Google Scholar]
- 57.Mrízová K, Jiskrová E, Vyroubalová Š, Novák O, Ohnoutková L, Pospíšilová H, et al. Overexpression of Cytokinin Dehydrogenase Genes in Barley (Hordeumvulgare cv. Golden Promise) Fundamentally Affects Morphology and Fertility. PLoS ONE. 2013;8:e79029. doi: 10.1371/journal.pone.0079029. [DOI] [PMC free article] [PubMed] [Google Scholar]
- 58.Avivi Y, Lev-Yadun S, Morozova N, Libs L, Williams L, Zhao J, et al. Clausa, a tomato mutant with a wide range of phenotypic perturbations, displays a cell type-dependent expression of the homeobox gene LeT6/TKn2. Plant Physiol. 2000;124:541–552. doi: 10.1104/pp.124.2.541. [DOI] [PMC free article] [PubMed] [Google Scholar]
- 59.Heisler MG, Ohno C, Das P, Sieber P, Reddy GV, Long JA, et al. Patterns of auxin transport and gene expression during primordium development revealed by live imaging of the Arabidopsis inflorescence meristem. CurrBiol. 2005;15:1899–1911. doi: 10.1016/j.cub.2005.09.052. [DOI] [PubMed] [Google Scholar]
- 60.McCormick S. Transformation of tomato with agrobacteriumtumifaciens. In: Lindsey K, editor. Plant tissue culture manual. Dordrecht: Kluwer Academic Publishers; 1991. pp. 1–9. [Google Scholar]
- 61.Ori N, Eshed Y, Chuck G, Bowman JL, Hake S, Bowman JL, et al. Mechanisms that control knox gene expression in the Arabidopsis shoot. Development. 2000;127:5523–5532. doi: 10.1242/dev.127.24.5523. [DOI] [PubMed] [Google Scholar]
- 62.Schneider CA, Rasband WS, Eliceiri KW. NIH image to ImageJ: 25 years of image analysis. Nat Methods. 2012;9:671–675. doi: 10.1038/nmeth.2089. [DOI] [PMC free article] [PubMed] [Google Scholar]
- 63.Shleizer-Burko S, Burko Y, Ben-Herzel O, Ori N. Dynamic growth program regulated by LANCEOLATE enables flexible leaf patterning. Development. 2011;138:695–704. doi: 10.1242/dev.056770. [DOI] [PubMed] [Google Scholar]
Associated Data
This section collects any data citations, data availability statements, or supplementary materials included in this article.
Supplementary Materials
Additional file 1: Figure S1. Possible dose effects of the TCSv2:3XVENUS response to CK treatment. Arabidopsis (top, Columbia seedlings are depicted) and tomato (bottom, M82 shoots are depicted) were treated with mock or indicated concentrations of BA (6-benzylaminopurine) for 24-48 hours. Images were taken with a Nikon stereomicroscope. Bars= 100 µM. Figure S2. TCSv2 driven expression in arabidopsis in the Ler background. Arabidopsis seedlings in the Ler background expressing TCSv2 driven VENUS (top) or GUS (bottom), with or without (mock) BA (6-benzylaminopurine) treatment, were photographed 24 hours after CK treatment or subjected to GUS staining 24 hours after CK treatment. Images were taken with a Nikon stereomicroscope. Bars= 100 µM. Figure S3. TCSv2 responds primarily to CK. Characterization of TCS driven VENUS expression in wild type tomato shoot apexes following treatment with indicated hormones. Images were captured with a Nikon stereomicroscope. Bars= 100 µM. Figure S4. Stereomicroscope analysis of TCSv2 driven expression in tomato leaves. Tomato seedlings expressing TCSv2 driven VENUS at various stages of leaf development as indicated. Images were taken with a Nikon stereomicroscope. The VENUS channel was hue-masked using Adobe photoshop to a dark blue color in order to better visualize it when superimposed on light microscopy images of the young developing leaves. Bars= 100 µM. Figure S5. TCSv2 driven expression in the tomato embryo. TCSv2 driven expression in mature tomato embryos. Images were taken with a Nikon stereomicroscope. The root apical meristem is indicated with an asterisk (A-C) and the shoot apical meristem is marked with a dotted box (A-D). The area in the dotted box in D is enlarged in E. Bars= 100 µM. Table S1. Primer pairs used in this work.
Data Availability Statement
All data generated or analysed during this study are included in this published article and its supplementary information files.


