Abstract
The SARS-CoV-2 main protease (Mpro) is of major interest as an antiviral drug target. Structure-based virtual screening efforts, fueled by a growing list of apo and inhibitor-bound SARS-CoV/CoV-2 Mpro crystal structures, are underway in many laboratories. However, little is known about the dynamic enzyme mechanism, which is needed to inform both assay development and structure-based inhibitor design. Here, we apply biodynamics theory to characterize the structural dynamics of substrate-induced Mpro activation under nonequilibrium conditions. The catalytic cycle is governed by concerted dynamic structural rearrangements of domain 3 and the m-shaped loop (residues 132–147) on which Cys145 (comprising the thiolate nucleophile and half of the oxyanion hole) and Gly143 (comprising the second half of the oxyanion hole) reside. In particular, we observed the following: (1) Domain 3 undergoes dynamic rigid-body rotation about the domain 2–3 linker, alternately visiting two primary conformational states (denoted as M1pro ↔ M2); (2) The Gly143-containing crest of the m-shaped loop undergoes up and down translations caused by conformational changes within the rising stem of the loop (Lys137–Asn142) in response to domain 3 rotation and dimerization (denoted as M1/downpro ↔ 2·M2/up) (noting that the Cys145-containing crest is fixed in the up position). We propose that substrates associate to the M1/downpro state, which promotes the M2/down state, dimerization (denoted as 2·M2/uppro–substrate), and catalysis. Here, we explore the state transitions of Mpro under nonequilibrium conditions, the mechanisms by which they are powered, and the implications thereof for efficacious inhibition under in vivo conditions.
Keywords: nonequilibrium, solvation free energy, binding kinetics, buried channels, caspase-1, drug design
Mpro is of current interest as an antiviral drug target, and experimental and in silico efforts toward the discovery of potent, efficacious inhibitors are currently underway in many laboratories. However, drug discovery is typically a trial-and-error/hit-and-miss undertaking due in no small measure to key deficiencies in the fundamental understanding of molecular and cellular structure-free energy relationships, as well as heavy reliance on equilibrium potency metrics (e.g., IC50, Kd) that are of limited relevance to the nonequilibriumin vivo setting.1,2
In this work, we break from traditional screening and structure-based drug design approaches, and examine Mpro inhibition from a theoretical, in vivo relevant perspective based on multiscale biodynamics principles outlined in our previous work.1,2 Our theory addresses the fundamental nature of dynamic molecular structure and function under aqueous cellular conditions (which are powered principally by desolvation and resolvation costs),2,3 and the general means by which cellular function is derived from interacting molecular species undergoing time-dependent cycles of exponential buildup and decay. As such, the enzyme structure–function relationship is necessarily considered in the overall context of cellular function and dysfunction (consisting of viral infection in this case), and in particular the following: (1) Synchrony between substrate k1, kcat, and k–1, in which the bound substrate lifetime (t1/2) is comparable to 1/kcat (a general kinetic paradigm that was first described by van Slyke and Cullen),4,5 and product inhibition is circumvented via fast leaving group dissociation; (2) Synchrony between the rates of enzyme and substrate buildup and product formation.
We assume that infection proceeds in the following general phases:6,7
-
(1)
Virion capture.
-
(a)
Receptor binding and internalization.
-
(b)
RNA unpacking.
-
(a)
-
(2)
Virion “factory” construction.
-
(a)
Translation of ORF1a and ORF1ab into polyproteins pp1a containing nonstructural protein (nsps) 1–11 and pp1ab, containing nsp1–16, respectively.
-
(b)Cleavage of the pp1a and pp1ab polyproteins into their constituent nsps.
-
(i)Autocleavage of nsp3 (papain-like protease, PPLpro) in cis is followed by nsp3-mediated cleavage of nsp4 in trans.
-
(ii)Autocleavage of nsp5 (Mpro) in cis, followed by nsp5-mediated cleavage of nsp6 through nsp11/16 in trans. As such, Mpro and its substrates are built together, the consequences of which are of critical importance to therapeutic inhibition
-
(i)
-
(c)
Buildup of the replication–transcription complex (RTC) within cytoplasmic endosome-derived double membrane vesicles.8−11
-
(a)
-
(3)
Virion production.
-
(a)
RNA replication
-
(b)
Structural protein translation/processing.
-
(c)
Virion assembly/export.12
-
(a)
Therapeutic intervention is targeted optimally at proteins, such as Mpro, that drive the earliest steps of viral infection prior to, or during, the factory construction phase. Clinical antiviral success depends on reducing the active Mpro population below that required for RTC buildup and virion production at a threshold fractional inhibition of the protein population over time, which may be relatively high, given that many substrate copies can be cleaved by each free enzyme copy (constituting “leakage” from the inhibited system). Efficacious dynamic occupancy is achieved under nonequilibrium conditions at the lowest possible exposure when the rates of drug association and dissociation are tuned to the rates of target or binding-site buildup and decay.1 In the case of enzymes, fractional occupancy depends on the inhibitor on-rate relative to that of the substrate (denoted as k1·[substrate](t)·[enzyme](t) and kon·[inhibitor](t)·[enzyme](t), respectively, where [enzyme](t) is denoted henceforth as ki). The challenge in achieving efficacious Mpro inhibition is greatest when substrate–Mpro binding is kinetically tuned (versus mistuned), as reflected in the following Mpro/substrate buildup scenarios:
(1) Buildup coincides with polyprotein expression, thereby maintaining an approximately constant 1:1 Mpro/substrate ratio throughout the “factory construction” phase of infection. This scenario is consistent with kinetically tuned substrate–Mpro binding at the lowest possible substrate concentration. Efficacy at the lowest possible inhibitor concentration depends on high inhibitor–Mpro occupancy under this scenario (Figure 1A), which in turn, depends on parity between kon and ki.
Figure 1.
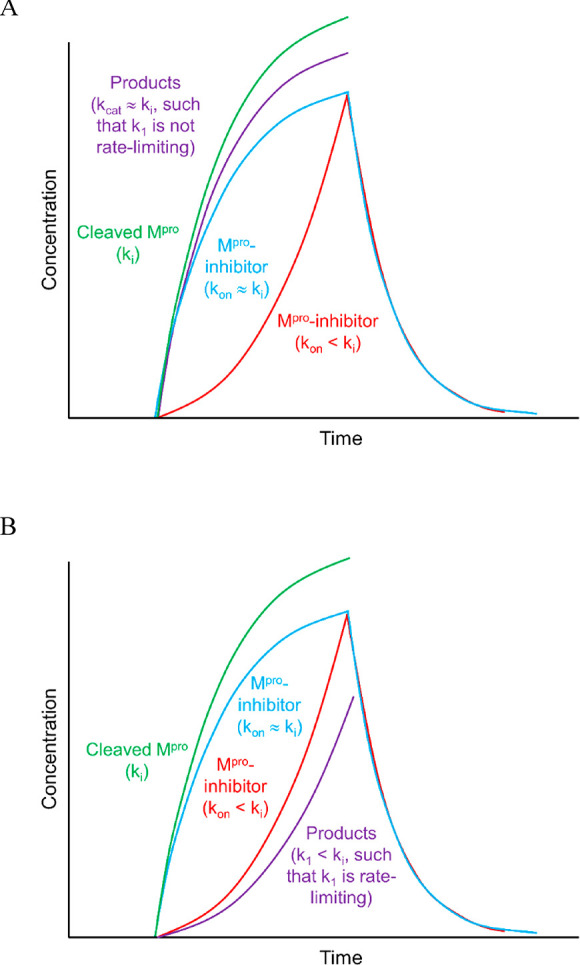
Hypothetical examples of the buildup and decay of postcleavage Mpro and the downstream cleavage products thereof (reflecting substrate association, dissociation, and turnover in aggregate) under the two general scenarios described in the text (the mathematical basis of these plots is explained elsewhere).1 (A) Worst case scenario, in which the rate of product buildup is comparable to ki. The plot includes the following quantities: autocleaved Mpro buildup (green tracing) (noting that Mpro decay depends on the existence of a degradation pathway), collective product buildup (purple tracing), and buildup and decay of inhibitor-bound Mpro under conditions in which the inhibitor kon ≈ ki (blue tracing), and inhibitor kon < ki (red tracing). (B) Same as A, except for the best case scenario, in which the rate of product buildup < ki.
(2) Buildup lags behind polyprotein expression, consistent with kinetically mistuned substrate–Mpro binding, in which k1 < ki (Figure 1B). Ideal fractional inhibition of the Mpro population depends on kon < ki, whereas the minimal efficacious inhibition depends on kon > k1.
The kinetic tuning requirement may be relaxed in the case of covalent inhibition, in which the inhibited enzyme fraction accumulates over time. However, accumulation rates ≪ ki can likewise result in “leakage” of uninhibited Mpro and its downstream products. Covalent inhibition has been used successfully with other antiviral targets, including hepatitis C NS3 protease.13,14 Understanding the mechanism and dynamics of Mpro cleavage and its subsequent activation is essential for differentiating among these scenarios and informing in vivo relevant inhibitor design.
We collected, classified, and overlaid representative dimeric and monomeric ligand-bound and apo SARS-CoV and CoV-2 Mpro crystal structures (see the “Materials and Methods” section ). We then explored and compared these structures using an integrated approach, consisting of 3D visualization and molecular dynamics (MD)-based solvation analysis (WATMD)2,15 to qualitatively assess the free energy barriers governing the intramolecular states of the monomeric (denoted as M1pro and M2) and dimeric protein (denoted as 2·M2pro), as well as the association and dissociation barriers governing substrate and inhibitor occupancy. We then investigated the structure and function of Mpro, focusing on the inter-relationship between the catalytic and substrate-/inhibitor-binding mechanisms and the means by which they are powered. Questions of interest include the following: (1) The basis of substrate- and dimer- induced activation and specificity of the catalytic site; (2) The interplay between covalent/mechanism-based inhibitor binding kinetics and the structural dynamics of the protein; and (3) The interplay between catalytic turnover and viral dynamics governing the buildup of postcleaved Mpro and its substrates.
General Nonequilibrium Structure-Free Energy Relationships Assumed in This Work
Whereas biomolecular processes are considered in terms of equilibrium free energy models throughout mainstream cell biology and pharmacology, living systems (including virally infected cells) depend to a very large degree on nonequilibrium operation, where the state distributions of the participating molecular populations are transient. Spontaneous noncovalent intra- and intermolecular interactions, by definition, lower the total system free energy (i.e., for ΔG = −RT·ln(K) = G∞ – Ginteracting < 0, where ΔG, R, T, and K are the free energy change, gas constant, temperature, and equilibrium constant, respectively). However, K, and therefore ΔG, are undefined under conditions in which the concentrations of the participating species vary over time. The nonequilibrium fractional occupancy of a given state is proportional to the relative rates of entry and exit to/from that state. Under such conditions, binding free energy is defined strictly in terms of the barriers governing the rates of entry and exit to/from each available state (denoted as ΔGin⧧ and ΔGout). As such, the transient fractional occupancy of a given state is proportional to the relative rates of entry and exit to/from that state, rather than ΔG per se (ΔG ≠ ΔGin⧧ – ΔGout).
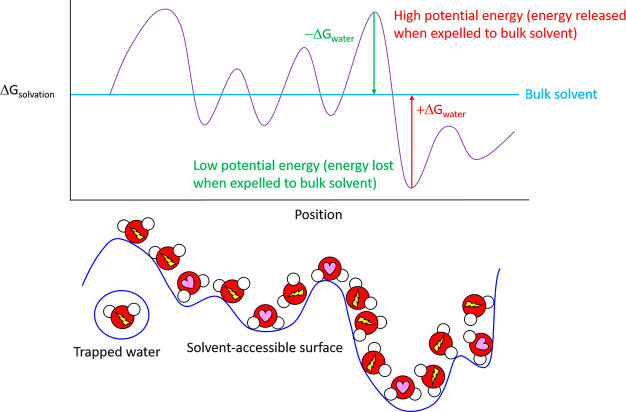
We previously reported a first-principles multiscale theoretical treatment of nonequilibrium structure–function–free-energy relationships referred to as Biodynamics.1,2According to our theory, under aqueous conditions ΔGin⧧ and ΔGout are contributed predominantly by H-bond free energy differences between solvating water and bulk solvent. Such differences vary across solvent-exposed solute surfaces (both external and interior surfaces of buried cavities) as a function of losses and gains in water H-bond propensity (number/strength) relative to that of bulk solvent (Figure 2). Free energy is increased/stored and decreased/released relative to unperturbed bulk solvent (which serves as the reference state) in the form of disrupted and enhanced water H-bond propensity (H-bond/enthalpically depleted and H-bond/enthalpically enriched/entropically depleted), respectively. Stored solvation free energy (constituting unfavorable potential energy) is released via the expulsion of each high-energy-solvating water to bulk solvent in response to intra- and intermolecular rearrangements. The rearrangement-induced return of water from bulk solvent to each high-energy solvation position incurs a cost equivalent to |(Gbulk – Gsolv)|. Under nonequilibrium conditions, water transfer costs to/from bulk solvent and solvation are given strictly by ΔGto_or_from⧧ = ∑i(ΔGto_or_from)i summed over the i water transfers (versus the net free energy change over favorable + unfavorable transfers at equilibrium). ΔGto⧧ and ΔGfrom equate to the mutual desolvation and resolvation costs of the interacting solute groups, respectively. Solvating water is always entropically depleted (i.e., Ssolv < Sbulk), but enthalpically enriched or depleted (i.e., Hsolv < Hbulk or Hsolv > Hbulk) in accordance with the local H-bond propensity at each position of a given solvent-accessible surface.
Figure 2.
Free energy of solvating water molecules varies as a function of position on a given solvent-accessible surface. Solute surfaces are imprinted in (“written to”) their solvating water in the form of H-bond propensity patterns, analogous to a three-dimensional bitmap (H-bond depleted and enriched solvating water molecules are denoted by a lightning bolt and heart, respectively), resulting in highly nonisotropic solvation free energy fields. Solvation free energy fields are “read” by state transition-induced unfavorable water transfers to/from bulk solvent and solvation (such that the overall state transition barrier equates to the total cost of such transfers). Polar/charged surfaces promote H-bond enriched solvation relative to bulk solvent, resulting in decreased solvation free energy (the expulsion of which incurs a free energy cost). Nonpolar surfaces promote H-bond depleted solvation relative to bulk solvent, resulting in increased solvation free energy (the expulsion of which results in a free energy gain).
The maximum desolvation cost per water molecule incurred during entry to a given state j is proportional to the maximum possible loss of water H-bond free energy from that state, which in turn, is proportional to the degree of H-bond enrichment of the solvating water (noting that the cost of transferring H-bond depleted and trapped water to bulk solvent is zero). The actual desolvation cost depends on the extent to which lost water-solute H-bonds across the rearrangement interface (e.g., the binding interface) are mutually replaced by intra- or intersolute H-bonds (which is typically, a zero sum game at best). The rate of entry to state j is therefore proportional to the total desolvation cost of that state, the occupancy of which increases as the rate of entry increases at a constant rate of exit (noting that the loss of H-bond propensity in even a single water molecule can slow the rate of entry). The resolvation cost per water incurred at H-bond depleted positions in the solvation shells of all participating solute atoms during exit from state j is proportional largely to the total loss of H-bond free energy relative to bulk solvent (noting that the cost of transferring water from bulk solvent to H-bond enriched positions is zero). The rate of exit from state j is therefore proportional to the resolvation cost of exiting that state, the occupancy of which increases as the rate of exit decreases at a constant rate of entry. The dynamic occupancy of a given state accumulates when the rate of entry > rate of exit, where the rate constants are proportional to ΔGin⧧ and ΔGout.
The driving force of all noncovalent rearrangements under aqueous conditions (including protein folding) is attributed by Biodynamics to potential energy stored within solvating water, as follows:
(1) The release of solvation free energy (i.e., potential energy) stored in H-bond depleted or trapped solvation via the displacement of such water by overlapping solute atoms. The persistence of a given state j (kinetic stability) is proportional to the resolvation cost incurred at H-bond depleted or trapped positions upon exiting that state. Highly persistent states result from the expulsion of large amounts of H-bond depleted solvation, whereas dynamic rearrangeability depends on the conservation of H-bond-depleted or -trapped solvation across the available states (i.e., conservation of local instability within a “Goldilocks zone” of global stability) (Figure 3).
Figure 3.
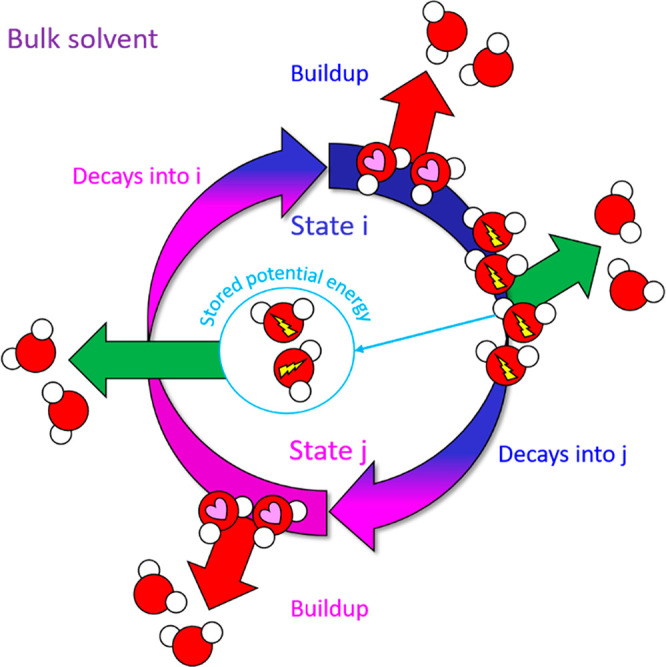
Cyclic nonequilibrium transitions between states i and j depend on conservation of H-bond depleted and/or trapped solvation, wherein the decay rate of state j is driven by H-bond depleted solvation transduced during state i (analogous to a “whack-a-mole” paradigm). Such a paradigm would equate to a perpetual motion machine in the absence of an external energy input requirement, such as the continual buildup and decay of one or more participating species (substrates in the case of Mpro), which are in turn, powered by covalent free energy sources, such as ATP.
(2) The generation of H-bond-enriched solvation in the folded state, which counterbalances the unfavorable energy contribution from residual H-bond depleted solvation (such that the global free energy remains within the Goldilocks stability zone).
The molecular structure–function relationship is driven energetically by the following dynamically generated solvation patterns: (1) H-bond-enriched solvation serves as a “gatekeeper” for entry into a subsequent state from the penultimate state. Selective entry into one or more specific states (i.e., recognition) is proportional to the desolvation cost of those states. The lowest cost state(s) are entered fastest; (2) H-bond-depleted solvation governs the rate of decay of all states. The generation of such solvation upon entry to state j depends on the storage of solvation free energy during the penultimate state i (i.e., some of this energy is used to stabilize state i, and some is reserved to stabilize state j).
Noncovalent rearrangements under aqueous conditions are therefore powered largely by solvation free energy (which we refer to as “hydropower”). We set about to characterize the catalytic cycle of Mpro on this basis, including substrate binding, rearrangement of the catalytic site, and dimerization as a prelude to inhibitor design (which was not attempted in this work).
Overview of Mpro Structure and Catalytic Function
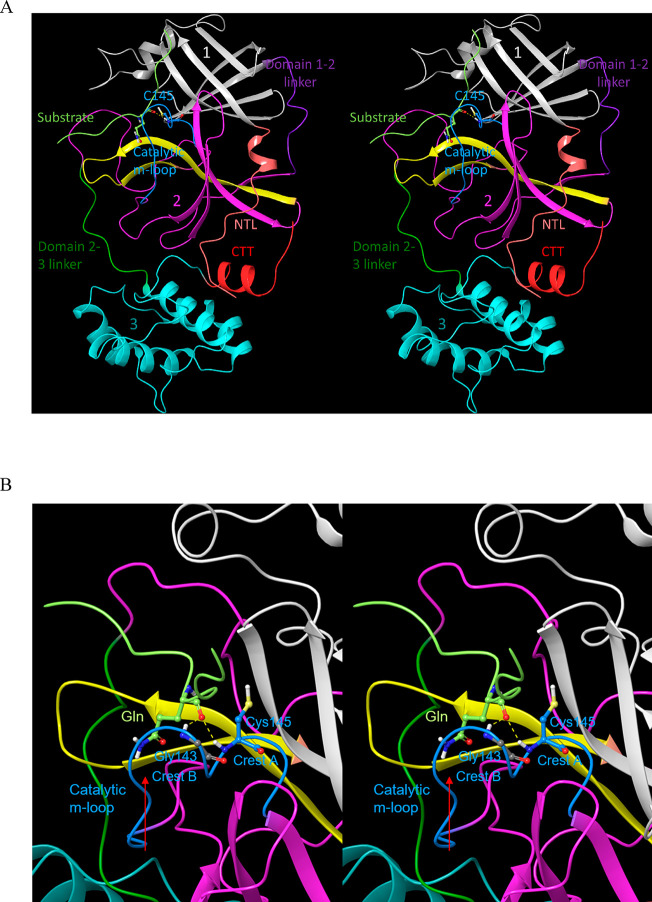
Monomeric Mpro is organized into three domains (denoted as domains 1–3; Figure 4A),16 which respectively comprise the “ceiling”, “floor”, and “basement” of the active site (AS). The domains are organized in a loosely packed arrangement that promotes high sensitivity of protein structure–function to the monomeric versus dimeric forms, the unbound versus substrate-bound forms, and the substrate versus product-bound forms. Whereas the geometric relationship between domains 1 and 2 (which subserve the protease function) is relatively invariant throughout the available Mpro crystal structures, rearrangeability of domain 3 is apparent in the monomeric versus dimeric forms of the protein. As such, we denote the hierarchical interdomain relationship as {1–2}–3 throughout the remainder of this work. The M1pro state is captured in Protein Databank (PDB) structure 2QCY, and the 2·M2 state is captured in PDB structures 6M03 and 2Q6G, as well as many others (noting that monomeric M2pro is unobserved experimentally).
Figure 4.
Stereo views of key Mpro structural features. (A) Domains 1 (white), 2 (magenta), and 3 (cyan) exemplified by 2Q6G (chain B), illustrating the canonical S-shaped topological interdomain architecture of Mpro. The three domains are interconnected by flexible linkers (domain 2–3 and 1–2 linkers shown in dark green and purple, respectively). The substrate peptide (light green) binds to the upper strand of a β-hairpin loop (yellow) located within the AS via the backbone NH and C=O groups of Glu166. The catalytic Cys145 and Gly143 residues reside on the two crests of the m-shaped loop (denoted crests A and B, respectively) (blue), each of which contributes one backbone NH of the oxyanion hole. The NTL (coral), denoted by others as the “finger peptide”,18 projects into the dimer interface, together with the CTT (red). (B) Close-up view of the AS and oxyanion hole, showing the positioning of the substrate P1 Gln side chain (light green) in the monomeric S1 subpocket, together with the backbone NH–substrate H-bonds. The N- to C-terminal directionality of the rising stem of the m-shaped loop is denoted by the red arrow.
The backbone NH groups comprising the oxyanion hole (contributed by Cys145 and Gly 143) reside on a 3D double-crested, m-shaped loop, hereinafter denoted as the “m-shaped loop” (Figure 4B). The N-terminal leader and C-terminal tail sequences (denoted as NTL and CTT, respectively), the latter of which includes a small helix, play key roles in organizing the AS, m-shaped loop, and dimer interface. We assume in this work that the substrate binding and catalytic machineries are well-conserved in CoV and CoV-2, which differ by only 12 residues, half of which are located in domain 1 (including one located at the upper boundary of the AS), two in domain 2, and four in domain 3.17 As such, CoV and CoV-2 structures were used interchangeably throughout this work (noting that the residue numbering is that of the SARS-CoV-2 variant).
Serine proteases function via a common catalytic mechanism conveyed by an Asp–His–Ser triad. However, a His-Cys dyad appears sufficient for proton abstraction from the more acidic Cys (relative to Ser) of cysteine proteases, leading to an activated thiolate–His ion pair.19−21 The Mpro catalytic mechanism may be summarized as follows: (1) Abstraction of the Cys145 proton by His41, resulting in a nucleophilic thiolate moiety (stage 1 proton transfer); (2) Substrate binding, followed by nucleophilic attack on the scissile bond, resulting in a transient tetrahedral intermediate (TI) which is stabilized by the oxyanion hole. This step is claimed to be extremely fast in other cysteine proteases (requiring stopped flow measurement)20; (3) Spontaneous TI decay to the N-terminal leaving group (product 1) and thioester adduct; (4) Hydrolysis of the thioester adduct (stage 2 proton transfer, resulting in the C-terminal leaving group (product 2). This step is claimed to be rate-determining in other cysteine proteases.22
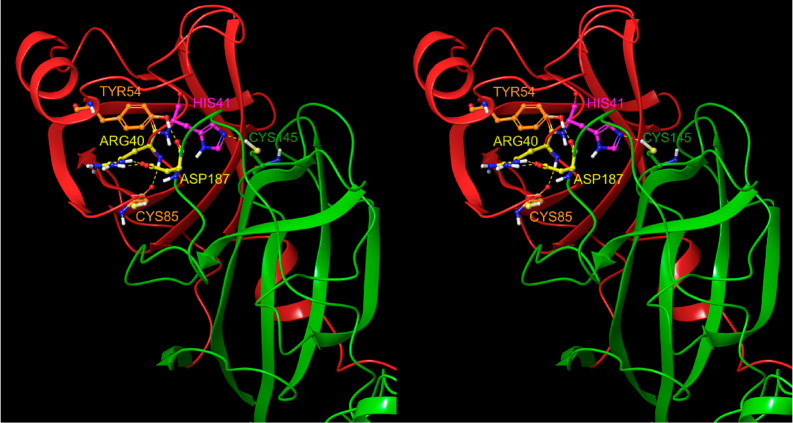
However, alternate catalytic triad-based mechanisms have been proposed for Mpro, including the following: (1) Substitution of the canonical Asp of the catalytic triad by a high-occupancy water molecule is observed near His41 in many Mpro crystal structures and our WATMD results (possibly a weaker surrogate for Asp),21,23 noting the absence of this water in subunit B of 2Q6G due to repositioning of Asp187 (which if catalytically essential, would result in enzyme inactivation); (2) Rearrangement of Asp187 from its observed pairing with Arg40 to His41.13 Given the strategic location of the Arg40-Asp187 ion pair opposite to the domain 1–2 linker in all of the structures that we examined (exhibiting a latchlike appearance), stabilization of the domain 1–2 interface by this shielded ion pair is the more likely scenario (Figure 5).
Figure 5.
We postulate that the Arg40–Asp187 ion pair (yellow side chains), which is shielded between Tyr54 and Cys85, stabilizes the domain 1–2 interface and upper region of the domain 2–3 linker.
Materials and Methods
Structural Data and Visualization
All Mpro structures used in our study were obtained from the RCSB Protein Databank24 and grouped according to species, site-directed mutants, apo versus ligand/substrate-bound forms, and dimeric and mutant monomeric forms (Table 1).
Table 1. Structures Used in Our Analysis23,25−30.
| PDB structure | species | form | mutation(s) | ligand/substrate bound | crystallization pH |
|---|---|---|---|---|---|
| 2QCYa | SARS-CoV | monomer | R298A | 6 | |
| 2Q6Ga | SARS-CoV | dimer | H41A | substrate | 6 |
| 6M03a | SARS-CoV-2 | dimer | 8.1 | ||
| 2BX3 | SARS-CoV | dimer | 5.9 | ||
| 6LU7 | SARS-CoV-2 | dimer | N3 | 6 | |
| 6XHM | SARS-CoV-2 | dimer | PF00835321 (V2M) | 4 | |
| 6WNP | SARS-CoV-2 | dimer | boceprevir | 7.5 | |
| 4MDS | SARS-CoV | dimer | 23H | 6.0 | |
| 4KTC | hepatitis C virus NS3 protease | dimer | A156T | 1 × 3 | 6.2 |
| 4CHA | α-chymotrypsin | dimer | substrate | NA |
Those on which we performed WATMD calculations.
All calculations and structure visualizations were performed using WATMD V9,2,15,31 AMBER 16,32 Maestro 2020–1 (Schrodinger, LLC), and PyMol 2.0 (Schrodinger, LLC). 2QCY, 2Q6G, and 6M03 were prepared for WATMD calculations using the PPrep tool in Maestro, and the resulting structures were aligned using PyMol. The aligned dimeric structures and their disassembled A and B chains were compared visually using PyMol and Maestro. We emphasize that this is a first-principles theoretical study with limited reliance on conventional molecular modeling techniques.
WATMD Calculations
We mapped the following solvation properties around the solvent-accessible surfaces of Mpro on a time-averaged basis: (1) H-bond enriched positions, in which the number/strength of solvating water H-bonds is increased/enhanced compared with bulk solvent, resulting in an enthalpic preference for the solvation shell. Such solvation occurs at donor/acceptor-containing regions of the protein surface; (2) H-bond depleted positions, in which the number/strength of solvating water H-bonds is decreased/weakened compared with bulk solvent, resulting in an enthalpic and entropic preference for bulk solvent. Such solvation occurs at regions of the protein surface at which donors/acceptors are absent or scarce; (3) Trapped/buried positions within the protein surface, in which exchanges between solvating water and bulk solvent are highly limited or absent, resulting in an enthalpic and entropic preference for bulk solvent. Trapped water molecules typically H-bond with a single protein acceptor or donor, but in some cases, may be fully devoid of H-bonds; (4) Bulklike positions, in which no preference exists for solvation versus bulk solvent.
WATMD is based on the fundamental assumption that the H-bond free energy of the solvation shell at each position of the solvent-accessible surface is correlated with the time-averaged occupancy of water atoms at that position. Dynamic water exchanges between bulk solvent and the solvation shell are estimated using unrestrained molecular dynamics (MD) simulations, consisting of a 0.5 ns equilibration step, followed by a 30 ns production run. WATMD analysis is limited to the last 10 ns of the trajectory (40 000 frames), in which quasi-equilibrium exchanges between water and bulk solvent have been achieved.
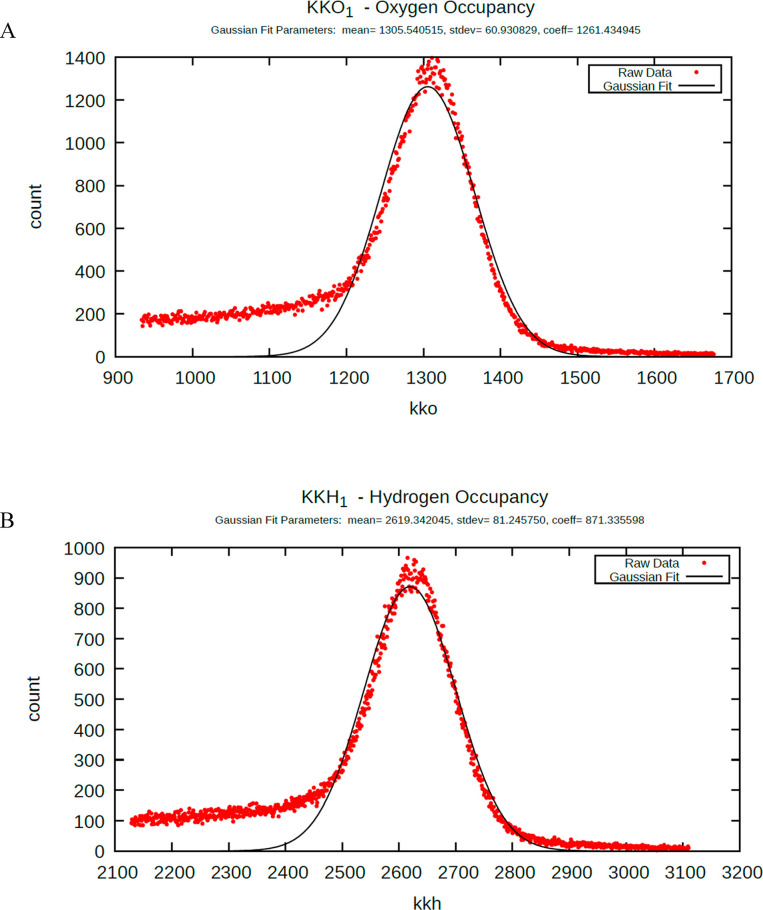
Water oxygen (O) and hydrogen (H) occupancies (referenced to the atomic centers) are sampled along a stationary 3D grid of 1 Å3 voxels over the last 40 000 frames of the trajectory (noting that this voxel size was chosen to ensure single atom occupancy within the same simulation frame). Bulk and bulklike voxel occupancies are assigned based on six criteria representing the isotropic environment of bulk solvent, in which the H and O positions within each voxel are fully uncorrelated (corresponding to no orientational preference of the occupying water molecule). Voxels outside of the solvation shell (corresponding to bulk solvent) are omitted from the downstream analysis. The overall O and H counts accumulated during the simulation are distributed across all voxels in all cases in a Gaussian-like manner (Figure 6A,B, respectively), the mean of which corresponds to bulklike occupancy, and the low and high tails of which correspond to the following: (1) Left tail: graded H-bond depletion, ranging from low- to ultra-low-occupancy voxels relative to bulk solvent (noting that many low and ultralow occupancy voxels result from competition between water and protein atoms); (2) Right tail: (a) H-bond enriched solvation, ranging from moderate occupancy voxels (just above bulk) to high occupancy voxels far above bulk solvent; (b) Water that is trapped within buried channels/cavities (or the rate of exchange with bulk solvent is slowed significantly), which manifests in many cases as ultrahigh occupancy voxels.
Figure 6.
Distributions of cumulative water visits across all voxels averaged over the 40 000 frames of the MD trajectory, exemplified for 2QCY (noting the ∼2:1 H/O ratio of the mean counts). The mean counts correspond to bulklike solvation, whereas the tails correspond to high and low energy solvation (noting that the extrema in the tails have been truncated for the sake of clarity). (A) Number of voxels within the full grid (denoted as counts) plotted against the per voxel O counts (denoted as kko). (B) Same as A, except for per voxel H counts (denoted as kkh).
The results are annotated on the grid using spheres encoded with the following information: (1) The relative percentage of O versus H counts accumulated over the 40 000 frames of the simulation, which are color-coded as follows: (a) Bright red ≈ 100% O occupancy over time, reflecting a voxel environment dominated by one or more protein donors; (b) Bright blue ≈ 100% H occupancy over time, reflecting a voxel environment dominated by one or more protein acceptors; (c) Red–white–blue spectrum = a mixture of O and H occupancies, reflecting a mixed voxel environment comprised of both protein donor(s) and acceptor(s). The spectrum is tipped toward the following: (i) Pink to red as the normalized percentage is tipped increasingly toward O; (ii) Purple to blue as the normalized percentage is tipped increasingly toward H; (iii) White when the normalized percentages are approximately equal; (d) Yellow = bulklike occupancy, reflecting an H-bonding environment that is iso-energetic to bulk solvent; (2) The normalized occupancy levels, which are encoded in the relative radii.
The ∼30 Å3 volume of a single water molecule maps to a supervoxel comprised of approximately 3 × 3 × 3 primary voxels. However, multiple groupings of primary voxels are possible, depending on the following: (1) The number of water molecules that are bound simultaneously around a given region of the protein surface (during all or a fraction of the 40 000 frames of the simulation), which in turn, depends on the local surface shape. Flat or convex surfaces/cavities are solvated by multiple waters (noting that primary voxel groupings are ambiguous in such cases), whereas concave surfaces are solvated by a limited (possibly single-digit) number of water molecules, commensurate with the available volume of the cavity; (2) The number of orientations of each water molecule over the 40 000 frames of the simulation, where each orientation corresponds to a unique primary voxel grouping. High-occupancy voxels residing in mixed protein acceptor/donor environments often occur in clusters, reflecting the various time-averaged orientations of H-bond enriched water molecules.
The occupancies within the primary voxels of each supervoxel necessarily sum to a 2:1 H/O ratio, given that water behaves as a rigid body (i.e., adjacent primary voxel occupancies cannot differ significantly for the H and O atoms of the same molecule). The resulting voxel maps (which we refer to as the “solvation structures”) inform qualitatively about the time-averaged preferences for H or O, together with the preferences of water for solvation versus bulk solvent (i.e., proportional to the free energy content of the solvation, which putatively equates to the free energy content of the protein), at each grid position relative to the corresponding solvent-accessible protein surface (exemplified in Figure 7), as follows:
Figure 7.
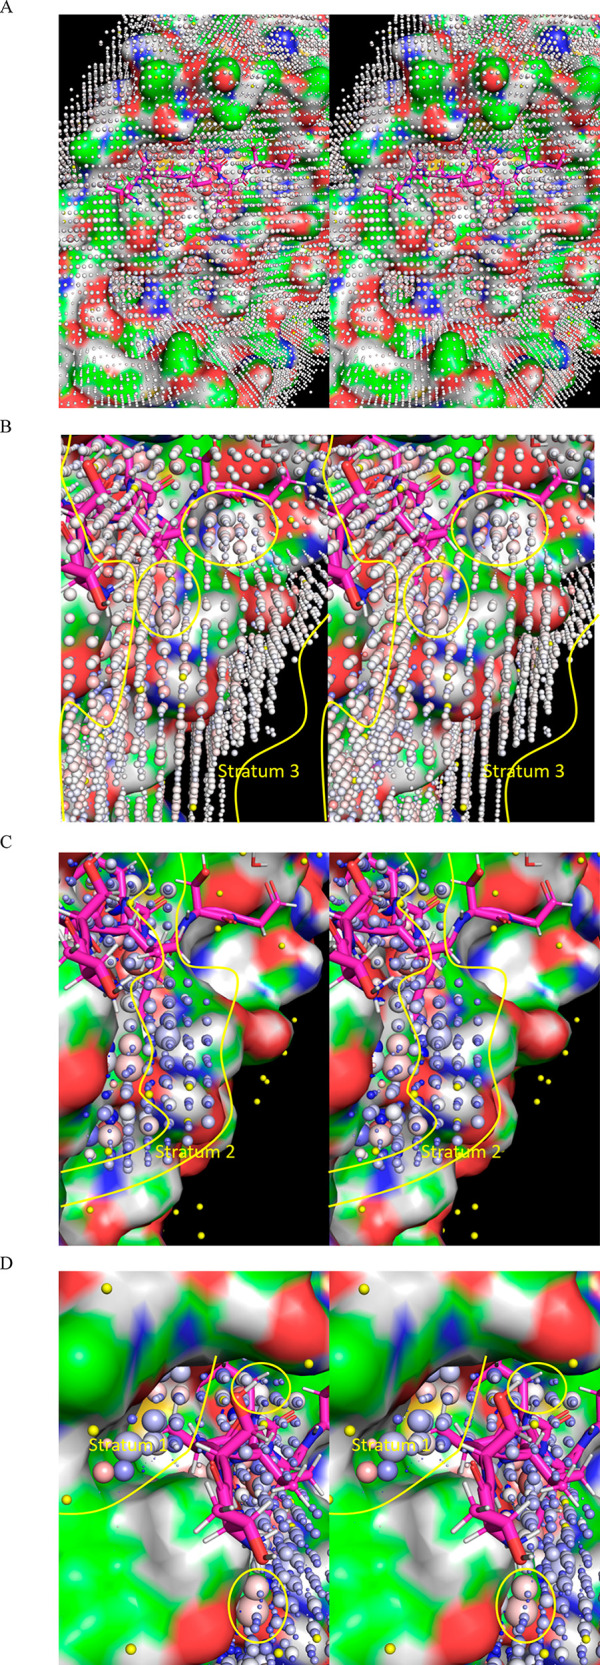
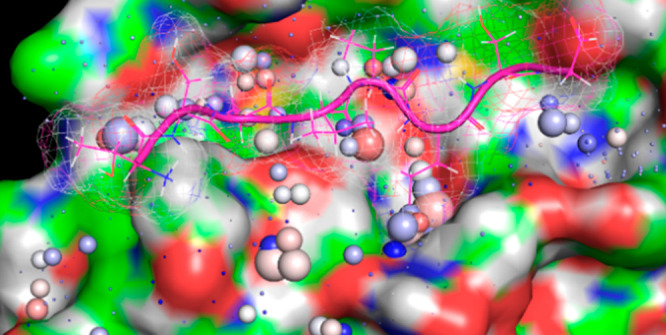
Stereo views of the WATMD annotations described in the text, exemplified for monomeric Mpro (2QCY). In general, solvation shells are loosely organized into three major strata (demarcated by yellow lines) spanning between the protein surface and bulk solvent (noting that bulk solvent per se is omitted from WATMD analyses), as follows: (1) Stratum 1: ULOVs that are largely or fully devoid of protein H-bond partners, which reside directly adjacent to nonpolar protein surface patches, as well as HOVs residing directly adjacent to polar protein surface patches comprised of multiple donors and/or acceptors; (2) Stratum 2: weaker, partially H-bond depleted LOVs that bridge between strata 1 and 3; (3) Stratum 3: BLOVs and H/O-agnostic SBLOVs that bridge between bulk solvent and the outer reaches of the solvation shell (putatively dominated by lateral water–water H-bonding). Voxels are denoted by spheres, which are scaled in proportion to their relative time-averaged H and O occupancies, and color-coded according to relative preference for O versus H (red and blue, respectively), or lack thereof (white). (A) Full WATMD grid, viewed toward the protein surface in the direction of strata 3 to 1. A crystallized Mpro substrate extracted from 2Q6G (magenta) is overlaid on the active site for reference. Bulk solvent surrounding the solvation shell has been removed, resulting in an irregular grid boundary. (B) AS of Mpro viewed approximately parallel to the pocket. Stratum 3 voxels typically consist of BLOVs (yellow spheres) and SBLOVs (white spheres). (C) Same as B, except zoomed into stratum 2 voxels, which typically consist of LOVs occupied by solvation that is weakly H-bonded to a single protein donor or acceptor (small dark blue spheres). (D) Same as B, except zoomed into stratum 3 voxels, which typically consist of HOVs occupied by solvation that is strongly H-bonded to multiple protein donor(s) and/or acceptor(s) (large spheres) or ULOVs occupied by solvation that is largely or fully devoid of H-bonds (dot-sized spheres). UHOVs corresponding to trapped water within buried channels/cavities are not shown.
(1) Bulklike occupancy voxels (BLOVs) that are typically present within the outer to middle strata (3 and 2) of the grid (denoted by small yellow spheres). The corresponding solvation is approximately iso-energetic to bulk solvent.
(2) Supra-bulk-like occupancy voxels (SBLOVs), which are typically present in stratum 3 (transitioning between bulk solvent and water solvating moderately nonpolar protein surfaces). Occupation of these voxels, which dominate the grid (denoted by white/gray spheres with radii moderately greater than those of bulklike voxels), is assumed to consist of laterally H-bonded water participating in water–water networks exhibiting free energies slightly below that of bulk solvent.
(3) Low-occupancy voxels (LOVs), corresponding to exchangeable H-bond depleted solvation that is weakly H-bonded to a single protein donor or acceptor. The small red or blue spheres (radii < BLOVs) are typically positioned within stratum 1, directly adjacent to protein surfaces containing a single H-bond partner.
(4) Ultra-low-occupancy voxels (ULOVs) located in the far lower tail, corresponding to exchangeable H-bond depleted solvation at nonpolar protein surface positions (effectively translating to holes in the solvation shell). The dot-sized (typically white) spheres are positioned within stratum 1, directly adjacent to fully or highly nonpolar protein surfaces. ULOVs are ubiquitous on both concave and convex surfaces (although sparsely distributed) within stratum 3 of the solvation shell. It is reasonable to believe that binding is greatly enhanced at concave surfaces capable of maximal desolvation, despite the ubiquitous presence of ULOVs on convex surfaces (noting that such surfaces may bind to concave surfaces on cognate partners, including antibodies).
(5) High-occupancy voxels (HOVs), corresponding to exchangeable H-bond enriched solvation, which are likewise typically positioned within stratum 3, adjacent to concave, fully polar protein surfaces containing multiple H-bond donors and/or acceptors. Such water often exhibits multiple orientational preferences with respect to protein H-bond partners, as reflected in clusters of HOVs. H-bond enriched solvation governs access to H-bond depleted solvation within concave surface regions, reflected in ULOVs (serving as “gatekeepers”), and counterbalances the high energy of this solvation (thereby stabilizing the overall folded protein structure). The dynamic structure–function relationship depends on a Goldilocks zone of structural stability (i.e., a narrow window of rearrangements residing between structural collapse and unfolding), which is subserved by counterbalancing between favorable and unfavorable solvation free energy contributions.
(6) Ultra-high-occupancy voxels (UHOVs) located in the far upper tail, typically corresponding to water trapped within buried surfaces (“bubbles”), which may be devoid of H-bonds (white spheres) or H-bonded to a single donor/acceptor (blue or red spheres, respectively). Such water is expected to be both enthalpically and entropically depleted, and can drive structural rearrangements (similar to that occupying ULOVs).
The Mpro structures listed in Table 1 were prepared and simulated using the following protocol: (1) Protonation states, Asn/Gln and His flips, missing atoms, and net charge were corrected manually using the PPrep tool in Maestro; (2) The prepared protein structures were simulated using AMBER 16 (ff14SB force-field)32 at 300 K without restraints under periodic boundary conditions in a TIP3 water box, with the box boundaries residing 8 Å from the closest protein atoms. The pH-dependent Mpro structure and substrate recognition and the possibility of pH-driven structure switching has been suggested by other workers on the basis of the observed pH dependence of Mpro structure.16,33 However, similar structures were obtained over a wide range of pH (Table 1); furthermore, Mpro appears to operate exclusively within the cytoplasmic double-membrane vesicle environment (pH 7.0–7.4). As such, Mpro simulations at pH 7.0 seem justified.
We assume that solvating water moves in concert with flexible protein substructures (a boundary layer effect). However, due to the fixed reference frame of the grid relative to the flexible protein and its solvating water, occupancy of certain voxels by both protein and water atoms over the 40 000 frames of the trajectory is expected (resulting in artificial reduction of the water atom counts in such voxels). We circumvented this problem via rigid-body alignment of the protein + water across the 40 000 frames of the simulation (relative to the stationary grid) to a common set of template residues located within each region of interest, such that the flexible moieties and their solvation are stationary with respect to the grid (analogous to the tail wagging the dog, in which the analysis is limited to the tail). The alignment residues for each region of interest in our study are listed in Table 2.
Table 2. Residues Used to Align the 40 000 Frames of the Simulation about Each Region of Interest in the Mpro Structures.
| PDB structure | regions of interest |
|---|---|
| 2QCY | AS: S1–S5: Cys160–Leu172 |
| domain 2–3 interface: Gly109, Gln127–Pro132, Lys137–Ser139, Thr169-Gly170, Thr196–Asp197 | |
| m-shaped loop: Cys160–Leu167 | |
| 2Q6G | AS: S1–S5: same as 2QCY |
| predimerization interface: Ser1–Ser10 | |
| domain 2–3 interface: same as for 2QCY | |
| 6M03 | AS: S1-S5: same as for 2QCY |
| postdimerization interface: same as 2Q6G | |
| m-shaped loop: same as for 2QCY |
We simulated the time-averaged structures and voxel occupancies for the following Mpro states, from which we qualitatively inferred the solvation free energy barrier magnitudes governing the M1/downpro ↔ M2/up state transitions, together with those governing dimerization and substrate and inhibitor association and dissociation: (1) The apo form of monomeric M1/downpro (2QCY) and the putative substrate-bound form of monomeric M2/up (PDB structure 2Q6Gwith one chain removed), focusing on the following: (a) The AS solvation structure in 2QCY informs qualitatively about substrate k1 and k–1, as well as inhibitor kon and koff. We examined the correspondences between low- versus high-occupancy voxels and (i) substrate atoms extracted from 2Q6G, which we overlaid on the time-averaged protein and solvation structures of 2QCY; and (ii) the atoms of representative inhibitors (Table 1) extracted from selected CoV and CoV-2 Mpro structures, which we overlaid on the 2QCY time-averaged protein and solvation structures; (b) The domain 2–3 interface in 2QCY and 2Q6G, informing about the M1/downpro ↔ M2/up transition barrier; (c) The predimer interface in a single subunit of 2Q6G, informing about the monomer ↔ dimer transition barrier; (2) The apo form of dimeric 2·M2/uppro in 6M03 (the state subsequent to product release and prior to dimer dissociation), focusing on the solvation structure of the dimer interface and AS.
Results
Overview of Mpro Structural Dynamics
Analysis of the Mpro crystal structures in our study suggests the existence of a complex substrate-binding mechanism in both CoV and CoV-2 variants. This mechanism can be dissected into four interdependent switchable dynamic contributions, consisting of the following (Figure 8):
Figure 8.
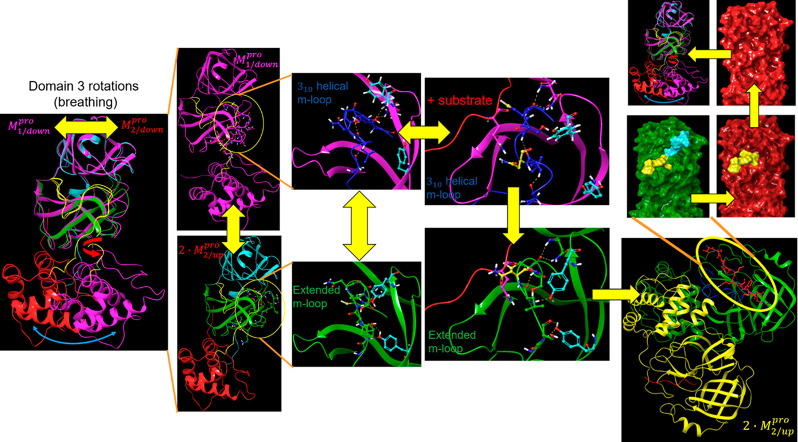
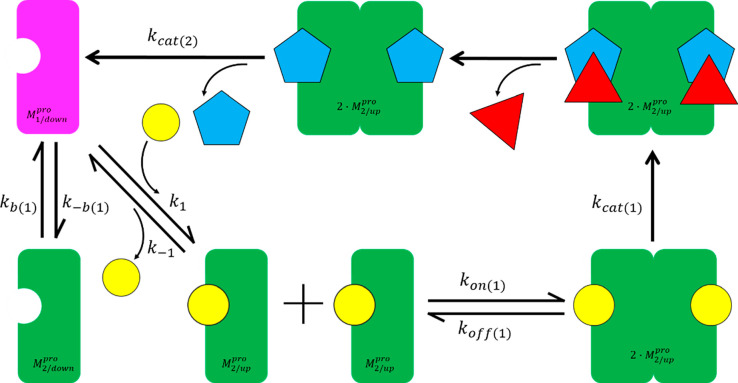
Overview of our proposed dynamic Mpro mechanism. Substrate association occurs primarily in the M1/downpro state, in which the S1 subpocket is accessible. The substrate-bound M1/down state transitions to the M2/uppro state during dimerization to the 2·M2/up–substrate complex. The 2·M2/uppro–substrate complex is more stable than the unbound form, the t1/2 of which is likely on the order of the time scale of substrate turnover.
(1) Rigid-body rotation of domain 3 relative to domains {1–2}, where domain 3 oscillates between the M1pro and M2 states (noting that dimerization occurs fastest in the substrate-bound M2pro state). The trajectory is guided by transient rearrangements over a large H-bond network spanning within and between the dimeric subunits.
(2) Cooperative state transitions between domain 3 and the rising stem of the m-shaped loop, in which the 310 helix melts into the extended chain (denoted as M1/downpro ↔ M2/up). The free energy difference between these states is attributable to solvation-mediated rearrangements (see below). Monomeric M1/uppro is ruled out by our mechanism, and monomeric M2 is highly transient (noting that neither of these states is observed experimentally).
(3) Cognate substrate and inhibitor binding to the M1/downpro state, which transiently stabilizes both the dimerization-competent monomeric M2/down state and the dimeric 2·M2/uppro state.
(4) Dimerization (M2/uppro + M2/up ↔ 2·M2pro and M2/up–substrate + M2/uppro–substrate ↔ 2·M2/up–substrate). We postulate that dimerization occurs more slowly in the unbound M1/downpro state, consistent with the higher observed substrate-independent Kd(34) (see below).
(5) Catalytic turnover from the substrate-bound 2·M2/uppro state, consisting of the following: (a) thioester adduct formation; (b) amide bond cleavage; (c) dissociation of the C-terminal product; (d) hydrolysis of the adduct; (e) dissociation of the N-terminal product.
(6) Dimer dissociation, and return to step 1.
The M1/downpro ↔ 2·M2/up state transition is guided by specific rearrangements within an extensive H-bond network spanning across the domain {1–2}–3 interface in the monomeric form and additionally across the dimer interface. Here, we focus on the configurational rearrangements within this network that switch Mpro between the substrate binding, dimerization, and catalytically competent states. The detailed effects of these rearrangements on the domain {1–2}–3 interface, m-shaped loop conformation, and dimer interface are addressed in the following sections. The dilemma for all dynamic intra- and intermolecular rearrangements relates to the trade-off between specificity and transience/throughput, which according to Biodynamics, is achieved via counterbalancing between energetically favorable and unfavorable contributions (which we refer to as “yins” and “yangs”).2 The fastest rearrangements prevail, and the balance is tipped transiently toward specific condition-dependent states, so as to avoid equilibration. Specificity/recognition is enhanced by higher desolvation costs, which are offset optimally by cognate H-bond partner(s) that are capable of replacing the H-bonds of the expelled solvation (noting that electrostatic gains are necessarily balanced against the desolvation costs of the charged species under unshielded conditions).
Intramolecular Rearrangements
Putative Conformational Transitions of Domain 3 (M1/downpro ↔ 2·M2/up)
The position of domain 3 relative to domains {1–2} differs significantly in the crystal structure of monomeric Arg298Ala mutant CoV Mpro (2QCY) compared with that in nearly all of the dimeric structures (which exhibits little variation among the latter structures). This transformation clearly occurs via rigid-body rotation of domain 3 relative to domain {1–2} about the domain 2–3 linker (noting that the domain 3 is structurally similar in both conformations) (Figure 9). We postulate that the M1/downpro ↔ 2·M2/up state transition is conveyed largely by this rotation and set about to explore the possible relationships between this rearrangement and rearrangements within the AS, domain {1–2}–3 interface, m-shaped loop, and dimer interface (noting that the coupled m-shaped loop state transition is addressed later).
Figure 9.
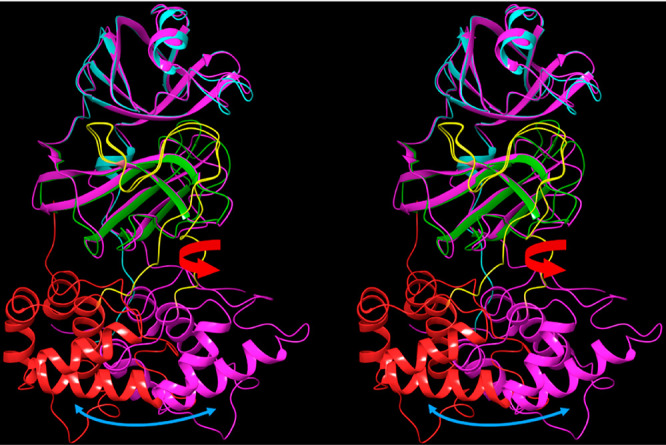
Stereo view of the monomeric CoV Mpro structure (2QCY) overlaid on chain A of a representative dimeric CoV-2 structure (6M03) about domains {1–2} reveals that domain 3 (red and magenta in 2QCY and 6M03, respectively) undergoes rigid-body rotation via backbone bond rotations within the domain 2–3 linker (yellow) (as shown for a single chain of 2·M2/uppro in Video S1). The domain 3 structures themselves are approximately superimposable (not shown).
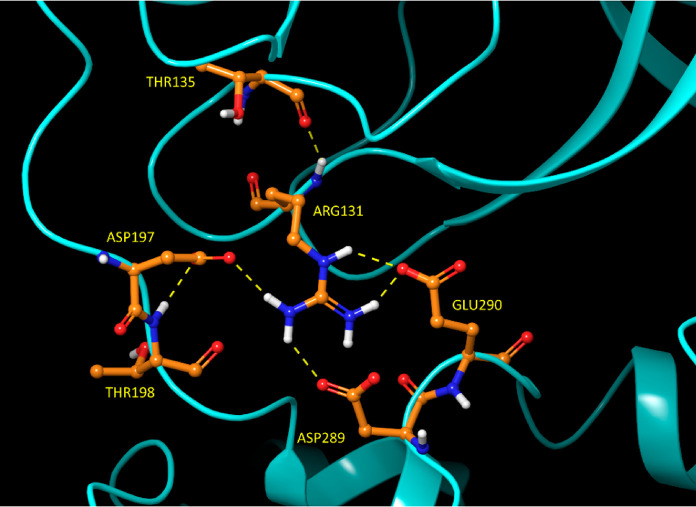
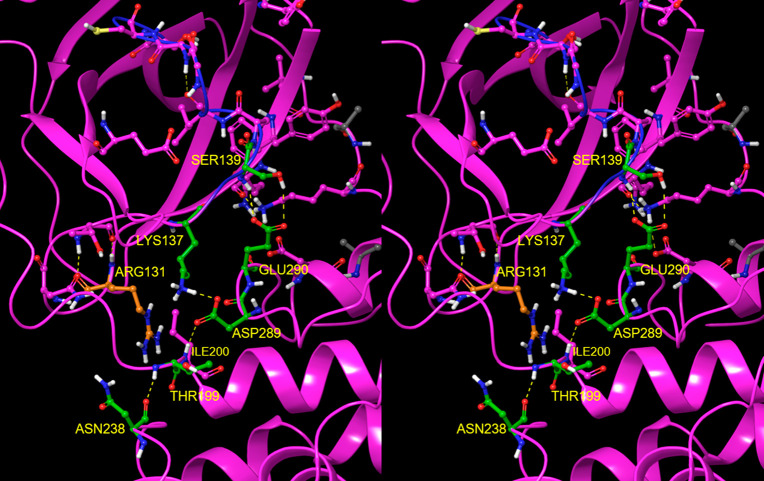
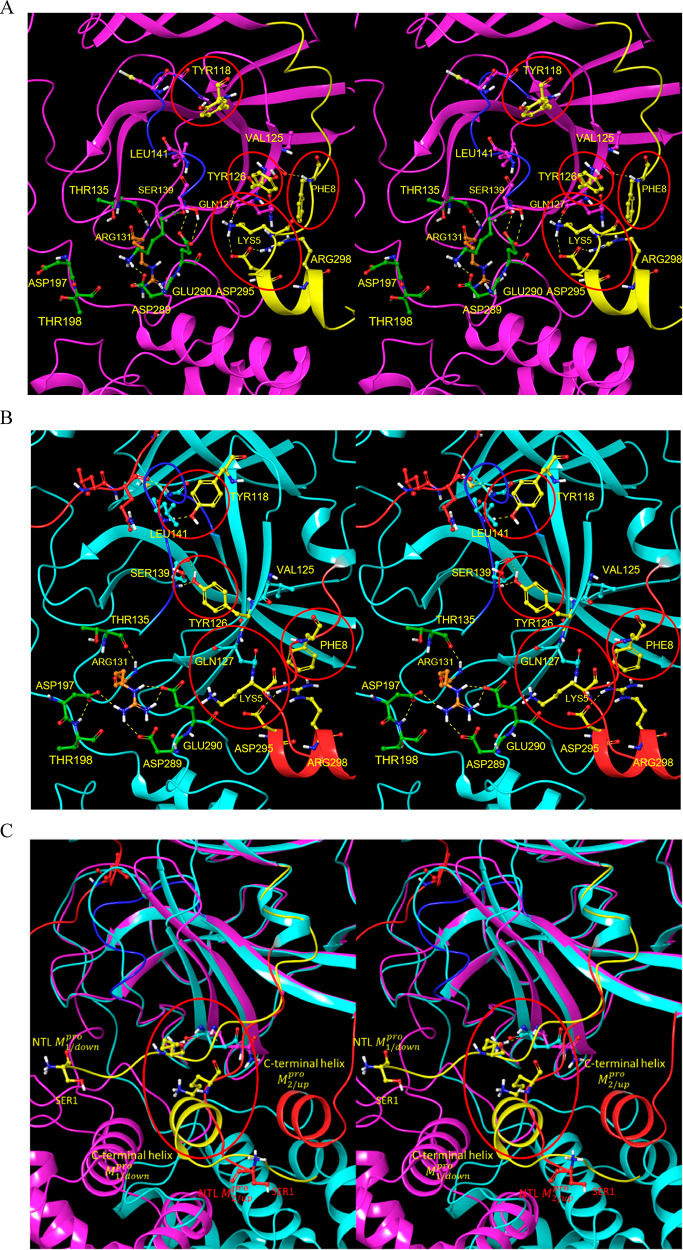
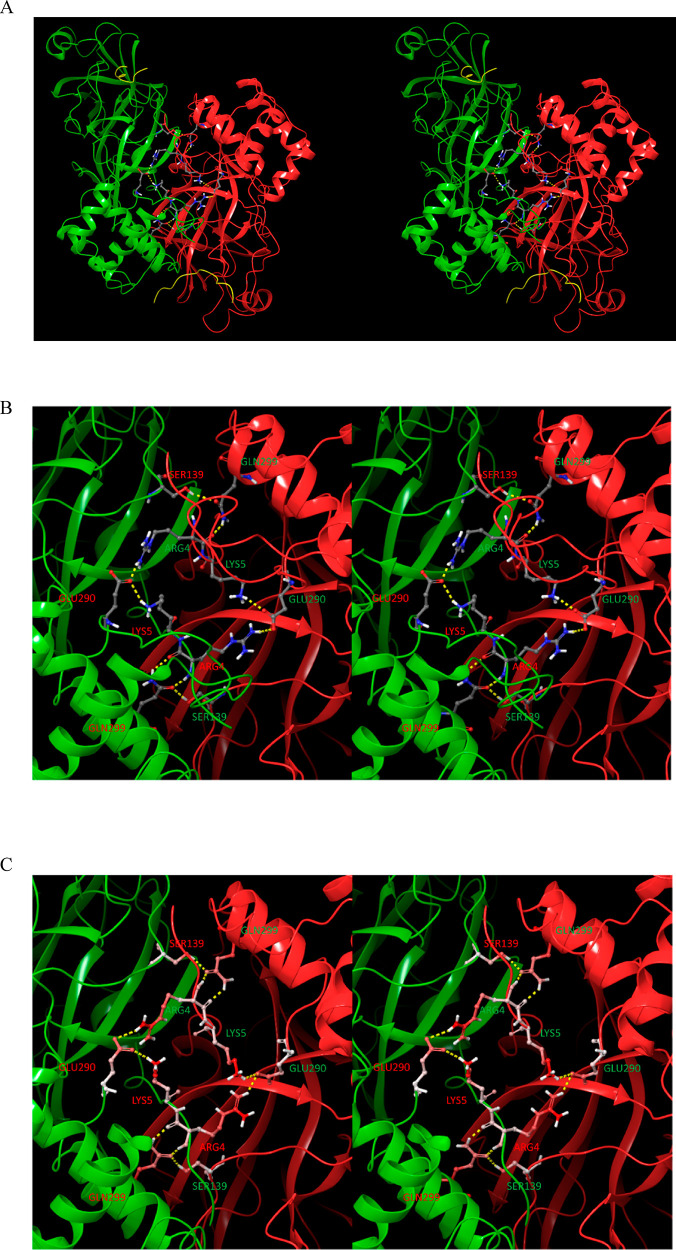
We compared the crystal structures of monomeric M1/downpro CoV Mpro with those of several dimeric 2·M2/up structures, focusing on key residues participating in the aforementioned H-bond network. Rigid-body domain 3 rotation is guided by transient H-bond switching among these residues. The network can be divided into three interacting zones, which undergo concerted signaling into the AS, m-shaped loop, and dimer interface in M1/downpro (Figure 10A) and 2·M2/up (Figure 10B): (1) Zone 1: domain 2–3 linker zone, consisting of an H-bond network centered around Arg131 (Figure 11). This zone is fully disrupted in the M1/downpro state (2QCY); (2) Zone 2: m-shaped loop zone, consisting of a ringlike H-bond network comprised of the side chains of Ser139, Glu290, Asp289, and Lys137 (Figure 12). This zone is largely disrupted in the 2·M2/up state; (3) Zone 3: CTT/NTL zone, which together with zone 1, governs the rigid-body rotation of domain 3 between the M1/downpro and 2. M2/up states (Figure 13A and B, respectively), together with the position of Tyr118, and additionally promotes dimerization (via the NTL in particular (Figure 13C)).
Figure 10.
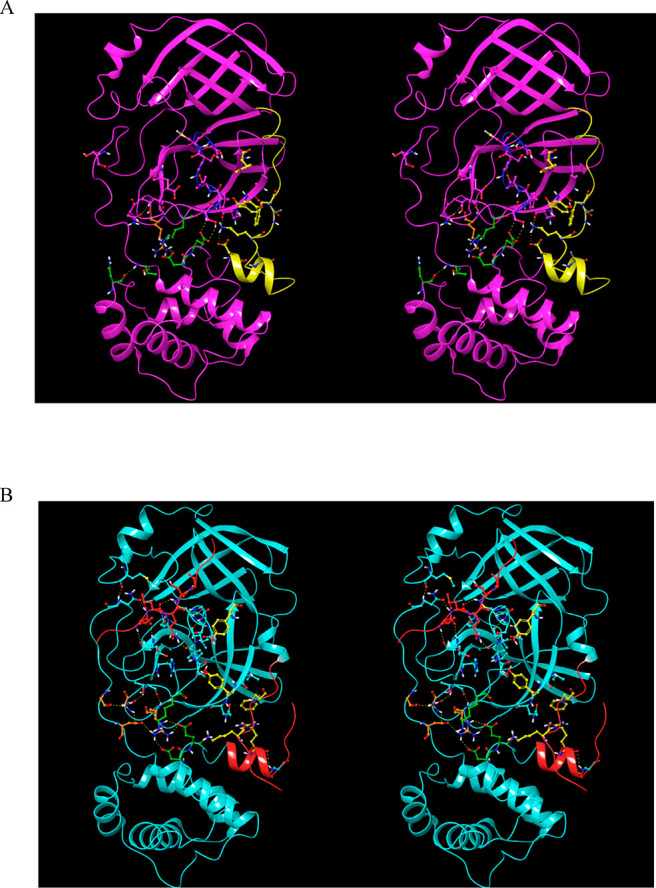
(A) Three zones of the H-bond network in the M1/downpro state captured in 2QCY. The network partners switch between the M1/down and 2·M2/uppro states. Zone 1 (orange side chains), which largely governs the domain 2–3 linker conformation, is disconnected from zone 2 (green side chains) in the M1/down state. Zone 2, which bridges between the domain 2–3 linker and rising stem of the m-shaped loop, is well-connected in this state (helping to stabilize the 310 helical conformation). Zone 3 (yellow side chains), which governs the conformations of Tyr118 and Tyr126, is stabilized by the NTL via Lys5 and the backbone NH of Phe8. (B) Same as A, except for the 2·M2/uppro state captured in 2Q6G (showing one subunit of the dimer). Zone 2 merges with zone 1 at the Arg131 nexus in this state, and zone 3 is largely disrupted in this state.
Figure 11.
Zone 1 of the domain 2–3 H-bond network in the 2·M2/uppro state of 2Q6G. The domain 2–3 linker is guided to M2 in this network configuration. Glu290 and Asp289 switch to zone 2 in this state.
Figure 12.
Stereo view of zone 2 of the domain 2–3 H-bond network in M1/downpro of 2QCY, which forms a circuit (residues highlighted in green) comprised of the side chains of Ser139 (residing just below crest B of the m-shaped loop), Glu290 and Asp289 (both residing on domain 3), and Lys137 (residing at the base of the m-shaped loop). The circuit connects with the backbone NH of Ile200 and the backbone O of Asn238 (both of which reside at the base of the domain 2–3 linker). Asp289 and Glu290 switch to zone 1 in the 2·M2/up state.
Figure 13.
Stereo view of zone 3 of the H-bond network in the domain {1–2}–3 interface. (A) M1/downpro state captured in 2QCY. The β-hairpin twists in the absence of the Tyr H-bonds in this state, resulting in rotation of Tyr118 and Tyr126 away from the m-shaped loop. (B) M2/up state captured in 2Q6G. This zone governs the β-hairpin (Gln110-Asn133) conformation on which Tyr118 and Tyr126 reside. The β-hairpin conformation in this state depends on H-bonds between Lys5 of the NTL and the backbone O of Gln127 (which is further stabilized by Arg298), together with the backbone NH of Phe8 and backbone O of Val125. H-bonds between Tyr118 and Tyr126 and the backbone NH of Leu141 and backbone O and NH of Ser139, respectively, help promote the extended m-shaped loop conformation in the 2·M2/uppro state (the energetic driver of this transition is outlined below). The 310 helical conformation in the M1/down state occurs in the absence of the two Tyr H-bonds, together with additional zone 2 contributions. (C) C-terminal helix and NTL in M1/downpro (yellow) and 2·M2/up (red). This helix, which is rotated toward the left in M1/downpro, overlaps with the NTL in the M2/up state (circled in red), and as such, is pushed away in the M1/downpro state (blue arrow pointing toward the southwest). The Lys5–Gln127 H-bond is disrupted in this altered NTL trajectory, which signals into Tyr118 and Tyr126 via the β-hairpin.
Next, we examined the B-factors in the monomeric (M1/downpro) and several dimeric (2·M2/up) crystal structures as a qualitative metric of the energetic stability of the H-bond network in the two states (Figure 14). The data suggest that the H-bond network in the M1/downpro state is stable (B-factors ranging largely between white/light blue/dark blue) (Figure 14A), compared with the significantly less stable network in the dimeric apo 2·M2/up state (B-factors ranging between white/pink/bright red) (Figure 14B). The B-factors of the cognate substrate-bound structure (Figure 14C) are only slightly warmer than those of M1/downpro, consistent with substrate-mediated stabilization of the form. The boceprevir-bound 2·M2/up B-factors are comparable to those of the substrate-bound structure (Figure 14D), whereas those of the N3 inhibitor bound structure are far warmer (nearly comparable to the apo structure) (Figure 14E). The 2·M1/downpro state (PDB structure 2BX3), in which the extended m-shaped loop conformation ordinarily found in this state instead consists of the 310 helix, is consistent with the warm B-factors in the rising stem of the loop (Figure 14F).
Figure 14.

Stereo views of monomeric CoV Mpro (2QCY), together with a single chain extracted from selected dimeric structures as noted, showing the gross differences in the H-bond network governing the M1/downpro and 2·M2/up states (provided as a flip-through animation in the Supporting Information). (A) H-bond network in M1/downpro (2QCY), showing key residues color-coded by B-factor (blue → red color gradient depicting low to high values, respectively). (B) Same as A, except for a single chain of a representative apo 2·M2/up structure (6M03). Warmer B-factors are consistent with the higher energy state of the unbound dimer. (C) Same as A, except for a single chain of the substrate-bound 2·M2/uppro structure (2Q6G). Cooler B-factors are consistent with the lower energy state of the substrate-bound dimer. (D) Same as A, except for a single chain of the inhibited boceprevir-bound 2·M2/up structure (PDB structure 6WNP). The B-factors are somewhat cooler than those in the substrate-bound 2Q6G structure. (E) Same as D, except for the N3 inhibitor-bound 2·M2/uppro structure (PDB structure 6LU7). The B-factors are only slightly cooler than the apo dimeric structure, consistent with the higher energy/lower binding affinity of this inhibitor. (F) Same as A, except for the protein captured in the 2·M2/down state.
Putative Hydropowered M1pro ↔ M2 State Transition Mechanism
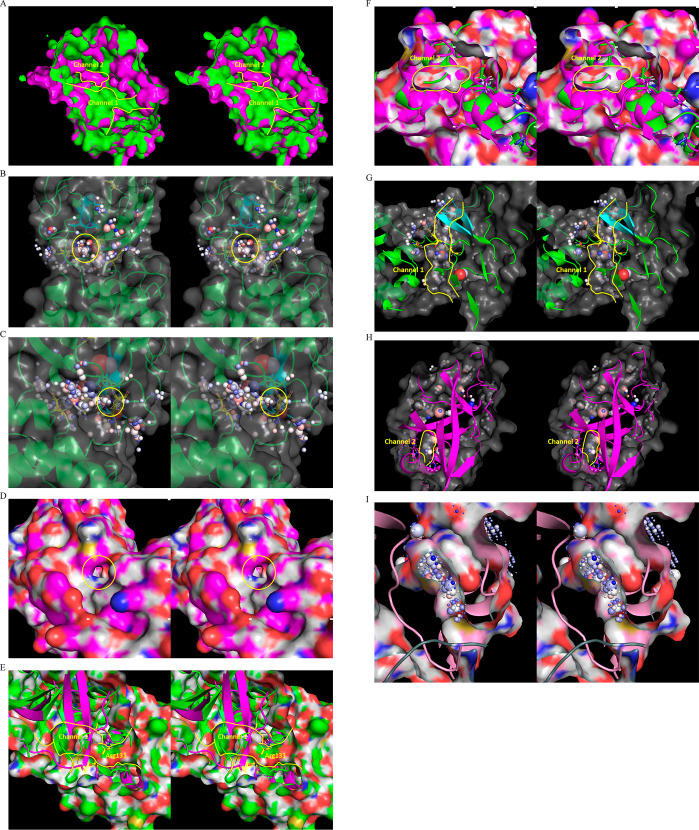
We used WATMD to probe rigid-body domain 3 rotation and m-shaped loop conformational dynamics underlying the M1pro ↔ M2 transition based on the general nonequilibrium solvation free energy-driven power cycle outlined in Figure 3 (noting that the down ↔ up transition of the m-shaped loop depends additionally on dimerization, as outlined below). A buried channel is observed within the domain {1–2}–3 interface in the M1pro state (denoted as channel 1; Figure 15A), which terminates below the AS β-hairpin (denoted as entrance 1; Figure 15B) and above the domain 3 C-terminal helix (denoted as entrance 2; Figure 15C). The channel consists largely of Arg131, Glu290, Lys137, Asp240, and Asp289, the H-bond network of which is disrupted in the M1 state (Figure 12). A second buried channel appears elsewhere within the domain {1–2}–3 interface in the M2pro state (denoted as channel 2; Figure 15A), which terminates within the dimer interface (noting that this entrance is closed in all substrate-/inhibitor-bound structures (Figure 15D). The channel lining consists largely of Lys5, Met6, Ala7, and Phe8 of the NTL, together with Phe291, Thr292, Asp295, Val296, Arg298, Gln299, and Cys300 of domain 3. Rearrangement of the domain {1–2}–3 interface during the M1 → M2pro state transition results in the loss of channel 1, mediated largely by Arg131 and two β-strands of domain 2 that occupy the channel in the M2 state (Figures 11 and 15E). Reverse rearrangement of the interface during the M1pro → M1 state transition results in the loss of channel 2, mediated largely by Arg4, Lys5, and Met6 of the NTL backbone that occupies the channel in the M1pro state (Figures 12 and 15F).
Figure 15.
(A) Stereo view of buried water channels 1 and 2 (yellow outline) within the domain {1–2}–3 interface in the M2pro (green) and M2 (magenta) states, captured respectively in 2QCY and 2Q6G. (B) Stereo view of entrance 1 of channel 1, showing the water-occupied voxels within the peri-entrance region. The sphere radii are scaled according to occupancy, and color-coded according to the preference of each voxel for water H or O (see the “Materials and Methods” section). (C) Same as B, except for entrance 2. (D) Stereo view of the channel 2 entrance, which is closed in the substrate/inhibitor-bound state. (E) Stereo view of channel 1 in the M1pro state (2QCY) (green) overlaid on domain 3 in the M2 state (2Q6G) (magenta), showing complete disruption of the channel by two β-strands of domain 2, together with Arg131 (yellow). (F) Stereo view of channel 2 in the M2pro state (2Q6G) (magenta) overlaid on domain 3 in the M1 state (2QCY) (green), showing complete disruption of the channel by Arg4, Lys5, and Met6 of the NTL backbone. (G) Stereo view of the occupied voxels in channel 1 (outlined in yellow). The corresponding water is expelled via rearrangement of the domain {1–2}–3 interface upon entry to the M2pro state. (H) Stereo view of the occupied voxels in channel 2 in the M2 state. (I) Water trapped within channel 2 is vented subsequent to product dissociation, as captured in the apo dimeric structure (6M03).
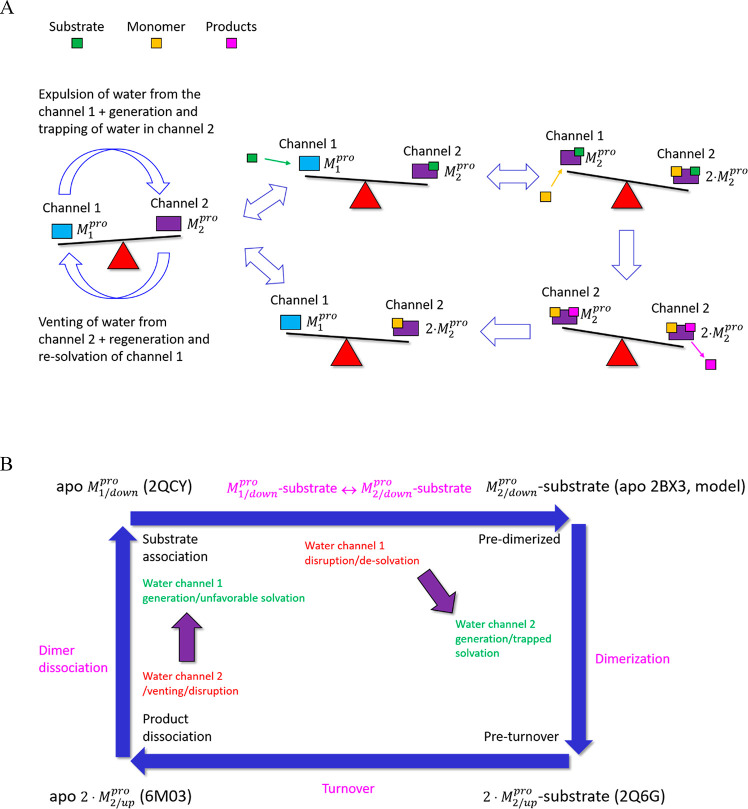
Channel 1 is occupied by expellable ULOVs and HOVs (Figure 15G). Although HOVs typically correspond to H-bond enriched solvation, the narrowness of the channel is consistent with slowly exchanging water between the channel and bulk solvent (via entrances 1 and 2). We therefore hypothesize that water occupying channel 1 in the M1pro state is entropically/enthalpically unfavorable, and as such, promotes local instability of the domain {1–2}–3 interface. This water is displaced to bulk solvent during the M1 → M2pro state transition. Channel 2 is likewise occupied by HOVs and ULOVs, which in the absence of an open entrance, necessarily correspond to fully trapped/nonexpellable solvation (Figure 15H). As such, potential energy released by the expulsion of water from channel 1 during domain 3 rotation is partially stored in the water trapped within channel 2. This water is vented subsequent to product dissociation upon completion of the catalytic cycle (Figure 15I), thereby driving the M2 → M1pro state transition. The overall mechanism can be summarized as follows (Figure 16):
Figure 16.
(A) Schematic of the proposed solvation free energy cycle in Mpro. The M1/downpro → 2·M1/down transition rate is governed by counterbalancing (denoted by a seesaw metaphor) between the favorable expulsion of H-bond depleted and slowly exchanging water from channel 1. A portion of this energy is stored in the form of trapped water within channel 2 (which persists in both substrate- and inhibitor-bound structures). Venting of this water subsequent to product dissociation resets domain 3 back to the M1/downpro state (a specific case of the general paradigm proposed in Figure 3). However, the seesaw is tipped toward M2/down via substrate binding (green rectangle), followed by possibly rapid dimerization (orange rectangle), resulting in the expulsion of additional H-bond depleted solvation from the AS and dimer interface. Product release promotes opening of channel 2, and venting of the trapped water (see below), which in turn, drives the 2·M2/downpro → M1/down state transition (including restoration and resolvation of channel 1). Product turnover and dissociation act as a “check valve” (denoted by the single-headed arrows), preventing backflow through the cycle. (B) Dynamic cycle, annotated with the crystal structures in which the aforementioned states have been captured.
(1) M1/downpro is destabilized within a Goldilocks zone (globally stable/locally unstable) by impeded (though H-bonded) and H-bond depleted solvation within buried channel 1.
(2) Spontaneous rigid-body rotation of domain 3 underlying the M1pro → 2·M2 transition is powered by the expulsion of channel 1 solvation through entrance 1, which is accompanied by the creation of channel 2 and the solvation thereof by trapped water (analogous to loading a spring).
(3) The open state of channel 1/entrance 1 may be stabilized transiently by substrate binding (a key external energy input to the system), as inferred from the close proximity of this entrance to the β-hairpin substrate binding site.
(4) Dimerization (i.e., 2·M2pro formation) depends on specific positioning of the NTL, part of which comprises the lining of channel 2. Dimerization is well-explained by the expulsion of H-bond depleted solvation from the dimer interface (see below), which further stabilizes the water-trapped state of channel 2.
(5) Opening of channel 2 subsequent to product dissociation (as captured in 6M03), followed by venting of the trapped water, drives the reverse 2·M2pro → M1 state transition.
Putative Conformational Transitions of the m-Shaped Loop
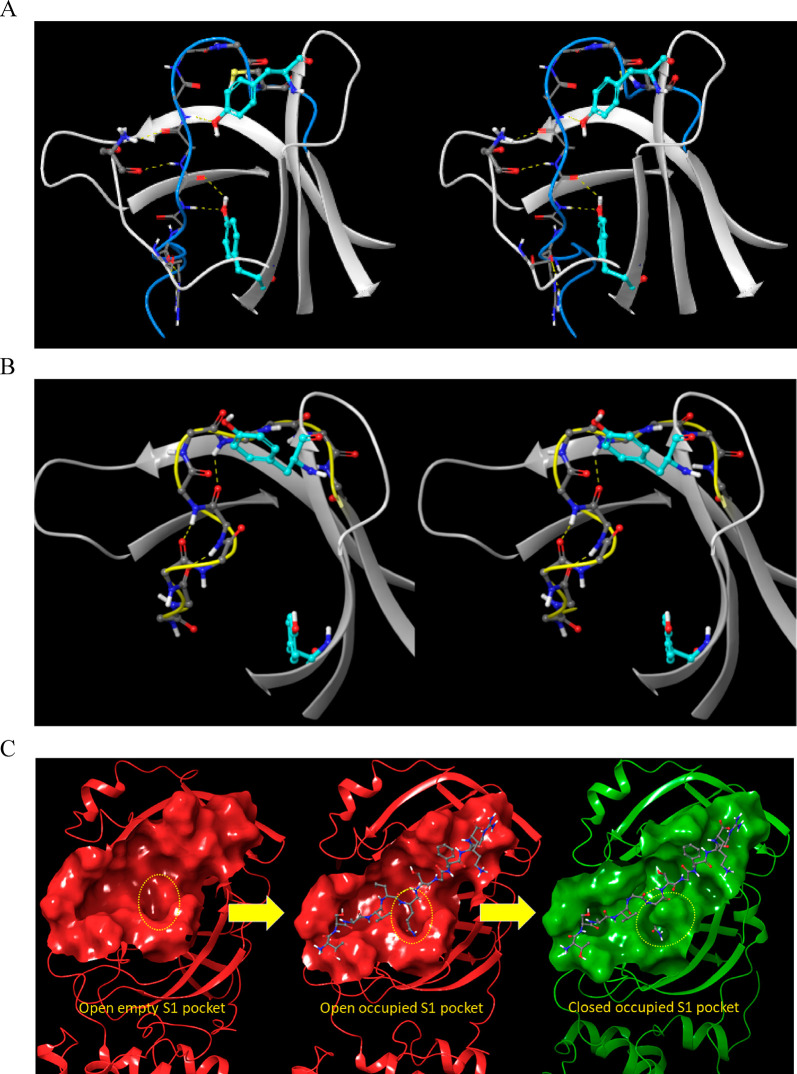
The m-shaped loop, which contains the catalytic Cys (resident on crest A of the loop) and oxyanion hole (resident on crests A and B), is common to all members of the chymotrypsin family. Crest B of Mpro switches between the down (S1-subpocket-accessible) (Figure 17A) and up (S1-subpocket-inaccessible) positions (Figure 17B) corresponding to the M1/downpro and 2·M2/up states of the enzyme, respectively. The S1 subpocket switches between the open/oxyanion hole misaligned and closed/oxyanion hole aligned states in M1/downpro and in 2·M2/up, respectively. Although access to the S1 subpocket is sterically blocked by Asn142 in the crest B up position, the cavity itself remains intact and occupiable (as such, Asn142 acts as a gatekeeper rather than a plug; Figure 17C). We postulate that the complex m-shaped loop mechanism of Mpro is tailored for lowering the otherwise high desolvation cost of the polar P1 Gln side chain during substrate association with the S1 subpocket (which appears to be only partially desolvated in the bound state). The need for this mechanism is obviated in hepatitis C NS3 protease and chymotrypsin due to the preference of those enzymes for Cys/Thr and aromatic P1 side chains, respectively. As such, the m-shaped loops of these proteins are instead rigidified via an extra crest in NS3 (Figure 18A) and a disulfide bond to an adjacent chain in chymotrypsin (Figure 18B), resulting in continuous S1 subpocket accessibility (Figure 18C,D).
Figure 17.
(A) Stereo view of the m-shaped loop in the up state of crest B (blue). (B) Stereo view of the m-shaped loop in the down state of crest B (yellow). (C) Left: unbound Mpro exists in the open state (corresponding to the down position of crest B, in which Asn142 points away from the S1 subpocket), awaiting substrate association. Middle: substrates associate into the AS, projecting their P1 side chain into the open S1 subpocket. Right: crest B undergoes substrate- and dimerization-induced rearrangement to the up position, with Asn142 facing the S1 subpocket. We postulate that this mechanism facilitates partial desolvation of the highly polar P1 Gln side chain of cognate Mpro substrates.
Figure 18.
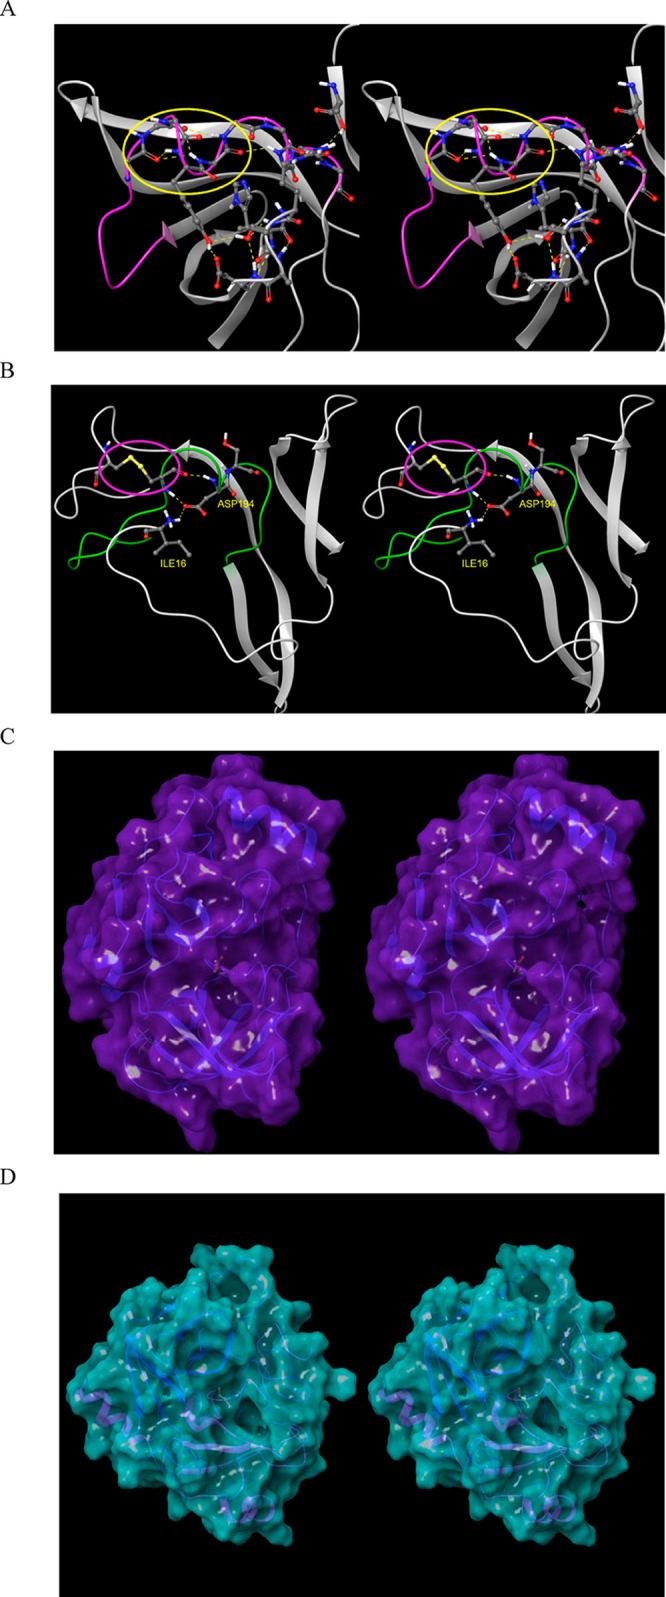
(A) Stereo view of the m-shaped loop of hepatitis C NS3 protease (PDB structure 4KTC). The loop (magenta) is stabilized by a third crest (circled in yellow), together with the H-bond network shown in the figure. (B) Stereo view of the m-shaped loop of chymotrypsin (PDB structure 4CHA). The loop (green) is stabilized by a disulfide bond in the rising stem (circled in magenta), together with H-bonds between backbone groups, and between Asp194 and the protonated N-terminal Ile16. (C) The S1 subpocket is continuously accessible in NS3 protease, consistent with the lower desolvation cost of the Cys/Thr P1 side chains of its cognate substrates. (D) Stereo view of the S1 subpocket of chymotrypsin, which is continuously accessible, consistent with lower desolvation cost of the aromatic P1 side chains of its cognate substrates.
We explored the M1/downpro ↔ 2·M2/up transition mechanism via comparison of the monomeric and representative dimeric CoV and CoV-2 structures to better understand the functional purpose and detailed structural and energetic basis of the up/down bidirectional state transition of crest B. We now turn to exploration of the following:
-
(1)
The conformational properties of the m-shaped loop in the M1/downpro and 2·M2/up states.
-
(2)
The means by which m-shaped loop and domain 3 conformational dynamics are coupled.
-
(3)
The role of m-shaped loop conformational dynamics in governing the S1 subpocket properties and P1 Gln desolvation mechanism.
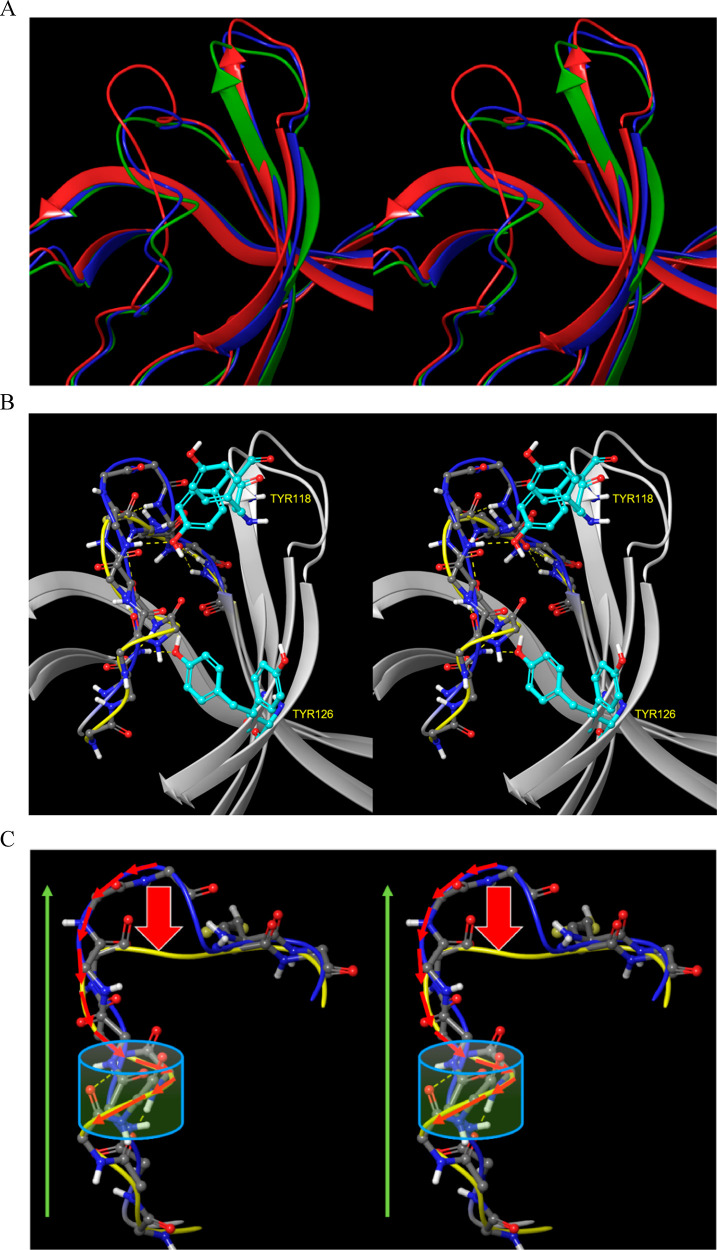
Next, we compared the detailed conformational properties of the rising stem of the m-shaped loop vis-à-vis crest B repositioning in representative crystal structures capturing the M1/downpro (2QCY), 2·M2/up (2BX3), and 2·M2/uppro (6WNP, 2Q6G, etc.) states, noting that with the exception of 2QCY and 2BX3, the 2·M2/up conformations are highly similar across all CoV and CoV-2 structures. An overlay of the three structures reveals the existence of a similar 310 helix in 2QCY and 2BX3, despite the different domain 3 positioning in these structures (Figure 19A). The domain 3 position in 2BX3 is similar to that in 2Q6G, but the m-shaped loop conformation is extended in the latter structure, and the Lys5-Gln127 H-bond in zone 3 that promotes the M1/downpro state is also present in the 2·M2/up state, suggesting that the m-shaped loop conformation and domain 3 positioning are decoupled anomalously. These and other differences do not appear to be pH-dependent, noting that boceprevir crystallized in CoV-2 Mpro at pH 6.5 (PDB structure 7BRP), pH 7.5 in 6WNP, and pH 4 in 6XHM exhibit only slight structural differences. A comparison of the m-shaped loops in 2QCY and 6WNP reveals the detailed differences between these two conformations (Figure 19B):
Figure 19.
(A) Overlay of the m-shaped loop in the dimeric boceprevir-bound CoV-2 Mpro (6WNP, red), monomeric CoV Mpro (2QCY, green), and dimeric CoV Mpro (2BX3, blue). (B) Overlay of the m-shaped loop in the up (blue) and down (yellow) states of crest B. (C) The down state of crest B is generated (red block arrow) by reversibly spooling the more steeply sloped extended form (N- to C-terminal direction denoted by the green arrow) to/from the shallower 310 helical turn.
(1) Tyr118 and Tyr126 (part of zone 3) in the extended conformation are respectively H-bonded to Leu141 and Ser139 on the rising stem of the m-shaped loop in the 2·M2/uppro state, but not in the M1/down state.
(2) The rising stem of the m-shaped loop contributes to the lining of the S1 subpocket (addressed in the following section).
(3) Glu290 (part of zone 2) is H-bonded to Ser139 on the rising stem of the m-shaped loop in the M1/downpro state, but not in the 2·M2/up state.
(4) The N-terminal basic group of Ser1 binds to the backbone O of Phe140 in some structures, but not in others, suggesting that this group plays little or no direct role in substrate binding.
Crest B down/up cycling is coupled directly to domain 3 repositioning and dimerization, which together form the basis of the M1/downpro and 2·M2/up states. Crest B down/up transitions are subserved by 310 helix ↔ extended conformational transitions in the rising stem of the m-shaped loop, in which the extended chain “spools” in and out of the helical turn, respectively (Figure 19C).
Putative Hydropowered Up/Down m-Shaped Loop Transition Mechanism
We used WATMD to probe crest B up ↔ down conformational dynamics underlying the M1/downpro ↔ 2·M2/up transition based on the general solvation free-energy-driven power cycle outlined in Figure 3. We calculated the solvation properties of the m-shaped loop in the down and up positions in M1/downpro versus 2·M2/up (2QCY and 6M03, respectively), the results of which can be summarized as follows:
(1) A buried water channel (denoted as channel 3) is present in the time-averaged apo 2·M2/uppro state (6M03) (Figure 20A), which is absent in the time-averaged M1/down state (2QCY) (Figure 20B). This channel, which is occupied by several HOVs and ULOVs, resides largely within the opposite subunit of the dimer, projecting behind the m-shaped loop, and connecting to the protein surface directly below the S1 subpocket.
Figure 20.
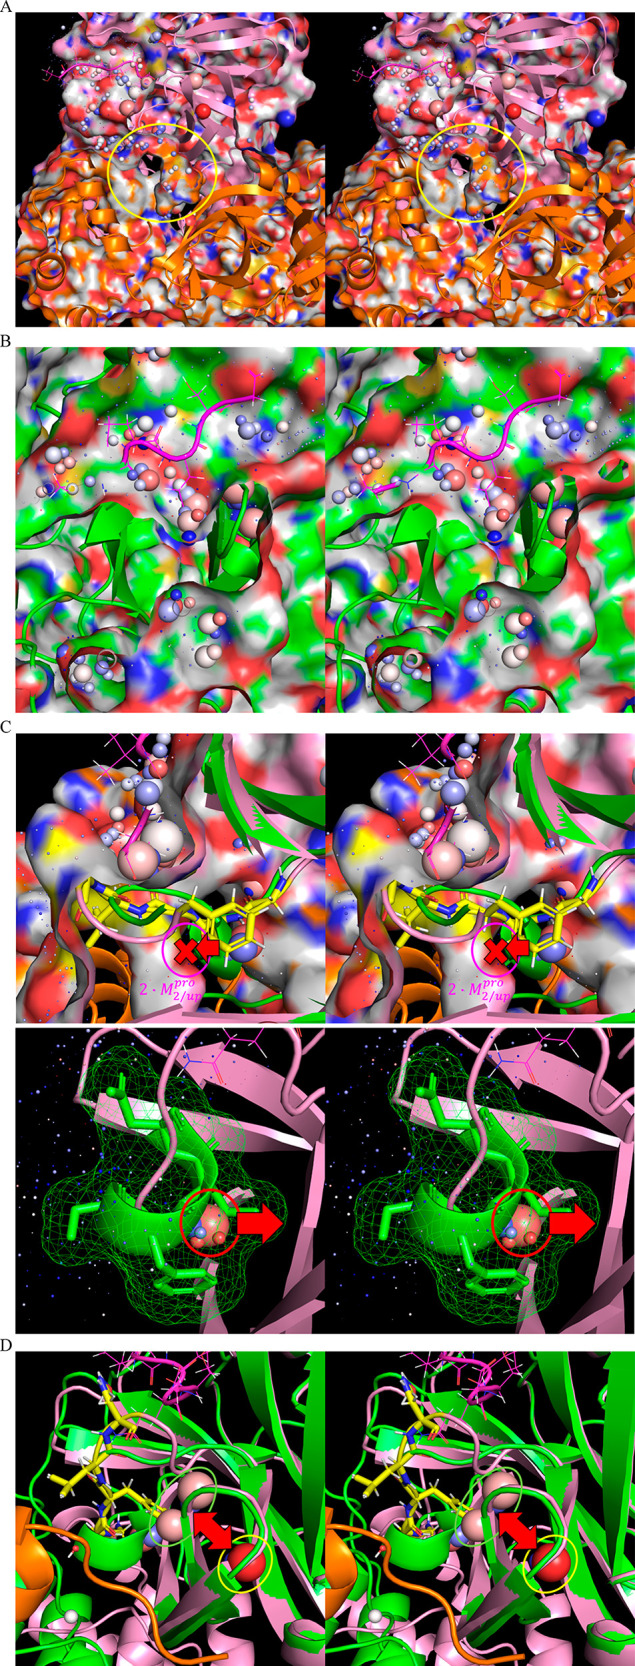
(A) Stereo view of the time-averaged 2·M2/uppro structure (6M03) (clipped through the external protein surface) showing channel 3, which resides adjacent to the rising stem of the m-shaped loop (circled in yellow), the lining of which is contributed largely by the opposite monomer (orange). (B) Stereo view of the same region in the time-averaged M1/down structure (2QCY) (clipped through the external protein surface), noting the absence of channel 3 in this state. (C) Stereo view of the time-averaged M1/downpro structure overlaid on the time-averaged 2·M2/up structure (green and pink, respectively), depicting the putative solvation free energy transduction mechanism driving the down and up states of the m-shaped loop. Top: Formation of channel 3 in the 2·M2/uppro state drives the rising stem of the loop into the up conformation due the high cost of desolvating the channel by the 310 helical turn (denoted by the red X). Bottom: Conversely, 310 helix formation is promoted in the M1/down state via the expulsion of a trapped water (green arrow), together with several H-bond depleted waters on the external protein surface (yellow circle) that are present in the 2·M2/uppro state. (D) Stereo view of the time-averaged M1/down structure (2QCY) overlaid on the time-averaged 2·M2/uppro2·M2/up structure (2Q6G), showing the UHOVs in the respective structures (circled in green and pink, respectively). Conservation of these unfavorable UHOVs (likely representing a single water molecule) in both states (the shifted positioning denoted by the red arrow) suggests that they contribute to the local instability and rearrangeability of the m-shaped loop.
(2) Two UHOVs (representing high energy trapped water) residing between and below crests A and B of the m-shaped loop are present in M1/downpro, whereas a single UHOV (likewise representing high energy trapped water) is present in the 2·M2/up state, near the descending stem of the m-shaped loop (Figure 20C). These findings suggest that trapped solvation shifts from one position to another (rather than being expelled) during the M1/downpro ↔ 2·M2/up state transition, thereby precluding a strong energetic preference for one state over the other (which would otherwise result in a static state distribution).
We postulate that 310 helix formation in the M1/downpro state is blocked by H-bond enriched water occupying the HOVs in channel 3 in the 2·M2/up state due to the putatively high desolvation cost of this water and promoted by expulsion of H-bond depleted solvation from the protein surface in the 2·M2/uppro state (Figure 20D). We further postulate that the up state transition of crest B is limited to the dimeric form, relegating the monomeric state transition to M1/down ↔ M2/downpro (noting that the apo 2·M2/up state is captured in 2BX3).
Enzyme Dynamics in cis
Dimer-independent catalytic activity of precleaved Mpro was observed by Chen et al., who nevertheless proposed the existence of an “intermediate” dimeric form of the enzyme.35 A more plausible explanation is that precleaved Mpro exists exclusively as monomers embedded within the polyprotein, whereas the postcleaved species necessarily exists as a mixture of monomers and dimers, in which the monomeric form binds substrates that are cleaved by the dimeric form (such that kcatmonomer ≪ kcatdimer). The precleaved monomeric form of Mpro cannot be fully represented in 2QCY because the C-terminal peptide is spatially far from the AS (noting that the Gln306 C-terminus serves as the P1 residue of the precleaved protein). We propose the existence of two distinct forms of monomeric Mpro, consisting of:
-
(1)
The postcleaved species captured in 2QCY.
-
(2)
An alternate precleaved polyprotein-embedded form, in which the C-terminal peptide (Gln 276 and Gln306) of domain 3 is unfolded, with the following being true:
-
(a)
The cleavage peptide projects into the AS (which likely precludes cleavage of precleaved Mpro by postcleaved Mpro in trans).
-
(b)
The remainder of the polyprotein exits from the prime side of the AS (noting that Mpro folding likely occurs after nsp4 cleavage).
-
(a)
We postulate that cis cleavage is facilitated in the M1/downpro state, in which domain 3 is rotated toward the AS, and the C-terminal region of this domain (including the CTT helix) is partially unfolded (Figure 21). In the absence of this helix, the NTL is free to adopt the active Lys5–Gln127 H-bond-disrupted state that exists in all 2·M2/up structures (i.e., a hybrid M1/uppro state).
Figure 21.
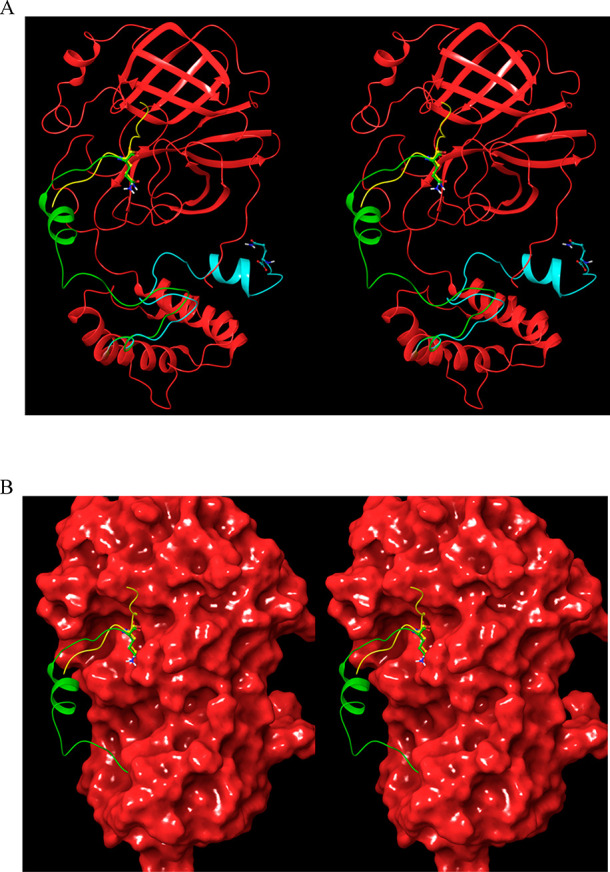
Hypothetical manually generated model of the cis cleavage structure of monomeric Mpro subsequent to turnover, in which the partially unfolded domain 3 of 2QCY projects into the AS (the P1 Gln306 side chain is shown for reference). (A) The modeled C-terminal region (green) extends from domain 3 to the AS. The cognate substrate extracted from 2Q6G (yellow) is overlaid on the modeled structure. The original C-terminal chain in 2QCY is shown in cyan. (B) Same as A, except showing the solvent-accessible surface.
Intermolecular Rearrangements
Enzyme Dynamics in trans
The catalytic cycle of Mpro depends integrally on the dynamic intramolecular rearrangements described above. We propose that substrates bind to monomeric Mpro in the M1/downpro state, which upon transitioning to the M2/down state, is further stabilized by the bound substrate in the catalytically active 2·M2/uppro dimeric form (noting the dimerization-dependence of the up position of the m-shaped loop). This process is accompanied by additional rearrangements, including switching of the following:
-
(1)
His172 (on the β-hairpin) from a non-H-bonded position (or Glu166-paired position in some structures) to a small H-bond network around the backbone O of Ile136 in the M1/downpro and 2·M2/up states, respectively.
-
(2)
His163 from an H-bonded position with Ser144 to the substrate P1 Gln side chain in the M1/downpro and 2·M2/up states, respectively.
-
(3)
Met165 between two alternate rotamers, both of which are observed in several crystal structures. [The S2 subpocket is alternately blocked and unblocked in the two rotamers, suggesting that the rate of repositioning may be rate-limiting for cognate substrate binding (i.e., the Met165 side chain is energetically “frustrated”).]
The catalytic cycle is energetically self-consistent, beginning with substrate association-induced expulsion of H-bond depleted solvation from the AS. Cleavage of the Gln306 peptide bond (Figure 22A) results in two products, consisting of the C- and N-terminal leaving groups (the precleavage form bound to M1/downpro and 2·M2/up is shown in Figure 22B,C, respectively), noting that the chain inserts into the AS in the N- to C-terminal direction. Dissociation of the C-terminal leaving group has no impact on the intramolecular/dimeric state of Mpro (Figure 22D), whereas that of the N-terminal leaving group resets the enzyme to the monomeric M1/downpro state (Figure 22E).
Figure 22.
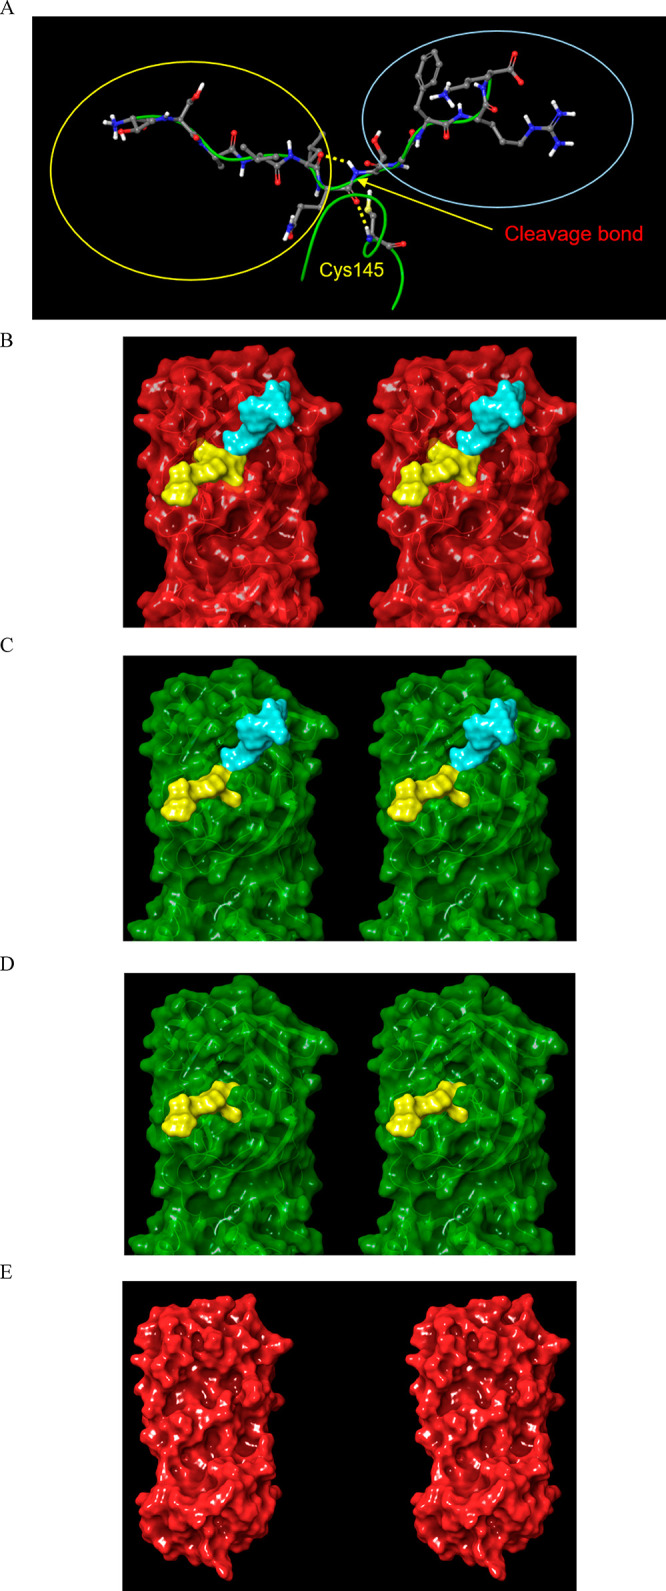
Stereo views of the proposed dynamic enzyme cycle. (A) The cognate CoV Mpro substrate from 2Q6G is divided into two zones around the cleavage bond (red arrow). The N- and C-terminal products are circled in yellow and blue, respectively. Cys145 is shown for reference. (B) The modeled substrate-bound structure in the M1/downpro state (overlay of the substrate from 2Q6G on 2QCY) subsequent to association. (C) The substrate-bound structure in the 2·M2/up state (2Q6G) (single chain shown for clarity). (D) Same as C, except subsequent to dissociation of the C-terminal product. (E) Same as D, except subsequent to dissociation of the N-terminal product, at which point the dimer dissociates to the oscillating M1/downpro ↔ M2/down monomeric form. The protein population is unequally distributed among the monomeric and dimeric substrate-bound and unbound forms, each of which is further distributed among the M1/downpro and M2/down states (with the exception of dimers, which do not exist in the M1/downpro state).
The S1 subpocket is comprised of the residues shown in Figure 23 (M1/downpro) and 24 (2·M2/up), together with the substrate P3 side chain. A subset of these residues plays a dual role in substrate binding (via the backbone of Glu166) and the following:
Figure 23.
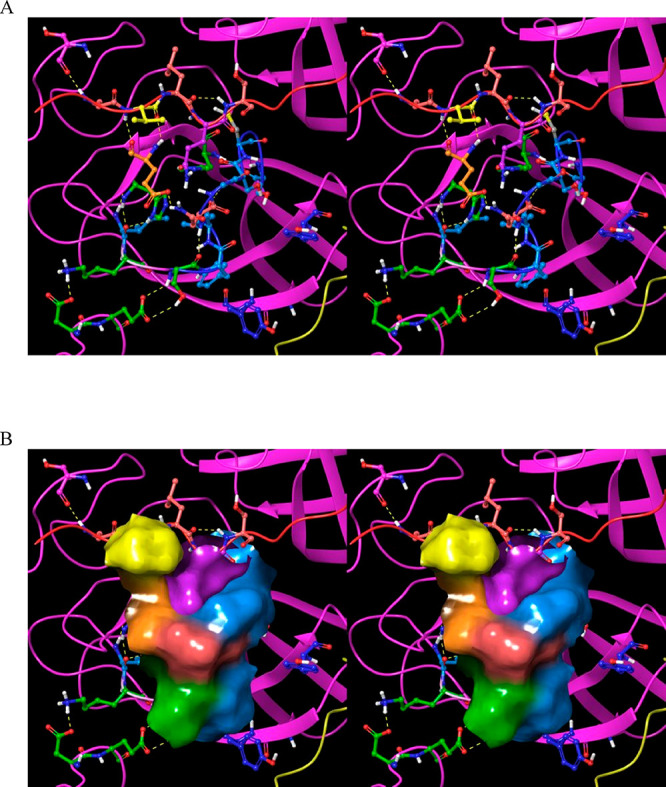
Stereo views of the S1 subpocket in the M1/downpro state (2QCY) with the bound substrate P1 group modeled in from 2Q6G. The substrate peptide (red ribbon) is visible at the top of the image. (A) The S1 subpocket is lined by Glu166 (orange), His172 (green), His163 (not visible), Ser139 (blue), Phe140 (blue), Leu141 (blue), Asn142 (coral), and the substrate P3 side chain (yellow). The subpocket is occupied by the P1 Gln side chain (pink). Many of the residues lining the S1 subpocket play dual roles: the backbone of Glu166 H-bonds with the substrate P3 backbone (thereby directly connecting the β-sheet formed by the substrate and β-hairpin to the S1 subpocket). (B) Same as A, except showing the solvent-accessible surface (noting that the accessibility of the S1 subpocket is underestimated by the smoothed solvent-accessible surface).
Figure 24.
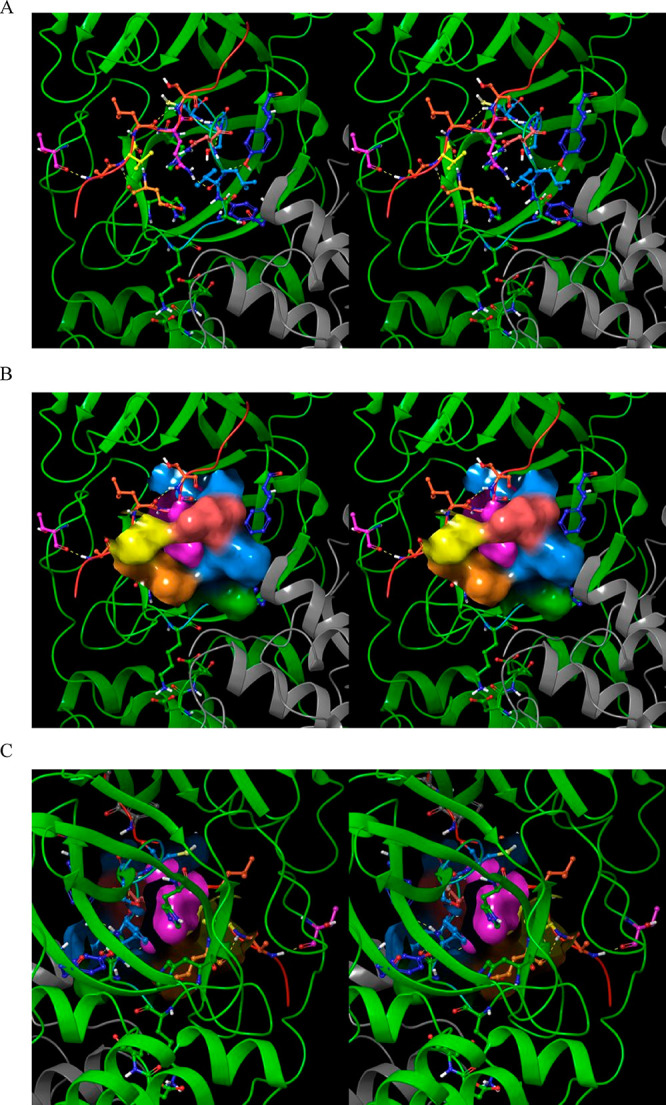
Stereo views of the S1 subpocket in the 2·M2/uppro state and the bound substrate P1 group in 2Q6G. The substrate peptide (red cartoon) is visible at the top of the image. (A) The donut-shaped S1 subpocket is lined by Glu166 (orange), His172 (green), His163 (not visible), Ser139 (blue), Phe140 (blue), Leu141 (blue), Asn142 (coral), and the substrate P3 side chain (yellow). The P1 Gln side chain (pink) occupies the “donut hole”, with the open side serving as a solvent-accessible cavity for the Gln amide, thereby reducing the desolvation cost of this group. Many of the residues lining the S1 subpocket play dual roles: The backbone of Glu166 H-bonds with the substrate P3 backbone (thereby directly connecting the β-sheet formed by the substrate and β-hairpin to the subpocket), and Asn142 serves as the gatekeeper of the subpocket. Tyr118 (zone 3) H-bonds with the backbone NH and O of Ser139, and Tyr126 (zone 3) H-bonds with the backbone O of Phe140. (B) Same as A, except showing the solvent-accessible surface lining the S1 subpocket (noting that the subpocket entrance is occluded by Asn142 and the substrate P3 group). (C) Same as B, except showing the rear side of the S1 subpocket.
(1) Coupling the m-shaped loop to zone 3 (the backbone groups of Ser139 and Leu141) and zone 2 (Ser139 and Glu290) of the H-bond network, thereby destabilizing M1/downpro in the dimeric state.
(2) Closing the S1 subpocket via the crest B down → crest B up transition, which repositions the Asn142 gatekeeper over the subpocket. We postulate that the desolvation cost of the polar amide group of the P1 Gln side chain is reduced via this mechanism, such that the side chain binds with its solvation partially intact (noting that the S1 subpocket is fully open in the M1/downpro state (Figure 23), whereas the side of the subpocket remains open in the 2·M2/up state (Figure 24). Furthermore, the S1 subpocket appears to be coupled to channel 1 within the domain {1–2}–3 interface (see above).
(3) Orienting the scissile bond toward the attacking Cys145 side chain.
Access to the S1 subpocket is blocked by Asn142 in the extended conformation of the m-shaped loop in the M2/uppro state (Figure 24A), which is pointed away from the subpocket in the 310 helical M1/down state (Figure 23A). As such, we postulate that substrates bind to the M1/downpro state, which then rotates about the domain 2–3 linker into the substrate-stabilized2·M2/up state, followed by dimerization.
Dimer Interface
Dimerization is widely assumed to govern both the activation and substrate complementarity of Mpro.36 The dimer interface bridges the H-bond networks within the individual subunits via their NTL chains (Figure 25). Deletion of the NTL results in an alternate tail–tail dimer interface about domain 3 of the member subunits.37
Figure 25.
(A) Stereo view of the dimer interface of CoV Mpro (2Q6G), with the individual subunits shown in red and green. Zoomed out view of the circuitlike H-bond network sandwiched between the NTLs of each subunit and bridging across the networks of the individual subunits. (B) Same as A, except zoomed in to the intersubunit region, showing the circuitlike H-bond network comprised of Arg4 and Lys5 of the NTL, together with intramonomer Glu290 and Ser139. The native dimer interface is thus part of a global network of residues that play key roles in the conformational dynamics of the protein. (C) Same as B, except for CoV-2 Mpro in 6M03, noting the relatively high B-factors of the residues in this network, which are somewhat higher than those in 2Q6G.
The Putative Hydropowered Dimerization Mechanism
We used WATMD to explore dimerization of substrate-bound M2/uppro (2Q6G) (i.e., M2/down + M2/downpro → 2·M2/up), which we postulate is driven by mutual desolvation of the monomeric subunits in and around their NTL regions. Expulsion of solvating water during dimerization is expected in regions where the side chain/backbone atoms of each subunit overlap with the solvation structure of the opposite subunit. We calculated the solvation properties of subunit A (the reference subunit) of the time-averaged 2Q6G structure in and around the NTL region. We then overlaid subunit B and examined the overlaps between the atoms of subunit B and the occupied voxels of subunit A (Figure 26A). The results demonstrate high complementarity between the HOVs and ULOVs of subunit A and the NTL of subunit B (and vice versa), consistent with the expulsion of H-bond depleted water during dimerization (noting that the dimerization Kd is lower in the substrate-bound than the empty dimer,38,39 suggesting that the substrate plays a key role in determining the solvation properties of the dimer interface). We then calculated the solvation structure of the dimer (2Q6G), which corresponds to the residual solvation within the postdimerization interface (Figure 26B).
Figure 26.
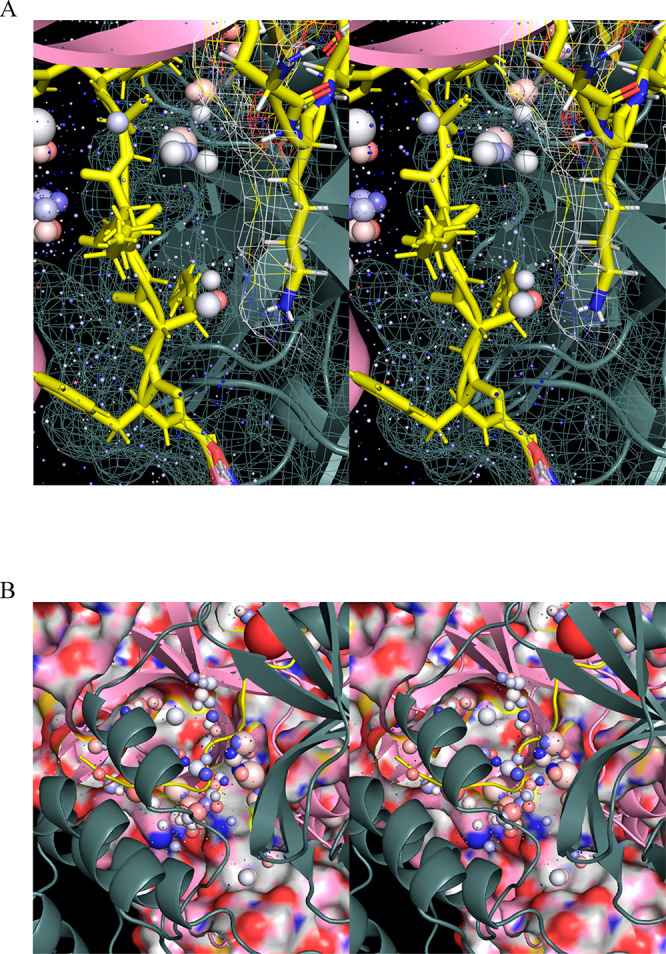
Stereo views of the WATMD-calculated solvation structure within the dimerization interface of M2/uppro (2Q6G) with the NTLs of both subunits highlighted in yellow. (A) ULOVs and HOVs surrounding subunit A (pink), together with the overlapping regions of subunit B (gray). The corresponding H-bond depleted solvation is mutually expelled by subunits A and B during dimerization. Few overlaps exist between subunit B and the HOVs of subunit A. (B) Dimer interface in postdimerized apo M2/up (6M03). Residual H-bond depleted solvation in the interface is counterbalanced by H-bond enriched solvation that is absent in the monomeric form of the protein.
The Putative Hydropowered Substrate/Inhibitor Binding Mechanism
We calculated the solvation structures in and around the AS of apo M1/downpro (2QCY; Figure 27A,B), substrate-bound 2·M2/up (2Q6G; Figure 27C), and apo 2·M2/uppro in 6M03 (Figure 27D) using WATMD. We aligned (rather than docked) the substrate- and inhibitor-bound complexes included in our study (2Q6G, 6XHM, 6WNP, 6LU7, and 4MDS) to the time-averaged monomeric M1/down structure, and extracted the ligands. We then characterized the degree of complementarity between the overlaid ligand groups and voxel occupancies and H-bond donor/acceptor preferences. We assume that the core solvation structure of the apo form is comparable to that of the induced fit forms present in the substrate- and inhibitor-bound protein structures, which is borne out by the excellent observed qualitative overlaps between polar substrate and inhibitor groups and HOVs in the aligned structures (keeping in mind that HOVs are fuzzy representations of the occupying water due to dynamic H-bond rearrangeability among the donors/acceptors in the local protein environment, and the exchangeability of water molecules with bulk solvent). The results are summarized below (close-up views with detailed voxel overlap information for the substrate and inhibitors are provided, as noted in the Supporting Information).
Figure 27.
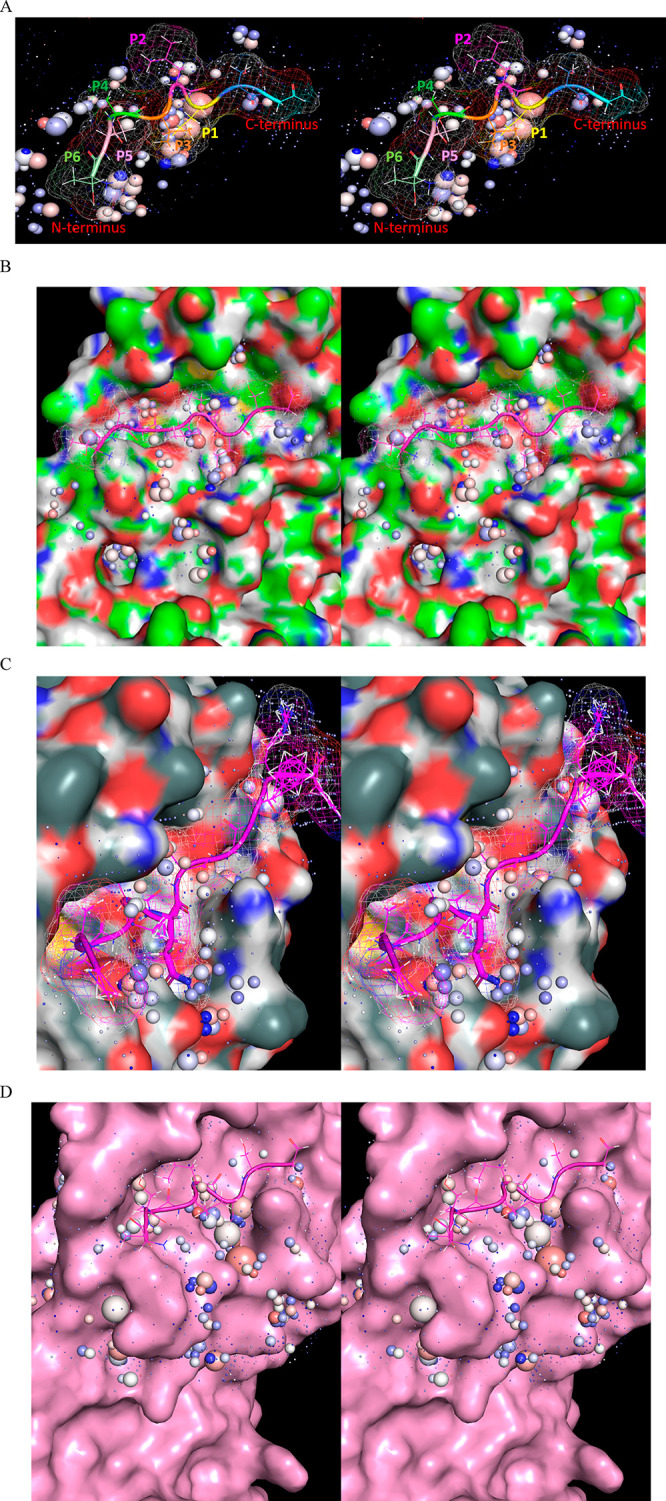
Stereo views of the solvation structures in the AS of apo CoV (2QCY) and CoV-2 (6M03) and substrate-bound (2Q6G) Mpro. (A) Substrate (the P2′ to P6 residues) extracted from 2Q6G overlaid on the time-averaged structure and solvation structure of apo M1/downpro state (2QCY). (B) Crystallized substrate (shown with a mesh surface) extracted from 2Q6G overlaid on the surface of 2QCY (color-coded by element). Entrance 1 to channel 1 within the domain {1–2}–3 interface is visible below the β-hairpin loop in the AS. (C) Residual WATMD voxels present in the substrate-bound 2·M2/up state (2Q6G). (D) Substrate extracted from 2Q6G overlaid on the time-averaged structure and solvation structure of the apo 2·M2/uppro state (6M03). The S1 subpocket in the apo 2·M2/up state is solvated by water exhibiting significantly greater H-bond enrichment compared with that in the M1/downpro state shown in B (denoted by white and light red spheres). Unfavorable expulsion of this water is predicted to slow binding between the AS and substrates/inhibitors in this state (consistent with our hypothesis).
Substrate-Solvation Structure Complementarity (Figures S1–S5)
Recognition of Mpro substrates depends largely on gatekeeper HOVs located within the backbone binding region and S1 subpocket (Figure 27A,B), which binds the fully conserved Gln (Table 3). Our results suggest that the Mpro solvation structure, together with the size/shape of the AS, equate to the lowest common denominator of solvation complementarity/recognition among the twelve nsp substrates of Mpro (namely, P1 Gln and P2 Leu), and further suggest that this sequence is possibly rare throughout both the viral and host genomes. Activation of the catalytic His in NS3 protease has been attributed to P2 Leu-induced desolvation of the S2 subpocket14 (noting that this side chain overlaps unfavorably with a HOV cluster at this position in Mpro). The polar environments of the HOVs located in the S4 subpocket and beyond (many of which exhibit more moderate water occupancy) likely lower the desolvation cost of substrates containing polar side chains at these positions (noting the existence of unfavorable overlaps with the P4 side chain of the crystallized substrate). Conversely, numerous ULOVs reside throughout the envelope of the overlaid substrate (Figure 27A,B). We calculated the voxel occupancies in the time-averaged substrate-bound 2·M2/uppro crystal structure (2Q6G), representing the residual nonexpelled solvation in the bound state (Figure 27C). The results suggest that the solvation corresponding to many of the HOVs residing within the substrate envelope is expelled (possibly unfavorably) during association. However, in the absence of quantitative solvation free energy predictions, the absolute magnitude of such energy losses cannot be determined.
Table 3. Putative Cleavage Sequences of Mpro Substrates40.
| nsp | cleavage sequence (P6–P1) |
|---|---|
| 5 | SGVTFQ |
| 6 | KVATVQ |
| 7 | NRATLQ |
| 8 | SAVKLQ |
| 9 | ATVRLQ |
| 10 | REPMLQ |
| 11 | |
| 12 | PHTVLQ |
| 13 | NVATLQ |
| 14 | TFTRLQ |
| 15 | FYPKLQ |
| 16 |
The solvation structure of the apo 2·M2/uppro state (6M03) is shown in Figure 27D. The HOVs within the S1 subpocket are considerably larger than those in the M1/down structure, suggesting that Gln-induced expulsion of the corresponding solvation in 2·M2/uppro is potentially hampered (i.e., k1 is slowed) in this state (consistent with our hypothesis that substrate binding is limited to the M1/down state). A possible connection between these larger HOVs and the open buried water channel adjacent to the m-shaped loop in the dimeric protein is conceivable.
Inhibitor-Solvation Structure Complementarity
Next, we sampled the complementarity between the protein and solvation structures in the M1/downpro state (2QCY) and four representative inhibitors (Table 1). Substrates and covalent inhibitors are assumed to interact initially with this state (i.e., prior to induced-fit conformational changes). All of the inhibitors overlap with a subset of ULOVs to varying degrees, which putatively slows koff in proportion to the resolvation costs at those positions during dissociation of the bound complex. However, the inhibitors exhibit variable degrees of complementarity with the HOVs in each subpocket, which putatively speeds or slows kon in proportion to the desolvation costs at those positions during association. Both potency and the observed B-factors of the crystallized inhibitors (Figure 28A) can be explained qualitatively in terms of favorable and unfavorable complementarity between overlapping inhibitor groups and ULOVs and HOVs.
Figure 28.
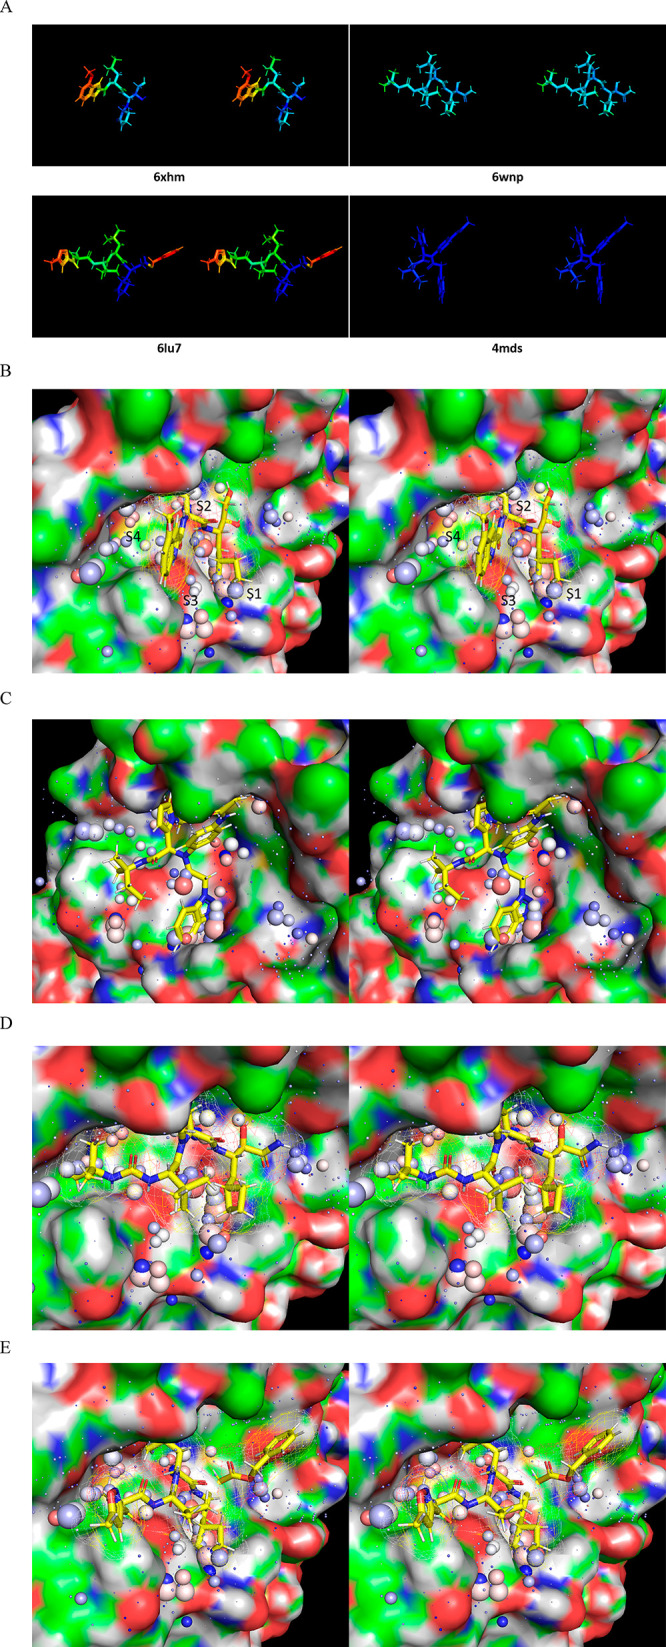
Stereo views of four representative crystallized inhibitors overlaid on the time-averaged M1/downpro structure (2QCY) and the solvation structure thereof calculated using WATMD. ULOVs are distributed diffusely across the S1′ through S4 subpockets, each of which additionally contain clusters of HOVs representing one or two water molecules per cluster (noting that the sphere sizes are proportional to occupancy, rather than the spatial expanse of the voxels). Inhibitor-solvation structure complementarity assessment is based on overlaps between polar/nonpolar inhibitor R-groups and ULOVs, together with overlaps between polar/nonpolar R-groups and HOVs (acceptors with red to pink HOVs; donors with blue to light blue HOVs; and no overlaps between HOVs and nonpolar groups). Complementarity between the inhibitor R-groups and HOVs is outlined in the text and Supporting Information. (A) B-factors of the crystallized inhibitors bound to Mpro. (B) 6XHM/PF00835321 (Ki = 0.27 nM).29 (C) 4MDS/SID 24808289 (IC50 = 6.2 μM, noting the existence of a 51 nM analog 17a).30 (D) 6WNP/boceprevir (IC50 = 8 μM).41 (E) 6LU7/N3 (IC50 = 125 μM).26
PF00835321 (Figures 28B and S2): Favorable overlaps between HOVs and polar groups of PF00835321 include the cyclic amide (a Gln mimetic) located in the S1 subpocket the and amide O in the S3 subpocket (corresponding to the backbone O of the substrate P3). Unfavorable overlaps between HOVs and nonpolar groups are largely avoided (in the S4 subpocket, in particular), with the exception of the S2 subpocket, which contains lower occupancy HOVs. These findings are consistent with the high measured potency of this inhibitor (fast kon and slow koff are predicted).
SID 24808289 (Figures 28C and S3): Favorable overlaps between HOVs and polar groups of SID 24808289, include the benzotriazole ring in the S1 subpocket, amide O in the S3 subpocket (similar to PF00835321), and amide O in the S4 subpocket (corresponding to the substrate P4 backbone O). The isopentyl group overlaps unfavorably with HOVs in the S3 subpocket. These findings are likewise consistent with the high measured potency of analog 17a of this inhibitor30 (faster kon and slower koff are predicted).
Boceprevir (Figures 28D and S4): The urea NH of boceprevir overlaps favorably with a HOV in the S4 subpocket (corresponding to the P4 backbone O). However, multiple mismatches are present between nonpolar groups of this inhibitor and HOVs in the S1 (most critically), S2, and S4 subpockets. These findings are consistent with the lower measured potency of this inhibitor (slow kon is predicted).
N3 (Figures 28E and S5): The amide NH of N3 overlaps favorably with a HOV in the S4 subpocket (corresponding to the P4 backbone O). However, unfavorable overlaps are present between nonpolar groups of N3 and HOVs in the S2 and S4 subpockets. These findings are likewise consistent with the low measured potency of this inhibitor (slow kon is predicted).
Nonequilibrium Perspective on Mpro Catalysis and Inhibition
Enzyme kinetics are typically measured and analyzed under the assumption that the rate of enzyme–substrate complex formation and turnover are equivalent (the steady state assumption). However, this assumption need not apply under native cellular conditions, in which the enzyme and substrate concentrations vary over time, and the rate of enzyme–substrate complex formation is necessarily described using ordinary differential equations (ODEs) of the form:
| 1 |
where ES denotes the enzyme–substrate
complex, and k1, k–1, and kcat denote the
association, dissociation, and turnover rates, respectively. At constant
free enzyme and substrate concentrations, eq 3 reduces to KM =  and the Michaelis–Menten equation.
The rate of Mpro catalysis depends on several contributions
governing the enzyme and substrate concentrations (polyprotein expression,
possible Mpro degradation, M1/downpro ↔ 2·M2/up transitioning, substrate
binding, and dimerization), which is described by the following set
of coupled ODEs corresponding to the reaction scheme summarized in Figure 29:
| 2a |
where kexp and kdeg are the rates of monomer synthesis and monomer degradation, respectively (assuming the possible existence of one or more protein degradation pathways).
| 2b |
where kb(1) and k–b(1) are the rates of rocking between the two domain 3 positions in the free Mpro monomer.
 |
2c |
| 2d |
where k1(1) and k–1(1) are the rates of substrate–Mpro association and dissociation, respectively, and kb(2) and kb(−2) are the rocking rates between the domain 3 positions 1 and 2 in the substrate-bound Mpro monomer.
 |
2e |
where product 1 is the hydrolyzed C-terminal product, kon(1), koff(1), and kcat(1) are the rates of dimerization, dimer–substrate dissociation, and turnover, respectively
| 2f |
where 2·(M2/uppro∼thioester) is the thioester adduct, which is equal to the rate of product 1 generation.
| 2g |
where product 2 is the hydrolyzed C-terminal product, and kcat(2) is the turnover rate constant for thioester adduct decay (where the functional unit is dimeric).
Figure 29.
Proposed Mpro reaction scheme, including substrate binding, domain 3/m-shaped loop rearrangement, dimerization, turnover, and leaving group dissociation steps (the rate constants are defined in the text).
Under nonequilibrium conditions, the catalytic efficiency of Mprodepends on synchronous dimerization, substrate binding, and turnover, where the following are true:
-
(1)
The substrate–M2/uppro association rate approaches the turnover rate (k1(1) ≳ kcat). The slowest binding step is otherwise rate-determining.
-
(2)
The lifetime of the 2·(M2/uppro∼substrate) dimer approaches the reaction time constant (1/koff(1) < 1/kcat). Turnover is disrupted when the dimer and/or bound substrate dissociate prior to product formation (noting that Kd is agnostic to binding partner exchanges, whereas enzyme-mediated turnover is not).5
| 3a |
where kon(2) and koff(2) are the inhibitor association and dissociation constants, respectively. We assume that inhibitors bind to the 310 helical state of the m-shaped loop.
| 3b |
where k1(3) and k–1(3) are the unreacted inhibitor–Mpro association and dissociation constants, respectively.
| 3c |
where kb(3) and k–b(3) are the rates of rocking between the two domain 3 positions in the inhibitor-bound Mpro monomer.
 |
3d |
where kon(3), koff(3), and kcat(3) are the rates of M2/downpro∼inhibitor association, dissociation, and adduct formation, respectively, and krev is the rate of adduct hydrolysis (noting that dimer dissociation is expected upon adduct hydrolysis).
 |
3e |
where k1(4), k–1(4), and kcat(4) are the rates of inhibitor–Mpro association, dissociation, and adduct formation, respectively, and kon(4) and koff(4) are the dimerization and dimer dissociation rates, respectively (noting that slow dimer dissociation may result in the presence of irreversible adduct formation).
The solution to the above set of coupled ODEs consists of a time-dependent exponential function, commensurate with rapid growth in polyprotein processing and virion production over time. However, implementation of this model leads to a catch-22, in which experimental parameter measurement and analysis depend on the assumed kinetics model, and vice versa. The enzyme kinetics data reported for SARS-CoV-2 Mpro is out of line with respect to that of other known enzymes,42 as follows:
-
(1)
KM ranges between 189.5 and 228.4 μM for three model substrates43 (consistent with other reported values),36,44,45 compared with the median KM of 130 μM reported for 5194 enzymes.
-
(2)
kcat ranges between 0.05 and 0.178 s–1, compared with the median kcat of 13.7 s–1 reported for 1942 enzymes. Slow turnover by CoV 3CLpro has been attributed to slow hydrolysis of the acyl adduct (reaction step 2), rather than slow proton abstraction or TI formation (reaction step 1).20
-
(3)
kcat/KM ranges between 219 and 859 M–1 s–1, compared with the median kcat/KM of 125 × 103 reported for 1882 enzymes. The kcat/KM equates to unrealistically slow processing throughput (e.g., ∼1 mM of substrate is needed to achieve an overall processing rate of 1 s–1, compared with 8 μM at the median kcat/KM).
The above discrepancies may result from neglect of the substrate and dimerization contributions to Mpro activation, in which case, data analysis cannot be based simply on fixed concentrations of the enzyme and substrates. Our model suggests that the dimerization Kd differs between the substrate-bound and unbound states, which is consistent with the Kdvalues of 0.8 and 2 μM reported by Cheng et al. for substrate-bound and unbound CoV Mpro, respectively.(39) Graziano et al. reported a somewhat higher dimerization Kd for the unbound form (ranging between ∼5 and 7 μM) based on three orthogonal measurement techniques.38 Dimer buildup is a nonequilibrium process under in vivo conditions due to the time-dependence of the total Mpro and polyprotein concentrations resulting from first-order autocleavage; furthermore, the monomer–dimer–substrate distribution is highly nonlinear due to the three-way relationship among the participating species. We calculated the equilibrium dimer concentration as a function of substrate-independent free monomer concentration in multiples of Kd = 5 and 0.8 μM (Table 4). The results suggest that the substrate-independent fractional dimer concentration increases slowly as a function of the total Mpro concentration (i.e., dimer + monomer). A large fraction of monomer is present at physiologically meaningful total Mpro concentrations (which we assume to be ≪ 5 μM) in the absence of substrates, which is tipped toward the dimer in the presence of substrates (e.g., ≪ 50% dimer at concentrations ≪ 5 μM versus 50% at 800 nM).
Table 4. Equilibrium Dimer Fraction and Concentration as a Function of Substrate-Independent and -Dependent Monomer Concentrations in Multiples of Kda.
| Kd (μM) | [monomer] (μM) | dimer fraction | [dimer] (μM) | monomer fraction | [monomer] (μM) |
|---|---|---|---|---|---|
| Unbound | |||||
| 5.0 | 1·Kd = 5.0 | 0.5 | 2.5 | 0.5 | 2.5 |
| 5.0 | 2·Kd = 10.0 | 0.67 | 6.7 | 0.33 | 3.3 |
| 5.0 | 3·Kd = 15.0 | 0.75 | 11.25 | 0.25 | 3.75 |
| 5.0 | 10·Kd = 50.0 | 0.91 | 45.5 | 0.09 | 4.5 |
| Substrate-Bound | |||||
| 0.8 | 1·Kd = 0.8 | 0.5 | 0.4 | 0.5 | 0.4 |
| 0.8 | 2·Kd = 1.6 | 0.67 | 1.07 | 0.33 | 0.53 |
| 0.8 | 3·Kd = 2.4 | 0.75 | 1.8 | 0.25 | 0.6 |
| 0.8 | 10·Kd = 8.0 | 0.91 | 7.28 | 0.09 | 0.72 |
Based on the Hill approximation.
A similar activation mechanism for caspase-1 was reported by Datta et al., in which a 20-fold increase in the dimer/monomer ratio was observed in the presence of substrate (corresponding to a 10-fold increase in the kcat/KM), compared with a 2.5- and 9-fold increase in the dimer/monomer ratio with Mpro at the Kd values listed respectively in Table 4.46
Discussion
The primary aim of early/preclinical drug discovery consists of predicting efficacious/nontoxic chemical entities via a combination of experimental and in silico data modeling techniques. Whereas drug discovery is predicated on equilibrium drug-target/off-target structure-free energy relationships (expressed as nKd or nIC50, where n is a scaling factor between the drug concentration at 50% occupancy versus that at the efficacious occupancy), cellular function and pharmacodynamics in the in vivo setting depend on nonequilibrium structure-kinetics relationships, in which the concentrations of target/off-target, endogenous cognate partner(s), and drug vary over time. The equilibrium and nonequilibrium regimes rarely converge, due in no small measure to the fact that free energy, occupancy, and concentration/exposure are frequently disconnected between the in vitro and in vivo settings (noting that the relationship between ΔG and −RT·ln(Kd) applies solely at fixed species concentrations and that the occupancy–concentration relationship is underestimated by the Hill and Michaelis–Menten equations). In the absence of theoretical principles on which to base drug-target occupancy predictions under in vivo conditions, drug discovery is relegated to a stepwise trial-and-error process centered on empirical approaches and data fitting techniques (i.e., inductive reasoning). We proposed in our previous work the following:
-
(1)
Optimal dynamic drug-target occupancy depends first and foremost on the drug-target association rate constant (kon, k1), and that the kon of many marketed drugs is fast, even when the koff is slow (if the train is missed, it matters not how long the trip).1
-
(2)
ΔGassociation⧧ and ΔGdissociation are contributed largely by H-bond depleted/trapped and enriched solvation,3,47−50 and that achieving high dynamic occupancy depends on optimal desolvation of this water.
Here, we propose the following:
(1) The catalytically important structural transitions in Mpro, which are powered putatively by potential energy stored in unfavorable H-bond depleted/trapped solvation (rather than protein structure per se).
(2) The spatial distribution of solvation free energy (which we refer to as the “solvation structure”) across the AS and domain {1–2}–3 and dimer interfaces. In principle, optimal ligand structures can be inferred from computed solvation structures consisting of voxel occupancies and donor/acceptor preferences, so as to maximize and minimize resolvation and desolvation costs to/from enriched (“gatekeeper”) and depleted protein surface positions represented by exposed HOVs and UHOVs; and exposed or trapped ULOVs and trapped UHOVs, respectively.
(3) The specific mechanisms by which solvation free energy is stored and released cyclically by intra- and intermolecular state transitions, including substrate and covalent inhibitor binding.
The time-dependence of all processes in which Mpro participates under native conditions in vivo, including monomer expression and degradation, rearrangement, and solvation free-energy-driven substrate/inhibitor binding are key considerations in inhibitor design. Two nonmutually exclusive Mpro inhibition approaches are conceivable:
(1) Inhibition of Mpro autocleavage in cis: Under this approach, the inhibitor kon must necessarily keep pace with the rate of polyprotein synthesis and remain bound throughout the protein lifetime. However, this approach is likely nonviable under the likely scenario that the cleavage substrate folds within the AS.
(2) Inhibition of Mpro-mediated polyprotein cleavage in trans: We assume that most covalent inhibitors containing substrate-like P1 groups bind to the monomeric M1/downpro (S1-subpocket-accessible) form of postcleaved Mpro.
From a systems perspective, efficacious Mpro inhibition depends on lowering the active enzyme population below a critical threshold at which downstream processing can no longer proceed, and maintaining this inhibition level over time (noting that Mpro inhibition during the virion production phase may have little impact on disease outcome, given that the ship has already sailed). The validity of the slow reported Mprokcat/KM derived from the Michaelis–Menten approach is questioned by the caspase-1 study46 performed using a dynamic enzyme model (described in the Supporting Information of ref (46)), suggesting the need for a similar model in Mpro enzyme studies. Furthermore, inhibitor-induced activation of caspase-1 was observed at suboptimal inhibitor concentrations, which is likewise of potential concern for Mpro.
In our previous work, we demonstrated the high sensitivity of noncovalent dynamic drug occupancy to the rates of binding site buildup and decay (in order of precedence: kon, [drug concentration](t), and koff).1 Efficacious inhibition (i.e., high dynamic occupancy of the AS) at the lowest possible concentration depends on kinetically tuned inhibitor binding, where kon ≈ ki or k1 and koff approaches the protein lifetime or k–1. Fast kon and slow koff depend on high mutual AS-inhibitor complementarity between the solvation structures of both partners, as follows:
(1) The H-bonds of expelled H-bond enriched binding partner solvation are replaced one-for-one by polar inhibitor groups (i.e., H-bond acceptors are matched to water O and H-bond donors are matched to water H). Optimal H-bond replacements are predicted to speed kon toward the diffusion limit, corresponding to the minimum possible ΔGassociation⧧.
(2) H-bond depleted/trapped water molecules are maximally expelled, resulting in large free energy losses during resolvation of the dissociating partners, corresponding to the maximum possible ΔGdissociation⧧.
(3) The absence of additional H-bond depleted solvation and gain of additional H-bond enriched solvation in the bound versus unbound state (which is predicted to slow kon and koff, respectively).
Both covalent and noncovalent Mpro inhibition strategies are being pursued by other laboratories. In the former case, efficacy is assumed to depend on occupancy accumulation, although the rate of accumulation may likewise be important (noting that uninhibited Mpro and its downstream products may result from slow occupancy accumulation due to slow kon and/or kcat). In the latter case, efficacy is assumed to depend on fast kon in relation to the rate of Mpro buildup and/or slow koff (noting that noncovalent inhibitors may likewise accumulate via slow koff, given sufficient expulsion of H-bond depleted solvation). The advantages and limitations of the two strategies can be summarized as follows:
(1) Covalent inhibition depends on delivering the reactive warhead to the catalytic Cys145 in a state-dependent fashion (i.e., M1/downpro) via a noncovalent prereaction step, in which the 2·M2/up state is stabilized (just as for native substrates). Conversely, noncovalent inhibitors could conceivably bind to any Mpro state.
(2) Both classes depend on achieving the fastest possible kon and the slowest possible koff. However, these rates may tip toward slow koff versus fast kon in the case of covalent and noncovalent inhibitors, respectively. Optimization of covalent inhibitors is aimed at both kcat (a necessary but insufficient condition for achieving efficacious Mpro occupancy) and kon. Rapid adduct formation is conceivable based on the general cysteine protease mechanism reported by other workers, where the rate-determining step consists of hydrolysis (step 2) rather than thioester formation (step 1).22 Optimization of noncovalent inhibitors is necessarily aimed at both kon and koff.
The exquisite measured potency of PF00835321 is consistent with fast kon and a fast rate of reaction. The nanomolar potency of analog 17a of SID 24808289 suggests that noncovalent inhibitor occupancy need not be koff-limited, which is consistent with the large number of inhibitor-overlapped ULOVs (Figure 28C), together with the low B-factors of this inhibitor (Figure 28A). Interestingly, the R-groups of both compounds are well-matched to overlapped HOVs (Figure 28B,C), whereas the weaker inhibitors are poorly matched (Figure 28D,E). However, the actual quality of H-bond replacements is difficult to assess quantitatively in the absence of inhibitor kon and koff data.
Less is more when it comes to drugs. Pharmacodynamic and pharmacokinetic behaviors (including solubility and permeability) are governed largely by drug, target binding site, and membrane surface desolvation and resolvation costs, which in turn are governed largely by polar/nonpolar scaffold composition. Balanced polar/nonpolar composition, as prescribed by the Pfizer rule of 5, may be achieved, as follows:
-
(1)
Limiting the polar composition to approximately that needed for replacing the H-bonds of gatekeeper solvation (corresponding to HOVs) in polar environments, thereby minimizing both drug and binding site desolvation costs.
-
(2)
Limiting the nonpolar composition to approximately that needed for expelling H-bond depleted solvation from nonpolar environments (corresponding to ULOVs), thereby maximizing the resolvation costs of the dissociating drug and binding site.
Property imbalances result from mismatches between HOVs and ligand groups, leading to a vicious circle, in which:
-
(1)
Nonpolar group incorporations are needed to overlap additional koff-slowing ULOVs in compensation for inadequate kon
-
(2)
Additional polar group incorporations are needed to rebalance logP, at the cost of increased molecular weight.
Inhibitor–Mpro occupancy may be impacted negatively by the following:
(1) The high entropic cost of binding flexible peptidomimetic inhibitors (reflecting the cost of ordering), which contributes to the association free energy barrier.
(2) The lack of an optimal P1 group, which is expected to slow kon (and likely kcat as well) and speed koff due to higher inhibitor desolvation cost and indirect loss of substrate-induced enzyme activation in the M1/downpro state. The lack of inhibitor–AS solvation complementarity in the S2, S3, and S4 subpockets can result in independent binding/rebinding behavior (“wagging”) of the occupying P2, P3, and P4 groups due to local solvation free energy losses in the affected subpockets (reflected in high inhibitor B-factors of these groups in 6LU7).
(3) Simultaneous overlaps between nonpolar ligand groups, ULOVs, and HOVs represent a tradeoff between slowed koff and slowed kon. Optimization of koff to < the rate of binding site decay at the expense of kon < [the rate of binding site buildup] is typically counterproductive.
Conclusion
We have showed that the dynamic noncovalent intra- and intermolecular rearrangements underlying Mpro structure–function, consisting of intramolecular M1/downpro ↔ 2·M2/up state transitions, substrate binding, and dimerization, are powered by interdependent multicorrelated solvation free energy barriers that subserve transient and specific structural responses (a Goldilocks zone of behaviors), including:
-
(1)
Domain 3/position 1-dependent 310 helical m-shaped loop conformation (corresponding to M1/downpro).
-
(2)
Domain 3/position 2-dependent extended m-shaped loop state (corresponding to 2·M2/uppro).
-
(3)
M1/downpro-dependent substrate association to the open S1 subpocket.
-
(4)
Substrate–M2/downpro-dependent dimerization, in which the monomer is stabilized by bound substrate in the dimer compatible conformation and the complex transitions to substrate–2·M2/up
-
(5)
Substrate–2·M2/uppro-dependent catalysis, in which the oxyanion hole is aligned in the crest B up position
We have further demonstrated that solvation free energy is ideally suited for powering the aforementioned rearrangements via counterbalanced, position-/state-specific H-bond enriched and depleted solvation, the desolvation and resolvation of which govern the rates of entry and exit of molecular populations to/from the available enzyme states (including substrate and inhibitor-bound states). Finally, we have challenged the reported enzyme kinetics data for Mpro, in which the enzyme efficiency and inhibitory requirements may be underestimated by the classical Michaelis–Menten approach used in those studies.
Acknowledgments
The authors thank Dr. Andrei Golosov for his important contributions to the WATMD parts of this work and helpful suggestions during the manuscript preparation.
Supporting Information Available
The Supporting Information is available free of charge at https://pubs.acs.org/doi/10.1021/acsptsci.0c00089.
Movie depicting the M1/downpro ↔ 2·M2/up state transition interpolated between PDB structures 2QCY and 2Q6G (MPG)
Close-up views of the active site of monomeric Mpro (PDB structure 2QCY), showing the crystallized substrate and representative inhibitors extracted from dimeric Mpro (PDB structures as noted in the file) overlaid on the WATMD-calculated solvation structure, together with a detailed assessment of ligand-solvation structure complementarity; flip-through animation of the M1/downpro ↔ 2·M2/up state transition for representative structures (PDB structures as noted in the file), depicting the proposed rearrangement of the H-bond network within the domain {1–2}–3 interface (PDF)
The authors declare no competing financial interest.
This article is made available via the ACS COVID-19 subset for unrestricted RESEARCH re-use and analyses in any form or by any means with acknowledgement of the original source. These permissions are granted for the duration of the World Health Organization (WHO) declaration of COVID-19 as a global pandemic.
Supplementary Material
References
- Selvaggio G.; Pearlstein R. A. (2018) Biodynamics: A Novel Quasi-First Principles Theory on the Fundamental Mechanisms of Cellular Function/Dysfunction and the Pharmacological Modulation Thereof. PLoS One 13 (11), e0202376 10.1371/journal.pone.0202376. [DOI] [PMC free article] [PubMed] [Google Scholar]
- Pearlstein R. A.; McKay D. J. J.; Hornak V.; Dickson C.; Golosov A.; Harrison T.; Velez-Vega C.; Duca J. (2017) Building New Bridges between In Vitro and In Vivo in Early Drug Discovery: Where Molecular Modeling Meets Systems Biology. Curr. Top. Med. Chem. 17 (999), 1–1. 10.2174/1568026617666170414152311. [DOI] [PubMed] [Google Scholar]
- Wan H., Selvaggio G., and Pearlstein R. A. (June 9, 2020) Toward in vivo-relevant HERG safety assessment and mitigation strategies based on relationships between non-equilibrium blocker binding, three-dimensional channel-blocker interactions, dynamic occupancy, dynamic exposure, and cellular arrhythmia. bioRxiv (Pharmacology and Toxicology), 2020.06.08.139899, DOI: 10.1101/2020.06.08.139899. [DOI] [PMC free article] [PubMed]
- Van Slyke D. D.; Cullen G. E. (1914) The Mode of Action of Urease and of Enzymes in General. J. Biol. Chem. 19 (2), 141–180. [Google Scholar]
- Kuzmic P. (2009) Application of the Van Slyke-Cullen Irreversible Mechanism in the Analysis of Enzymatic Progress Cu. Anal. Biochem. 394, 287–289. 10.1016/j.ab.2009.06.040. [DOI] [PubMed] [Google Scholar]
- Krichel B.; Falke S.; Hilgenfeld R.; Redecke L.; Uetrecht C. (2020) Processing of the SARS-CoV Pp1a/Ab Nsp7–10 Region. Biochem. J. 477, 1009. 10.1042/BCJ20200029. [DOI] [PMC free article] [PubMed] [Google Scholar]
- Astuti I.; Ysrafil (2020) Severe Acute Respiratory Syndrome Coronavirus 2 (SARS-CoV-2): An Overview of Viral Structure and Host Response. Diabetes Metab. Syndr. Clin. Res. Rev. 14 (4), 407–412. 10.1016/j.dsx.2020.04.020. [DOI] [PMC free article] [PubMed] [Google Scholar]
- Knoops K.; Kikkert M.; Van Den Worm S. H. E.; Zevenhoven-Dobbe J. C.; Van Der Meer Y.; Koster A. J.; Mommaas A. M.; Snijder E. J. (2008) SARS-Coronavirus Replication Is Supported by a Reticulovesicular Network of Modified Endoplasmic Reticulum. PLoS Biol. 6, e226. 10.1371/journal.pbio.0060226. [DOI] [PMC free article] [PubMed] [Google Scholar]
- Harak C.; Lohmann V. (2015) Ultrastructure of the Replication Sites of Positive-Strand RNA Viruses. Virology 479–480, 418–433. 10.1016/j.virol.2015.02.029. [DOI] [PMC free article] [PubMed] [Google Scholar]
- Hagemeijer M. C.; Verheije M. H.; Ulasli M.; Shaltiël I. A.; de Vries L. A.; Reggiori F.; Rottier P. J. M.; de Haan C. A. M. (2010) Dynamics of Coronavirus Replication-Transcription Complexes. J. Virol. 84 (4), 2134–2149. 10.1128/JVI.01716-09. [DOI] [PMC free article] [PubMed] [Google Scholar]
- Oudshoorn D.; Rijs K.; Limpens R. W. A. L.; Groen K.; Koster A. J.; Snijder E. J.; Kikkert M.; Bárcena M. (2017) Expression and Cleavage of Middle East Respiratory Syndrome Coronavirus Nsp3–4 Polyprotein Induce the Formation of Double-Membrane Vesicles That Mimic Those Associated with Coronaviral RNA Replication Downloaded From. mBio 8, 1658–1675. 10.1128/mBio.01658-17. [DOI] [PMC free article] [PubMed] [Google Scholar]
- Ng M. L.; Lee J. W. M.; Leong M. L. N.; Ling A. E.; Tan H. C.; Ooi E. E. (2004) Topographic Changes in SARS Coronavirus-Infected Cells during Late Stages of Infection. Emerging Infect. Dis. 10 (11), 1907–1914. 10.3201/eid1011.040195. [DOI] [PMC free article] [PubMed] [Google Scholar]
- Pang Y.-P. (2004) Three-Dimensional Model of a Substrate-Bound SARS Chymotrypsin-Like Cysteine Proteinase Predicted by Multiple Molecular Dynamics Simulations. Proteins: Struct., Funct., Genet. 57, 747. 10.1002/prot.20249. [DOI] [PMC free article] [PubMed] [Google Scholar]
- Barbato G. (2000) Inhibitor Binding Induces Active Site Stabilization of the HCV NS3 Protein Serine Protease Domain. EMBO J. 19 (6), 1195–1206. 10.1093/emboj/19.6.1195. [DOI] [PMC free article] [PubMed] [Google Scholar]
- Velez-Vega C.; McKay D. J. J.; Kurtzman T.; Aravamuthan V.; Pearlstein R. A.; Duca J. S. (2015) Estimation of Solvation Entropy and Enthalpy via Analysis of Water Oxygen-Hydrogen Correlations. J. Chem. Theory Comput. 11 (11), 5090. 10.1021/acs.jctc.5b00439. [DOI] [PMC free article] [PubMed] [Google Scholar]
- Hilgenfeld R.; Anand K.; Mesters J. R.; Rao Z.; Shen X.; Jiang H.; Tan J.; Verschueren K. H. G. (2006) Structure and Dynamics of SARS Coronavirus Main Proteinase (M Pro). In Advances in Experimental Medicine and Biology 581, 585–591. 10.1007/978-0-387-33012-9_106. [DOI] [PMC free article] [PubMed] [Google Scholar]
- Bzówka M.; Mitusińska K.; Raczyńska A.; Samol A.; Tuszyński J. A.; Góra A. (2020) Structural and Evolutionary Analysis Indicate That the Sars-COV-2 Mpro Is a Challenging Target for Small-Molecule Inhibitor Design. Int. J. Mol. Sci. 21 (9), 3099. 10.3390/ijms21093099. [DOI] [PMC free article] [PubMed] [Google Scholar]
- Hilgenfeld R. (2014) From SARS to MERS: Crystallographic Studies on Coronaviral Proteases Enable Antiviral Drug Design. FEBS J. 281 (18), 4085–4096. 10.1111/febs.12936. [DOI] [PMC free article] [PubMed] [Google Scholar]
- Polgar L. (1973) On the Mode of Activation of the Catalytically Essential Sulfhydryl Group of Papain. Eur. J. Biochem. 33, 104–109. 10.1111/j.1432-1033.1973.tb02660.x. [DOI] [PubMed] [Google Scholar]
- Solowiej J.; Thomson J. A.; Ryan K.; Luo C.; He M.; Lou J.; Murray B. W. (2008) Steady-State and Pre-Steady-State Kinetic Evaluation of Severe Acute Respiratory Syndrome Coronavirus (SARS-CoV) 3CLpro Cysteine Protease: Development of an Ion-Pair Model for Catalysis. Biochemistry 47 (8), 2617–2630. 10.1021/bi702107v. [DOI] [PubMed] [Google Scholar]
- Paasche A.; Zipper A.; Schäfer S.; Ziebuhr J.; Schirmeister T.; Engels B. (2014) Evidence for Substrate Binding-Induced Zwitterion Formation in the Catalytic Cys-His Dyad of the SARS-CoV Main Protease. Biochemistry 53 (37), 5930–5946. 10.1021/bi400604t. [DOI] [PubMed] [Google Scholar]
- Polgár L.; Halász P.; Moravcsik E. (1973) On the Reactivity of the Thiol Group of Thiolsubtilisin. Eur. J. Biochem. 39 (2), 421–429. 10.1111/j.1432-1033.1973.tb03140.x. [DOI] [PubMed] [Google Scholar]
- Shi J.; Sivaraman J.; Song J. (2008) Mechanism for Controlling the Dimer-Monomer Switch and Coupling Dimerization to Catalysis of the Severe Acute Respiratory Syndrome Coronavirus 3C-Like Protease. J. Virol. 82 (9), 4620–4629. 10.1128/JVI.02680-07. [DOI] [PMC free article] [PubMed] [Google Scholar]
- Berman H. M. (2000) The Protein Data Bank/Biopython. Nucleic Acids Res. 28 (1), 235–242. 10.1093/nar/28.1.235. [DOI] [PMC free article] [PubMed] [Google Scholar]
- Xue X.; Yu H.; Yang H.; Xue F.; Wu Z.; Shen W.; Li J.; Zhou Z.; Ding Y.; Zhao Q.; Zhang X. C.; Liao M.; Bartlam M.; Rao Z. (2008) Structures of Two Coronavirus Main Proteases: Implications for Substrate Binding and Antiviral Drug Design. J. Virol. 82 (5), 2515–2527. 10.1128/JVI.02114-07. [DOI] [PMC free article] [PubMed] [Google Scholar]
- Jin Z.; Du X.; Xu Y.; Deng Y.; Liu M.; Zhao Y.; Zhang B.; Li X.; Zhang L.; Peng C. (2020) Structure of Mpro from COVID-19 Virus and Discovery of Its Inhibitors. Nature 582, 289. 10.1038/s41586-020-2223-y. [DOI] [PubMed] [Google Scholar]
- Tsukada H.; Blow D. M. (1985) Structure of Alpha-Chymotrypsin Refined at 1.68 A Resolution. J. Mol. Biol. 184, 703–711. 10.1016/0022-2836(85)90314-6. [DOI] [PubMed] [Google Scholar]
- Jiang Y.; Andrews S. W.; Condroski K. R.; Buckman B.; Serebryany V.; Wenglowsky S.; Kennedy A. L.; Madduru M. R.; Wang B.; Lyon M.; Doherty G. A.; Woodard B. T.; Lemieux C.; Do M. G.; Zhang H.; Ballard J.; Vigers G.; Brandhuber B. J.; Stengel P.; Josey J. A.; Beigelman L.; Blatt L.; Seiwert S. D. (2014) Discovery of Danoprevir (ITMN-191/R7227), a Highly Selective and Potent Inhibitor of Hepatitis C Virus (HCV) NS3/4A Protease. J. Med. Chem. 57 (5), 1753–1769. 10.1021/jm400164c. [DOI] [PubMed] [Google Scholar]
- Boras B., Jones R. M., Anson B. J., Arenson D., Aschenbrenner L., Bakowski M. A., Beutler N., Binder J., Chen E., and Eng H.. et al. (September 13, 2020) Discovery of a Novel Inhibitor of Coronavirus 3CL Protease as a Clinical Candidate for the Potential Treatment of COVID-19. bioRxiv (Pharmacology and Toxicology), 2020.09.12.293498, DOI: 10.1101/2020.09.12.293498.
- Turlington M.; Chun A.; Tomar S.; Eggler A.; Grum-Tokars V.; Jacobs J.; Daniels J. S.; Dawson E.; Saldanha A.; Chase P.; Baez-Santos Y. M.; Lindsley C. W.; Hodder P.; Mesecar A. D.; Stauffer S. R. (2013) Discovery of N-(Benzo[1,2,3]Triazol-1-Yl)-N-(Benzyl)Acetamido)Phenyl) Carboxamides as Severe Acute Respiratory Syndrome Coronavirus (SARS-CoV) 3CLpro Inhibitors: Identification of ML300 and Noncovalent Nanomolar Inhibitors with an Induced-Fit Binding. Bioorg. Med. Chem. Lett. 23 (22), 6172–6177. 10.1016/j.bmcl.2013.08.112. [DOI] [PMC free article] [PubMed] [Google Scholar]
- Velez-Vega C.; McKay D. J. J.; Aravamuthan V.; Pearlstein R.; Duca J. S. (2014) Time-Averaged Distributions of Solute and Solvent Motions: Exploring Proton Wires of GFP and PfM2DH. J. Chem. Inf. Model. 54 (12), 3344. 10.1021/ci500571h. [DOI] [PubMed] [Google Scholar]
- Maier J. A.; Martinez C.; Kasavajhala K.; Wickstrom L.; Hauser K. E.; Simmerling C. (2015) Ff14SB: Improving the Accuracy of Protein Side Chain and Backbone Parameters from Ff99SB. J. Chem. Theory Comput. 11 (8), 3696–3713. 10.1021/acs.jctc.5b00255. [DOI] [PMC free article] [PubMed] [Google Scholar]
- Yang H.; Yang M.; Ding Y.; Liu Y.; Lou Z.; Zhou Z.; Sun L.; Mo L.; Ye S.; Pang H.; Gao G. F.; Anand K.; Bartlam M.; Hilgenfeld R.; Rao Z. (2003) The Crystal Structures of Severe Acute Respiratory Syndrome Virus Main Protease and Its Complex with an Inhibitor. Proc. Natl. Acad. Sci. U. S. A. 100 (23), 13190–13195. 10.1073/pnas.1835675100. [DOI] [PMC free article] [PubMed] [Google Scholar]
- Cheng S. C.; Chang G. G.; Chou C. Y. (2010) Mutation of Glu-166 Blocks the Substrate-Induced Dimerization of SARS Coronavirus Main Protease. Biophys. J. 98 (7), 1327–1336. 10.1016/j.bpj.2009.12.4272. [DOI] [PMC free article] [PubMed] [Google Scholar]
- Chen S.; Jonas F.; Shen C.; Higenfeld R. (2010) Liberation of SARS-CoV Main Protease from the Viral Polyprotein: N-Terminal Autocleavage Does Not Depend on the Mature Dimerization Mode. Protein Cell 1 (1), 59–74. 10.1007/s13238-010-0011-4. [DOI] [PMC free article] [PubMed] [Google Scholar]
- Ho B. L.; Cheng S. C.; Shi L.; Wang T. Y.; Ho K. I.; Chou C. Y. (2015) Critical Assessment of the Important Residues Involved in the Dimerization and Catalysis of MERS Coronavirus Main Protease. PLoS One 10 (12), e0144865. 10.1371/journal.pone.0144865. [DOI] [PMC free article] [PubMed] [Google Scholar]
- Zhong N.; Zhang S.; Zou P.; Chen J.; Kang X.; Li Z.; Liang C.; Jin C.; Xia B. (2008) Without Its N-Finger, the Main Protease of Severe Acute Respiratory Syndrome Coronavirus Can Form a Novel Dimer through Its C-Terminal Domain. J. Virol. 82 (9), 4227–4234. 10.1128/JVI.02612-07. [DOI] [PMC free article] [PubMed] [Google Scholar]
- Graziano V.; McGrath W. J.; Yang L.; Mangel W. F. (2006) SARS CoV Main Proteinase: The Monomer-Dimer Equilibrium Dissociation Constant. Biochemistry 45 (49), 14632–14641. 10.1021/bi061746y. [DOI] [PubMed] [Google Scholar]
- Cheng S. C.; Chang G. G.; Chou C. Y. (2010) Mutation of Glu-166 Blocks the Substrate-Induced Dimerization of SARS Coronavirus Main Protease. Biophys. J. 98 (7), 1327–1336. 10.1016/j.bpj.2009.12.4272. [DOI] [PMC free article] [PubMed] [Google Scholar]
- Yoshimoto F. K. (2020) The Proteins of Severe Acute Respiratory Syndrome Coronavirus-2 (SARS CoV-2 or n-COV19), the Cause of COVID-19. Protein J. 39, 198–216. 10.1007/s10930-020-09901-4. [DOI] [PMC free article] [PubMed] [Google Scholar]
- Fu L.; Ye F.; Feng Y.; Yu F.; Wang Q.; Wu Y.; Zhao C.; Sun H.; Huang B.; Niu P.; Song H.; Shi Y.; Li X.; Tan W.; Qi J.; Gao G. F. (2020) Both Boceprevir and GC376 Efficaciously Inhibit SARS-CoV-2 by Targeting Its Main Protease. Nat. Commun. 11 (1), 1–8. 10.1038/s41467-020-18233-x. [DOI] [PMC free article] [PubMed] [Google Scholar]
- Bar-Even A.; Noor E.; Savir Y.; Liebermeister W.; Davidi D.; Tawfik D. S.; Milo R. (2011) The Moderately Efficient Enzyme: Evolutionary and Physicochemical Trends Shaping Enzyme Parameters. Biochemistry 50 (21), 4402–4410. 10.1021/bi2002289. [DOI] [PubMed] [Google Scholar]
- Rut W., Groborz K., Zhang L., Sun X., Zmudzinski M., Hilgenfeld R., and Drag M. (June 8, 2020) Substrate Specificity Profiling of SARS-CoV-2 Mpro Protease Provides Basis for Anti-COVID-19 Drug Design. bioRxiv (Biochemistry), 2020.03.07.981928, DOI: 10.1101/2020.03.07.981928.
- Tomar S.; Johnston M. L.; St. John S. E.; Osswald H. L.; Nyalapatla P. R.; Paul L. N.; Ghosh A. K.; Denison M. R.; Mesecar A. D. (2015) Ligand-Induced Dimerization of Middle East Respiratory Syndrome (MERS) Coronavirus Nsp5 Protease (3CL pro) Implications for Nsp5 Regulation and the Development of Antivirals. J. Biol. Chem. 290, 19403–19422. 10.1074/jbc.M115.651463. [DOI] [PMC free article] [PubMed] [Google Scholar]
- Fan K.; Wei P.; Feng Q.; Chen S.; Huang C.; Ma L.; Lai B.; Pei J.; Liu Y.; Chen J.; Lai L. (2004) Biosynthesis, Purification, and Substrate Specificity of Severe Acute Respiratory Syndrome Coronavirus 3C-like Proteinase. J. Biol. Chem. 279 (3), 1637–1642. 10.1074/jbc.M310875200. [DOI] [PMC free article] [PubMed] [Google Scholar]
- Datta D.; McClendon C. L.; Jacobson M. P.; Wells J. A. (2013) Substrate and Inhibitor-Induced Dimerization and Cooperativity in Caspase-1 but Not Caspase-3. J. Biol. Chem. 288 (14), 9971–9981. 10.1074/jbc.M112.426460. [DOI] [PMC free article] [PubMed] [Google Scholar]
- Pearlstein R. A.; Sherman W.; Abel R. (2013) Contributions of Water Transfer Energy to Protein-Ligand Association and Dissociation Barriers: Watermap Analysis of a Series of P38α MAP Kinase Inhibitors. Proteins: Struct., Funct., Genet. 81 (9), 1509–1526. 10.1002/prot.24276. [DOI] [PubMed] [Google Scholar]
- Pearlstein R. A.; Hu Q.-Y.; Zhou J.; Yowe D.; Levell J.; Dale B.; Kaushik V. K. V. K. V. K.; Daniels D.; Hanrahan S.; Sherman W.; Abel R. (2010) New Hypotheses about the Structure-Function of Proprotein Convertase Subtilisin/Kexin Type 9: Analysis of the Epidermal Growth Factor-like Repeat A Docking Site Using Watermap. Proteins: Struct., Funct., Genet. 78 (12), 2571–2586. 10.1002/prot.22767. [DOI] [PubMed] [Google Scholar]
- Tran Q. T.; Williams S.; Farid R.; Erdemli G.; Pearlstein R. (2013) The Translocation Kinetics of Antibiotics through Porin OmpC: Insights from Structure-Based Solvation Mapping Using WaterMap. Proteins: Struct., Funct., Genet. 81 (2), 291–299. 10.1002/prot.24185. [DOI] [PubMed] [Google Scholar]
- Tran Q.-T.; Pearlstein R. A.; Williams S.; Reilly J.; Krucker T.; Erdemli G. (2014) Structure-Kinetic Relationship of Carbapenem Antibacterials Permeating through E. Coli OmpC Porin. Proteins: Struct., Funct., Genet. 82 (11), 2998–3012. 10.1002/prot.24659. [DOI] [PubMed] [Google Scholar]
Associated Data
This section collects any data citations, data availability statements, or supplementary materials included in this article.


