

Abstract
Generation of new genetic diversity by crossover (CO) and non-crossover (NCO) is a fundamental process in eukaryotes. Fungi have played critical roles in studying this process because they permit tetrad analysis, which has been used by geneticists for several decades to determine meiotic recombination products. New genetic variations can also be generated in zygotes via illegitimate mutation (IM) and repeat-induced point mutation (RIP). RIP is a genome defense mechanism for preventing harmful expansion of transposable elements or duplicated sequences in filamentous fungi. Although the exact mechanism of RIP is unknown, the C:G to T:A mutations might result from DNA cytosine methylation. A comprehensive approach for understanding the molecular mechanisms underlying these important processes is to perform high-throughput mapping of CO, NCO, RIP and IM in zygotes bearing large numbers of heterozygous variant markers. To this aim, we developed ‘TSETA’, a versatile and user-friendly pipeline that utilizes high-quality and chromosome-level genome sequences involved in a single meiotic event of the industrial workhorse fungus Trichoderma reesei. TSETA not only can be applied to most sexual eukaryotes for genome-wide tetrad analysis, it also outcompetes most currently used methods for calling out single nucleotide polymorphisms between two or more intraspecies strains or isolates.
INTRODUCTION
Meiosis is a specialized cell cycle of sexual eukaryotes by which they undergo two rounds of division (Meiosis I and Meiosis II) to produce haploid gametes from diploid progenitor cells. A hallmark of meiosis is interhomolog recombination, i.e. exchange of genetic materials between homologous chromosomes, generating new genetic variations in the gametes. Tetrad analysis has been used in classical genetic experiments for several decades to determine meiotic recombination products such as crossovers (COs) and non-crossovers (NCOs). COs involve the exchange of flanking markers and possible gene conversion.
Over recent decades, the remarkable progress in next-generation sequencing (NGS) technologies has enabled high-throughput identification of meiotic recombination products bearing large numbers of heterozygous variant markers following hybrid meiosis, including single nucleotide variant (SNV) and insertion/deletion mutation (InDel). For convenience, Indels can be converted into SNVs by filling in hyphen symbols (-) or null (n) spaces. Accordingly, SNVs and Indels are collectively referred to as single nucleotide polymorphisms (SNPs). Accurate calling of SNPs and genotypes from NGS data is an essential prerequisite for genetics studies. However, there are two pitfalls to applying NGS-based platforms for SNP calling and genome-wide mapping of meiotic recombination products. First, due to the short lengths of NGS reads, it is difficult to accurately assemble the nucleotide sequences in chromosome regions hosting repetitive and/or high AT-biased sequences. As a result, the NGS reference genomes used for SNP calling are not only far from complete, but they also possess many unidentified nucleotides and assembly errors (1). Second, most bioinformatic pipelines used for SNP calling [e.g. Mummer4 (2) and or MapCaller (3)] only report SNPs present in the matching sequences but not in chromosomal regions with low or no sequence homology as well as those with repetitive or AT-biased sequences.
Third-generation sequencing (TGS) and mapping technologies have created a renaissance in high-quality genome sequencing. For example, PacBio's single-molecule real-time (SMRT) technology offers two principal advantages over NGS platforms for assessing high-quality and chromosome-level genome sequences: (i) it provides very long sequencing reads, with lengths 100 times longer than those of NGS; and (ii) it can easily cover DNA regions with high GC bias and repetitive sequences, facilitating better variant detection. However, PacBio reads typically have a high error rate (∼15% compared with ∼0.1% for Illumina reads) and, since the single-pass errors are distributed randomly, high sequence coverage can very rapidly wash out the single-pass errors when building consensus sequences (4).
Thanks to TGS technology, the availability of high-quality, near-complete genome sequences provides a new opportunity to improve genome-wide identification of sequence variations with single-nucleotide precision. In this study, we used meiosis of the filamentous workhorse fungus Trichoderma reesei (Teleomorph Hypocrea jecorina) as a model to demonstrate this application of TGS. Zygotes with highly diverse genome sequences are a prerequisite for genome-wide identification of meiotic recombination products. Therefore, we chose two T. reesei wild-isolate strains, QM6a and CBS999.97(MAT1-1), for sexual crossing (1,5-6). QM6a is the ancestor of all currently used cellulase-producing industrial strains (7–10) and it possesses a MAT1–2 mating-type locus (11). CBS999.97(MAT1-1) and CBS999.97(MAT1–2) were derived from two ascospores in a fruiting body of the CBS999.97 wild isolate strain (11). QM6a was originally isolated from one of the Solomon Islands, whereas CBS999.97 was sampled from French Guiana [see review in (9)]. Due to long-term geographic isolation, QM6a and CBS999.97 harbor high levels of sequence variation (6) (Figure 1). Sexual crossing of CBS999.97(MAT1-1) with CBS999.97(MAT1–2) or QM6a readily induces sexual development, resulting in fruiting bodies that contain linear asci each with 16 linearly arranged ascospores (i.e. the sexual spores) (11). The 16 ascospores in each ascus are generated from a meiosis event, followed by two post-meiotic rounds of mitosis (12). Accordingly, the 16 ascospores in each ascus can be classified into four genetically identical groups, with each group containing four ascospores.
Figure 1.
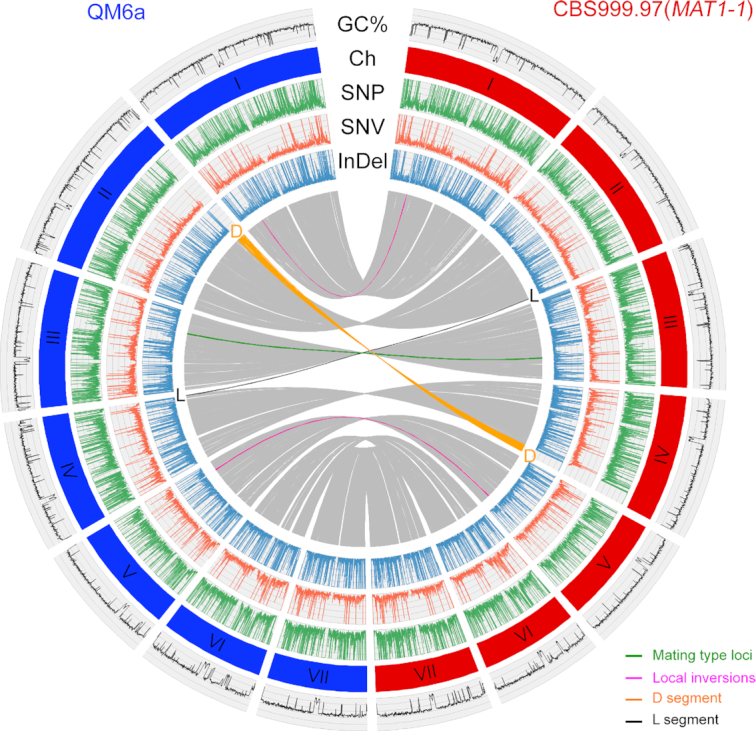
PacBio genome sequencing and assembly of QM6a and CBS999.97(MAT1-1). Collinearity of the QM6a and CBS999.97(MAT1-1) genomes is depicted in the inner circles of the diagrams. The Circos plot shows the synteny of QM6a and CBS999.97(MAT1-1) on the basis of the BLASTN results of chromosome-level nucleotide sequences, with the expect (e) value of 1e-20, >10 kb in length with >95% sequence identity (in gray). The two inversion alleles on ChI and ChV are indicated in magenta, whereas the mating-type loci MAT1-1 and MAT1–2 are in green. The GC contents (window size 5000 bp) of the seven chromosomes are shown in the first outer circle. The second outer circle indicates the seven chromosomes (I–VII) of QM6a (in blue) and CBS999.97(MAT1-1) (in red). The densities of SNP, SNV and InDel (window size 3000 bp) are depicted in the third, fourth and fifth circles, respectively. The D segments in QM6a (586 915 bp) and CBS999.97(MAT1-1) (529 007 bp) are indicated in orange. The L segments in QM6a (41 102 bp) and CBS999.97(MAT1-1) (26 657 bp) are indicated in black. Local inversions are shown in magenta. A reciprocal translocation between the D and L segments had been demonstrated previously by microarray-based comparative genomic hybridization (1) and electrophoretic karyotyping and Southern hybridization (6). D and L represent segmental duplication and loss (12), respectively, because most 16-spore asci (>90%) generated by sexual crosses between QM6a and CBS999.97(MAT1-1) contain four or eight inviable ascospores and an equal number of segmental aneuploid (SAN) ascospores. The viable SAN ascospores contain two D segments but no L segment (12).
We previously established high-quality, near-complete genome sequences of QM6a (1), CBS999.97(MAT1-1) and CBS999.97(MAT1–2) (6) using the PacBio SMRT platform. A hallmark of these three T. reesei genomes (∼34 Mb in size) is the presence of ∼2250 AT-rich blocks each with length ≥500 base pairs (bp) (1,6). These AT-rich blocks might be evolutionary remnants of repeat-induced point mutation (RIP), a genome defense mechanism against transposable elements (TE) that is conserved in many Pezizomycotina fungi. RIP was first discovered in Neurospora crassa. It occurs premeiotically in haploid parental nuclei in preparation for karyogamy and meiosis. RIP detects duplications of chromosomal DNA above a certain length threshold (∼0.4 kbp), leading to C:G to T:A mutations and concomitant DNA cytosine methylation in a pairwise fashion on both strands of each DNA duplex [reviewed in (13–15)]. It has been proposed that these AT-rich blocks might have important functions in fungal-plant interactions, symbiosis, genome evolution (e.g. gene loss, duplication and neofunctionalization), genome organization and transcription (1,16–17).
AT- and repeat-rich blocks in the genomes of some plant pathogenic fungi and oomycetes are gene-sparse compartments that contain fast-evolving and/or virulence-associated genes. In contrast, AT- or repeat-poor compartments are gene-rich and evolutionarily conserved. The mosaic features of the genome architecture in these fungi led to the ‘two-speed genome’ hypothesis (18). Interestingly, recent resequencing efforts using TGS technology have demonstrated that not only do some rapidly evolving phytopathogens lack some key characteristics described by the ‘two-speed genome’ model (19,20), so too do several economically important Trichoderma spp. (our unpublished results). For example, the putative genes encoding virulence-associated proteins or secreted effectors are rarely located in their AT-rich or gene-poor compartments. Thus, further modes of genome organization may exist, likely representing different speeds during genome evolution [see review of (19)].
Nevertheless, these TGS-based resequencing results also reveal the need to develop better bioinformatic tools for accurate and comprehensive analyses of highly mosaic and compartmentalized genomes. Also noteworthy is that high content of AT-rich blocks impedes accurate SNP calling and genome-wide mapping of meiotic recombination products by NGS platforms. To overcome these problems, we isolated the 16 ascospores generated from an ascus produced by sexual crossing of QM6a and CBS999.97(MAT1-1). These ascospores were then germinated and vegetatively propagated into 16 F1 progeny mycelial colonies. After genotyping by genomic polymerase chain reaction (PCR), we isolated high-quality, high-molecular-weight genomic DNA from four representative F1 progeny (i.e. FA, FB, FC and FD) and then applied PacBio's SMRT technology to determine high-quality and chromosome-level genome sequences (6). Here, we further present a highly organized and modular computational framework named TSETA (Third-generation Sequencing to Enable Tetrad Analysis) through which we processed all six TGS-based and near-complete haploid genome sequences. Our results indicate that TSETA is a convenient method for further exploring the basic mechanisms of meiotic recombination, not only in filamentous fungi but also in other sexual eukaryotes.
MATERIALS AND METHODS
Fungi
Fungal growth, culture media, sexual crossing, single ascospore isolation, preparation of high-quality genomic DNA, PacBio SMRT genomic DNA sequencing and assembly were performed as described previously (1,12,21). The Circos program [(http://circos.ca/documentation/tutorials/quick_start/selection_and_scale/; (22)] was used to show synteny and conservation between the genome sequences of QM6a and CBS999.97(MAT1-1).
To isolate the four representative F1 progeny (FA, FB, FC and FD) used in this study, QM6a was sexually crossed with CBS999.97(MAT1-1) to produce fruiting bodies containing asci with 16 linearly arranged ascospores. Next, we applied the yeast tetrad dissection technique to sequentially separate the 16 ascospores from an ascus. Each ascospore was individually germinated and cultured. Genomic PCR genotyping of all 16 ascospores from one hexadecad further confirmed that each hexadecad was classified into four linearly arranged groups and each group contained four genetically indistinguishable ascospores (12). Finally, FA, FB, FC and FD were selected from each of the four linearly arranged groups.
Hardware, operating system and network
The TSETA software package was designed for a desktop or computing server running with x86–64 Linux operating system. Multithreaded processors are preferred to speed up the process since many steps can be configured to use multiple threads in parallel. TSETA was written in JavaScript or ECMAScript. TSETA has two different functional modes: (1) The “SNP" model is a powerful analytic tool for single-nucleotide-resolution comparison of different intraspecies genomes. (2) The “Tetrad" model of TSETA aims for genome-wide identification of genetic variations before and after a single meiotic events, including meiotic recombination products, illegitimate mutations and repeat-induced point mutation. A stable internet connection is required for installation and configuration of TSETA, as well as for retrieving the test data. For a fungal genome of length ∼34 Mb, we recommend having at least 200 Gb and 20 Gb of RAM for TGS-based genome assembly and TSETA analysis, respectively, as well as 10 Gb of free disk space. Definitions of the different genetic markers in the four representative F1 progeny are presented in Table 1. For clarity, IMs were further classified into three different types, i.e. IM1, IM2 and IM3, respectively. A flow chart explaining the steps of the “Tetrad" model of TSETA program is depicted in Figure 2.
Table 1.
Definitions of different genetic markers
| Paternal and maternal genomes | Four representative F1 genomes | ||||||
|---|---|---|---|---|---|---|---|
| QM6a | CBS999.97(MAT1-1) | SNP | FA | FB | FC | FD | Genetic markers |
| C | A | SNVa | A | C | A | C | SNV 2:2 |
| C | A | SNV | A | C | C | A | SNV 2:2 |
| C | A | SNV | C | C | A | A | SNV 2:2 |
| C | A | SNV | A | A | A | C | SNV 3:1/1:3 (NCO) |
| C | A | SNV | A | A | A | A | SNV 4:0 (2NCO) |
| C | A | SNV | A | T | A | T | SNV RIP (Q)d |
| A | C | SNV | A | T | A | T | SNV RIP (C)d |
| C | C | SNV | T | T | T | T | SNV RIP (Q and C)d |
| C | InDelb | T | T | InDel RIP (Q)d | |||
| C | InDel | T | T | InDel RIP (C)d | |||
| C | InDel | C | C | InDel 2:2 | |||
| C | InDel | C | C | InDel 2:2 | |||
| C | InDel | C | C | InDel 2:2 | |||
| C | InDel | C | InDel 1:3 (deletion) | ||||
| C | InDel | InDel 0:4 (deletion) | |||||
| C | InDel | C | C | C | InDel 3:1 (NCO) | ||
| C | InDel | C | C | C | C | InDel 4:0 (2NCO) | |
| C | A | SNV | A | A | C | 1n:3c | |
| C | A | SNV | A | A | 2n:2c | ||
| C | A | SNV | C | 3n:1c | |||
| C | A | SNV | 4n:0c | ||||
| C | A | SNV | A | C | G | C | IM-1e |
| C | A | SNV | A | C | G | T | IM-1e |
| C | InDel | C | G | IM-1e | |||
| C | InDel | T | G | IM-1e | |||
| C | InDel | C | C | G | IM-2f | ||
| C | InDel | C | T | C | G | IM-2f | |
| A | IM-3g | ||||||
| A | G | IM-3g | |||||
| A | A | A | IM-3g | ||||
| A | A | T | G | IM-3g | |||
aSNVs are the positions where neither QM6a nor CBS999.97(MAT1-1) is null.
bInDels are the positions where only QM6a or CBS999.97(MAT1-1) is null.
cFor the 1n:3, 2n:2, 3n:1 and 4n:0 markers, neither QM6a nor CBS999.97(MAT1-1) is null. Moreover, 1n, 2n, 3n and 4n represents the numbers of F1 progeny with a null at the corresponding position, respectively.
dRIP involves C:G-to-T:A transitional mutation in duplicated DNA. RIP (Q) and RIP (C) are QM6a-specific and CBS999.97(MAT1-1)-specific RIP, respectively.
eIM-1 is the position where ≥1 F1 progeny harbors an authentic nucleotide that is different from the two corresponding nucleotides in QM6a and CBS999.97(MAT1-1), respectively. RIP is excluded.
fIM-2 are positions where either QM6a and CBS999.97(MAT1-1) is null, but the corresponding positions contain an authentic nucleotide in ≥3 F1 progeny.
gIM-3 are positions where both QM6a and CBS999.97(MAT1-1) are nulls, but the corresponding positions contain an authentic nucleotide in ≥1 F1 progeny.
Figure 2.

Flow chart depict the BLASTN-guided and sectional MAFFT algorithm in the “Tetrad" mode of TSETA.
Genome-wide methylation profiling
QM6a and CBS999.97(MAT1-1) were inoculated on 90 mm petri-dishes with malt extract agar (MEA) medium at 25°C until full asexual sporulation was observed (∼5 days). Conidial spores were then harvested and inoculated in 5 ml potato dextrose medium (PDB) in a rolling incubator at 30°C for 16 h. The germinated hyphae were harvested for isolation of genomic DNA (1). Bisulfite conversion of the genomic DNA was carried out using the EZ DNA Methylation-Gold™ Kit (Zymo Research, Orange, CA, USA). Unmethylated cl857 Sam7 Lambda DNA (catalog # D1521; Promega, USA) was spiked-in (0.5% w/w) to estimate the bisulfite conversion efficiency. The genomic DNA was then subjected to library preparation using the Accel-NGS Methyl-Seq DNA library kit (catalog # 30024; Swift Bioscience, USA). The libraries were sequenced using a NextSeq 500 sequencing system (Illumina, USA) as described previously (23). BatMeth2, an open source software program (https://github.com/GuoliangLi-HZAU/BatMeth2/) (24), was used for genome-wide DNA methylation calling.
RESULTS
TSETA is a BLASTN-guided and sectional MAFFT program
There are two reasons why it is difficult to directly apply the MAFFT (for Multiple Alignment using Fast Fourier Transform) program (25–27) or other publicly available multiple genome sequence alignment (MGSA) software tools [e.g. Kalign (28)] to achieve accurate and fast MGSA of different T. reesei strains. Firstly, the length (34 Mbp) of the T. reesei genome is relatively large, so it requires quite a lot of computational time and space to complete the task. For example, it took our computing server (with 20 GB of RAM) 4–7 days to apply MAFFT alone for aligning the six homologous chromosomes of QM6a, CBS999.97(MAT1-1), FA, FB, FC and FD, respectively. Secondly, T. reesei contains ∼2250 AT-rich blocks, each of ≥ 500 bp (1,6). These AT-rich blocks are highly homologous to each other, resulting in many false-positive or non-allelic alignment results.
These two technical problems were overcome using TSETA and within ∼20 h. TSETA first employs a GC content (or guanine-cytosine content) calculation algorithm using a window of 500 bp (1). The longest AT-rich blocks in each chromosome are the centromeres, whereas the most 5′ AT-rich block and the most 3′ AT-rich block are likely to be (but not necessarily) the 5′ and 3′ telomeric or subtelomeric sequences (Figure 2A). We reported previously that, except for the left terminus of chromosome VI, all other chromosomal ends in QM6a, CBS999.97(MAT1-1) and CBS999.97(MAT1–2) contain 8–13 telomeric repeats (i.e. TTAGGG at 3′-termini and the reverse complement CCCTAA at 5′-termini) (1,6).
Next, TSETA utilizes a newly invented algorithm to carry out fast and low-cost MGSA by combining the standard nucleotide Basic Local Alignment Search Tool (BLASTN) (29,30) and MAFFT (26,27). Initially, users upload genomic sequences in FASTA format to initiate TSETA. TSETA then applies BLASTN to search and scan local homologous regions in the genomes of QM6a, CBS999.97(MAT1-1), FA, FB, FC and FD, respectively. In brief, the first 10 000 bp of nucleotide sequence at the 5′ terminus of a selected QM6a chromosome was assigned as the seed query to search for ‘best-matched’, ‘allelic’ and ‘non-complementary’ sequences at the 5′ terminus (1–30 000 bp) of the corresponding chromosomes (Figure 2B). If the first BLASTN search fails (i.e. the best-matched sequence is <1000 bp, nonallelic or complementary), the seed QM6a query can be further extended 10 000 bp in the 3′ direction. BLASTN searches are repeated until the best matched allelic sequences can be found in CBS999.97(MAT1-1), FA, FB, FC and FD, respectively (Figure 2B). It is important to note that the seed query often (but not always) contains telomeric and/or subtelomeric sequences. In other words, neither telomeric nor subtelomeric sequence is a prerequisite for this newly invented algorithm for MGSA. This is important because not all chromosomal termini can be completely sequenced and assembled even using TGS technology. Also noteworthy is that sequences with high AT-contents are difficult to align properly using MAFFT alone. Accordingly, TSETA employs a longer subject (i.e. 30 000 bp) to initiate the BLASTN searches.
Next, the seed QM6a query and the five best-matched allelic sequences (along with their 5′ flanking sequences) are compared by MAFFT to identify the smallest Search End (SSE). SSE is the very last identical nucleotide in the seed QM6a query that can find a corresponding allelic nucleotide in all five subjects, i.e. CBS999.97(MAT1-1), FA, FB, FC and FD, respectively. This nucleotide in QM6a is referred to as the ‘Consensus Query End’ or ‘CQE’ (Figure 2B). For the next and all subsequent rounds of BLASTN searching, new QM6a query sequences are sequentially selected from ‘Search Start (SS)’ to ‘Search End (SE)’. SS is equal to ‘CQE + 1 bp’, whereas SE is ‘CQE + 10 000 bp’ or ‘CQE + the remaining unsearched nucleotide sequences’ located at the 3′ terminus of the selected ‘QM6a chromosome’ (Figure 2B).
We found that TSETA was able to accurately align the three inversion alleles on ChI (22,855 bp), ChIII (the MAT1–2 locus 36 490 bp and the MAT1-1 locus 37 189 bp) and ChV (59 633 bp), respectively (Figure 1). The MAT1–2 locus in QM6a contains one gene, mat1–2-1, whereas the MAT1-1 locus in CBS999.97(MAT1-1) has three genes, mat1–1-1, mat1–1-2 and mat1–1-3 (11) (Figure 3). In this case, the corresponding SE had been extended at least three times (i.e. from ‘CQE + 10,000 bp’ to ‘CQE + 40,000 bp’) before a new CQE was revealed by BLASTN.
Figure 3.

Pairwise comparison of the nucleotide sequences within and around the mating-type loci in QM6a and CBS999.97(MAT1-1). The tracks between two strains are color-coded to indicate nucleotide sequence identity. The mating-type genes (mat1–1-1, mat1–1-2, mat1–1-3 and mat1–2-1) are dissimilar in sequence but are found at the same loci on the third chromosomes and flanked by two evolutionarily conserved genes, the DNA lyase apn2 and the complex I intermediate-associated protein 30 gene cia30, respectively. Interestingly, the three mating-type genes (matA-1, matA-2, matA-3) in the MAT-A locus of Neurospora crassa are flanked by apn2 and the cytoskeleton assembly gene sla2.
TSETA enables comprehensive sequence alignment and comparative analyses
Next, MAFFT was applied sequentially to align all allelic sequences resulting from each round of BLASTN searches. We found that nearly all the best-matched allelic sequences had an expect (e) value of ‘0’ throughout the entire BLASTN-guided and sectional MAFFT process, except for centromeres and the large rDNA loci (see below). TSETA then compiles the MGSA results telomere-to-telomere and displays the assembled results on a computer screen (Figures 4 and 5).
Figure 4.

The TSETA Viewer allows easy and intuitive visualization of both meiotic recombination and RIP mutation events on a computer screen at scales ranging from the full-length chromosome landscape (A), 100-fold magnification (B), 5000-fold magnification (C), 50 000-fold magnification to single-nucleotide levels (D). The first two horizontal rows of sequence data represent the full-length sequences of the first chromosomes (ChI) of QM6a (in cyan) and CBS999.97(MAT1-1) (in magenta). The next four horizontal rows of sequence data represent full-length ChI of the four representative F1 progeny, respectively. Nucleotide sequences identical to those of parental QM6a and CBS999.97(MAT1-1) are also indicated in cyan and magenta (A–C) or in pale turquoise and pink (D), respectively. Some nucleotides in the four representative F1 progeny are indicated in gray, because they are identical to the corresponding nucleotides in both QM6a and CBS999.97(MAT1–1), with difficult to assign nucleotides in cyan or magenta, respectively. The gapped (deletion) regions are colored ‘white’. COs are located where 2:2 markers undergo a reciprocal genotype change. The GC tracts associated with a CO event are labeled with ‘red’ bars. The NCO products show either 3:1 or 4:0 segregation. Different genetic markers in F1 (Table 1) are marked by bars in a variety of colors. At the single-nucleotide level, all non-2:2 markers or the 2:2 markers located next to the boundaries of COs are highlighted in ‘cyan’ and ‘magenta’, respectively (D).
Figure 5.

Intuitive visualization of the large rDNA loci. (A) The ChVI chromosomes of QM6a, CBS999.97(MAT1-1) and the representative F1 progeny are shown as described in Figure 4. The large internal deletion (57 946 bp) within the ChVI centromere of the second F1 representative progeny is marked by a vertical black arrow. (B) The large rDNA loci are shown as an array of red arrows, with each red arrow representing an 18S-5.8S-26S rRNA gene cluster.
To make data interpretation easier, all gapped positions in the six chromosomes are automatically filled with a hyphen symbol or null (-). If there is a null (-) in QM6a or CBS999.97(MAT1-1) but not both, the gapped position will be considered as an InDel by TSETA. Some gapped regions have authentic nucleotides in both QM6a and CBS999.97(MAT1-1), but the corresponding positions in the four F1 progeny show 1n:3, 2n:2, 3n:1 or 4n:0 segregation, where 1n, 2n, 3n and 4n represent the numbers of F1 progeny with a null (-) at a selected nucleotide position (Table 1). These four markers (i.e. 1n:3, 2n:2, 3n:1 and 4n:0) are likely due to sequencing or assembly errors rather than non-mendelian segregation. TSETA also identifies and categorizes three different types of IMs (Table 1).
It is also important to note that the original coordination of all nucleotide sequences in the six chromosomes remain labeled by TSETA. Together, these ‘filling-in’ and ‘memory’ functions of TSETA allow users to comprehensively describe the MGSA results during subsequent structural and functional analyses.
Alignment of centromeres and large rDNA loci is problematic
There is an inevitable limitation of the BLASTN-guided and sectional MAFFT algorithm we have proposed here. This approach was unable to accurately align the nucleotide sequences in centromeres and those of large ribosomal DNA (rDNA) because AT- or repeat-rich sequences make up the major part of these two chromosomal regions. As a result, the best-matched sequences resulting from the corresponding BLASTN searches were often non-allelic. Centromeres are the most prominent or longest AT-rich blocks in each chromosome of QM6a and CBS999.97(MAT1-1), ranging from 150 kb up to 290 kb. Due to long-term geographic isolation, the two corresponding centromeres in each chromosome of QM6a and CBS999.97(MAT1-1) also show high levels of intraspecific sequence heterogeneity (6). Moreover, we reported previously that the seven QM6a centromeres collectively harbored 24 conserved sequences (≥90% identity; maximum length 8625 bp and minimum length 4847 bp) with a copy number per chromosome ranging from one to five (1). Interestingly, some of these centromeric sequences share significant sequence homology (∼65% identity and expect values = e−23 to e−35) to Foret1 (for Fusarium oxysporumretroid element), a repeated DNA sequence in the filamentous fungus Fusarium oxysporum. The overall structure of Foret1 is homologous to the ‘gypsy’ class of LTR-retrotransposons (31). Similar sequences have been found not only in all CBS999.97(MAT1-1) centromeres, but also in several other non-centromeric AT-rich blocks in the genomes of QM6a and CBS999.97(MAT1-1) (Li W.C., Liu H.C. and Wang T.F., unpublished results). The large rDNA loci of QM6a and CBS999.97(MAT1-1) reside in the right arm of chromosome ChVI, harboring 9 and 11 tandem ‘head-to-tail’ repeats, respectively. Each repeat (∼7.8 kb) contains an 18S-5.8S-26S rRNA gene cluster and a non-transcribed intergenic spacer (IGS) (1). Collectively, these characteristics explain why we chose a query length of 10 000 bp for each BLASTN search. In general, the shorter the query length, the faster TSETA can complete the task, but with more non-allelic or even ectopic alignment results.
We overcame this difficulty by developing new alignment strategies. In short, the nucleotide sequences of centromeres and the large rDNA locus were automatically extracted via a user-friendly and intuitive input interface. Pairwise BLASTN searching only detected parental alleles, indicating that only two of the four representative F1 progeny inherited the same nucleotide sequences from either the paternal allele or the maternal allele (Figure 4). In other words, their nucleotide sequences are highly similar or even identical to either those in QM6a or those in CBS999.97(MAT1-1). Next, we used a JavaScript program to perform best-matched multiple sequence alignment, gap filling and visualization of the corresponding sequences in either the paternal QM6a genome or the maternal CBS999.97(MAT1-1) genome as well as their two closest F1 successors (Figure 5A). These results are consistent with previous reports that centromeres (32,33) and the large rDNA loci (34) are devoid of reciprocal recombination (crossing-over) between homologous chromosomes. Since the BLASTN-guided and sectional MAFFT algorithm failed to align the nucleotide sequences in QM6a centromeres to those of the corresponding CBS999.97(MAT1-1) centromeres, it is likely that nucleotide sequence heterogeneity between the two corresponding centromeres in QM6a and CBS999.97(MAT1-1) is too high to allow ‘allelic’ homology-directed recombinational repair. TSETA ends up categorizing and displaying centromeres and several longer AT-rich blocks as ‘strain-specific’ or solitary sequences (Figure 5A). As a result, we found no ‘allelic’ NCO or 2NCO within all seven centromeres of the four F1 representative progeny we examined here (Figures 4 and 5). Interestingly, it was reported previously that there are widespread genetic exchanges in maize in the form of gene conversion between CRM2-based centromeric markers (32). CRM2 is a highly enriched retrotransposon in maize centromeres and exhibits very low transposition rates. Since those CRM2-dependent gene conversions were detected by using a PCR-based method called transposon display (32), they might arise from both allelic and non-allelic or even ectopic homology-directed recombinational repair. Thus, we acknowledge that TSETA might lack the capability to detect non-allelic or ectopic gene conversion.
Notably, we observed a large internal deletion (>54 kb) in the ChVI centromere of the second of the representative F1 progeny. It is not clear whether this large internal deletion occurred during meiosis or the two rounds of postmeiotic mitosis. This large internal deletion might also result from incorrect chromosome assembly due to the high AT content and/or the repetitive nature of these sequences (Figure 5).
The copy numbers of the 18S-5.8S-26S rRNA gene cluster in FA, FB, FC or FD were often not completely identical to that of parental QM6a or CBS999.97(MAT1-1), probably due to intrachromosomal or unequal sister chromatid recombination [see review of (35)], nonhomologous end joining (34), as well as IMs, TGS sequencing or genome assembly errors. Accordingly, we incorporated a new function into TSETA to display the large rDNA loci as an array of red arrows. Each red arrow represents a single 18S-5.8S-26S rRNA gene cluster (Figure 5B). There might be some gene conversion events between the large rDNA loci of FA, FB, FC and FD (Figure 5B), but almost all these gene conversions are associated with the InDel genetic markers, including InDel 0:4, InDel 1:3, InDel 3:1 or InDel 4:0, respectively.
Accuracy assessment of TSETA
Three F1 genetic makers (i.e. 1n:3, 2n:2, IM-1; Table 1) are not caused by gene conversion, but instead they originate from TGS sequencing errors or from DNA replication errors during premeiotic S phase, post-meiotic mitosis or the post-germination growth phase. Therefore, the sum of these three markers can be used to estimate the overall quality of the six near-complete TGS genome sequences we determined in this study. Since there are differences in the 18S-5.8S-26S rRNA gene cluster copy number in QM6a, CBS999.97(MAT1-1), FA, FB, FC and FD, respectively, we estimate the total error rate of TSETA to be <0.0344% [(10 552 + 650 + 521)/34 139 199] or <0.0110 [(2681 + 650 + 402)/34 139 199] when the large rDNA loci are included or excluded, respectively. The overall genome size of QM6a is 34 139 199 bp, whereas the sums of these three markers with or without the large rDNA loci are 11 723 and 3733 bp, respectively. We reported previously that the PacBio SMRT sequencing error rate of the near-complete QM6a genome sequence was <0.0024% because the mitochondrial genome sequence of QM6a is completely identical to that previously reported (1).
In contrast, the overall number of four different markers (i.e. 3n:1, 4n:0, IM-2 and IM-3; Table 1) allowed us to determine the accuracy of the TSETA alignment algorithm (Table 2). Therefore, the sum of these three markers can be used to estimate the overall quality of the six near-complete TGS genome sequences we determined in this study. We estimate the total error assembly rate between these six near-complete genome sequences to be ∼0.0725% [(15 + 14 + 91 + 24 606)/34 139 199] or ∼0.0510% [(15 + 14 + 21 + 17 327)/34 139 199] when the rDNA loci are included or excluded, respectively. Collectively, we conclude that TSETA is a highly accurate tool for MGSA.
Table 2.
Summary of SNPs in the two parental genomes and genetic markers in the four F1 representative genomes detected by TSETA
| Genomes | Chromosome | I | II | III | IV | V | VI (w/o large rDNA locusa) | VII | Total (w/o large rDNA locusa) |
|---|---|---|---|---|---|---|---|---|---|
| QM6a and CBS999.97(MAT1-1) | SNV | 212365 | 13506 | 154861 | 103825 | 139638 | 131366 (130541) | 131866 | 1011427 (1010602) |
| InDel | 895019 | 1339626 | 679705 | 1211117 | 589213 | 927569 (909572) | 722107 | 6364383 (6346359)) | |
| SNP | 1107384 | 1477132 | 834566 | 1314942 | 728851 | 1058962 (1040113) | 853973 | 7375810 (7356961) | |
| Four representative F1 progeny FA, FB, FC and FD | SNV 2:2 | 212044 | 137460 | 154784 | 103782 | 139578 | 130480 (129734) | 131608 | 1009736 (1008990) |
| simple CO | 2 | 1 | 1 | 1 | 1 | 1 (1) | 1 | 8 (8) | |
| CO + NCO | 3 | 2 | 2 | 2 | 3 | 2 (2) | 2 | 16 (16) | |
| SNV 1:3 or 3:1 (NCO) | 17 | 12 | 42 | 7 | 16 | 19 (15) | 24 | 137 (133) | |
| SNV 4:0 (2NCO) | 2 | 6 | 4 | 5 | 5 | 35 (27) | 0 | 57 (49) | |
| SNV RIP (Q) | 269 | 5 | 2 | 2 | 4 | 87 (87) | 229 | 598 (598) | |
| SNV RIP (C) | 3 | 0 | 2 | 4 | 1 | 6 (6) | 3 | 19 (19) | |
| SNV RIP (both Q and C) | 0 | 0 | 0 | 0 | 0 | 0 | 0 | 0 | |
| InDel RIP (Q) | 65 | 56 | 17 | 865 | 67 | 1391 (1391) | 14 | 2475 (2475) | |
| InDel RIP (C) | 9 | 15 | 10 | 13 | 4 | 8 (8) | 14 | 73 (73) | |
| InDel 2:2 | 894062 | 1338780 | 678945 | 1209649 | 584665 | 832222 (823482) | 721580 | 6259903 (6251163) | |
| InDel 1:3 (deletion) | 577 | 408 | 330 | 382 | 4318 | 72 799 (64379) | 260 | 79 074 (70654) | |
| InDel 0:4 (deletion) | 159 | 286 | 203 | 113 | 88 | 20 213 (20160) | 110 | 21 172 (21119) | |
| InDel 3:1 (NCO) | 57 | 25 | 92 | 36 | 28 | 50 (45) | 49 | 337 (332) | |
| InDel 4:0 (2NCO) | 52 | 35 | 48 | 22 | 28 | 684 (28) | 26 | 895 (239) | |
| 1n:3 | 409 | 359 | 395 | 316 | 358 | 8473 (602) | 242 | 10552 (2681) | |
| 2n:2 | 6 | 2 | 8 | 1 | 1 | 631 (631) | 1 | 650 (650) | |
| 3n:1 | 4 | 1 | 3 | 0 | 5 | 2 (2) | 0 | 15 (15) | |
| 4n:0 | 0 | 0 | 3 | 1 | 9 | 0 (0) | 1 | 14 (14) | |
| IM-1 | 51 | 23 | 66 | 36 | 35 | 256 (137) | 54 | 521 (402) | |
| IM-2 | 0 | 5 | 3 | 3 | 0 | 79 (9) | 1 | 91 (21) | |
| IM-3 | 446 | 645 | 340 | 357 | 324 | 22278(14999) | 216 | 24606 (17327) |
aThe genetic markers of the large rDNA loci are included or excluded (w/o) due to the copy number differences of the 18S-5.8S-26S rRNA gene cluster in QM6a, CBS999.97(MAT1-1), FA, FB, FC and FD, respectively.
TSETA is a versatile tool for genome-wide variant calling
One of our goals in developing TSETA was to accurately and comprehensively identify SNVs and Indels among the near-complete genome sequences of any two or more intraspecific strains of T. reesei. We considered SNVs as selected positions exhibiting different nucleotides (A, T, G or C) in QM6a and CBS999.97. Indels were defined as nucleotide sequences specific to QM6a or CBS999.97(MAT1-1), with the corresponding nucleotides in the four F1 progeny often (but not always) showing 2n:2 segregation.
The “Tetrad" mode of TSETA detected 1 011 427 SNVs and 6 364 383 Indels between QM6a and CBS999.97(MAT1-1) (Table 2). In contrast, the NGS-based SNP calling method [i.e. MUMmer (2)] only revealed 604 578 SNVs and 331 491 Indels between QM6a and CBS999.97(MAT1-1) (6) as strain-specific and repeated sequences were neglected. Therefore, TSETA is about ∼7.88 times more powerful than MUMmer [7 375 810 SNPs (1 011 427 SNVs and 6 364 383 Indels) versus 936 069 SNPs (604 578 SNVs + 331 491 Indels), respectively] in revealing intraspecific sequence diversity between genetically distinct strains or isolates.
Genome-wide identification of interhomolog recombination products, RIP and IMs
TSETA is versatile, possessing two powerful programs (‘Recombine Analyzer’ and ‘RIP Analyzer’) for genome-wide detection of CO, NCO, RIP and IM in each tetrad. The strategy of ‘Recombine Analyzer’ is similar to those employed by ‘Recombine (v2.1)’, a suite of programs originally designed solely for the detection and analysis of meiotic recombination in the budding yeast Saccharomyces cerevisiae (36). Initially, all markers in a tetrad are categorized according to whether or not they exhibit 2:2 (but not 2n:2) segregation. Next, the 2:2 markers are searched for locations where markers undergo a reciprocal genotype change, representing the locations of COs. The program then determines if any of 3:1 and/or 4:0 markers (collectively referred to as ‘non-2:2 markers’) fall within the boundaries of the COs. If they do, they are considered gene conversions associated with a CO (termed ‘CO+NCO’) but, if they do not, they are referred to as ‘simple CO’. Then, non-2:2 markers not associated with COs are deemed to be NCOs (only 3:1, but not 1n:3 or 3n:1) or 2NCOs (only 4:0, but not 4n:0) (Tables 2–4).
Table 4.
Summary of all NCO products (≥2 3:1 and/or 4:0 markers) detected by TSETA
| Chromosome number | Chromosome Length (bp) | Position (bp) | GC tract length (bp) | GC tract marker | snp_start_out | snp_start_in | snp_end_in | snp_end_out |
|---|---|---|---|---|---|---|---|---|
| 1 | 6835803 | 2841837 | 168 | 6 | 2841732 | 2841773 | 2841800 | 2842041 |
| 1 | 6835803 | 4349992 | 163 | 5 | 4349909 | 4349911 | 4349918 | 4350228 |
| 2 | 6234656 | 1379384 | 166 | 3 | 1379241 | 1379360 | 1379405 | 1379528 |
| 2 | 6234656 | 4817690 | 68 | 2 | 4817606 | 4817707 | 4817710 | 4817738 |
| 2 | 6234656 | 4955357 | 19 | 5 | 4955339 | 4955355 | 4955360 | 4955372 |
| 3 | 5311445 | 1308219 | 339 | 27 | 1308011 | 1308088 | 1308375 | 1308402 |
| 3 | 5311445 | 1581203 | 116 | 2 | 1581077 | 1581213 | 1581214 | 1581307 |
| 3 | 5311445 | 2314738 | 11 | 4 | 2314730 | 2314734 | 2314742 | 2314744 |
| 3 | 5311445 | 3935255 | 1041 | 19 | 3934647 | 3934821 | 3935580 | 3935970 |
| 3 | 5311445 | 4101515 | 385 | 9 | 4101219 | 4101426 | 4101619 | 4101796 |
| 4 | 4556834 | 1363135 | 51 | 3 | 1363073 | 1363147 | 1363155 | 1363166 |
| 4 | 4556834 | 1790509 | 3 | 2 | 1790506 | 1790509 | 1790510 | 1790511 |
| 4 | 4556834 | 1790513 | 3 | 2 | 1790511 | 1790513 | 1790514 | 1790515 |
| 4 | 4556834 | 3558827 | 9 | 3 | 3558820 | 3558825 | 3558831 | 3558832 |
| 4 | 4556834 | 3558857 | 9 | 3 | 3558851 | 3558854 | 3558857 | 3558865 |
| 4 | 4556834 | 3914233 | 5 | 2 | 3914230 | 3914232 | 3914235 | 3914236 |
| 5 | 4159965 | 7 | 11 | 4 | 1 | 1 | 7 | 17 |
| 5 | 4159965 | 783456 | 170 | 2 | 783355 | 783388 | 783475 | 783607 |
| 5 | 4159965 | 2906230 | 142 | 3 | 2906100 | 2906219 | 2906235 | 2906367 |
| 6 | 4000387 | 16382 | 33 | 3 | 16360 | 16371 | 16379 | 16417 |
| 6 | 4000387 | 2042371 | 759 | 2 | 2041331 | 2042652 | 2042737 | 2042764 |
| 6 | 4000387 | 2345006 | 171 | 2 | 2344776 | 2345065 | 2345066 | 2345116 |
| 6 | 4000387 | 2377073 | 99 | 2 | 2377012 | 2377035 | 2377040 | 2377205 |
| 6 | 4000387 | 2383990 | 146 | 2 | 2383772 | 2384061 | 2384062 | 2384063 |
| 6 | 4000387 | 3900903 | 85 | 2 | 3900794 | 3900927 | 3900944 | 3900946 |
| 6 | 4000387 | 3901276 | 633 | 3 | 3900959 | 3900960 | 3900968 | 3902216 |
Table 3.
Summary of all CO products detected by TSETA
| Chromosome number | Chromosome Length (bp) | Position (bp) | GC tract length (bp) | GC tract marker | snp_start_out | snp_start_in | snp_end_in | snp_end_out | Type |
|---|---|---|---|---|---|---|---|---|---|
| 1 | 6835803 | 290545 | 313 | 5 | 290360 | 290417 | 290660 | 290742 | CO(NCO) |
| 1 | 6835803 | 1376407 | 278 | 5 | 1376220 | 1376316 | 1376462 | 1376630 | CO(NCO) |
| 1 | 6835803 | 2846616 | 192 | 0 | 2846520 | 2846520 | 2846712 | 2846712 | CO |
| 1 | 6835803 | 4850122 | 164 | 0 | 4850040 | 4850040 | 4850204 | 4850204 | CO |
| 1 | 6835803 | 5942633 | 45 | 1 | 5942600 | 5942621 | 5942621 | 5942690 | CO(NCO) |
| 2 | 6234656 | 1078315 | 265 | 5 | 1078135 | 1078229 | 1078313 | 1078581 | CO(NCO) |
| 2 | 6234656 | 3067878 | 287 | 6 | 3067677 | 3067793 | 3067982 | 3068061 | CO(NCO) |
| 2 | 6234656 | 4581277 | 273 | 0 | 4581140 | 4581140 | 4581413 | 4581413 | CO |
| 3 | 5311445 | 389221 | 78 | 1 | 389129 | 389234 | 389234 | 389285 | CO(NCO) |
| 3 | 5311445 | 1639304 | 149 | 1 | 1639199 | 1639259 | 1639259 | 1639497 | CO(NCO) |
| 3 | 5311445 | 2230879 | 438 | 0 | 2230660 | 2230660 | 2231098 | 2231098 | CO |
| 4 | 4556834 | 823739 | 75 | 0 | 823701 | 823701 | 823776 | 823776 | CO |
| 4 | 4556834 | 1922011 | 290 | 6 | 1921803 | 1921929 | 1922088 | 1922223 | CO(NCO) |
| 4 | 4556834 | 3937471 | 185 | 1 | 3937229 | 3937528 | 3937528 | 3937598 | CO(NCO) |
| 5 | 4159965 | 906317 | 84 | 1 | 906203 | 906347 | 906347 | 906371 | CO(NCO) |
| 5 | 4159965 | 1651362 | 137 | 2 | 1651260 | 1651328 | 1651378 | 1651483 | CO(NCO) |
| 5 | 4159965 | 2640861 | 176 | 1 | 2640737 | 2640809 | 2640809 | 2641088 | CO(NCO) |
| 5 | 4159965 | 3965025 | 349 | 0 | 3964850 | 3964850 | 3965199 | 3965199 | CO |
| 6 | 4000387 | 640821 | 312 | 6 | 640643 | 640688 | 640864 | 641090 | CO(NCO) |
| 6 | 4000387 | 2245856 | 476 | 0 | 2245618 | 2245618 | 2246094 | 2246094 | CO |
| 6 | 4000387 | 3266023 | 167 | 1 | 3265860 | 3266018 | 3266018 | 3266194 | CO(NCO) |
| 7 | 3823438 | 1180772 | 373 | 0 | 1180585 | 1180585 | 1180958 | 1180958 | CO |
| 7 | 3823438 | 2891266 | 661 | 6 | 2890900 | 2890971 | 2891551 | 2891642 | CO(NCO) |
| 7 | 3823438 | 3411537 | 251 | 15 | 3411387 | 3411435 | 3411632 | 3411692 | CO(NCO) |
‘Recombine Analyzer’ ignores all markers harboring hyphen symbols (1n:3, 2n:2, 3n:1 and 4n:0), IM1, IM2 and IM3 to avoid misidentification of false-positive CO and NCO products. Remember, the hyphen symbols were deliberately incorporated by TSETA to create user-friendly and comprehensive graphical representations of all six chromosomes.
‘RIP Analyzer’ detects the products of RIP. A hallmark of RIP is that it occurs prior to meiosis, thereby only affecting the two sister chromatids but not the two non-sister homologous chromosomes in the same zygote [reviewed in (13–15)]. One of the most difficult challenges in genome analysis is to faithfully distinguish a RIP event from a 2NCO event (with either a SNV or InDel 4:0 marker) in which all the nucleotides of the four F1 progeny are either all ‘T’ or ‘A’ but the two parental nucleotides are ‘T’ and ‘C’ or ‘A’ and ‘G’, respectively. Since RIP occurs prior to the formation of meiotic interhomolog recombination products, the 2NCO events with C:G to T:A mutations will not be considered as RIP if they locate between two adjacent CO and/or NCO events. Accordingly, we managed to integrate ‘RIP Analyzer’ with ‘Recombine Analyzer’ in TSETA, so that the nucleotides in the two corresponding sister chromatids that have undergone RIP can be accurately recognized according to the segregation pattern of their neighboring nucleotides in all four F1 progeny (Figure 2).
Notably, more RIP events were detected in the genome of QM6a [3.073 nt (598 SNV RIPs + 2475 InDel RIPs)] than in that of CBS999.97(MAT1-1) [92 nt (19 SNV RIPs and 73 InDel RIPs)] (Table 2 and Figures 3–5). This result is not surprising for two reasons. First, the CBS999.97(MAT1-1) strain we used here was previously derived from an ascospore from a fruiting body generated by sexual crossing of CBS999.97(MAT1-1) with CBS999.97(MAT1-1) (11), indicating that its genome had undergone at least one round of RIP. Secondly, QM6a is female sterile and has been propagated vegetatively for more than 70 years. Accordingly, the QM6a genome has accumulated more duplicated and RIP-prone sequences than that of CBS999.97(MAT1-1) (6). For example, a long RIP-prone sequence in ChVI (length: 47 420 bp; location: 1 155 679−1 203 098 bp; indicated by a square box in Figure 6A) is highly similar in nucleotide sequence (E-values = 0 and identities ≥77%) with three different long DNA segments in QM6a, including ChIV (4 288 615−4 344 503 bp), ChV (399 786−447 005 bp) and ChVI (993 647−10 457 763 bp), respectively. These three DNA segments in QM6a have underwent RIP during sexual crossing with CBS999.97(MAT1-1). Interestingly, the genome of CBS999.97(MAT1-1) does not possess similar or homologous sequence. It is not clear how QM6a acquired these long repetitive sequences during evolution.
Figure 6.

Intuitive visualization of genome-wide 5-methylcytosines in vegetative mycelia of QM6a and CBS999.97(MAT1-1). The ChVI chromosomes of QM6a, CBS999.97(MAT1-1) and the four representative F1 progeny are shown as described in Figure 4. Genomic DNA was isolated from vegetative mycelia of QM6a and CBS999.97(MAT1-1), respectively, and then subjected to whole genome bisulfite sequencing (see ‘Materials and Methods’ section). Genome-wide levels of 5-methylcytosines were calculated using BatMeth2 (24). The two bottom panels depict the 5-methylcytosine levels along the ChVI chromosomes of vegetative mycelia of QM6a and CBS999.97(MAT1-1), respectively. A long RIP-prone region in chromosome VI of QM6a is indicated by a square box.
Our results also reveal that the overall frequencies of 2NCO (i.e. 57 SNV 4:0 markers and 895 InDel 4:0 markers) are lower and higher than those of RIP in QM6a and CBS999.97(MAT1-1), respectively (Figures 4 and 5 and Table 2). Locally, few RIP-induced C:G-to-T:A mutations were detected in the centromeres of the four F1 progeny (Figures 4 and 5). No RIP event was detected within the large rDNA loci of the four F1 progeny (Table 2 and Figure 5A).
TSETA is a powerful tool for global and local visualization of sequence variants
We designed a high-performance viewing interface for TSETA to provide an intuitive user experience for all levels of genome resolution. It has a zoom function (≥105-fold magnification) that can be manually controlled by turning a mouse wheel. The TSETA viewer allows users to conduct instantaneous and continuous visualization of all six near-complete chromosomes from the scale of the full-length chromosome landscape to individual nucleotides (Figure 4).
For global visualization, regions with sequences identical to QM6a and CBS999.97(MAT1-1) are colored ‘magenta’ or ‘cyan’, respectively. Gapped (deletion) regions are colored ‘white’. The red bars and blue bars mark CO and NCO, respectively, whereas black bars mark RIP. All the genetic markers depicted in Table 1 are also displayed in the TSETA interface (Figures 4 and 5).
For local nucleotide sequence visualization, QM6a-like and CBS999.97(MAT1-1)-like sequences are colored ‘pale turquoise’ and ‘pink’, respectively. All non-2:2 markers and the 2:2 markers located next to the boundaries of COs are also highlighted in local nucleotide sequences (in ‘cyan’ and ‘magenta’, respectively) (Figure 4–6).
TSETA is convenient for integration and visualization of 5-methylcytosines revealed by NGS-based bisulfite sequencing
RIP was thought to be mediated by 5-methylcytosines [reviewed in (13,14)]. Here, we also combined a NGS-based bisulfite sequencing method and TSETA to map and visualize 5-methylcytosines in the genomic DNA isolated from vegetative mycelia of QM6a and CBS999.97(MAT1-1), respectively (Figure 6). Using a control unmethylated phage DNA (see ‘Materials and Methods’ section), the bisulfite conversion efficiencies of QM6a and CBS999.97(MAT1-1) were determined to be 97.5%. Next, genome-wide DNA methylation calling was carried out using the publicly available software BatMeth2 (24). The genome-wide ratios of 5-methylcytosines versus the sum of 5-methylcytosines and cytosines were then visualized in TSETA. We found that the 5-methylcytosine components in both genomes consisted of relics that are highly AT-rich or RIP-prone (Figure 6). Most of these AT-rich relics are categorized and displayed as ‘strain-specific’ sequences in TSETA, so their 5-methylcytosine profiles can be visualized in isolation (Figure 6). This additional function of TSETA provides a powerful new means for comparative analyses of the impacts of 5-methylcytosine and strain-specific sequences during sexual development, such as RIP and meiotic silencing by unpaired DNA (MSUD). MSUD is a RNA interference (RNAi) process whereby DNA unpaired during meiosis causes silencing of all DNA homologous to it, including genes that are themselves paired (37,38).
DISCUSSION
Single-nucleotide-resolution MGSA (rather than SNP calling) is the main strategic difference that distinguishes TSETA from other NGS-based software packages previously developed for genome-wide detection of meiotic recombination products. As long as a hybrid meiosis with large numbers of heterozygous variant markers is established, there are only two prerequisites to completing the tasks assigned to TSETA. First, high-quality and chromosome-level genome sequences involved in a meiosis event are necessary. Given the rapid development of TGS platforms (e.g. PacBio SMRT and Nanopore), obtaining such sequences is now feasible and affordable. Second, a fast, accurate and low-cost computational approach for MGSA of all complete haploid genomes involved in a meiotic event is required. We overcame inherent challenges with genomic analyses by combining in TSETA the power of the BLASTN-guided and sectional MAFFT algorithms.
Our results demonstrate that TSETA will prove to be a faster and timely tool for the filamentous fungal community for the following reasons. Firstly, TSETA outcompetes nearly all NGS-based sequencing technology and alignment software tools because it takes into account all SNPs in a hybrid zygote. Secondly, TSETA sequentially identifies all ‘allelic’ homologous sequences with a size greater than 1 kb in the six corresponding homologous chromosomes before and after a single meiotic event, including those in QM6a, CBS999.97(MAT1-1), FA, FB, FC and FD, respectively. These allelic DNA sequences are then used as anchors to carry out multiple genome sequence alignment (MGSA) and comparison of all six high-quality genomes. Subsequently, TSETA can identify and visualize DNA nucleotide sequence changes or even modifications during sexual development. Thirdly, TSETA is a powerful system to identify and visualize all highly variable, non-allelic or repetitive sequences (e.g. centromeres, AT-rich blocks and rDNA) before and after meiosis, as well as the solitary sequences not found in maternal or paternal genomes but that are present in FA, FB, FC or FD, respectively. Finally, our computing server (with 20 GB of RAM) only took ∼20 h for TSETA to complete all the tasks described here.
In this study, we have demonstrated that TSETA is also an appropriate tool for visualizing the 5-methylcytosines revealed by NGS-based bisulfite conversion. Interestingly, both PacBio SMRT and Nanopore sequencers allow direct detection of modified nucleotides in the DNA templates, including N6-methyladenine, 5-methylcytosine and 5-hydroxymethylcytosine (39,40), all of which can be further analyzed and visualized in TSETA. Therefore, this new MGSA algorithm is applicable to genome-wide identification, visualization and comparative analyses of many other DNA variants involved in various biological processes. For example, our results reveal that 5-methylcytosines are highly enriched in the RIP-prone regions in the genomes of QM6a and CBS999.97(MAT1-1) during vegetative growth. Presumably, these 5-methylcytosines will not have been converted to thymidines because RIP only occurs premeiotically (Figure 6). It is noteworthy that the GC content of a long RIP-prone region in chromosome VI of QM6a (indicated by a square box in Figure 6A) is higher (>25%) than those of AT-rich and gene-poor compartments, but lower (<10%) than the average GC content of the entire QM6a genome. Further investigations will reveal what structural features (i.e. duplicated or repetitive sequences and/or their GC contents) and genetic determinants are critical for the formation of 5-methylcytosines in the RIP-prone regions during vegetative growth.
In conclusion, TSETA is a fast and accurate software program that allows all researchers, no matter their level of bioinformatics experience, to perform genome-wide SNP calling among high-quality genome sequences of any two or more intraspecific strains. TSETA is also a powerful tool for genome-wide identification of interhomolog recombination product, RIP and IM before and after meiosis. Using T. reesei QM6a/CBS999.97(MAT1-1) hybrid meiosis as a model, we demonstrate that TSETA can complete analytical tasks regardless of the high contents of long and AT-rich sequences in T. reesei genomes. In principle, TSETA could be applied to many other sexual eukaryotes, including other Pezizomycotina fungi (e.g. Neurospora crassa) and those with high numbers of repetitive sequences and transposable elements (e.g. Basidiomycota fungi, higher plants and animals). For organisms with unique reproductive strategies, some modifications might be needed. For example, in many Basidiomycota, the dikaryotic state is maintained by clamp connections that help reestablish the pairs of compatible nuclei after synchronous mitotic divisions. During sexual development, the two nuclei fuse in a basidium and form a diploid zygote. Haploid spores (basidiospores) are then produced in the basidium. Thanks to rapid improvements of TGS and sequence alignment technology, unzipping haplotypes in diploid or even polyploid genomes is a growing trend of recent genome studies (41). Alternatively, sexually competent monokaryonic mycelia of many Basidiomycete species can be obtained via germination of either basidiospores or arthrospores. Arthrospores are conidia or asexual spores that are produced simply by the last cell on a dikaryonic hypha breaking off and dispersing as a propagule. Accordingly, the genome sequences of monokaryonic mycelia can be readily determined by TGS technology. In both scenarios, TSETA can be a versatile tool for genome-wide analysis of organisms with diploid or even polyploid zygotes.
DATA AVAILABILITY
The reference genomes used in this study were previously determined using the PacBio SMRT sequencing and assembly platforms: T. reesei QM6a (GenBank accession number: CP016232-CP016238) (1), CBS999.97(MAT1-1) (GenBank accession numbers: CP017983-CP017984 and CP020875-CP020879), and their four representative F1 progeny (GenBank accession numbers: CP021290-CP021317) (6). All of these complete genome sequences have been submitted to the National Center for Biotechnology Information (NCBI) under three BioProjects (PRJNA325840, PRJNA352653 and PRJNA386077). The NGS-based bisulfite sequencing results have also been submitted to NCBI under a BioProject (PRJNA635549).
SOFTWARE AVAILABILITY AND REQUIREMENTS
Project name: TSETA
Project home page: http://github.com/labASIMBTFWang/TSETA
Operating system: Linux.
Programming languages: ECMAScript.
Other requirements: BLASTN, MAFFT and Node.js.
License: GPL-3.0
Any restrictions to use by non-academics: License required.
ACKNOWLEDGEMENTS
We thank John O′Brien for English editing, Yu-Tang Huang (IMB Computer Room) for maintaining the computer workstation and Hsin-Nan Lin (IMB Bioinformatics Core) for help with submitting the TSETA source code to GitHub.
Authors’ contributions: T.F.W. proposed the study, conceived the computational algorithm and wrote the manuscript. H.C.L. wrote the source codes. W.C.L., H.C.L., Y.J.L., S.Y.T. and T.F.W. performed the experiments and analyzed the data. All of the authors contributed, read and approved the manuscript.
Contributor Information
Wan-Chen Li, Institute of Molecular Biology, Academia Sinica, Taipei 115, Taiwan.
Hou-Cheng Liu, Institute of Molecular Biology, Academia Sinica, Taipei 115, Taiwan.
Ying-Jyun Lin, Institute of Molecular Biology, Academia Sinica, Taipei 115, Taiwan.
Shu-Yun Tung, Institute of Molecular Biology, Academia Sinica, Taipei 115, Taiwan.
Ting-Fang Wang, Institute of Molecular Biology, Academia Sinica, Taipei 115, Taiwan.
FUNDING
Academia Sinica, Taiwan, Republic of China [AS-105-TP-B07, AS108-TP-B07 to T.F.W.]; Ministry of Science and Technology, Taiwan, Republic of China [MOST163-2311-B-001-016-MY3 to T.F.W.].
Conflict of interest statement. None declared.
REFERENCES
- 1. Li W.C., Huang C.H., Chen C.L., Chuang Y.C., Tung S.Y., Wang T.F.. Trichoderma reesei complete genome sequence, repeat-induced point mutation, and partitioning of CAZyme gene clusters. Biotechnol. Biofuels. 2017; 10:170. [DOI] [PMC free article] [PubMed] [Google Scholar]
- 2. Marcais G., Delcher A.L., Phillippy A.M., Coston R., Salzberg S.L., Zimin A.. MUMmer4: a fast and versatile genome alignment system. PLoS Comput. Biol. 2018; 14:e1005944. [DOI] [PMC free article] [PubMed] [Google Scholar]
- 3. Lin H.N., Hsu W.L.. MapCaller – An integrated and efficient tool for short-read mapping and variant calling using high-throughput sequenced data. 2019; biorXiv doi:27 September 2019, preprint: not peer reviewed 10.1101/783605. [DOI]
- 4. Rhoads A., Au K.F.. PacBio sequencing and its applications. Genomics Proteomics Bioinform. 2015; 13:278–289. [DOI] [PMC free article] [PubMed] [Google Scholar]
- 5. Li W.-C., Chuang Y.-C., Chen C.-L., Wang T.-F.. Schmoll M., Dattenböck C.. Gene Expression Systems in Fungi: Advancements and Applications. 2016; Cham: Springer International Publishing; 351–359. [Google Scholar]
- 6. Li W.C., Chuang Y.C., Chen C.L., Timofejeva L., Pong W.L., Chen Y.J., Wang C.L., Wang T.F.. Two different pathways for initiation of Trichoderma reesei Rad51-only meiotic recombination. 2019; biorXiv doi:21 May 2019, preprint: not peer reviewed 10.1101/644443. [DOI]
- 7. Montenecourt B.S., Eveleigh D.E.. Preparation of mutants of Trichoderma reesei with enhanced cellulase production. Appl. Environ. Microbiol. 1977; 34:777–782. [DOI] [PMC free article] [PubMed] [Google Scholar]
- 8. Bischof R.H., Ramoni J., Seiboth B.. Cellulases and beyond: the first 70 years of the enzyme producer Trichoderma reesei. Microb. Cell. Fact. 2016; 15:106. [DOI] [PMC free article] [PubMed] [Google Scholar]
- 9. Druzhinina I.S., Kubicek C.P.. Familiar stranger: ecological genomics of the model saprotroph and industrial enzyme producer Trichoderma reesei breaks the stereotypes. Adv. Appl. Microbiol. 2016; 95:69–147. [DOI] [PubMed] [Google Scholar]
- 10. Schmoll M., Dattenbock C., Carreras-Villasenor N., Mendoza-Mendoza A., Tisch D., Aleman M.I., Baker S.E., Brown C., Cervantes-Badillo M.G., Cetz-Chel J. et al.. The genomes of three uneven siblings: footprints of the lifestyles of three Trichoderma species. Microbiol. Mol. Biol. Rev. 2016; 80:205–327. [DOI] [PMC free article] [PubMed] [Google Scholar]
- 11. Seidl V., Seibel C., Kubicek C.P., Schmoll M.. Sexual development in the industrial workhorse Trichoderma reesei. Proc. Natl. Acad. Sci. U.S.A. 2009; 106:13909–13914. [DOI] [PMC free article] [PubMed] [Google Scholar]
- 12. Chuang Y.C., Li W.C., Chen C.L., Hsu P.W., Tung S.Y., Kuo H.C., Schmoll M., Wang T.F.. Trichoderma reesei meiosis generates segmentally aneuploid progeny with higher xylanase-producing capability. Biotechnol. Biofuels. 2015; 8:30. [DOI] [PMC free article] [PubMed] [Google Scholar]
- 13. Aramayo R., Selker E.U.. Neurospora crassa, a model system for epigenetics research. Cold Spring Harb. Perspect. Biol. 2013; 5:a017921. [DOI] [PMC free article] [PubMed] [Google Scholar]
- 14. Gladyshev E. Repeat-induced point mutation and other genome defense mechanisms in fungi. Microbiol. Spectr. 2017; 5:doi 10.1128/microbiolspec.FUNK-0042-2017. [DOI] [PMC free article] [PubMed] [Google Scholar]
- 15. Li W.C., Chen C.L., Wang T.F.. Repeat-induced point (RIP) mutation in the industrial workhorse fungus Trichoderma reesei. Appl. Microbiol. Biotechnol. 2018; 102:1567–1574. [DOI] [PubMed] [Google Scholar]
- 16. Schardl C.L., Young C.A., Hesse U., Amyotte S.G., Andreeva K., Calie P.J., Fleetwood D.J., Haws D.C., Moore N., Oeser B. et al.. Plant-symbiotic fungi as chemical engineers: multi-genome analysis of the clavicipitaceae reveals dynamics of alkaloid loci. PLoS Genet. 2013; 9:e1003323. [DOI] [PMC free article] [PubMed] [Google Scholar]
- 17. Winter D.J., Ganley A.R.D., Young C.A., Liachko I., Schardl C.L., Dupont P.Y., Berry D., Ram A., Scott B., Cox M.P.. Repeat elements organise 3D genome structure and mediate transcription in the filamentous fungus Epichloe festucae. PLoS Genet. 2018; 14:e1007467. [DOI] [PMC free article] [PubMed] [Google Scholar]
- 18. Dong S., Raffaele S., Kamoun S.. The two-speed genomes of filamentous pathogens: waltz with plants. Curr. Opin. Genet. Dev. 2015; 35:57–65. [DOI] [PubMed] [Google Scholar]
- 19. Frantzeskakis L., Kusch S., Panstruga R.. The need for speed: compartmentalized genome evolution in filamentous phytopathogens. Mol. Plant. Pathol. 2019; 20:3–7. [DOI] [PMC free article] [PubMed] [Google Scholar]
- 20. Schwessinger B., Sperschneider J., Cuddy W.S., Garnica D.P., Miller M.E., Taylor J.M., Dodds P.N., Figueroa M., Park R.F., Rathjen J.P.. A near-complete haplotype-phased genome of the dikaryotic wheat stripe rust fungus Puccinia striiformis f. sp. tritici reveals high interhaplotype diversity. mBio. 2018; 9:doi:10.1128/mBio.02275-17. [DOI] [PMC free article] [PubMed] [Google Scholar]
- 21. Chen C.L., Kuo H.C., Tung S.Y., Hsu P.W., Wang C.L., Seibel C., Schmoll M., Chen R.S., Wang T.F.. Blue light acts as a double-edged sword in regulating sexual development of Hypocrea jecorina (Trichoderma reesei). PLoS One. 2012; 7:e44969. [DOI] [PMC free article] [PubMed] [Google Scholar]
- 22. Krzywinski M., Schein J., Birol I., Connors J., Gascoyne R., Horsman D., Jones S.J., Marra M.A.. Circos: an information aesthetic for comparative genomics. Genome Res. 2009; 19:1639–1645. [DOI] [PMC free article] [PubMed] [Google Scholar]
- 23. Zhou L., Ng H.K., Drautz-Moses D.I., Schuster S.C., Beck S., Kim C., Chambers J.C., Loh M.. Systematic evaluation of library preparation methods and sequencing platforms for high-throughput whole genome bisulfite sequencing. Sci. Rep. 2019; 9:10383. [DOI] [PMC free article] [PubMed] [Google Scholar]
- 24. Zhou Q., Lim J.Q., Sung W.K., Li G.. An integrated package for bisulfite DNA methylation data analysis with Indel-sensitive mapping. BMC Bioinformatics. 2019; 20:47. [DOI] [PMC free article] [PubMed] [Google Scholar]
- 25. Katoh K., Standley D.M.. MAFFT multiple sequence alignment software version 7: improvements in performance and usability. Mol. Biol. Evol. 2013; 30:772–780. [DOI] [PMC free article] [PubMed] [Google Scholar]
- 26. Nakamura T., Yamada K.D., Tomii K., Katoh K.. Parallelization of MAFFT for large-scale multiple sequence alignments. Bioinformatics. 2018; 34:2490–2492. [DOI] [PMC free article] [PubMed] [Google Scholar]
- 27. Katoh K., Rozewicki J., Yamada K.D.. MAFFT online service: multiple sequence alignment, interactive sequence choice and visualization. Brief. Bioinform. 2019; 20:1160–1166. [DOI] [PMC free article] [PubMed] [Google Scholar]
- 28. Lassmann T., Sonnhammer E.L.. Kalign–an accurate and fast multiple sequence alignment algorithm. BMC Bioinformatics. 2005; 6:298. [DOI] [PMC free article] [PubMed] [Google Scholar]
- 29. Altschul S.F., Gish W., Miller W., Myers E.W., Lipman D.J.. Basic local alignment search tool. J. Mol. Biol. 1990; 215:403–410. [DOI] [PubMed] [Google Scholar]
- 30. Mount D.W. Using the basic local alignment search tool (BLAST). CSH Protoc. 2007; 2007:pdb.top17. [DOI] [PubMed] [Google Scholar]
- 31. Julien J., Poirier-Hamon S., Brygoo Y.. Foret1, a reverse transcriptase-like sequence in the filamentous fungus Fusarium oxysporum. Nucleic Acids Res. 1992; 20:3933–3937. [DOI] [PMC free article] [PubMed] [Google Scholar]
- 32. Shi J., Wolf S.E., Burke J.M., Presting G.G., Ross-Ibarra J., Dawe R.K.. Widespread gene conversion in centromere cores. PLoS Biol. 2010; 8:e1000327. [DOI] [PMC free article] [PubMed] [Google Scholar]
- 33. Nambiar M., Smith G.R.. Repression of harmful meiotic recombination in centromeric regions. Semin. Cell Dev. Biol. 2016; 54:188–197. [DOI] [PMC free article] [PubMed] [Google Scholar]
- 34. Sims J., Copenhaver G.P., Schlogelhofer P.. Meiotic DNA repair in the nucleolus employs a nonhomologous end-joining mechanism. Plant Cell. 2019; 31:2259–2275. [DOI] [PMC free article] [PubMed] [Google Scholar]
- 35. Kobayashi T. Ribosomal RNA gene repeats, their stability and cellular senescence. Proc. Jpn Acad. B Phys. Biol. Sci. 2014; 90:119–129. [DOI] [PMC free article] [PubMed] [Google Scholar]
- 36. Anderson C.M., Chen S.Y., Dimon M.T., Oke A., DeRisi J.L., Fung J.C.. ReCombine: a suite of programs for detection and analysis of meiotic recombination in whole-genome datasets. PLoS One. 2011; 6:e25509. [DOI] [PMC free article] [PubMed] [Google Scholar]
- 37. Shiu P.K., Raju N.B., Zickler D., Metzenberg R.L.. Meiotic silencing by unpaired DNA. Cell. 2001; 107:905–916. [DOI] [PubMed] [Google Scholar]
- 38. Hammond T.M. Sixteen years of meiotic silencing by unpaired DNA. Adv. Genet. 2017; 97:1–42. [DOI] [PubMed] [Google Scholar]
- 39. Flusberg B.A., Webster D.R., Lee J.H., Travers K.J., Olivares E.C., Clark T.A., Korlach J., Turner S.W.. Direct detection of DNA methylation during single-molecule, real-time sequencing. Nat. Methods. 2010; 7:461–465. [DOI] [PMC free article] [PubMed] [Google Scholar]
- 40. Xu L., Seki M.. Recent advances in the detection of base modifications using the Nanopore sequencer. J. Hum. Genet. 2020; 65:25–33. [DOI] [PMC free article] [PubMed] [Google Scholar]
- 41. Zhang X., Wu R., Wang Y., Yu J., Tang H.. Unzipping haplotypes in diploid and polyploid genomes. Comput. Struct. Biotechnol. J. 2020; 18:66–72. [DOI] [PMC free article] [PubMed] [Google Scholar]
Associated Data
This section collects any data citations, data availability statements, or supplementary materials included in this article.
Data Availability Statement
The reference genomes used in this study were previously determined using the PacBio SMRT sequencing and assembly platforms: T. reesei QM6a (GenBank accession number: CP016232-CP016238) (1), CBS999.97(MAT1-1) (GenBank accession numbers: CP017983-CP017984 and CP020875-CP020879), and their four representative F1 progeny (GenBank accession numbers: CP021290-CP021317) (6). All of these complete genome sequences have been submitted to the National Center for Biotechnology Information (NCBI) under three BioProjects (PRJNA325840, PRJNA352653 and PRJNA386077). The NGS-based bisulfite sequencing results have also been submitted to NCBI under a BioProject (PRJNA635549).