

Abstract
In predicting the pathogenicity of a nonsynonymous single-nucleotide variant (nsSNV), a radical change in amino acid properties is prone to be classified as being pathogenic. However, not all such nsSNVs are associated with human diseases. We generated random forest (RF) models individually for each amino acid substitution to differentiate pathogenic nsSNVs in the Human Gene Mutation Database and common nsSNVs in dbSNP. We named a set of our models ‘Individual Meta RF’ (InMeRF). Ten-fold cross-validation of InMeRF showed that the areas under the curves (AUCs) of receiver operating characteristic (ROC) and precision–recall curves were on average 0.941 and 0.957, respectively. To compare InMeRF with seven other tools, the eight tools were generated using the same training dataset, and were compared using the same three testing datasets. ROC-AUCs of InMeRF were ranked first in the eight tools. We applied InMeRF to 155 pathogenic and 125 common nsSNVs in seven major genes causing congenital myasthenic syndromes, as well as in VANGL1 causing spina bifida, and found that the sensitivity and specificity of InMeRF were 0.942 and 0.848, respectively. We made the InMeRF web service, and also made genome-wide InMeRF scores available online (https://www.med.nagoya-u.ac.jp/neurogenetics/InMeRF/).
INTRODUCTION
Development of the high-throughput sequencing (HTS) technologies has enabled identification of a large number of single-nucleotide variants (SNVs) in human diseases in a reasonable time at a reasonable cost. Nonsynonymous SNVs (nsSNVs) constitute most of the identified pathogenic SNVs, although the numbers of pathogenic intronic splicing SNVs and pathogenic copy number variations are also increasing (1). The Human Gene Mutation Database (HGMD) (2) and ClinVar (3) are major databases of pathogenic SNVs. Along with advancement of the HTS technologies, in silico tools to predict pathogenicity of an identified nsSNV have been developed using various machine learning techniques, including (i) support vector machine (SVM) [CADD (4,5), MetaSVM (6) and MutPred (7,8)], (ii) random forest (RF) [DEOGEN2 (9), MutPred (7,8), REVEL (10) and VEST (11)], (iii) gradient boosting decision tree [M-CAP (12)], (iv) logistic regression [MetaLR (6)], (v) hidden Markov model [FATHMM (13)] and (vi) deep learning [DANN (14), PrimateAI (15) and MVP (16)].
We previously used SVM modeling to make IntSplice for predicting the splicing effect of SNVs at intronic positions −50 to −3 (17). In this communication, we made RF models to differentiate pathogenic nsSNVs in HGMD and common nsSNVs in dbSNP. Compared to SVM modeling, RF modeling is suitable for a large dataset, and requires less computer resources and less efforts in tuning hyperparameters (18,19). We named a set of our models ‘Individual Meta RF’ (InMeRF). We called it ‘individual’, because we generated an RF model for each of 150 amino acid (AA) substitutions. Among 20 × 19 = 380 possible AA substitutions, nsSNVs are able to cause 150 AA substitutions. Individual modeling alleviated a possible bias that makes radical AA changes being predicted to be pathogenic. We made an InMeRF web service. We also analyzed all possible nsSNVs in the human genome, and made the genome-wide InMeRF scores available online.
MATERIALS AND METHODS
Generation of InMeRF models
We used the HGMD Pro release 2015.2 (2) to obtain pathogenic nsSNVs. Among them, we filtered 72 556 pathogenic nsSNVs with both ‘CLASS = DM’, which stands for disease-causing mutation, and ‘MUT = ALT’, which indicates that an alternative nucleotide is a mutation. Even when an nsSNV was reported in multiple patients, the nsSNV was counted as a single nsSNV in the training dataset. We next extracted 166 161 common nsSNVs from dbSNP build 151 (20) included in dbNSFP v4.0a (21), for which a minor allelic frequency (MAF) was >0.001 in 1000Gp3_AF, UK10K_AF, ExAC_AF, gnomAD_exomes_AF or gnomAD_genomes_AF. We then filtered 162 918 common nsSNVs by removing nsSNVs either included in HGMD Pro release 2015.2 (2) or labeled as ‘clinvar_clnsig = Pathogenic or Likely_pathogenic’ in dbNSFP v4.0a.
Feature values to differentiate pathogenic and common nsSNVs were obtained from 37 tools in dbNSFP v4.0a. In dbNSFP v4.0a, the scores are normalized so that a pathogenic nsSNV gives rise to a rank score of 1 and a normal nsSNV returns a rank score of 0. We calculated percent coverages of the 37 tools for the pathogenic and common nsSNVs (Table 1). The coverages of M-CAP (12), MutPred (7,8) and LINSIGHT (22) for the common nsSNVs were as low as 37.24%, 6.21% and 3.52%, respectively (Table 1). We thus excluded these three tools, and rank scores of the remaining 34 tools in dbNSFP v4.0a were used as feature values [SIFT (23–26), SIFT4G (27), Polyphen2_HDIV (28), Polyphen2_HVAR (28), LRT (29), MutationTaster (30), MutationAssessor (31), FATHMM (13), PROVEAN (32,33), VEST4 (11), MetaSVM (6), MetaLR (6), REVEL (10), MVP (16), MPC (34), PrimateAI (15), DEOGEN2 (9), CADD (4,5), DANN (14), fathmm-MKL (35), fathmm-XF (36), Eigen (37), Eigen-PC (37), GenoCanyon (38), integrated_fitCons (39–41), GERP++ (42), phyloP100way_vertebrate (43,44), phyloP30way_mammalian (43,44), phyloP17way_primate (43,44), phastCons100way_vertebrate (43,44), phastCons30way_mammalian (43,44), phastCons17way_primate (43,44), SiPhy (45,46), and bStatistic (4,5)]. To make RF models, nsSNVs that lacked one or more of 34 rank scores in dbNSFP v4.0a were also excluded.
Table 1.
Thirty-seven tools in dbNSFP v4.0a (21) and their percent coverage for the sum of 72 556 pathogenic nsSNVs and 162 918 common nsSNVs, which were used to generate InMeRF models
| Tool | Type | Pathogenic nsSNVs (%) | Common nsSNVs (%) | References |
|---|---|---|---|---|
| SIFT | Prediction | 97.31 | 89.62 | (23–26) |
| SIFT4G | Prediction | 98.12 | 93.46 | (27) |
| Polyphen2_HDIV | Prediction | 92.14 | 80.88 | (28) |
| Polyphen2_HVAR | Prediction | 92.14 | 80.88 | (28) |
| LRT | Prediction | 93.93 | 72.45 | (29) |
| MutationTaster | Prediction | 99.94 | 95.72 | (30) |
| MutationAssessor | Prediction | 89.32 | 76.07 | (31) |
| FATHMM | Prediction | 98.27 | 87.35 | (13) |
| PROVEAN | Prediction | 98.29 | 90.39 | (32,33) |
| VEST4 | Prediction | 99.35 | 95.72 | (11) |
| MetaSVM | Prediction | 99.40 | 94.08 | (6) |
| MetaLR | Prediction | 99.40 | 94.08 | (6) |
| M-CAPa | Prediction | 97.39 | 37.24 | (12) |
| REVEL | Prediction | 99.40 | 94.08 | (10) |
| MutPreda | Prediction | 81.09 | 6.21 | (7,8) |
| MVP | Prediction | 99.12 | 73.85 | (16) |
| MPC | Prediction | 91.76 | 75.79 | (34) |
| PrimateAI | Prediction | 96.72 | 85.13 | (15) |
| DEOGEN2 | Prediction | 94.52 | 86.73 | (9) |
| CADD | Prediction | 100.00 | 100.00 | (4,5) |
| DANN | Prediction | 100.00 | 100.00 | (14) |
| fathmm-MKL | Prediction | 100.00 | 100.00 | (35) |
| fathmm-XF | Prediction | 86.76 | 92.20 | (36) |
| Eigen | Prediction | 87.62 | 92.02 | (37) |
| Eigen-PC | Prediction | 87.62 | 92.02 | (37) |
| GenoCanyon | Prediction | 100.00 | 100.00 | (38) |
| integrated_fitCons | Prediction | 87.68 | 97.44 | (39–41) |
| LINSIGHTa | Prediction | 0.07 | 3.52 | (22) |
| GERP++ | Conservation | 99.98 | 98.51 | (42) |
| phyloP100way_vertebrate | Conservation | 100.00 | 99.97 | (43,44) |
| phyloP30way_mammalian | Conservation | 100.00 | 99.94 | (43,44) |
| phyloP17way_primate | Conservation | 100.00 | 99.90 | (43,44) |
| phastCons100way_vertebrate | Conservation | 100.00 | 99.97 | (43,44) |
| phastCons30way_mammalian | Conservation | 100.00 | 99.94 | (43,44) |
| phastCons17way_primate | Conservation | 100.00 | 99.90 | (43,44) |
| SiPhy | Conservation | 99.88 | 97.09 | (45,46) |
| bStatistic | Conservation | 98.93 | 98.02 | (4,5) |
aExcluded from features to make our models and from comparison with InMeRF because of low nsSNV coverages.
The pathogenic and common nsSNVs were classified into 150 different nonsynonymous AA substitutions, which possibly occur by a single-nucleotide substitution. In order to select nsSNVs with high MAFs, the common nsSNVs were sorted in descending order of MAF of 1000Gp3_AF. When MAF was absent in 1000Gp3_AF, MAFs of TWINSUK_AF, ALSPAC_AF, ExAC_AF, gnomAD_exomes_AF and gnomAD_genomes_AF were used in this order. NsSNVs without any MAF were ranked lower than MAF-bearing nsSNVs. In order to make unbiased RF models, the same numbers of pathogenic and common nsSNVs were used for each AA substitution (Supplementary Table S1A). We confirmed that modeling with all pathogenic nsSNVs and all common nsSNVs made the RF models less dependable compared to the balanced training datasets (Supplementary Table S1B). We also confirmed that modeling with the same numbers of pathogenic nsSNVs and ‘rare’ common nsSNVs similarly made less dependable RF models (Supplementary Table S1C). In this ‘rare’ common modeling, nsSNVs were sorted in ascending order of MAF of 1000Gp3_AF to select nsSNVs with low MAFs.
The 34 rank scores in dbNSFP v4.0a were used as feature values to make RF models to differentiate pathogenic and common nsSNVs. RF modeling was performed using a machine learning library, scikit-learn (47), on Python version 3.7. In this modeling, hyperparameters were set to (i) n_estimators (range(10, 110, 10)), (ii) criterion (‘gini’, ‘entropy’) and (iii) max_depth (i for i in range(1, 6, 1)). These hyperparameters represent that (i) the number of trees in the forest is selected from 10 to 100 by 10 steps, (ii) the function to measure the quality of a split is selected as Gini impurity or information gain and (iii) the maximum depth of the tree is selected from 1 to 5 by one step. Optimal hyperparameters were automatically determined by 10-fold cross-validation grid search. RF models were generated independently for each of 150 different AA substitutions. An overview of InMeRF modeling is shown in Supplementary Figure S1A.
Comparison of InMeRF with 25 other prediction tools in dbNSFP v4.0a
To compare InMeRF with 25 other prediction tools (Table 1), we used three testing datasets of VariBenchSelected, predictSNPSelected and SwissVarSelected (48) derived from VariBench (49,50), predictSNP (51) and SwissVar (52), respectively (Supplementary Table S2). Among the 28 prediction tools in dbNSFP v4.0a, M-CAP, MutPred and LINSIGHT were excluded from the comparisons because of low nsSNV coverages, as stated earlier. Some tools might have used subsets of the three testing datasets to generate the models, and are expected to show better predictive performance than the others.
Comparison of InMeRF with 10 other tools in the lack of overlapping nsSNVs between training and testing datasets
To compare InMeRF with 10 previously reported tools that were generated by an identical CADD training dataset (48), we generated InMeRF-CADD using the CADD training dataset (Supplementary Figure S1B). When a rank score was missing for a specific nsSNV in the testing datasets, an average of all rank scores for an AA substitution of interest was used as a rank score of the missing tool.
Application of InMeRF to nsSNVs associated with congenital myasthenic syndromes and spina bifida
We predicted the pathogenicity of 155 pathogenic nsSNVs and 125 common nsSNVs in seven major genes (DOK7, MUSK, AGRN, LRP4, CHRNE, COLQ and GFPT1) causing congenital myasthenic syndrome (CMS) (53,54), as well as in VANGL1 causing spina bifida.
RESULTS
A reason why we developed InMeRF
We identified p.R335C in VANGL1 in a patient with spina bifida. An arginine-to-cysteine (R-to-C) substitution causes a radical change in AA properties based on the BLOSUM62 score (55). Indeed, more pathogenic nsSNVs have been reported in radical AA substitutions compared to common nsSNVs (Figure 1). We thus pursued the pathogenicity of p.R335C, but found that p.R335C had no effect on subcellular localization of Vangl1, interaction of Vangl1 with SCRIB and embryonic development of zebrafish (see the Supplementary Information). This failure prompted us to make a prediction model for each AA substitution. Among 20 × 19 = 380 possible AA substitutions, 150 AA substitutions can occur by an SNV, whereas the other 230 AA substitutions require two or three nucleotide changes.
Figure 1.

The ratio of pathogenic nsSNVs to common nsSNVs of each AA substitution is plotted on each category of the BLOSUM62 score (55). The BLOSUM62 score of -3 like p.R335C in VANGL1 indicates a radical AA substitution, whereas the score of 3 indicates a slightly deleterious AA substitution. The ratios and BLOSUM62 scores of 150 AA substitutions are indicated in Supplementary Table S1B. P = 0.001 by the Jonckheere–Terpstra trend test, which is for testing ordered differences in medians, on R version 3.5.
Generation of InMeRF models
To circumvent a possible bias that makes radical AA changes being predicted to be pathogenic, we made an RF model to discriminate pathogenic and common nsSNVs for each of the 150 AA substitutions. InMeRF is thus comprised of 150 RF models representing all possible AA substitutions caused by an SNV. We used 72 556 pathogenic nsSNVs and 162 918 common nsSNVs in dbNSFP v4.0a to make our training dataset. To unbiasedly predict pathogenic and common nsSNVs, we used the same numbers of pathogenic and common nsSNVs for each RF modeling. The number of pathogenic or common nsSNVs used to make each RF model was on average 256.8 ranging from 12 to 1494 (Supplementary Table S1A). Feature values to differentiate pathogenic and common nsSNVs were obtained from rank scores of 34 tools in dbNSFP v4.0a. Each rank score represents a normalized score of a previously reported prediction tool with a rank score of 1 being pathogenic and a rank score of 0 being normal. In our RF models, pathogenic nsSNVs were predicted to be 1, and normal nsSNVs were predicted to be 0. A threshold to differentiate pathogenic and normal nsSNVs was set to 0.5.
Ten-fold cross-validation of InMeRF models generated by our training dataset
We evaluated the performance of our RF models by making receiver operating characteristic (ROC) and precision–recall (PR) curves by 10-fold cross-validation. We plotted an area under the curve (AUC) of an ROC curve of each AA substitution against the number of nsSNVs used to make each RF model (Figure 2A and Supplementary Table S1A). We similarly plotted an AUC of a PR curve of each AA substitution (Figure 2B and Supplementary Table S1A). We observed that ROC-AUCs and PR-AUCs were mostly independent of the number of nsSNVs in the training dataset, and even <500 nsSNVs mostly gave rise to ROC-AUCs and PR-AUCs of >0.9.
Figure 2.

Scatter plots of the AUC of an ROC curve (A) and a PR curve (B) against the number of nsSNVs in the training dataset. Values of 150 RF models are individually plotted.
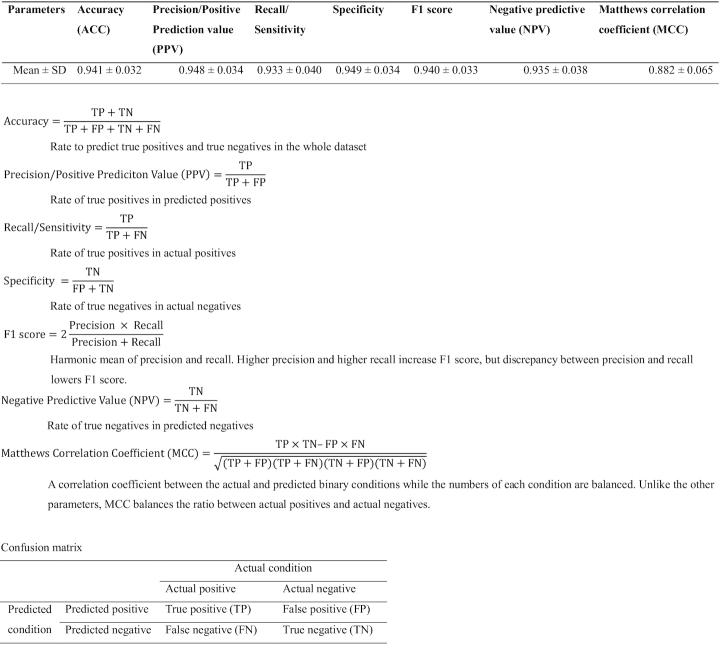
We next calculated seven statistical measures [accuracy, precision/positive prediction value (PPV), recall/sensitivity, specificity, F1 score, negative predictive value (NPV) and Matthews correlation coefficient (MCC)] according to the Human Mutation guidelines (48,56–57) using 10-fold cross-validation. Statistical measures of 150 RF models are indicated in Supplementary Table S1A, and their means and standard deviations (SDs) are indicated in Table 2. Among the seven statistical measures, MCC had the lowest mean statistical measure of 0.882, whereas specificity had the highest mean statistical measure of 0.949 (Table 2).
Table 2.
Seven parameters of InMeRF comprised of 150 RF models by 10-fold cross-validation to evaluate prediction performance indicated in the Human Mutation guidelines (48,56–57)
|
Comparison of InMeRF models with 25 other prediction tools in dbNSFP v4.0a
We compared InMeRF with 25 prediction tools including 4 recently reported tools (MVP, MPC, PrimateAI and DEOGEN2), which were newly added in dbNSFP v4.0a, using three testing datasets (VariBenchSelected, predictSNPSelected and SwissVarSelected) (Supplementary Table S2) (48). Compared to the four recently reported prediction tools, ROC-AUCs of InMeRF were ranked first in all three testing datasets (Figure 3). Similarly, compared to the 25 prediction tools, ROC-AUCs of InMeRF were ranked fourth in VariBenchSelected and first in predictSNPSelected and SwissVarSelected (Supplementary Figure S2 and Supplementary Table S3). On average, both ROC-AUC and PR-AUC of InMeRF were ranked first compared to the 25 prediction tools (Supplementary Table S3D). This analysis, however, can be possibly affected by type 1 circularity, which represents that the same nsSNVs are included in both training and testing datasets (48). Scores given by InMeRF and by the 25 prediction tools for each nsSNV in the three testing datasets are indicated in Supplementary Table S4.
Figure 3.

ROC and PR curves of InMeRF and four newly added prediction tools in dbNSFP v4.0a using testing datasets of VariBenchSelected (A, B), predictSNPSelected (C, D) and SwissVarSelected (E, F). ROC and PR curves of InMeRF and 25 other tools including the 4 tools in this figure are indicated in Supplementary Figure S2.
Comparison of InMeRF models generated by the CADD training dataset with seven other tools generated by the CADD training dataset
Grimm et al. (48) generated 10 tools using an identical training dataset derived from CADD (4). They also made three independent testing datasets (VariBenchSelected, predictSNPSelected and SwissVarSelected) that had no shared nsSNVs with each other or with the CADD training dataset (complete lack of type 1 circularity). One of the 10 tools, MutationTaster (30), however, had the type 1 circularity stated earlier. Another tool, FATHMM’s weighted (FATHMM-W) (13,48), had type 2 circularity, which represents that the model is tuned to differentiate genes carrying only common nsSNVs and genes carrying only pathogenic nsSNVs, but not to differentiate nsSNVs within a single gene (48). Excluding these two tools, we compared InMeRF with the eight remaining tools. To this end, we generated InMeRF-CADD using the CADD training dataset (Supplementary Figure S1B). Scores and labels given by InMeRF-CADD and by the eight tools for each nsSNV in the three testing datasets are indicated in Supplementary Table S5. Statistical measures of InMeRF-CADD and the eight tools are shown in Supplementary Table S6. The mean ROC-AUCs were ranked in the order of InMeRF-CADD, PolyPhen2, MutationAssessor, SIFT, CADD, FATHMM-U, LRT, PhyloP and GERP++. The ROC and PR curves of the four top-ranked tools (InMeRF-CADD, PolyPhen2, MutationAssessor and SIFT) are shown in Figure 4. Similarly, the ROC and PR curves of InMeRF-CADD and the eight tools are shown in Supplementary Figure S3. Although the ROC-AUC of InMeRF-CADD was ranked first for each of the three datasets, PR-AUC of InMeRF-CADD was ranked second, third and first for VariBenchSelected, predictSNPSelected and SwissVarSelected, respectively (Supplementary Table S7).
Figure 4.

ROC and PR curves of InMeRF-CADD and three top-ranked tools using testing datasets of VariBenchSelected (A, B), predictSNPSelected (C, D) and SwissVarSelected (E, F). InMeRF-CADD and the three tools (48) were generated by an identical CADD training dataset. ROC and PR curves of InMeRF-CADD and eight other tools including the three tools in this figure are indicated in Supplementary Figure S3.
Application of InMeRF to congenital myasthenic syndromes and spina bifida
DOK7, MUSK, AGRN, LRP4, CHRNE, COLQ and GFPT1 are frequently mutated genes in CMS (53,54). In addition, our motivation to develop InMeRF arose from our failure in proving the pathogenicity of p.R335C in VANGL1 in spina bifida. We thus applied InMeRF to 155 pathogenic nsSNVs and 125 common nsSNVs in these eight genes. InMeRF predicted that 146 out of 155 truly pathogenic nsSNVs are pathogenic (sensitivity = 0.942) and that 106 of 125 truly common nsSNVs are normal (specificity = 0.848) (Supplementary Table S8). The sensitivity of 0.942 with these eight genes was comparable to the sensitivity (0.930 ± 0.040, mean and SD of 150 RF models) obtained by 10-fold cross-validation of the training dataset (Table 2). In contrast, the specificity of 0.848 was slightly inferior to the specificity (0.949 ± 0.034, mean and SD of 150 RF models) obtained by 10-fold cross-validation (Table 2). Predictions of pathogenic and common nsSNVs in MUSK and VANGL1 are schematically shown in Figure 5.
Figure 5.

Examples of application of InMeRF to nsSNVs in MUSK (A) and VANGL1 (B). Domains and the positions of nsSNVs are drawn to scale. Pathogenic nsSNVs and common nsSNVs with MAF >0.001 are indicated in red and blue letters, respectively. The number of nsSNVs in each category is indicated in parentheses. Pathogenic and common nsSNVs that were correctly predicted by InMeRF are indicated by open circles, whereas erroneously predicted SNVs are indicated by closed circles. (A) Ig, immunoglobulin domains; CRD_FZ, frizzled-like cysteine-rich domain; TMD, transmembrane domain; and Pkinase_Tyr, protein tyrosine kinase. (B) TMD, transmembrane domain. Arrow indicates the position of p.R335C (see the Supplementary Information).
Web service of InMeRF
We made a web service for InMeRF at https://www.med.nagoya-u.ac.jp/neurogenetics/InMeRF/. The InMeRF web service accepts (i) a genomic coordinate according to GRCh37/hg19, (ii) a genomic coordinate according to GRCh38/hg38, (iii) HUGO Gene Nomenclature Committee gene symbol or (iv) Ensembl Transcript ID. An nsSNV is predicted to be pathogenic when the probability of pathogenicity is ≥0.5, and the predicted result is returned to the same web page. When a genomic coordinate is entered, prediction scores of all possible nsSNVs for all transcripts annotated in Ensembl Release 94 are returned. Figure 6 shows the prediction result of chr11:46897102 associated with CMS (58). We also analyzed all nsSNVs registered in dbNSFP v4.0a according to the Ensembl Release 94 annotations on GRCh37/hg19 and GRCh38/hg38. dbNSFP includes all possible nsSNVs in the human genome by in silico saturation mutagenesis, and we followed the strategy of dbNSFP. We made the genome-wide pre-analyzed InMeRF scores available under the download tab of the InMeRF web service.
Figure 6.

A screenshot of InMeRF web service. We previously reported that a heteroallelic C→T substitution in LRP4 at position 46 897 102 (GRCh37/hg19) on chromosome 11 predicting p.R1277H (red circle) in a patient with CMS compromises binding of LRP4 to MuSK and agrin, and reduces clustering of acetylcholine receptor (58). When the genomic coordinate ‘chr11:46897102’ is entered in the InMeRF web service, the result shows up on the same window.
DISCUSSION
Failure to identify pathogenicity of p.R335C in VANGL1 prompted us to develop InMeRF to predict the pathogenicity of genome-wide nsSNVs. We hypothesized that most of the currently available tools tend to predict that minor AA changes are benign, whereas major AA changes are damaging. We thus made individual RF models for 150 AA substitutions. One possible disadvantage of our approach was that the numbers of nsSNVs used to generate an RF model became low. However, we were able to make RF models with ROC-AUC ≥ 0.845 and PR-AUC ≥ 0.882 even with small numbers of training variants (Figure 2 and Supplementary Table S1A). As is commonly recognized in machine learning, we observed that RF models generated with equal numbers of pathogenic and common nsSNVs made more dependable models (Supplementary Table S1A) than RF models generated with all pathogenic and common nsSNVs (Supplementary Table S1B). We suppose that individual RF modeling for 150 AA substitutions enhanced the advantage of balancing pathogenic and common nsSNVs. InMeRF was superior to or at least not inferior to the other tools by comparing InMeRF with 25 other prediction tools in dbNSFP v4.0a (Figure 3, Supplementary Figure S2 and Supplementary Table S3) and by comparing InMeRF-CADD with 8 other tools (Figure 4, Supplementary Figure S3 and Supplementary Table S7) that were generated by the CADD training dataset.
Type 1 circularity indicates that the same variants are included in both training and testing datasets (48). With type 1 circularity, a tool can efficiently predict pathogenicity of nsSNVs in the training dataset, but the efficiency is reduced for novel nsSNVs. Prediction tools of nsSNVs are easily subject to type 1 circularity, which spuriously increase prediction accuracies (48). Although the comparison of InMeRF with 25 other tools could be affected by type 1 circularity, the comparison of InMeRF-CADD with the 8 CADD-based tools should be free from type 1 circularity.
Type 2 circularity indicates that a model differentiates genes exclusively with common nsSNVs and genes exclusively with pathogenic nsSNVs, but not both in a single gene (48). The SwissVarSelected testing dataset contains many genes carrying both pathogenic and common nsSNVs in a single gene (48). We found that both ROC-AUC and PR-AUC of InMeRF-CADD were ranked first with the SwissVarSelected testing dataset (Supplementary Table S7). Lack of type 2 circularity in InMeRF is also suggested by representative analysis of pathogenic and common nsSNVs in seven frequently mutated genes (DOK7, MUSK, AGRN, LRP4, CHRNE, COLQ and GFPT1) causing CMS, and the VANGL1 gene causing spina bifida (Figure 5 and Supplementary Table S8).
In RF modeling of InMeRF, we used rank scores of 34 previously reported tools as feature values (Supplementary Figure S1). Analysis of feature importance of each tool for 150 RF models disclosed that REVEL (10), MetaLR (6), VEST4 (11), MVP (16), DEOGEN2 (9) and MetaSVM (6) provided the best six feature values in InMeRF (Supplementary Table S9). These six tools have been reported in or after year 2016. Comparison of ROC-AUC of InMeRF with those of 25 other tools indeed showed that REVEL (10), MetaLR (6), VEST4 (11), MVP (16), DEOGEN2 (9) and MetaSVM (6) were on average ranked second to seventh after InMeRF (Supplementary Table S3D). We also reduced the number of feature values one by one in descending order of the feature importance (Supplementary Table S9), and generated 150 RF models. ROC-AUC remained high even when we eliminated less dependable feature values (Supplementary Figure S4). InMeRF is thus largely dependent on the performance of these recently reported tools. Superiority of InMeRF over these recently reported tools may lie in the ensemble of AA substitution-specific RF models.
Development of InMeRF disclosed that the degree of a change in AA properties is likely to have a substantial effect on the prediction of pathogenicity. Lastly, our first motivation to develop InMeRF was satisfied by finding that p.R335C in VANGL1 was predicted to be benign with an InMeRF score of 0.342.
DATA AVAILABILITY
The InMeRF web service and the genome-wide InMeRF scores are openly available at https://www.med.nagoya-u.ac.jp/neurogenetics/InMeRF/. The ClinVar, dbNSFP and CADD were obtained from openly available databases at https://www.ncbi.nlm.nih.gov/clinvar/, https://sites.google.com/site/jpopgen/dbNSFP/ and https://cadd.gs.washington.edu/, respectively. HGMD Pro is a commercial database, and is available upon purchase from QIAGEN.
Supplementary Material
ACKNOWLEDGEMENTS
Author contributions: K.O. conceived the idea. J.-i.T., K.N. and R.Y. designed the methods and performed in silico analyses. K.N. performed cellular studies under the supervision of M.I. N.H. provided clinical information on a patient. H.H. performed zebrafish studies. J.-i.T., M.I., H.H. and K.O. wrote the manuscript. T.O. helped to provide variant databases. All authors read and approved the final manuscript.
SUPPLEMENTARY DATA
Supplementary Data are available at NARGAB Online.
FUNDING
Japan Society for the Promotion of Science [18K14684, 16H04657 and 19H03329]; Ministry of Health, Labour, and Welfare, Japan [H24-Shinkei-Kin-Ippan-005 and H29-Nanchi-Ippan-030]; Japan Agency for Medical Research and Development [19ek0109230, 20gm1010002, 20ek0109281 and 20bm0804005]; National Center of Neurology and Psychiatry (2-5); Hori Sciences and Arts Foundation.
Conflict of interest statement. None declared.
REFERENCES
- 1. Lek M., Karczewski K.J., Minikel E.V., Samocha K.E., Banks E., Fennell T., O’Donnell-Luria A.H., Ware J.S., Hill A.J., Cummings B.B. et al.. Analysis of protein-coding genetic variation in 60,706 humans. Nature. 2016; 536:285–291. [DOI] [PMC free article] [PubMed] [Google Scholar]
- 2. Stenson P.D., Mort M., Ball E.V., Evans K., Hayden M., Heywood S., Hussain M., Phillips A.D., Cooper D.N.. The Human Gene Mutation Database: towards a comprehensive repository of inherited mutation data for medical research, genetic diagnosis and next-generation sequencing studies. Hum. Genet. 2017; 136:665–677. [DOI] [PMC free article] [PubMed] [Google Scholar]
- 3. Landrum M.J., Lee J.M., Benson M., Brown G.R., Chao C., Chitipiralla S., Gu B., Hart J., Hoffman D., Jang W. et al.. ClinVar: improving access to variant interpretations and supporting evidence. Nucleic Acids Res. 2018; 46:D1062–D1067. [DOI] [PMC free article] [PubMed] [Google Scholar]
- 4. Kircher M., Witten D.M., Jain P., O’Roak B.J., Cooper G.M., Shendure J.. A general framework for estimating the relative pathogenicity of human genetic variants. Nat. Genet. 2014; 46:310–315. [DOI] [PMC free article] [PubMed] [Google Scholar]
- 5. Rentzsch P., Witten D., Cooper G.M., Shendure J., Kircher M.. CADD: predicting the deleteriousness of variants throughout the human genome. Nucleic Acids Res. 2019; 47:D886–D894. [DOI] [PMC free article] [PubMed] [Google Scholar]
- 6. Dong C., Wei P., Jian X., Gibbs R., Boerwinkle E., Wang K., Liu X.. Comparison and integration of deleteriousness prediction methods for nonsynonymous SNVs in whole exome sequencing studies. Hum. Mol. Genet. 2015; 24:2125–2137. [DOI] [PMC free article] [PubMed] [Google Scholar]
- 7. Li B., Krishnan V.G., Mort M.E., Xin F., Kamati K.K., Cooper D.N., Mooney S.D., Radivojac P.. Automated inference of molecular mechanisms of disease from amino acid substitutions. Bioinformatics. 2009; 25:2744–2750. [DOI] [PMC free article] [PubMed] [Google Scholar]
- 8. Pejaver V., Mooney S.D., Radivojac P.. Missense variant pathogenicity predictors generalize well across a range of function-specific prediction challenges. Hum. Mutat. 2017; 38:1092–1108. [DOI] [PMC free article] [PubMed] [Google Scholar]
- 9. Raimondi D., Tanyalcin I., Ferte J., Gazzo A., Orlando G., Lenaerts T., Rooman M., Vranken W.. DEOGEN2: prediction and interactive visualization of single amino acid variant deleteriousness in human proteins. Nucleic Acids Res. 2017; 45:W201–W206. [DOI] [PMC free article] [PubMed] [Google Scholar]
- 10. Ioannidis N.M., Rothstein J.H., Pejaver V., Middha S., McDonnell S.K., Baheti S., Musolf A., Li Q., Holzinger E., Karyadi D. et al.. REVEL: an ensemble method for predicting the pathogenicity of rare missense variants. Am. J. Hum. Genet. 2016; 99:877–885. [DOI] [PMC free article] [PubMed] [Google Scholar]
- 11. Carter H., Douville C., Stenson P.D., Cooper D.N., Karchin R.. Identifying Mendelian disease genes with the variant effect scoring tool. BMC Genomics. 2013; 14(Suppl. 3):S3. [DOI] [PMC free article] [PubMed] [Google Scholar]
- 12. Jagadeesh K.A., Wenger A.M., Berger M.J., Guturu H., Stenson P.D., Cooper D.N., Bernstein J.A., Bejerano G.. M-CAP eliminates a majority of variants of uncertain significance in clinical exomes at high sensitivity. Nat. Genet. 2016; 48:1581–1586. [DOI] [PubMed] [Google Scholar]
- 13. Shihab H.A., Gough J., Cooper D.N., Stenson P.D., Barker G.L., Edwards K.J., Day I.N., Gaunt T.R.. Predicting the functional, molecular, and phenotypic consequences of amino acid substitutions using hidden Markov models. Hum. Mutat. 2013; 34:57–65. [DOI] [PMC free article] [PubMed] [Google Scholar]
- 14. Quang D., Chen Y., Xie X.. DANN: a deep learning approach for annotating the pathogenicity of genetic variants. Bioinformatics. 2015; 31:761–763. [DOI] [PMC free article] [PubMed] [Google Scholar]
- 15. Sundaram L., Gao H., Padigepati S.R., McRae J.F., Li Y., Kosmicki J.A., Fritzilas N., Hakenberg J., Dutta A., Shon J. et al.. Predicting the clinical impact of human mutation with deep neural networks. Nat. Genet. 2018; 50:1161–1170. [DOI] [PMC free article] [PubMed] [Google Scholar]
- 16. Qi H., Chen C., Zhang H., Long J.J., Chung W.K., Guan Y., Shen Y.. MVP: predicting pathogenicity of missense variants by deep neural networks. 2018; 2 April, 2018, preprint: not peer reviewed 10.1101/259390. [DOI]
- 17. Shibata A., Okuno T., Rahman M.A., Azuma Y., Takeda J., Masuda A., Selcen D., Engel A.G., Ohno K.. IntSplice: prediction of the splicing consequences of intronic single-nucleotide variations in the human genome. J. Hum. Genet. 2016; 61:633–640. [DOI] [PubMed] [Google Scholar]
- 18. Mao R., Raj Kumar P.K., Guo C., Zhang Y., Liang C.. Comparative analyses between retained introns and constitutively spliced introns in Arabidopsis thaliana using random forest and support vector machine. PLoS One. 2014; 9:e104049. [DOI] [PMC free article] [PubMed] [Google Scholar]
- 19. Nair V., Dutta M., Manian S.S., S R.K., Jayaraman V.K.. Identification of penicillin-binding proteins employing support vector machines and random forest. Bioinformation. 2013; 9:481–484. [DOI] [PMC free article] [PubMed] [Google Scholar]
- 20. Sherry S.T., Ward M.H., Kholodov M., Baker J., Phan L., Smigielski E.M., Sirotkin K.. dbSNP: the NCBI database of genetic variation. Nucleic Acids Res. 2001; 29:308–311. [DOI] [PMC free article] [PubMed] [Google Scholar]
- 21. Liu X., Wu C., Li C., Boerwinkle E.. dbNSFP v3.0: a one-stop database of functional predictions and annotations for human nonsynonymous and splice-site SNVs. Hum. Mutat. 2016; 37:235–241. [DOI] [PMC free article] [PubMed] [Google Scholar]
- 22. Huang Y.F., Gulko B., Siepel A.. Fast, scalable prediction of deleterious noncoding variants from functional and population genomic data. Nat. Genet. 2017; 49:618–624. [DOI] [PMC free article] [PubMed] [Google Scholar]
- 23. Ng P.C., Henikoff S.. Predicting deleterious amino acid substitutions. Genome Res. 2001; 11:863–874. [DOI] [PMC free article] [PubMed] [Google Scholar]
- 24. Ng P.C., Henikoff S.. Accounting for human polymorphisms predicted to affect protein function. Genome Res. 2002; 12:436–446. [DOI] [PMC free article] [PubMed] [Google Scholar]
- 25. Ng P.C., Henikoff S.. SIFT: predicting amino acid changes that affect protein function. Nucleic Acids Res. 2003; 31:3812–3814. [DOI] [PMC free article] [PubMed] [Google Scholar]
- 26. Kumar P., Henikoff S., Ng P.C.. Predicting the effects of coding non-synonymous variants on protein function using the SIFT algorithm. Nat. Protoc. 2009; 4:1073–1081. [DOI] [PubMed] [Google Scholar]
- 27. Vaser R., Adusumalli S., Leng S.N., Sikic M., Ng P.C.. SIFT missense predictions for genomes. Nat. Protoc. 2016; 11:1–9. [DOI] [PubMed] [Google Scholar]
- 28. Adzhubei I.A., Schmidt S., Peshkin L., Ramensky V.E., Gerasimova A., Bork P., Kondrashov A.S., Sunyaev S.R.. A method and server for predicting damaging missense mutations. Nat. Methods. 2010; 7:248–249. [DOI] [PMC free article] [PubMed] [Google Scholar]
- 29. Chun S., Fay J.C.. Identification of deleterious mutations within three human genomes. Genome Res. 2009; 19:1553–1561. [DOI] [PMC free article] [PubMed] [Google Scholar]
- 30. Schwarz J.M., Cooper D.N., Schuelke M., Seelow D.. MutationTaster2: mutation prediction for the deep-sequencing age. Nat. Methods. 2014; 11:361–362. [DOI] [PubMed] [Google Scholar]
- 31. Reva B., Antipin Y., Sander C.. Predicting the functional impact of protein mutations: application to cancer genomics. Nucleic Acids Res. 2011; 39:e118. [DOI] [PMC free article] [PubMed] [Google Scholar]
- 32. Choi Y., Chan A.P.. PROVEAN web server: a tool to predict the functional effect of amino acid substitutions and indels. Bioinformatics. 2015; 31:2745–2747. [DOI] [PMC free article] [PubMed] [Google Scholar]
- 33. Choi Y., Sims G.E., Murphy S., Miller J.R., Chan A.P.. Predicting the functional effect of amino acid substitutions and indels. PLoS One. 2012; 7:e46688. [DOI] [PMC free article] [PubMed] [Google Scholar]
- 34. Samocha K.E., Kosmicki J.A., Karczewski K.J., O’Donnell-Luria A.H., Pierce-Hoffman E., MacArthur D.G., Neale B.M., Daly M.J.. Regional missense constraint improves variant deleteriousness prediction. 2017; 12 June 2017, preprint: not peer reviewed 10.1101/148353. [DOI]
- 35. Shihab H.A., Rogers M.F., Gough J., Mort M., Cooper D.N., Day I.N., Gaunt T.R., Campbell C.. An integrative approach to predicting the functional effects of non-coding and coding sequence variation. Bioinformatics. 2015; 31:1536–1543. [DOI] [PMC free article] [PubMed] [Google Scholar]
- 36. Rogers M.F., Shihab H.A., Mort M., Cooper D.N., Gaunt T.R., Campbell C.. FATHMM-XF: accurate prediction of pathogenic point mutations via extended features. Bioinformatics. 2018; 34:511–513. [DOI] [PMC free article] [PubMed] [Google Scholar]
- 37. Ionita-Laza I., McCallum K., Xu B., Buxbaum J.D.. A spectral approach integrating functional genomic annotations for coding and noncoding variants. Nat. Genet. 2016; 48:214–220. [DOI] [PMC free article] [PubMed] [Google Scholar]
- 38. Lu Q., Hu Y., Sun J., Cheng Y., Cheung K.H., Zhao H.. A statistical framework to predict functional non-coding regions in the human genome through integrated analysis of annotation data. Sci. Rep. 2015; 5:10576. [DOI] [PMC free article] [PubMed] [Google Scholar]
- 39. Gulko B., Hubisz M.J., Gronau I., Siepel A.. A method for calculating probabilities of fitness consequences for point mutations across the human genome. Nat. Genet. 2015; 47:276–283. [DOI] [PMC free article] [PubMed] [Google Scholar]
- 40. Gronau I., Arbiza L., Mohammed J., Siepel A.. Inference of natural selection from interspersed genomic elements based on polymorphism and divergence. Mol. Biol. Evol. 2013; 30:1159–1171. [DOI] [PMC free article] [PubMed] [Google Scholar]
- 41. Arbiza L., Gronau I., Aksoy B.A., Hubisz M.J., Gulko B., Keinan A., Siepel A.. Genome-wide inference of natural selection on human transcription factor binding sites. Nat. Genet. 2013; 45:723–729. [DOI] [PMC free article] [PubMed] [Google Scholar]
- 42. Davydov E.V., Goode D.L., Sirota M., Cooper G.M., Sidow A., Batzoglou S.. Identifying a high fraction of the human genome to be under selective constraint using GERP++. PLoS Comput. Biol. 2010; 6:e1001025. [DOI] [PMC free article] [PubMed] [Google Scholar]
- 43. Pollard K.S., Hubisz M.J., Rosenbloom K.R., Siepel A.. Detection of nonneutral substitution rates on mammalian phylogenies. Genome Res. 2010; 20:110–121. [DOI] [PMC free article] [PubMed] [Google Scholar]
- 44. Siepel A., Bejerano G., Pedersen J.S., Hinrichs A.S., Hou M., Rosenbloom K., Clawson H., Spieth J., Hillier L.W., Richards S. et al.. Evolutionarily conserved elements in vertebrate, insect, worm, and yeast genomes. Genome Res. 2005; 15:1034–1050. [DOI] [PMC free article] [PubMed] [Google Scholar]
- 45. Lindblad-Toh K., Garber M., Zuk O., Lin M.F., Parker B.J., Washietl S., Kheradpour P., Ernst J., Jordan G., Mauceli E. et al.. A high-resolution map of human evolutionary constraint using 29 mammals. Nature. 2011; 478:476–482. [DOI] [PMC free article] [PubMed] [Google Scholar]
- 46. Garber M., Guttman M., Clamp M., Zody M.C., Friedman N., Xie X.. Identifying novel constrained elements by exploiting biased substitution patterns. Bioinformatics. 2009; 25:i54–i62. [DOI] [PMC free article] [PubMed] [Google Scholar]
- 47. Pedregosa F., Varoquaux G., Gramfort A., Michel V., Thirion B., Grisel O., Blondel M., Prettenhofer P., Weiss R., Dubourg V. et al.. scikit-learn: machine learning in Python. J. Mach. Learn. Res. 2011; 12:2825–2830. [Google Scholar]
- 48. Grimm D.G., Azencott C.A., Aicheler F., Gieraths U., MacArthur D.G., Samocha K.E., Cooper D.N., Stenson P.D., Daly M.J., Smoller J.W. et al.. The evaluation of tools used to predict the impact of missense variants is hindered by two types of circularity. Hum. Mutat. 2015; 36:513–523. [DOI] [PMC free article] [PubMed] [Google Scholar]
- 49. Thusberg J., Olatubosun A., Vihinen M.. Performance of mutation pathogenicity prediction methods on missense variants. Hum. Mutat. 2011; 32:358–368. [DOI] [PubMed] [Google Scholar]
- 50. Sasidharan Nair P., Vihinen M.. VariBench: a benchmark database for variations. Hum. Mutat. 2013; 34:42–49. [DOI] [PubMed] [Google Scholar]
- 51. Bendl J., Stourac J., Salanda O., Pavelka A., Wieben E.D., Zendulka J., Brezovsky J., Damborsky J.. PredictSNP: robust and accurate consensus classifier for prediction of disease-related mutations. PLoS Comput. Biol. 2014; 10:e1003440. [DOI] [PMC free article] [PubMed] [Google Scholar]
- 52. Mottaz A., David F.P., Veuthey A.L., Yip Y.L.. Easy retrieval of single amino-acid polymorphisms and phenotype information using SwissVar. Bioinformatics. 2010; 26:851–852. [DOI] [PMC free article] [PubMed] [Google Scholar]
- 53. Ohno K., Ohkawara B., Ito M.. Recent advances in congenital myasthenic syndromes. Clin. Exp. Neuroimmunol. 2016; 7:246–259. [Google Scholar]
- 54. Ohno K., Ohkawara B., Ito M.. Agrin–LRP4–MuSK signaling as a therapeutic target for myasthenia gravis and other neuromuscular disorders. Expert Opin. Ther. Targets. 2017; 21:949–958. [DOI] [PubMed] [Google Scholar]
- 55. Henikoff S., Henikoff J.G.. Amino acid substitution matrices from protein blocks. Proc. Natl Acad. Sci. U.S.A. 1992; 89:10915–10919. [DOI] [PMC free article] [PubMed] [Google Scholar]
- 56. Vihinen M. Guidelines for reporting and using prediction tools for genetic variation analysis. Hum. Mutat. 2013; 34:275–282. [DOI] [PubMed] [Google Scholar]
- 57. Vihinen M. How to evaluate performance of prediction methods? Measures and their interpretation in variation effect analysis. BMC Genomics. 2012; 13(Suppl. 4):S2. [DOI] [PMC free article] [PubMed] [Google Scholar]
- 58. Ohkawara B., Cabrera-Serrano M., Nakata T., Milone M., Asai N., Ito K., Ito M., Masuda A., Ito Y., Engel A.G. et al.. LRP4 third beta-propeller domain mutations cause novel congenital myasthenia by compromising agrin-mediated MuSK signaling in a position-specific manner. Hum. Mol. Genet. 2014; 23:1856–1868. [DOI] [PMC free article] [PubMed] [Google Scholar]
Associated Data
This section collects any data citations, data availability statements, or supplementary materials included in this article.
Supplementary Materials
Data Availability Statement
The InMeRF web service and the genome-wide InMeRF scores are openly available at https://www.med.nagoya-u.ac.jp/neurogenetics/InMeRF/. The ClinVar, dbNSFP and CADD were obtained from openly available databases at https://www.ncbi.nlm.nih.gov/clinvar/, https://sites.google.com/site/jpopgen/dbNSFP/ and https://cadd.gs.washington.edu/, respectively. HGMD Pro is a commercial database, and is available upon purchase from QIAGEN.