Stimulation of muscarinic Gq-coupled receptors initially depletes phosphoinositide phosphatidylinositol 4,5-bisphosphate from the plasma membrane. Myeong et al. show that phosphoinositides subsequently regenerate during sustained receptor stimulation as a consequence of profound PI 4-kinase pathway acceleration and not desensitization of receptors.
Abstract
The dynamic metabolism of membrane phosphoinositide lipids involves several cellular compartments including the ER, Golgi, and plasma membrane. There are cycles of phosphorylation and dephosphorylation and of synthesis, transfer, and breakdown. The simplified phosphoinositide cycle comprises synthesis of phosphatidylinositol in the ER, transport, and phosphorylation in the Golgi and plasma membranes to generate phosphatidylinositol 4,5-bisphosphate, followed by receptor-stimulated hydrolysis in the plasma membrane and return of the components to the ER for reassembly. Using probes for specific lipid species, we have followed and analyzed the kinetics of several of these events during stimulation of M1 muscarinic receptors coupled to the G-protein Gq. We show that during long continued agonist action, polyphosphorylated inositol lipids are initially depleted but then regenerate while agonist is still present. Experiments and kinetic modeling reveal that the regeneration results from gradual but massive up-regulation of PI 4-kinase pathways rather than from desensitization of receptors. Golgi pools of phosphatidylinositol 4-phosphate and the lipid kinase PI4KIIIα (PI4KA) contribute to this homeostatic regeneration. This powerful acceleration, which may be at the level of enzyme activity or of precursor and product delivery, reveals strong regulatory controls in the phosphoinositide cycle.
Introduction
This paper concerns the dynamics of phosphoinositide membrane lipids in living cells. Polyphosphoinositides, a family of low-abundance membrane phospholipids, regulate many vital functions of the cell (Anderson et al., 2013; Balla, 2013; Traynor-Kaplan et al., 2017; Dickson and Hille, 2019). The parent compound phosphatidylinositol (PtdIns) can be phosphorylated on the 3-, 4-, and 5-hydroxyl positions of its myo-inositol headgroup to form a total of seven polyphosphoinositide species. Each has specific signaling roles. Here, we focus on dynamic changes in pools of two species, phosphatidylinositol 4-phosphate (PtdIns4P) and phosphatidylinositol 4,5-bisphosphate (PtdIns(4,5)P2). These lipid species are generated from PtdIns by the sequential action of lipid kinases in the phosphatidylinositol 4-kinase (PI4K) and phosphatidylinositol 4-phosphate 5-kinase (PIP5K) families (Fig. 1). The phosphorylation can be removed by lipid 4- and 5-phosphatases. PtdIns(4,5)P2 is also hydrolyzed and depleted by activation of phospholipase Cβ (PLCβ) at the plasma membrane (PM) during stimulation of Gq-coupled receptors. This cleavage generates two potent second messengers, inositol trisphosphate (Ins(1,4,5)P3), which enters the cytoplasm, and diacylglycerol (DAG), which remains in the membrane. PtdIns4P is likely also a substrate of PLCβ.
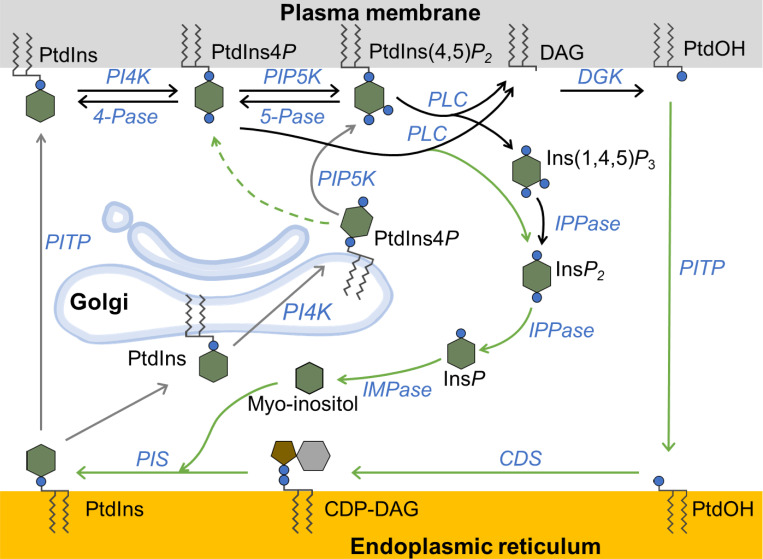
Figure 1.
Schematic of the phosphoinositide cycle in the PM, Golgi, and ER. Phosphoinositides, lipid phosphatases, and lipid kinases are shown in the PM, ER, and Golgi. Enzymes are shown in blue, fatty acid tails as squiggly lines, inositol as a hexagon, and phosphate as small filled circles. In the PM, PtdIns is phosphorylated by PI4K to PtdIns4P, which then is phosphorylated to PtdIns(4,5)P2 by PIP5K. The phosphatases PtdIns4P–4-phosphatase (4-Pase) and PtdIns(4,5)P2–5-phosphatase (5-Pase) mediate dephosphorylation reactions. Activation of PLCβ hydrolyzes PtdIns(4,5)P2 to Ins(1,4,5)P3 and DAG and may also act on PtdIns4P. Ins(1,4,5)P3 is dephosphorylated stepwise, the final step being catalyzed by a lithium-sensitive IMPase. Enzymes in the ER regenerate PtdIns, which can translocate to the PM or Golgi. Golgi PtdIns can be converted to PtdIns4P, which in turn goes to the PM to maintain PtdIns(4,5)P2. Reaction arrows are color-coded according to whether they were included in our first simulation model (black), our second model (black and gray), or neither (green). CDP, cytidine diphosphate; CDS, cytidine diphosphate DAG synthase; DGK, DAG kinase; IPPase, inositol polyphosphate phosphatase; PIS, PtdIns synthase.
Individual phosphoinositides occupy the cytoplasmic leaflet of specific subcellular membranes (Fig. 1): PtdIns, the most abundant phosphoinositide, is on most intracellular membranes but quite sparse on the PM (Pemberton et al., 2020; Zewe et al., 2020); PtdIns4P is on the PM, Golgi, and secretory, transport, and endo/lysosomal vesicles; and PtdIns(4,5)P2 is predominantly on the PM and serves as a signature lipid for that membrane (Balla, 2013; Hammond et al., 2014). Beyond being the precursor of Ins(1,4,5)P3 and DAG second messengers, PM PtdIns(4,5)P2 is a required regulatory cofactor for numerous pumps and transporters as well as for exocytosis and endocytosis (Hille et al., 2015). In addition, receptor-mediated depletion of PtdIns(4,5)P2 can increase neuronal excitability by modulating ion channels (Zaika et al., 2007).
Fig. 1 represents some of the elements of the PtdIns cycle of synthesis and breakdown as a series of enzymatic and transport steps. We are interested in the subcellular localization and regulation of the lipid 4- and 5-kinase reactions and the regeneration of polyphosphorylated inositide pools while they are being depleted by activation of PLC. Many published papers described the depletion of PtdIns(4,5)P2 during activation of PLC by Gq-coupled receptors such as muscarinic M1 or angiotensin AT1 receptors (Kirk et al., 1981; Nakanishi et al., 1994; Willars et al., 1998; Horowitz et al., 2005; Li et al., 2005; Zaika et al., 2006; Bojjireddy et al., 2014; Tóth et al., 2016; Traynor-Kaplan et al., 2017). Our study was motivated by the frequently observed but not yet analyzed finding that if agonist application is maintained, the depleted PtdIns(4,5)P2 pool slowly starts to grow again (Nakanishi et al., 1994; Li et al., 2005; Zaika et al., 2006; Bojjireddy et al., 2014; Tóth et al., 2016). We reasoned that some aspects of phosphoinositide metabolism must be altered slowly in response to signals generated by agonist action, counteracting the initial lipid depletion. After measuring the muscarinic receptor-induced depletion and regeneration of PtdIns(4,5)P2 and PtdIns4P with optical probes, we tested hypotheses for the mechanisms of lipid regeneration using kinetic simulation in the context of Fig. 1. Of the two principal possibilities, acceleration of lipid kinases versus receptor desensitization with slowing of PLC, we provide strong support and quantitative description for kinase acceleration. Mammalian cells express four types of PI4K enzymes, PI4KIIα, PI4KIIβ, PI4KIIIα, and PI4KIIIβ (Balla et al., 2008). We show that regeneration depends mostly on PI4KIIIα (gene name PI4KA). Our analysis also concludes that a significant fraction of the regenerated PM PtdIns(4,5)P2 is derived from PtdIns4P in the Golgi rather than from PtdIns4P in the PM.
Materials and methods
Cell culture and gene transfection
All experiments except mass spectrometry used the tsA201 cell line (Sigma) maintained with 5% CO2 at 37°C in Dulbecco’s modified Eagle’s medium culture medium (Gibco) supplemented with 10% FBS (Sigma) and 2% penicillin/streptomycin. Cells (passage 15–40) were transfected at ∼75% confluency and subsequently plated on poly-L-lysine–coated coverglass chips (#0; Thomas Scientific). X-tremeGENE 9 (Sigma) and cDNA plasmids were used for transfection.
Plasmids for the pleckstrin homology domain (PH) of PLCδ1 (PHPLCδ1)–CFP and PHPLCδ1-YFP were gifts from Dr. Kees Jalink (van Rheenen et al., 2005); PHFAPP-YFP, OSH-GFP, TGN38–FRB–CFP, and mtq-FAM126A from Dr. Tamas Balla (Balla et al., 2005; Szentpetery et al., 2010); PJ-Sac1–FKBP-mRFP and PJ-dead–FKBP-mRFP from Dr. Gerald R.V. Hammond (Hammond et al., 2012); TubbycR332H-YFP from Dr. Andrew Tinker (Quinn et al., 2008); M5R, CFP-vector, YFP-vector, CFP-YFP concatemer, C1A-CFP, and C1A-YFP from Dr. Insuk So (Myeong et al., 2015; Myeong et al., 2018); LIBRAvIII from Dr. Akihiko Tanimura (Tanimura et al., 2004); giantin-FRB-CFP from Dr. Takanari Inoue (Komatsu et al., 2010); PI4KІІІα-mcherry, TTC7, and EFR3 from Dr. Pietro De Camilli (Nakatsu et al., 2012); and PI4KІІІβ from Dr. Nicolas Vitale (de Barry et al., 2006). P4M-YFP, Lyn-CFP, and Lyn-YFP were made in the Suh laboratory (Inoue et al., 2005; Keum et al., 2016). M1R cDNA was purchased from the cDNA Resource Center.
Construction of the Lyn-CFP and Lyn-YFP expression vector
Lyn-CFP and Lyn-YFP were generated by PCR amplification using cDNA of LDR (a kind gift from Takanari Inoue) as a template. A pair of primers was designed: forward 5′-CTTCGAATTCCGGCCACCATGGGATG-3′ and reverse 5′-CGGTGGATCCGCGCTGTCTTTCC-3′, which contained EcoR1 and HamH1 restriction sites, respectively. The amplified and purified PCR product was ligated into the pGEMT-Easy vector (Promega) to improve the efficiency of ligation of PCR products. The pGEMT-Easy vector containing Lyn insert was digested with EcoR1 and BamH1 (Enzynomics) and ligated with the pECFP-N1 or pEYFP-N1 vector (Clonetech) by T4 DNA ligase (NEB). Lyn-CFP and Lyn-YFP constructs were verified by DNA sequencing (Macrogen) before use.
Fluorescence and three-cube FRET measurements
Three-cube FRET was measured between transfected CFP- and YFP-tagged fluorescent proteins (Erickson et al., 2001). Cells were selected to express about equal amounts of CFP and YFP probes by first measuring the CFP/YFP intensity ratio 0.15–0.21 for a CFP-YFP concatemer (having a guaranteed 1:1 expression) and then using this ratio range as a selection criterion for test cells with a pair of probes. Cells outside the 0.15–0.21 range were rejected. The concatemer with a six-residue spacer between CFP and YFP gave FRET efficiency (FRETeff) values of 50–60%. Excitation light from a TILL monochromator (Polychrome IV) passed into a three-color dichroic mirror cube in an inverted microscope reflecting at 400, 500, and 580 nm (CFP, YFP, and mCherry, respectively; 89006bs; Chroma Technology Corp.) and passing 460–480- and 520–560-nm bands. Emission was collected by a 60× oil objective lens. For FRET, the CFP and YFP emission bands were detected by a TILL photometry system consisting of a TILL ViewFinder to define the rectangular field of measurement, a beam splitter, two photodiodes preceded by ET480/24 (CFP) or ET535/30 (YFP) emission filters, respectively (Chroma Technology Co.), and a TILL FDU-2 detection unit. Recordings were controlled by an EPC9 amplifier with Patchmaster 2.35 software (HEKA). Using the ViewFinder, we could physically acquire a rectangular region of interest for photometry by controlling x- and y-aperture cursors while masking the rest of the field. In a protocol repeated at 1 Hz, Patchmaster collected two signals simultaneously with 440-nm excitation: SCFP (480-nm emission) and SFRET (535-nm emission), followed by one signal with 500-nm excitation: SYFP (535-nm emission). Each photodiode sample was acquired for 20 ms. After recording from one cell was complete, an area of the coverslip without cells was measured as background. The cells were recorded in Ringer’s solution containing (in mM) 160 NaCl, 2.5 KCl, 2 CaCl2, 1 MgCl2, 10 HEPES, and 8 glucose and pH 7.4 adjusted with NaOH.
Data were analyzed offline in IGOR Pro 6.37 (WaveMetrics). To calculate FRETeff, we needed three constants (RD1, RD2, and RA1) determined before each experiment: RD1 = SFRET(D) / SCFP(D), RD2 = SYFP(D) / SCFP(D), and RA1 = SFRET(A) / SYFP(A), where the notation Scube(plasmid) indicates the intensity S measured with one of three cubes in cells (FRET, CFP, YFP) transfected with D (donor CFP), A (acceptor YFP), or DA (both). They were obtained from measurements with single cells expressing either CFP alone (RD1 and RD2) or YFP alone (RA1) and served to remove bleed-through and cross-talk from the signals. With the three constant values, data samples were converted to FRETeff as follows:
where ECFP(440) and EYFP(440) are CFP and YFP molar extinction coefficients.
Estimate of PtdIns(4,5)P2 concentration using FRET probes
Intermolecular FRET between CFP- and YFP-labeled PHPLCδ domains was used to estimate the PM PtdIns(4,5)P2 concentration. The FRET should be proportional to the product of local donor and acceptor concentrations, which in this case are CFP-PHPLCδ1 and YFP-PHPLCδ1 bound to PtdIns(4,5)P2 at the PM. The product means that FRET should follow a square-law relationship of the number of lipid–probe complexes (Itsuki et al., 2014; Ko et al., 2019b):
| (1) |
where Kd(PH) is the dissociation constant for the complex of PHPLCδ1 with PtdIns(4,5)P2 (2 µM; Hirose et al., 1999). For calibration, we assumed that the PM density of free PtdIns(4,5)P2 is 5,000/µm2 at rest (Falkenburger et al., 2013).
Confocal microscopy
Confocal experiments on live cells were conducted using a Zeiss 710 laser-scanning confocal microscope. Cells were plated on glass-bottom culture dishes (Vita Scientific). Fluorophores were excited by argon (for CFP, GFP, and YFP) and helium-neon (for mCherry or RFP) lasers. The emission was monitored with a 63× oil objective lens. 3-D images of P4M were reconstructed from z-stacks of ∼40 image planes with 0.5-µm spacing. The confocal images were analyzed with ImageJ/Fiji (National Institutes of Health).
Lipid extraction and mass spectrometry
Mass spectrometry was conducted on Chinese hamster ovary (CHO) cells stably transfected with M1R (from N.J. Buckley and D.A. Brown, University College, London, UK). Previous observations (Horowitz et al., 2005) showed that KCNQ2/3 channel inhibition and PHPLCδ1 translocation to cytoplasm after M1R activation are identical in CHO cells stably transfected with M1R and tsA cells (M1R-transient transfection). These data suggest that the dynamics of PI metabolism are comparable in the two cell lines.
The technique was mostly as published in Traynor-Kaplan et al. (2017). Adherent cells on 35-mm culture dishes (∼1 million cells) were washed twice with Ringer’s solution at room temperature. Then, for control cells, ice-cold methanol/1 N HCl was immediately added to stop PtdIns metabolism. For treated groups, methanol/1 N HCl was added after the activation of M1R for 1 or 10 min with 10 µM oxotremorine-M (Oxo-M). Cells were resuspended with a scraper and collected in an Eppendorf tube. Samples were centrifuged at 12,000 g for 3 min at 4°C. Supernatant was discarded, and cells were resuspended in 40 µl ice-cold water. 4 µl of each sample was removed to a different tube for DNA measurements. Then, 10 µl of 6 N HCl, 100 µl butanol, and internal standard (150 ng of 37:4 PtdIns and 20 ng of 37:4 PtdIns4P and 37:4 PtdIns(4,5)P2, from Avanti Polar Lipids) were added to each sample. Samples were vortexed vigorously for 1 min, allowed to sit on ice for 10 min, and centrifuged at 12,000 g for 3 min at 4°C. The butanol phase was transferred to a new tube and an additional 100 µl butanol was added to each sample followed by 1 min of vortexing each and centrifugation for 3 min at 12,000 g. The new butanol phase was combined with the butanol phase from the first extraction. Then 100 µl chloroform was added to each sample followed by vigorous vortexing and centrifugation at 12,000 g for 3 min at 4°C. The chloroform phase was combined with the butanol extract. Two more chloroform extraction steps followed for each sample. Finally, the butanol/chloroform extracts were centrifuged to separate and discard any water phase.
The butanol/chloroform lipid extracts were dried under N2 (Biotage evaporator) and resuspended in 90 µl methanol/chloroform. Immediately, 20 µl of 2 M trimethylsilyldiazomethane was added to methylate the lipids. The mixture was incubated for 1 h and applied to an ultra-performance liquid chromatography column coupled to the Xevo TQ-S triple-quadrupole mass spectrometer (Waters Corp). 2 µl of each lipid sample was injected into the port of a C4 column (Waters Acquity UPLC Protein BEH C4; 300A, 1.1 × 100, 1.7 µm). The mobile phase gradient initiated with 10 mM formic acid in water and 10 mM formic acid in acetonitrile, 50%:50% vol/vol increasing to 15%:85%, delivered at a flow rate of 0.1 ml/min. For quantitative analysis, the effluent was monitored in multiple reaction monitoring mode with postcolumn infusion of 50 µM Na formate at 5 µl/min (Traynor-Kaplan et al., 2017). Peak areas of individual lipid species were quantified using QuanLynx software. Peak areas were normalized to the internal standards as (peak area of sample/peak area of standard) * (nanogram of standard) and further corrected to DNA amounts determined with GeneJet Genomic DNAPurification Kit (Thermo Scientific).
Modeling
The kinetics of the PtdIns cycle reactions were modeled by mathematical simulation. The goal was to estimate the time course of key components and the rates of the reaction steps shown in Fig. 1 during long agonist applications as a way to test our hypotheses. The ordinary differential equations of the compartmental model (Falkenburger et al., 2010; Falkenburger et al., 2013) were modified and solved with systematic variations of the parameters using the Virtual Cell environment (University of Connecticut). The rate of each reaction was assumed to be the product of a rate constant times the reactant concentration(s). The Virtual Cell Models “PI cycle 4 & 4S” and “PI cycle figure 6, 7, & S9” by user “Myeong” can be accessed within the VCell software (at https://vcell.org).
Analysis and statistics
The results are presented as mean ± SEM. Statistical significance was determined using the two-tailed Student’s t test, except Fig. 3 F, Fig. 5, D and E, Fig. S2 B, and Fig. S3 B, which used one-way ANOVA; *, P < 0.05 and **, P < 0.005. Many FRET values are presented as normalized values (i.e., nFRET). For normalization, the resting FRET value was called 1.0, and zero FRET was called 0.0.
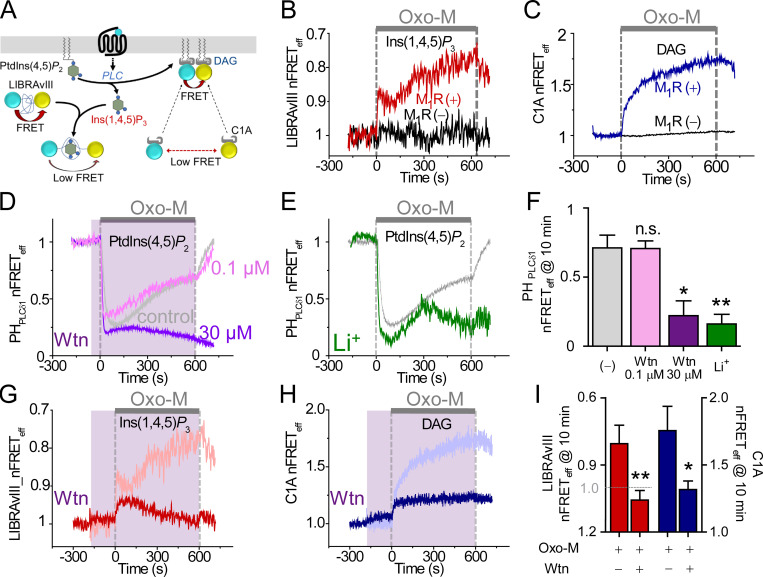
Figure 3.
Exploring steps of the PI cycle by monitoring Ins(1,4,5)P3, DAG, and PtdIns(4,5)P2. (A) Schematic of Ins(1,4,5)P3 and DAG indicators. LIBRAvIII has CFP and YFP at opposite termini of an Ins(1,4,5)P3 binding domain. (B) Time course of intramolecular LIBRAvIII nFRETeff during a 10-min stimulation with 10 µM Oxo-M (gray bar) in cells with or without expression of M1R. Note inverted y axis for LIBRAvIII since FRET is reduced by binding of Ins(1,4,5)P3 to this receptor. (C) Time course of homologous nFRETeff between CFP- and YFP-tagged C1A domains with or without expression of M1R. CFP- and YFP-tagged C1A domains detect DAG at the PM and increase their FRET when DAG increases at the PM. (D) Comparison of pretreatment with 0.1 µM or 30 µM Wtn (shaded area) on PtdIns(4,5)P2 regeneration during M1R stimulation by 10 µM Oxo-M (gray, control; pink, 0.1 µM Wtn; and purple, 30 µM Wtn). (E) Effect of 2-h pretreatment with 10 mM Li+-enriched solution on regeneration of PtdIns(4,5)P2 (gray, control; green, Li+). (F) Mean PtdIns(4,5)P2 regeneration measured as homologous nFRETeff of CFP- and YFP-tagged PHPLCδ1 at 10 min of Oxo-M treatment. Control, n = 6 cells; 0.1 µM Wtn, n = 9; 30 µM Wtn, n = 9; Li+, n = 4. (G) Wtn (shaded area) limits Ins(1,4,5)P3 regeneration during M1R activation as measured with LIBRAvIII (pink, control; red: 30 µM Wtn). (H) Wtn depresses DAG production as measured with C1A probes (aqua, control; blue, 30 µM Wtn). (I) Mean Wtn effect on production of Ins(1,4,5)P3 (red bars) and DAG (blue bars) measured as nFRETeff at 10 min of Oxo-M treatment. Ins(1,4,5)P3: control, n = 4 cells and Wtn, n = 6; DAG: control, n = 9 and Wtn, n = 6 cells. *, P < 0.05; **, P < 0.005. n.s., not significant.
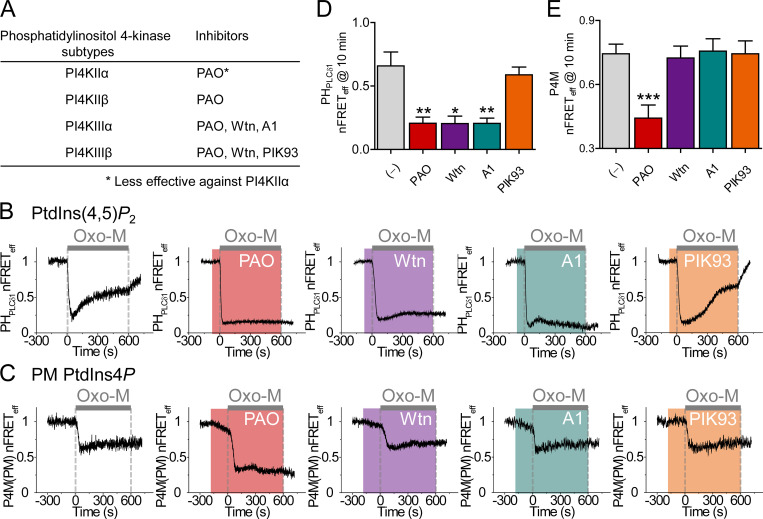
Figure 5.
Depression of PtdIns(4,5)P2 regeneration by PI4KІІІα inhibitors. (A) Specificity of inhibitors for PI4K subtypes. (B) Time course of PtdIns(4,5)P2 during 10-µM Oxo-M application (gray bar) measured from homologous FRET between CFP- and YFP-tagged PHPLCδ1 probes in cells pretreated (shaded areas) with different PI4K inhibitors (30 µM PAO, 30 µM Wtn, 30 nM A1, and 300 nM PIK93). (C) Time course of PtdIns4P in the PM measured from heterologous FRET between P4M-CFP and Lyn-YFP in cells pretreated (shaded areas) with different PI4K inhibitors. (C–E) Mean PI4K inhibitor effects on the regeneration of PtdIns(4,5)P2 (D) and on PM PtdIns4P (E) as measured with FRET indicators at 10 min of Oxo-M stimulation. PtdIns(4,5)P2: control, n = 4 cells; PAO, n = 5; Wtn, n = 5; A1, n = 8; and PIK93, n = 9. PtdIns4P: control, n = 25; PAO, n = 15; Wtn, n = 15; A1, n = 12; and PIK93, n = 7 cells. *, P < 0.05; **, P < 0.005; ***, P < 0.001.
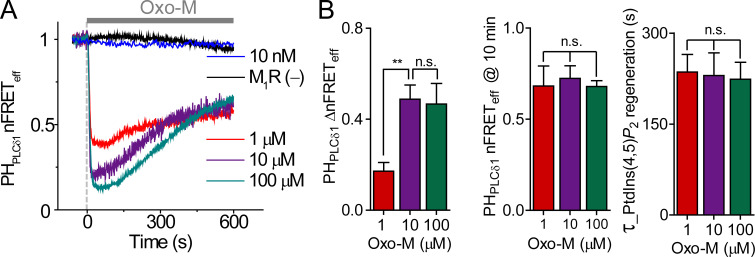
Figure S2.
PtdIns(4,5)P2 regeneration followed initial depletion by receptor stimulation. (A) Time course of PtdIns(4,5)P2 indicator homologous nFRETeff during treatment (gray bar) with different Oxo-M concentrations in cells overexpressing M1R. The black line is for a control cell without M1R overexpression (M1R (−)). (B) Mean of ΔnFRETeff, final nFRETeff after 10 min in Oxo-M, and the time constant of nFRETeff regeneration during Oxo-M application. 1 µM, n = 7 cells; 10 µM, n = 8; and 100 µM, n = 6. **, P < 0.005. n.s. not significant.
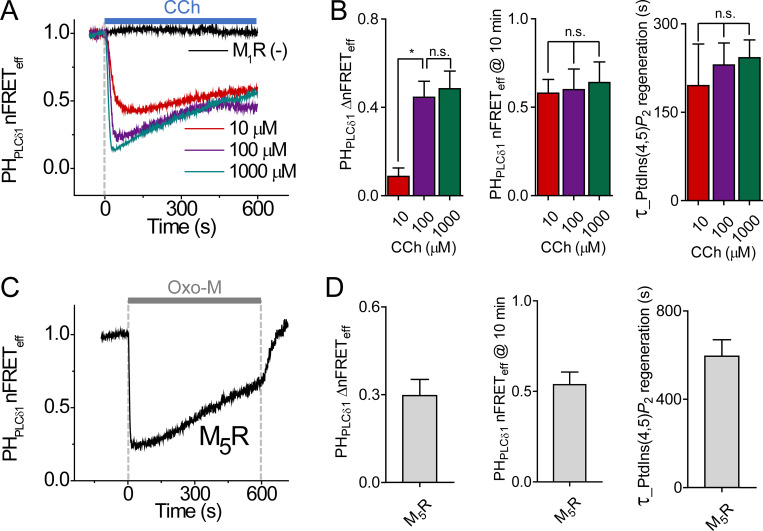
Figure S3.
Comparison of PtdIns(4,5)P2 regeneration during stimulation with different muscarinic agonists and receptors. (A) Time course of homologous nFRETeff between CFP- and YFP-tagged PHPLCδ1 domains during application of carbachol (light blue bar, CCh) for 10 min. Cells were transfected with the probes with or without (−) M1R. (B) Mean of ΔnFRETeff, nFRETeff after 10-min CCh stimulation, and the time constant of nFRETeff regeneration. 10 µM, n = 4 cells; 100 µM, n = 12; and 1,000 µM, n = 5. (C) Time course of nFRETeff during application of 10 µM Oxo-M (gray bar) to cells expressing M5R. (D) Summary of ΔnFRETeff, nFRETeff at 10 min, and the time constant of nFRETeff regeneration for cells expressing M5R. n = 5 cells. *, P < 0.05. n.s. not significant.
Data availability
All data needed to evaluate the conclusions in the paper are presented in the paper or the supplemental materials.
Online supplemental material
Fig. S1 contains validation of three-cube FRET. Fig. S2 shows that PtdIns(4,5)P2 regeneration followed initial depletion by receptor stimulation. Fig. S3 compares PtdIns(4,5)P2 regeneration during stimulation with different muscarinic agonists and receptors. Fig. S4 presents a mathematical model assuming inhibition of phosphatase activities during receptor activation. Fig. S5 shows the intracellular distribution of PI4KІІІα and PI4KІІІβ. Fig. S6 shows localization of PtdIns4P at the Golgi and PM. Fig. S7 shows rapamycin-inducible PJ-Sac1 recruitment to the Golgi. Fig. S8 dissects dynamics of phosphoinositide pools with drugs acting on PKC or PI4KІІІα. Fig. S9 shows simulated dynamics of phosphoinositide probes during receptor activation using the expanded mathematical model. Table S1 lists the initial conditions and parameters for the model shown in Fig. 4. Table S2 describes the differential equations for the model shown in Fig. 4. Table S3 lists the initial conditions and parameters for the model shown in Fig. 7 and Fig. S9. Table S4 describes the differential equations for the model shown in Fig. 7 and Fig. S9.
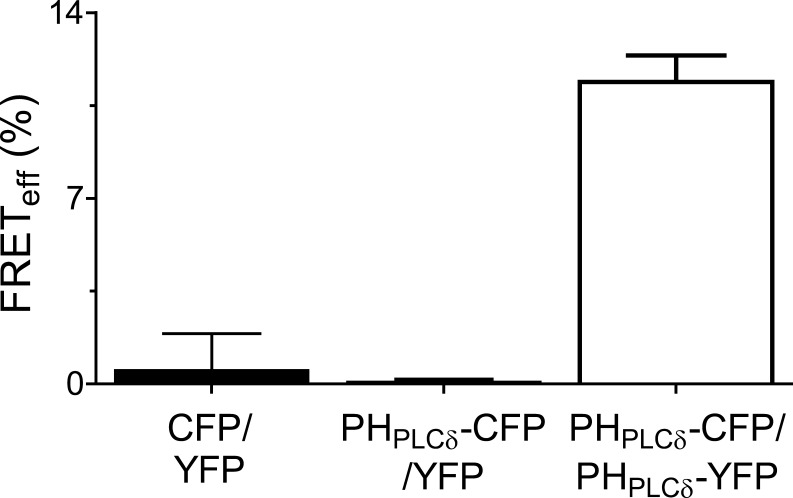
Figure S1.
Validation of three-cube FRET. Low resting FRETeff between intracellular soluble CFP and soluble YFP (n = 7 cells) or between PHPLCδ1-CFP and soluble YFP (n = 30 cells). High homologous FRETeff between PHPLCδ1-CFP and PHPLCδ1-YFP probes (n = 39) in resting cells with a high concentration of PM PtdIns(4,5)P2.
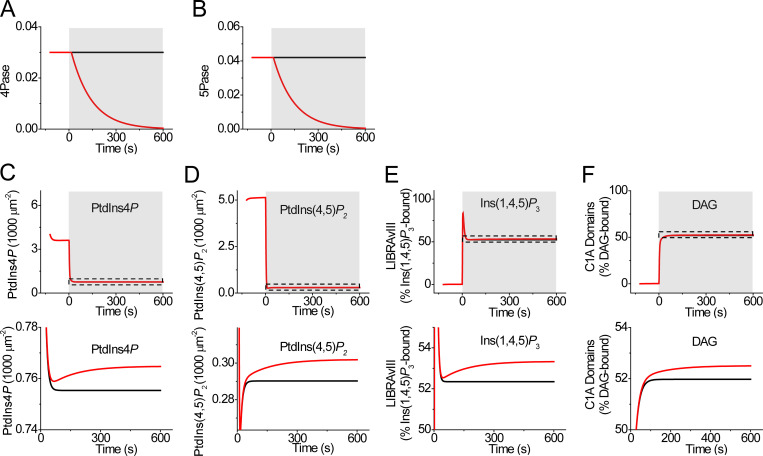
Figure S4.
Mathematical model assuming inhibition of phosphatase activities during receptor activation. (A and B) Assumed deceleration of 4-phosphatase (4-Pase; A) and 5-phosphatase (5-Pase; B) during receptor activation (shaded area). (C–F) Simulated time course of PM PtdIns4P (C), PM PtdIns(4,5)P2 (D), Ins(1,4,5)P3 interacting with LIBRAvIII (E), and DAG interacting with C1A domains (F). Magnified traces underneath are expanded to reveal the tiny effects of phosphatase inhibition.
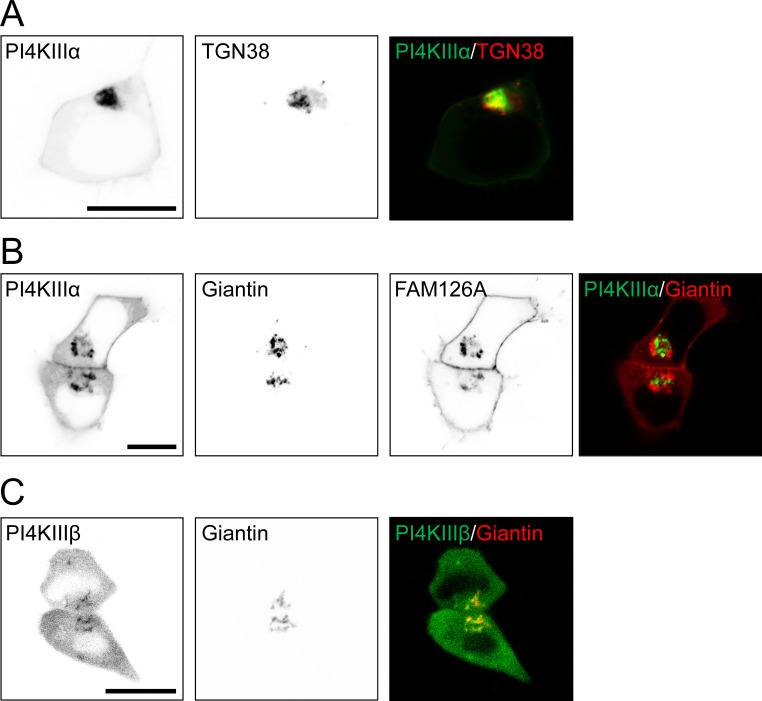
Figure S5.
Intracellular distribution of PI4KІІІα and PI4KІІІβ. (A and B) Confocal images of GFP-tagged PI4KІІІα compared with CFP-tagged TGN38 or giantin as trans-Golgi and cis-Golgi markers, respectively. The cells coexpressed TTC7 and EFR3 with (B) or without (A) FAM126A. (C) Confocal images of GFP-tagged PI4KІІІβ and CFP-tagged giantin. Black-and-white images show fluorescence in reversed contrast (black). Color images overlay PI4K (green) and a Golgi marker (red). Scale bar, 10 µm.
Figure S6.
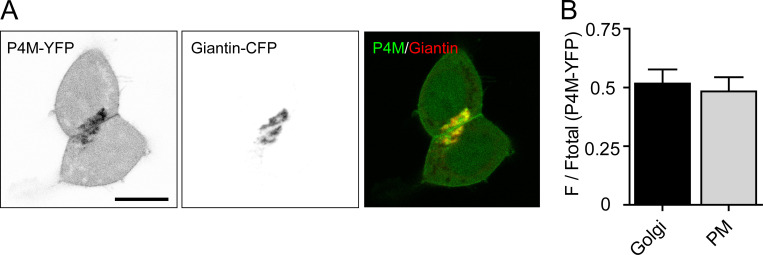
Localization of PtdIns4P at the Golgi and PM. (A) Left and center: Confocal images of YFP-tagged P4M and CFP-tagged giantin serving as PtdIns4P and Golgi indicators, respectively. Right: Overlay of P4M (green) and giantin (red). Scale bar, 10 µm. (B) Fractional partitioning of P4M-YFP fluorescence between the Golgi and PM. z-Stacks of confocal images were integrated to estimate relative P4M near the Golgi and near the PM (see Materials and methods). n = 9 cells. F/Ftotal, integrated fluorescence in the Golgi or PM divided by the total fluorescence in the cell.
Figure S7.
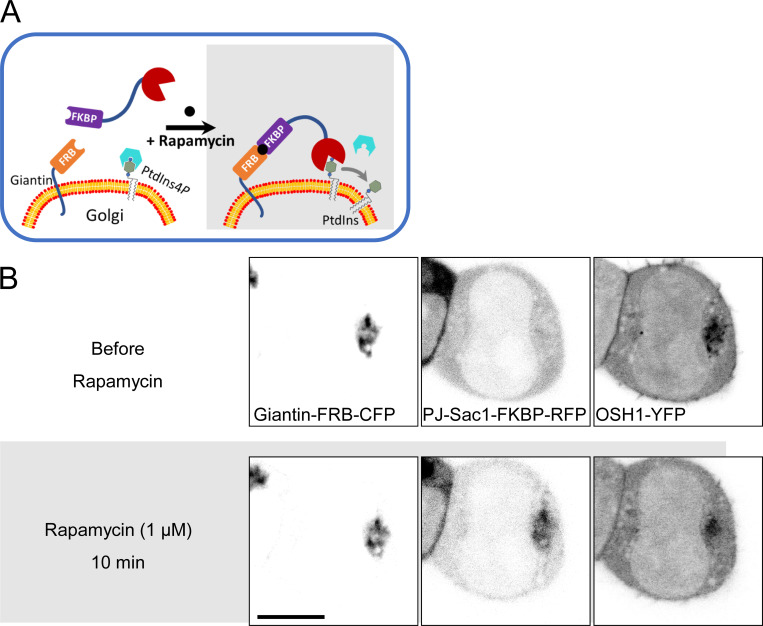
Rapamycin-inducible PJ-Sac1 recruitment to the Golgi. (A) Schematic of a cell expressing soluble PJ-Sac1 and Golgi-anchored giantin-FRB. Rapamycin, by cross-linking FKBP and FRB, recruits PJ-Sac1 to the Golgi, where it dephosphorylates PtdIns4P to PtdIns. (B) Confocal images confirming PJ-Sac1 translocation from the cytoplasm to the giantin-FRB–enriched Golgi after 10 min with 1 µM rapamycin. Right: GFP-tagged OSH1, a PtdIns4P indicator, reports a reduction of Golgi PtdIns4P. Scale bar, 10 µm.
Figure S8.
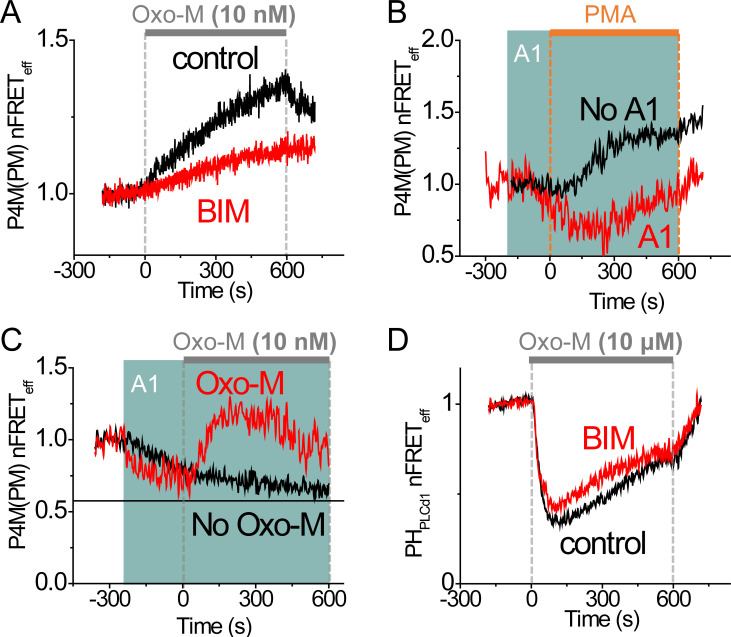
Dissecting dynamics of phosphoinositide pools with drugs acting on PKC or PI4KІІІα. (A) Time course of heterologous nFRETeff between P4M-CFP and Lyn-YFP in control cells and cells preincubated in 2 µM BIM during stimulation with a very low concentration of Oxo-M (10 nM, gray bar). (B) Increase of PM PtdIns4P concentration by application of 5 µM PMA (orange bar) with or without pretreatment with A1 (green shading), a specific PI4KІІІα inhibitor. (C) Pretreatment with 30 nM A1 initiated a loss of PM PtdIns4P, but 10 nM Oxo-M still stimulated PM PtdIns4P production. (D) Control cells and cells preincubated in 2 µM BIM expressing PtdIns(4,5)P2 FRET probes showed regeneration during receptor activation by 10 µM Oxo-M.
Figure S9.
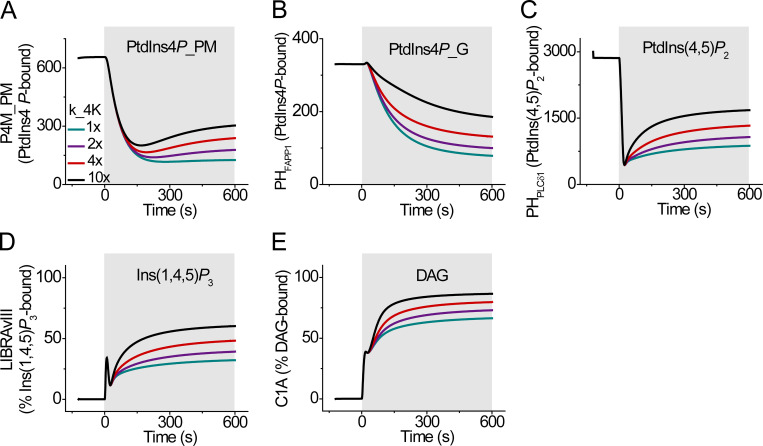
Simulated dynamics of phosphoinositide probes during receptor activation (shaded area) using the expanded mathematical model. (A–E) The rate constants for PI4K activity are varied as in Fig. 7 A. Corresponding simulated time courses of concentration of PM PtdIns4P-bound P4M (A), Golgi PtdIns4P-bound PHFAPP1 (B), PM PtdIns(4,5)P2-bound PHPLCδ1 (C), Ins(1,4,5)P3-bound LIBRAvIII (D), and DAG-bound C1A (E). _G indicates chemical species in the Golgi compartment.
Figure 4.
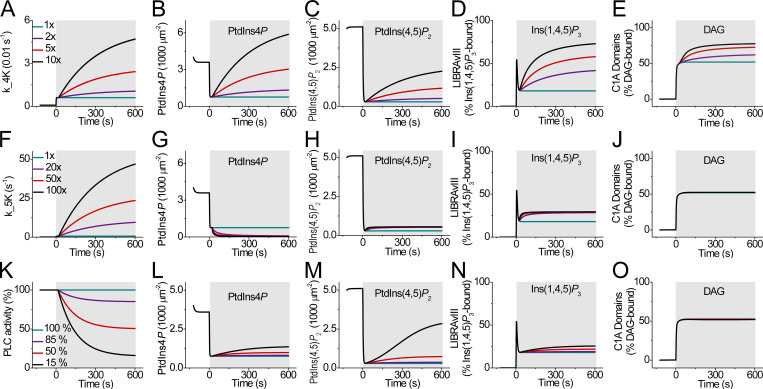
Three modified mathematical models simulating PtdIns(4,5)P2 regeneration during receptor activation. All curves are simulations with receptor activation during the shaded areas. (A–O) Comparison of the assumption of PI4K acceleration (A–E), PIP5K acceleration (F–J), or PLC desensitization (K–O) as explanations of PtdIns(4,5)P2 regeneration. All models consider only the steps with black arrows in Fig. 1, and they assume that the concentration of PtdIns at the PM remains constant. (A, F, and K) Panels show the range of hypothetical time courses tested for the kinetics of PI4K, PI5K, or PLC, respectively. They are evaluated by the simulations in the four panels to the right of them. (A–E) Progressive acceleration of PI4K during 10-µM Oxo-M stimulation. (A) Assumed accelerations of the rate of PI4K in the first model during M1R activation, ranging from the standard Falkenburger model (green curve) to increasing accelerations (violet, red, and black). (B–E) The predicted concentrations of PM PtdIns4P (B) and PtdIns(4,5)P2 (C), Ins(1,4,5)P3 interacting with LIBRAvIII (D), and DAG interacting with C1A domains (E), color-coded as in A. (F–J) Progressive acceleration of PIP5K during 10-µM Oxo-M stimulation, shown in the same format as A–E. (K–O) Progressive slowing of PLC activity during 10-µM Oxo-M stimulation.
Figure 7.
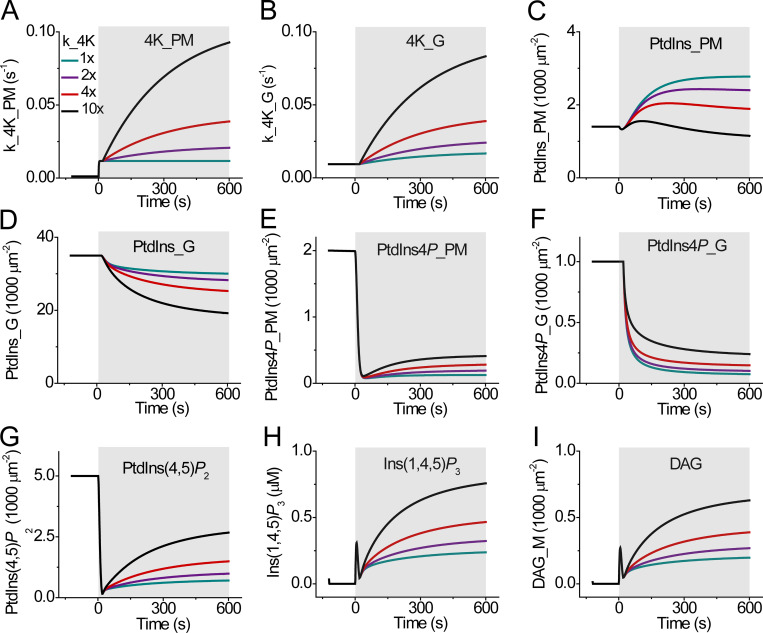
Expanded mathematical model with the additional contribution of Golgi PtdIns4P. (A–I) Calculations from an expanded model to include the gray arrows as well as the black arrows of Fig. 1. Several time-varying changes were assumed and tested for the rate constants for PI4K of the PM (A) and of the Golgi (B) during Oxo-M (shaded area). Corresponding simulated time courses of PM PtdIns (C), Golgi PtdIns (D), PM PtdIns4P (E), Golgi PtdIns4P (F), PM PtdIns(4,5)P2 (G), Ins(1,4,5)P3 (H), and PM DAG (I). The concentration of PtdIns at the ER is held constant. _G indicates chemical species in the Golgi compartment.
Results
To study the dynamics of the PtdIns cycle and possible adjustments of enzyme rates that may follow activation of receptors, we first measured the reaction steps that are drawn with black arrows in Fig. 1.
Long-term stimulation of Gq-coupled receptors initiates rapid PtdIns(4,5)P2 depletion followed by gradual regeneration
tsA201 cells were transfected with M1R muscarinic receptors and stimulated with the muscarinic agonist Oxo-M. We have studied and modeled these kinetics before during brief agonist applications lasting 15–30 s (Falkenburger et al., 2010; Dickson et al., 2013; Falkenburger et al., 2013), but now we studied 10-min agonist applications that engage additional longer-term adjustments of steps in the cycle. We monitored the dynamics of PtdIns(4,5)P2 using as probes fluorescently labeled PtdIns(4,5)P2-binding PHPLCδ1 or a YFP-labeled C-terminus of Tubby. Fig. 2 A diagrams the use of PHPLCδ1-CFP and PHPLCδ1-YFP as a FRET pair. When coexpressed in control cells, both of them bind to PtdIns(4,5)P2 at the PM and have a mutual FRET interaction, but when PtdIns(4,5)P2 is depleted, they translocate to the cytoplasm where they are too far apart to generate FRET. We call this “homologous FRET” because the CFP and YFP pair each have the same lipid-binding domain. We say “heterologous FRET” when the CFP and YFP pair are attached to different kinds of proteins. To measure the level of PtdIns(4,5)P2 quantitatively, we used the three-cube method, which reports FRETeff as described previously (Itsuki et al., 2014; Ko et al., 2019b). A control experiment in Fig. S1 showed that cells coexpressing PHPLCδ1-CFP and PHPLCδ1-YFP, which colocalize at the PM, exhibited a robust homologous FRETeff signal, whereas cells coexpressing free cytoplasmic CFP and YFP or the PHPLCδ1-CFP probe and free cytoplasmic YFP showed minimal heterologous FRETeff. Thus, this three-cube method greatly reduced bleed-through and cross-talk from fluorescent components that do not interact.
Figure 2.
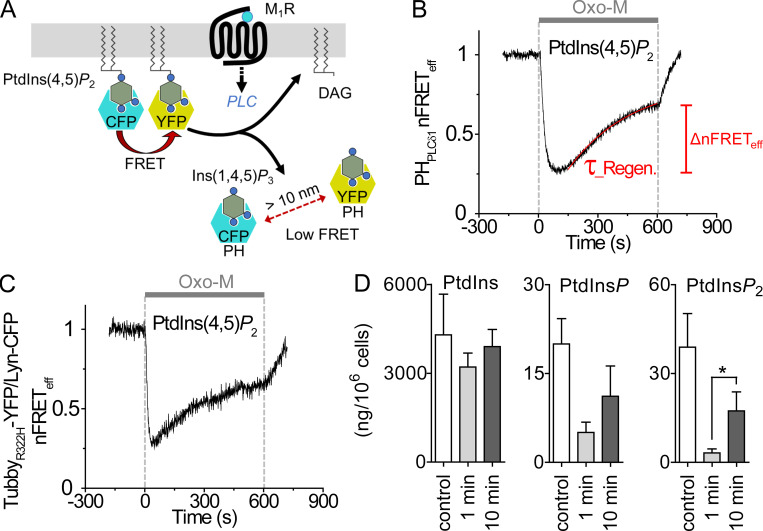
Depletion and regeneration of PtdIns(4,5)P2 during stimulation of M1R. (A) Schematic of homologous FRET measurements with PHPLCδ1. At the PM, CFP- and YFP-tagged PHPLCδ1 (blue and yellow, respectively) are bound to PtdIns(4,5)P2 and show a high FRET interaction; however, after the activation of PLCβ, they are released from PtdIns(4,5)P2 to the cytoplasm and do not generate a FRET signal. (B) Time course of PtdIns(4,5)P2 monitored as the homologous nFRETeff (normalized FRET efficiency) between PHPLCδ1-CFP and PHPLCδ1-YFP in tsA201 cells transfected with M1R. Activation of M1R by 10 µM Oxo-M for 10 min (gray bar) depletes PtdIns(4,5)P2 quickly, but then PtdIns(4,5)P2 regenerates slowly as fitted with a single-exponential function (red line). ΔnFRETeff is measured as the difference between the minimal level and the final level at 10 min during Oxo-M stimulation. Here and in the remaining figures, the presented time courses of FRET are representative traces from single cells. (C) Time course of PtdIns(4,5)P2 monitored as the normalized heterologous FRETeff between Lyn-CFP and TubbyR322H-YFP. (D) Mean of total PtdIns (left), PtdInsP (middle), and PtdInsP2 (right) in control and 1- or 10-min agonist stimulation measured by mass spectrometry in CHO cells stably expressing M1R (n = 4 independent lipid extractions). *, P < 0.05.
Fig. 2 B shows the biphasic time course of normalized FRETeff (nFRETeff) during a 10-min application of agonist. Activation of M1R by 10 µM Oxo-M promoted the hydrolysis of PtdIns(4,5)P2, seen as an initial rapid reduction of PH-domain homologous nFRETeff that has been reported many times previously. The key point for this paper, however, is that nFRETeff and therefore the PtdIns(4,5)P2 level then began to increase again after ∼1 min, despite the continuous presence of the agonist. We will use the word “regeneration” specifically to refer to this slow lipid increment during prolonged receptor activation. We quantified the regeneration in two ways: as regeneration time constant (τ_Regeneration, the red fitted exponential curve of nFRETeff in Fig. 2 B) and as ΔnFRETeff at 10 min, the difference between the minimum and the 10-min level. The depth of initial depletion and the ΔnFRETeff at 10 min were dependent on agonist concentration, but the time constant and the final nFRETeff value at 10 min were not (Fig. S2, A and B). These results were not unique to the agonist Oxo-M or to the specific Gq-coupled receptor. Similar regeneration of PtdIns(4,5)P2 was seen when carbachol was the agonist instead of Oxo-M (Fig. S3, A and B), and a similar but slower regeneration was seen when the overexpressed receptor was M5R (Fig. S3, C and D).
Because the PHPLCδ1 probe can bind Ins(1,4,5)P3 in addition to PtdIns(4,5)P2 (Hirose et al., 1999), we sought additional verification that PtdIns(4,5)P2 was regenerating. The first test was to assess PtdIns(4,5)P2 regeneration using a probe from TubbyR322H (Quinn et al., 2008; Szentpetery et al., 2009), which has a relatively lower affinity for PtdIns(4,5)P2 than PHPLCδ1 has. We measured nFRETeff between a PM anchor Lyn-CFP and YFP-tagged TubbyR322H. This heterologous FRET pair will report PtdIns(4,5)P2 at the PM more specifically. During long muscarinic stimulation, TubbyR322H showed the expected initial strong nFRETeff decrease followed by regeneration, returning to 0.65 ± 0.06 at 10 min (n = 7; Fig. 2 C). The Tubby results rule out an artifact from a transient rise of Ins(1,4,5)P3 as the explanation for the transient PHPLCδ1 time course, as well as confirming that regeneration is occurring at the PM.
Second, we used mass spectrometry to measure total cellular polyphosphoinositides (Fig. 2 D). Our technique (Traynor-Kaplan et al., 2017) measured total fatty acyl chain length and the number of phosphates on the inositol head group, but not their position on the inositol ring. To measure changes of phosphoinositide pools during stimulation in a cell population with uniform receptor expression, we used a CHO cell line stably expressing M1R (n = 4). After 1 min of stimulation with Oxo-M, the total cellular PtdInsP2 pool showed a sharp reduction, and similar to the results with FRET sensors, at 10 min of stimulation, a significant regeneration (Fig. 2 D). Thus, regeneration involves synthesis and accumulation of new PtdIns(4,5)P2 and not merely recruitment of PtdIns(4,5)P2 from one place to another in the cell. The same experiment showed significant depletion and possible regeneration of total cellular PtdInsP during treatment with Oxo-M; however, the 1-min and 10-min points were not statistically distinguishable.
What underlies PtdIns(4,5)P2 regeneration during long receptor stimulation? We now consider two hypotheses: (i) a secondary acceleration of PtdIns(4,5)P2 supply due to feedback signals that speed the synthetic enzymes or augment lipid delivery and (ii) a secondary slowing of PtdIns(4,5)P2 breakdown by PLC, possibly related to desensitization.
Late increase of Ins(1,4,5)P3 and DAG
As an additional measure of the rate of PtdIns(4,5)P2 breakdown, we monitored the dynamics of the two PtdIns(4,5)P2 hydrolysis products, Ins(1,4,5)P3 and DAG. In principle, the two products should be produced simultaneously and stoichiometrically with PtdIns(4,5)P2 breakdown, and then they are metabolized independently. Cytoplasmic free Ins(1,4,5)P3 was estimated using LIBRAvIII (Tanimura et al., 2004), an intramolecular FRET indicator comprising the Ins(1,4,5)P3 binding domain from an Ins(1,4,5)P3 receptor sandwiched between CFP and YFP (Fig. 3 A). When Ins(1,4,5)P3 binds to LIBRAvIII, the distance between CFP and YFP increases and FRET decreases. Therefore, for a more intuitive presentation, we inverted the nFRETeff axis when plotting LIBRAvIII responses. Although the LIBRAvIII FRET signals have a signal-to-noise ratio that is lower than that of other probes, we continue to present single representative traces as for the other probes. Fig. 3 B shows a rapid transient increase of Ins(1,4,5)P3 followed by a much slower continued increase during Oxo-M treatment (nFRETeff peak: 0.91 ± 0.01, trough: 0.99 ± 0.01, 5 min: 0.89 ± 0.05, and 10 min: 0.80 ± 0.08; n = 4). Ins(1,4,5)P3 reached a transient trough 137 s after Oxo-M stimulation. It should be remembered that the expected lifetime of Ins(1,4,5)P3 is short, 5–30 s (Sims and Allbritton, 1998; Falkenburger et al., 2013), so the instantaneous level of Ins(1,4,5)P3 would approximately trace its rate of production. Initially, it was produced rapidly as expected, but the rate slowed quickly as the PtdIns(4,5)P2 substrate was being depleted. Then later, Ins(1,4,5)P3 production rate steadily increased again, which likely reflects the gradual regeneration of the precursor pool of PM PtdIns(4,5)P2 (see modeling). There was little FRET change in control cells not expressing M1R (Fig. 3 B).
For membrane DAG measurement, we used tandem C1A–C1A domains from PKCγ (Fig. 3 A). In resting cells where DAG in the PM is low, the CFP- and YFP-tagged probes were localized in the cytoplasm, producing little FRET (Fig. 3 C). When DAG was increased during receptor activation, the cytoplasmic probes were recruited to the PM and generated a homologous FRET signal that continued to rise until agonist was removed. The expected lifetime of DAG is still relatively short (20–80 s; Suh and Hille, 2006; Falkenburger et al., 2013) but is thought to be longer than for Ins(1,4,5)P3, so the instantaneous level should almost trace the rate of DAG production but with a longer integration time—effectively more smoothing—than for the LIBRAvIII FRET signal. In a negative-control cell expressing the indicator but no receptor, the nFRETeff signal did not change. The observation of continued rising time courses for Ins(1,4,5)P3 and DAG will be key for our quantitative dissection of the regeneration mechanism during long agonist application.
Interrupting the phosphoinositide cycle prevents PtdIns(4,5)P2 regeneration
When receptor-activated PLC depletes PtdIns(4,5)P2, it also depletes the precursor PtdIns4P (Willars et al., 1998; Horowitz et al., 2005; Balla et al., 2008; Traynor-Kaplan et al., 2017; de Rubio et al., 2018), so subsequent regeneration of PtdIns(4,5)P2 first requires the synthesis of PtdIns4P from PtdIns by PI4K (Fig. 1). We examined the dependence of PtdIns(4,5)P2 regeneration on lipid 4-kinases using the broad-spectrum PI4KIII inhibitor wortmannin (Wtn) and the dependence on myo-inositol availability using lithium as an inhibitor of inositol monophosphate phosphatase (IMPase; green arrows in Fig. 1). Low concentrations (0.1 µM) of Wtn strongly inhibit PI3K activity (Hansen et al., 1995), whereas high concentrations (30 µM) also inhibit PI3K, PI4KIIIα, and PI4KIIIβ (Nakanishi et al., 1994; Hansen et al., 1995; Nakanishi et al., 1995; Balla et al., 2008). Fig. 3, D and F, shows that pretreatment of cells with high Wtn (30 µM), which inhibits the three kinases, eliminated the regeneration of PtdIns(4,5)P2 during long agonist application (purple trace). The plots also show control (gray) and low Wtn pretreatment (0.1 µM; pink) responses for comparison. The strong effect of Wtn here is due to inhibition of type III PI 4-kinases rather than PI 3-kinases.
Lithium inhibits IMPase, the enzyme that restores free myo-inositol pools by dephosphorylating inositol 1-phosphate (Hallcher and Sherman, 1980; Sherman et al., 1985; Berridge et al., 1989) and provides the myo-inositol precursor that is necessary for de novo synthesis of PtdIns (Dai et al., 2016). Fig. 3, E and F, shows that 2-h preincubation with 10 mM lithium also impaired regeneration. In lithium-treated cells, PtdIns(4,5)P2 regeneration began normally during the first 5 min but then ceased as if the supply of myo-inositol had become exhausted. The PI4KIII inhibitor Wtn similarly decreased the rate of production of the downstream products Ins(1,4,5)P3 and DAG during agonist application (Fig. 3, G–I). Instead of rising continuously during agonist, Ins(1,4,5)P3 rose only transiently and DAG rose just to a low steady plateau. Thus, two blockers of the PtdIns cycle suppress the full regeneration of PtdIns(4,5)P2.
Tests of two hypotheses with a kinetic model
At this point, we had enough information to begin asking about the mechanism for the PtdIns(4,5)P2 regeneration seen in Fig. 2 B. Could regeneration be due mainly to (i) speeding of production of PtdIns(4,5)P2 (including speeded delivery of precursors) or to (ii) slowing of breakdown by PLC? To discriminate these alternatives, we turned to kinetic modeling and simulation. We also considered two other minor possibilities. This laboratory has formulated a mathematical model of the enzymatic steps drawn with black arrows in Fig. 1 (Schaff et al., 1997; Falkenburger et al., 2010; Cowan et al., 2012; Falkenburger et al., 2013), a model that was satisfactory to describe the first seconds of receptor activation. The model as drawn (black arrows) places all relevant lipid pools on the PM, a restriction that should not be taken literally and will be corrected later in this paper. With this model as a starting point, we could test the alternative effects of either accelerating the rate of PtdIns(4,5)P2 synthesis or reducing the rate of PtdIns(4,5)P2 breakdown during longer receptor activation. To match our observations, either of these changes would need to develop slowly (over several minutes) after agonist application. The values assumed for fixed kinetic constants, initial conditions, and reaction kinetics are summarized in Table S1 and Table S2. They are mostly taken directly from our previous modeling (Falkenburger et al., 2010; Falkenburger et al., 2013).
For the first manipulation, instead of leaving the PI4K activity invariant in the model after the first seconds of receptor activation, we tested hypothetical secondary gradual rate increases represented in Fig. 4 A. As in the Falkenburger model, the rate constant for PI4K is quickly stepped up 10-fold in the first second after agonist application, but now it continues to grow gradually by another large factor (with an exponential time constant of 300 s). As anticipated, with these slow secondary increases of PI4K activity, the simulated PtdIns4P (Fig. 4 B) and PtdIns(4,5)P2 (Fig. 4 C) showed gradual regeneration, and, as in the experiments of Fig. 3, Ins(1,4,5)P3 increased transiently followed by a secondary slow increase (Fig. 4 D), and DAG showed a fast initial increase and then a slow steady rise (Fig. 4 E). In the calculations, the black curves resemble the experiments enough to suggest that such a model could be a satisfactory beginning. At the end of 10 min, the PI4K activity had risen to 100× its resting value. These two ad hoc phases of PI4K increase would have to be a consequence of receptor activation.
One might also ask whether increasing PIP5K alone instead of PI4K alone might do equally well. This possibility was tested in Fig. 4, F–J. However, it did not work well even if we accelerated PIP5K activity by 100-fold. Basically, as PIP5K was accelerated, it depleted the pool of PtdIns4P toward zero so that the supply of PtdIns(4,5)P2 became entirely limited by the constant ability of PI4K to supply more PtdIns4P for conversion to PtdIns(4,5)P. Thus, speeding PIP5K was not sufficient by itself; it would have to be accompanied by speeding of PI4K to work.
To test the main alternative hypothesis, which postulated a gradual slowing of PtdIns(4,5)P2 breakdown, we tried a slow secondary decay of PLC activity (Fig. 4 K). Such a change might represent receptor desensitization. As anticipated, the simulated PtdIns(4,5)P2 level did show good rebound during the strongest gradual slowing of PLC activity (Fig. 4 M). However, while PLC was slowed eventually by 85%, the simulated time courses of Ins(1,4,5)P3 and DAG production showed only an initial step-up but no subsequent growth (Fig. 4, N and O), unlike the observations in Fig. 3, B and C. There simply was insufficient ongoing breakdown of PtdIns(4,5)P2 when PLC was slowed. Therefore, our modeling suggests that a slow speeding of PtdIns(4,5)P2 synthesis or supply could be the dominant contributor to PtdIns(4,5)P2 regeneration during M1R stimulation.
One might suppose that regeneration could also be mimicked by a slow profound inhibition of lipid phosphatases. However, this idea fails entirely because in the Falkenburger model the PI4K and PIP5K activities are stepped up 10-fold already in the first second of receptor activation, leaving the 4- and 5-phosphatase activities already very small by comparison. Further gradual slowing of the phosphatase activities to zero had little effect on the predicted PtdIns4P, PM PtdIns(4,5)P2, Ins(1,4,5)P3, and DAG (Fig. S4, A–F), although magnifying the simulated traces sufficiently did reveal a very tiny effect in the expected direction (Fig. S4, C–F, lower panels).
PI4KIIIα contributes to PtdIns(4,5)P2 regeneration during receptor stimulation
The simulations focused our attention on the PI4K enzymes. Which PI4K subtypes are involved? Where are they located? Where are the pools of PtdIns4P that they make? Does this affect the simulations? In general, PI4KIIIα has been recognized as the principal 4-kinase supplying PM PtdIns(4,5)P2 by pharmacology (Balla et al., 2008) and by knockout approaches (Nakatsu et al., 2012). We took the pharmacological approach using PI4K inhibitors with the different reported selectivities listed in Fig. 5 A (Bojjireddy et al., 2014; Tóth et al., 2016). Pretreatment with phenylarsine oxide (PAO), Wtn, or A1 abolished PtdIns(4,5)P2 regeneration during M1R activation, whereas PIK93 did not (Fig. 5, B and D). By elimination, the block by A1 and not by PIK93 left PI4KIIIα as the principal 4-kinase relevant for PtdIns(4,5)P2 regeneration.
In a similar protocol, we measured the time course of PtdIns4P at the PM. We monitored heterologous FRET between CFP-tagged P4M, a PtdIns4P probe (Hammond et al., 2014), and PM-anchored Lyn-YFP, comparing the different inhibitors of PI4K. This FRET measurement is restricted to the PM where Lyn is localized. Strikingly, the simple addition of PAO, Wtn, or A1 (but not PIK93) initiated an immediate gradual decline in the PM PtdIns4P signal at a rate of ∼5%/min (Fig. 5 C). This pattern of decline implied that the resting PM PtdIns4P is maintained primarily by continuous action of PI4KIIIα and not by PI4KIIIβ. After 3 min in the inhibitor or without inhibitor (control), PLC was activated with Oxo-M. In control, the expected sharp drop in PtdIns4P quickly reached a plateau with perhaps a slight slow rise resembling regeneration. Quite unlike for PM PtdIns(4,5)P2, the small regeneration of PM PtdIns4P was sensitive only to PAO pretreatment and not to the other PI4K inhibitors (Fig. 5, C and E). Indeed, with PAO, Oxo-M depressed PtdIns4P well below the plateau seen in the control or with the other inhibitors. The insensitivity of PM PtdIns4P to Wtn, A1, and PIK93 during receptor activation suggests that the principal precursor for A1-sensitive PtdIns(4,5)P2 regeneration during challenge by prolonged M1R stimulation is not this pool of PtdIns4P at the PM, so we considered other sources.
Golgi PtdIns4P contributes to PtdIns(4,5)P2 regeneration
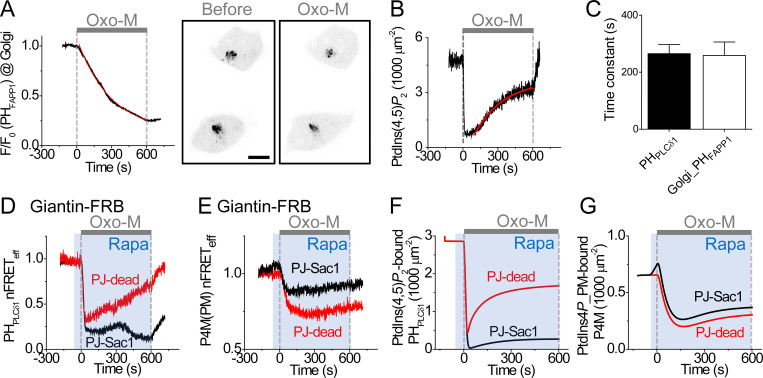
Confocal microscopy with overexpressed fluorescent 4-kinases coexpressed with the auxiliary proteins EFR3 and TTC7 with or without the complexing protein FAM126A showed that, in tsA201 cells, PI4KIIIα fluorescence overlapped both the trans-Golgi region and the cell surface, as did FAM126A (Fig. S5, A and B), whereas PI4KІІІβ fluorescence overlapped primarily the Golgi (Fig. S5 C). Previously, we showed that PtdIns4P pools in both the Golgi and the PM support PtdIns(4,5)P2 synthesis at the PM, which is needed for PM ion channel function (Dickson et al., 2014). Using 3-D confocal images (z-stacks) of the PtdIns4P probe P4M-CFP, we now estimated by integration of intensities in every section that approximately half of cellular P4M-CFP fluorescence is in the Golgi region and half is near the PM (Fig. S6). We measured the time course of depletion of the Golgi PtdIns4P pool during M1R stimulation using a YFP-tagged PH domain of FAPP1 (PHFAPP1; Fig. 6 A). This probe is considered to report trans-Golgi PtdIns4P but not PM PtdIns4P (Hammond et al., 2014; Liu et al., 2014). The confocal images in Fig. 6 A support this selectivity. When Oxo-M was applied, the Golgi PHFAPP1 intensity decreased monotonically, giving no hint of regeneration in this Golgi pool during receptor activation (Fig. 6 A). In parallel experiments, we measured PtdIns(4,5)P2 at the PM with homologous normalized FRET between CFP- and YFP-tagged PHPLCδ1 to calculate quantitative PtdIns(4,5)P2 density by (Fig. 6 B). The quantitative estimation involved a nonlinear transform explained in the Materials and methods (Eq. 1). The time constant for PtdIns(4,5)P2 regeneration at the PM was about the same as that for the reduction of PtdIns4P in the trans-Golgi (Fig. 6 C), as might be the case, for example, if Golgi PtdIns4P were the key source tapped for regeneration of PM PtdIns(4,5)P2. We note that a quite similar but more modest monotonic falling time course of Golgi PHFAPP1 labeling was reported in several cell lines during 30-min application of 100 nM endothelin-1 (de Rubio et al., 2018); however, that paper interpreted the fall as being due to direct hydrolysis of PtdIns4P by PLC in the Golgi rather than due to depletion by transfer to the PM.
Figure 6.
Participation of Golgi PtdIns4P in the regeneration of PM PtdIns(4,5)P2 during M1R activation. (A) Left: Time course of Golgi PtdIns4P level during M1R stimulation measured with photometry of PHFAPP1-YFP, a probe specific for Golgi PtdIns4P. The fluorescence signal normalized to the initial fluorescence (F/F0) was fitted by a single exponential function (red line). Confocal images of PHFAPP1-YFP on the right side show reduction of Golgi PtdIns4P after M1R activation for 10 min. Scale bar, 10 µm. Different experiment from the photometry time course on the left. (B) Time course of PtdIns(4,5)P2 concentration (density) during application of Oxo-M (gray bar) calculated from homologous FRETeff of CFP- and YFP-tagged PHPLCδ1 probes using Eq. 1. Regeneration of PtdIns(4,5)P2 was fitted with a single exponential curve (red line). (C) Mean time constants decrease for Golgi PtdIns4P (n = 3 cells) and increase for PM PtdIns(4,5)P2 (n = 8 cells). (D) Depression of PtdIns(4,5)P2 regeneration by Golgi recruitment of PJ-Sac1 phosphatase or PJ-dead with 1 µM rapamycin (blue shading, Rapa). nFRETeff between CFP- and YFP-tagged PHPLCδ1 domains measured during 10 µM Oxo-M (gray bar). (E) Comparison of PJ-Sac1 or PJ-dead recruitment to the Golgi by 1 µM rapamycin PM on PtdIns4P regeneration during receptor activation. nFRETeff between P4M-CFP and Lyn-YFP measured during application of rapamycin followed by 10 µM Oxo-M. (F and G) Simulation of PtdIns(4,5)P2 regeneration (F) and PtdIns4P regeneration (G) during Golgi action of PJ-Sac1 and PJ-dead using the expanded model also used for Fig. 7 and Fig. S9.
To explore the contribution of Golgi PtdIns4P to regeneration of PtdIns(4,5)P2, we depleted Golgi PtdIns4P by a rapamycin-induced heterodimerization system. A PtdIns4P 4-phosphatase (PJ-Sac1; Hammond et al., 2012) fused with FK506-binding protein (FKBP) was recruited to the Golgi anchor, giantin, fused with an FKBP-rapamycin binding (FRB) domain (Fig. S7 A; Choi et al., 1996; Liang et al., 2014). There, the recruited phosphatase converted Golgi PtdIns4P to PtdIns (Fig. S7 B; Dickson et al., 2014). In control experiments where an enzymatically inactive phosphatase (PJ-dead) was recruited to the Golgi, PtdIns(4,5)P2 regenerated normally during prolonged M1R receptor activation (Fig. 6 D). However, if an active PJ-Sac1 was recruited to the Golgi-localized giantin 60 s before receptor stimulation, the later phase of the PM PtdIns(4,5)P2 regeneration was eliminated (Fig. 6 D; PJ-Dead: 0.67 ± 0.11 nFRETeff at 10 min [n = 5]; PJ-Sac1: 0.32 ± 0.04 nFRETeff at 10 min [P = 0.003; n = 5]). Thus, the Golgi PtdIns4P pool makes a rapid and essential contribution to PtdIns(4,5)P2 regeneration at the PM during receptor activation. Possibly, the early transient of regeneration with PJ-Sac reflects some initial regeneration of PtdIns(4,5)P2 from a small, rapidly depleting pool of PtdIns4P at the PM.
Similar experiments attempted to use P4M probes and Lyn-YFP to monitor PM PtdIns4P, while PJ-dead or PJ-Sac1 was recruited to the Golgi (Fig. 6 E). The control PJ-dead experiment preserved the typical decrease and weak apparent regeneration of PM PtdIns4P. But the PJ-Sac1 recruitment experiment showed an unanticipated initial rise of the PM P4M probe signal with rapamycin before Oxo-M was applied, followed by the expected decrease with Oxo-M and again a small apparent regeneration (Fig. 6 E). Modeling shown later explained the initial rise and the late apparent regeneration as artifacts. Both rises were caused by the large gradual release of the P4M probe from the Golgi, while PJ-Sac1 and PLC action depleted the PtdIns4P pool there (measured in Fig. 6 A). Essentially, P4M probes would be transferred gradually from declining PtdIns4P pools on Golgi membranes to the PM, even if PtdIns4P were constant at the PM. Successful modeling (shown in Fig. 6 G) showed that the evoked intermembrane transfer of P4M probes considerably distorted the experimentally recorded FRET signal. In this case, modeling proved essential to validate our interpretation of an artifact. A similar intermembrane transfer of GFP-P4M-P4M probes but in the opposite direction was reported when PM PtdIns4P was depleted by neurotensin receptor activation, and P4M-P4M probe labeling in the Golgi increased (de Rubio et al., 2018). Such transfers can happen whenever a diffusible probe can label two pools in the cell that have very different temporal dynamics.
Is acceleration of kinases due to DAG and PKC?
Our attention was drawn to observations by Tóth et al. (2016) of significant slow elevations of PM PtdIns4P when cells were stimulated very mildly with only 100 nM carbachol or 17 nM epidermal growth factor. We could duplicate these observations using 10 nM Oxo-M (Fig. S8 A). This slow elevation of PtdIns4P contrasts with the sharp decrease seen with 10 µM Oxo-M (Fig. 5 C) and with the lack of effect of 10 nM Oxo-M in PM PtdIns(4,5)P2 (Fig. S2). Further, Tóth et al. (2016) gave evidence that the secondary increase of PM PtdIns4P was due to DAG-dependent activation of PKC, and we could duplicate these observations, finding that the rise with 10 nM Oxo-M was partly blocked by 2 µM bisindolylmaleimide I (BIM), a PKC inhibitor (Fig. S8 A), and was mimicked by 5 µM PMA, a PKC activator (Fig. S8 B). The slow PtdIns4P rise during the low 10-nM Oxo-M stimulation was reminiscent of the slow regeneration of PtdIns(4,5)P2 that we saw with high agonist concentrations (Fig. 2 B). Did DAG and PKC also contribute to regeneration during this much stronger receptor stimulation? We have seen that DAG itself rises in two phases, an initial transient followed by a secondary slow rise (Fig. 3 C). Hence, it could be possible that DAG is a diphasic signal that through PKC leads to two cumulative stages of activation of lipid kinases during strong receptor stimulation. Unfortunately for this hypothesis, we found that PM PtdIns4P continued to increase during 10-nM Oxo-M stimulation (low agonist concentration) and during 5-µM PMA stimulation, even when the A1 inhibitor was used to block PI4KIIIα (Fig. S8, B and C); additionally, BIM was unable to inhibit regeneration of PtdIns(4,5)P2 at high agonist concentration (Fig. S8 D).
Exploring a kinetic model with Golgi and ER compartments
Another round of refinement of the kinetic model helped us develop a better understanding of the contribution of intracellular organelles to PtdIns(4,5)P2 regeneration. We augmented the previous model by simulating added Golgi pools of PtdIns and PtdIns4P and an ER pool of PtdIns plus additional catalyzed steps represented as gray arrows in Fig. 1. One gray arrow labeled phosphatidylinositol transfer protein (PITP) represents transfer of PtdIns from the ER to the PM by transfer proteins (Kim et al., 2015; Pemberton et al., 2020). Another, labeled PIP5K from Golgi PtdIns4P to PM PtdIns(4,5)P2, represents transfer of PtdIns4P from the Golgi to the PM accompanied by simultaneous phosphorylation by a 5-kinase, an unconventional lumped reaction that we gave evidence for before (Dickson et al., 2014). To make regeneration of PM PtdIns4P independent from Golgi PtdIns4P, the calculations omit a direct Golgi PtdIns4P contribution to PM PtdIns4P, the dashed green line in Fig. 1. The values assumed for fixed kinetic constants, initial conditions, and reaction kinetics in this refined model are summarized in Table S3 and Table S4. The revised simulation, now including both black and gray arrows of Fig. 1, again has the activity of the PI4K enzyme slowly increasing during receptor stimulation now both in the Golgi and in the PM, as plotted in Fig. 7, A and B. The time-dependent activities stepped up quickly initially (at the PM but not for the Golgi) and then increased monotonically with a time constant of 300 s after agonist application. In accord with recent reports that PtdIns is nearly absent from the PM in resting cells (Pemberton et al., 2020; Zewe et al., 2020), the revised model assumed a 1:50:50 (PM:Golgi:ER) basal distribution of PtdIns. And since previous work and our Fig. 2 D reported as little as 10% change of total cellular PtdIns during receptor stimulation (Willars et al., 1998; Horowitz et al., 2005; Traynor-Kaplan et al., 2017), for simplicity the revised model kept the PtdIns of the ER at a constant value and did not represent its synthesis—omitting any green arrows in Fig. 1. PtdIns of the PM and the Golgi was allowed to vary. Pemberton et al. (2020) showed a small (1%) transient increase of PM PtdIns during strong activation of angiotensin II receptors, so we also added a small, slow increase of PITP activity from the ER to the PM (τ = 100 s). In a study similar to ours, Nir2, a PITP, translocated to the PM from the ER during stimulation with a ∼1-min time constant (Chang and Liou, 2015).
We simulated time courses of the actual lipid and product molecules (Fig. 7) as well as time courses of the substrate-bound indicator probes for easier comparison with the experimental traces (Fig. S9). The model gave the following results during receptor stimulation: (i) a biphasic change of PM PtdIns (Fig. 7 C); (ii) a monotonic fall of Golgi PtdIns (Fig. 7 D); (iii) biphasic dynamics of PM Ptdins4P (Fig. 7 E and Fig. S9 A); (iv) a monotonic fall of Golgi PtdIns4P (Fig. 7 F and Fig. S9 B); (v) a fast loss and slow regeneration of PM PtdIns(4,5)P2 (Fig. 7 G and Fig. S9 C); (vi) both a transient and a secondary increase of Ins(1,4,5)P3 (Fig. 7 H and Fig. S9 D); and (vii), a rapid initial and slow further increase of DAG (Fig. 7 I and Fig. S9 E). Most of the PtdIns(4,5)P2 was generated by the lumped transport/5-kinase reaction, depleting the Golgi pool of PtdIns4P faster than it could be synthesized from Golgi PtdIns. The time course of PtdIns4P is shown as regenerating very modestly at the PM and depleting in the Golgi (Fig. 7, E and F). These simulations recapitulate key features of our experimental results (Fig. 2, Fig. 3, Fig. 5, and Fig. 6), supporting time-dependent contributions of Golgi PI4K and Golgi PtdIns4P to the regeneration of PM PtdIns(4,5)P2 during receptor and Gq stimulation. Adding recruitment of Sac1 to the Golgi in the model showed reduced PtdIns(4,5)P2 regeneration (Fig. 6 F) and a transient increase followed by biphasic loss and overshooting rise of the PtdIns4P reporter P4M (Fig. 6 G). Thus, the simulated kinetics recapitulated the experimental results satisfactorily.
Discussion
This study measured the real-time kinetics of phosphoinositides during long activation of M1 muscarinic receptors. We studied PtdIns(4,5)P2, PtdIns4P, and DAG in the PM, PtdIns4P in the Golgi, and Ins(1,4,5)P3 in the cytoplasm. Our focus was on the regeneration of PtdIns(4,5)P2, and the key new approach was to use quantitative interpretations of the results to test hypotheses. In many respects, we support and extend earlier observations concerning (i) receptor-induced acceleration of PtdIns(4,5)P2 synthesis, (ii) the importance of PI4KIIIα as the enzyme to regenerate PM PtdIns(4,5)P2, and (iii) a contribution of PtdIns4P from the Golgi to PM PtdIns(4,5)P2. We now compare our results with the literature and expand our interpretations.
Regeneration of PtdIns(4,5)P2 by acceleration of lipid kinases
We have highlighted PtdIns(4,5)P2 regeneration, a refilling of the PM PtdIns(4,5)P2 pool(s) during prolonged activation of M1R and M5R. Although it has not received much analysis before, quite similar regeneration seems evident in published figures showing chemical analyses of phosphoinositides during receptor activation (Nakanishi et al., 1994; Li et al., 2005; Zaika et al., 2006) and in experiments with PHPLCδ1 probes (Tóth et al., 2016; Ko et al., 2019a; Pemberton et al., 2020). These published experiments used muscarinic and angiotensin II receptors, suggesting that regeneration is not confined to muscarinic receptors. Likely, regeneration in the earlier records did not attract much attention since it would also happen if the receptors had undergone desensitization. In other experiments using known rapidly desensitizing receptors such as the bradykinin receptor or protease activated receptor 2, PtdIns(4,5)P2 recovered even sooner during agonist application (Xu et al., 2003; Jung et al., 2016), but there, it was clear that lipid breakdown had been arrested quickly by rapid and profound receptor desensitization.
Without simultaneous tests for desensitization or for large continued Ins(1,4,5)P3 and DAG production, it would be hard to interpret many isolated records in the literature. Compared with, for example, α1B adrenergic receptors, M1 muscarinic receptors are slow to desensitize (Kienitz et al., 2016). We have found before that although M1 muscarinic receptors do bind β-arrestin-2 to ∼50% occupancy, they are not internalized during a 10-min stimulation (Jung et al., 2017). In our modeling, PtdIns(4,5)P2 regeneration with continued DAG and Ins(1,4,5)P3 production during Oxo-M application could not be explained by slowing PLC (desensitization), but instead required a gradual acceleration of lipid kinase activity. Simulation trials with desensitization of only 50% (starting with overexpressed levels) failed to mimic any regeneration (Fig. 4 M) and, with much stronger desensitization, did show PtdIns(4,5)P2 regeneration but failed to produce accelerating accumulation of Ins(1,4,5)P3 and DAG over 10 min (Fig. 4, N and O). Angiotensin II receptors are also said to desensitize weakly. AT1R has 12 serine/threonine potential phosphorylation sites in the C terminus compared with three in the M1 receptor. Protease activated receptor 2 has 17. In 5 min of angiotensin II exposure, phosphorylation of AT1 receptors only doubles over the resting level, and only 20% of the receptors internalize (Bojjireddy et al., 2015). In the future, it would be nice to see more studies of 10-min applications of angiotensin II combined with some of the more direct functional measures used here and a more quantitative kinetic analysis.
The idea of kinase acceleration upon agonist addition is not new. It was postulated in earlier models of phosphoinositide metabolism. An early model invoked almost immediate 3.5-fold and 19-fold steady increases of PI4K and PIP5K activity, respectively (Xu et al., 2003). This explained a short transient increase of PtdIns(4,5)P2 that preceded a rapid decrease of PtdIns(4,5)P2 during bradykinin application. Similarly, Falkenburger et al. (2013) postulated quick, 10-fold increases of both kinases to explain continued generation of Ins(1,4,5)P3 during 3-min M1 receptor activations. In the latter model, the acceleration of kinases developed within <1 s whenever the Oxo-M concentration was above ∼20 nM. New in our analysis of regeneration is that the early kinase acceleration of the Falkenburger model, though essential, was insufficient to mimic longer agonist applications. We required considerable secondary acceleration of PI4K activity that had to develop slowly—over several minutes—to describe the gradual PtdIns(4,5)P2 regeneration and the continued rise of DAG and Ins(1,4,5)P3. Our final model retained Falkenburger’s rapidly developing (τ = approximately 1 s) 10-fold acceleration of both PM kinases followed by an additional slowly developing (τ = 300 s) acceleration of PM PI4K activity that gradually increased the final rate by 100-fold compared with that of the prestimulus state. We also added a Golgi PI4K activity that did not have an initial increase upon agonist addition but was also gradually accelerated up to 10-fold by a 300-s, slowly developing process.
Although the mathematical evidence for agonist-induced acceleration of kinases is strong, the underlying mechanisms are unresolved. In terms of intracellular signaling mechanisms, acceleration of lipid kinase activities occurs in two phases, one fast (a few seconds) and one slow (several minutes) during agonist action. These may involve two distinct signaling systems, or they may engage the same signal twice. Many intracellular signals are produced by M1 receptors including DAG, Ca2+, arrestin, and Ras-Raf-MEK-ERK pathways as well as depletion of several phosphoinositide pools. In the experiments of Fig. S8, we had to reject the hypothesis that the acceleration of lipid kinases needed for regeneration is a simple consequence of DAG-activated PKC. The regulation of PI 4-kinases is probably complicated. They are versatile enzymes, forming multivalent complexes with many regulatory partners (Boura and Nencka, 2015; Burke, 2018). For example, soluble PI4KIIIα is brought to the PM in a complex with EFR3 and TTC7 (Nakatsu et al., 2012) scaffolded by FAM126 (Baskin et al., 2016; Lees et al., 2017), and TTC7 is liberated from the complex by TMEM150 (Chung et al., 2015); PI4KIIIβ is stimulated by neuronal calcium sensor 1 (Nakamura et al., 2019), cholesterol (Nishimura et al., 2019), and many other partners (Burke, 2018). In addition to the EFR3B/TTC7B/PI4KIIIα complex, the literature describes EFR3B/TMEM150A/PI4KIIIα and EFR3B/CXCR4/PI4KIIIα complexes (Chung et al., 2015; Sbrissa et al., 2018). Further, the 4-kinases and 5-kinases associate with PKCμ (Nishikawa et al., 1998), and in some experiments and modeling, the 4- and 5-kinases have been postulated to act together as a complex that performs a two-step synthesis of PtdIns(4,5)P2 directly from PtdIns (Choi et al., 2016; Olivença et al., 2018). Much more work is needed to dissect the mechanisms of the acceleration described here and to determine which subtypes of kinases are accelerated, where, and how.
Subtype(s) of PI4K and sources of PtdIns4P
The importance of type III PI4Ks to synthesize PM PtdIns(4,5)P2 was recognized in decades-old studies. Measurements using 32P-labeled lipids or 3H-labeled inositol and 10-min applications of angiotensin II showed regeneration of PtdIns(4,5)P2 and PtdIns4P as well as slowly growing Ins(1,4,5)P3 production, all eliminated by Wtn (Nakanishi et al., 1994, 1995) and by PAO but not by PIK93 (Balla et al., 2008). Regeneration of PtdIns(4,5)P2 and PtdIns4P is also blocked by the newly described selective inhibitor A1 (Bojjireddy et al., 2014). Similarly, with optical probes, Tóth et al. (2016) using angiotensin II and we in this paper using Oxo-M found that PtdIns(4,5)P2 regeneration and growing Ins(1,4,5)P3 production are eliminated by A1 and not by PIK93. Thus, PI4KIIIα is key for PtdIns(4,5)P2 regeneration. Further, possible PM PtdIns4P regeneration was absent when we abolished PI4K activities by PAO. In fibroblasts, selective knockout of PI4KIIIα reduces total cellular PtdIns4P to 25% and causes some intracellular membranes to acquire PtdIns(4,5)P2 and take up a PM-like identity (Nakatsu et al., 2012). Nakatsu et al. (2012) concluded that “targeting of PI4KIIIα to the PM is a key upstream event in defining the proteomic and lipidomic identity of [the PM].”
Where are the PI4KIIIα enzyme and the synthesis of PtdIns4P? It has been reported that PI4KIIIα localizes to the PM and some internal membranes and that PI4KIIIβ localizes to the Golgi (Hammond et al., 2014). The images in the Hammond et al. (2014) paper suggest to us that the most intense label for PI4KIIIα is again overlapping the Golgi region. We found overexpressed PI4KIIIα not only in the PM but also partially overlapping with TGN38 in the trans-Golgi (Fig. S5, A and B; 6 out of 10 cells), whereas we found overexpressed PI4KIIIβ in the cis-Golgi, colocalized with giantin (Fig. S5 C; 6 out of 7 cells; Luzio et al., 1990; Mardones et al., 2006). The former kinase contributes to regeneration of PtdIns(4,5)P2, and the latter does not (Fig. 5 B; A1 versus PIK93). Bojjireddy et al. (2014) concluded that the A1-sensitive kinase is necessary for what we have called PtdIns(4,5)P2 regeneration during PLC activation but not for PtdIns(4,5)P2 maintenance in resting cells. This brings up the interesting concept that receptor activation may call into play a lipid kinase pathway that is different from the “housekeeping” pathway that accounts for the normal predominance of PtdIns(4,5)P2 at the PM.
Where is the parent compound, PtdIns, the most abundant phosphoinositide? Newly developed probes reveal its significant presence in the Golgi, mitochondria, peroxisomes, and ER (Pemberton et al., 2020; Zewe et al., 2020). PtdIns is detectable but at a much lower concentration in the PM, both in resting and in receptor-stimulated cells.
Where is the PtdIns4P product? Significant pools of PtdIns4P are present in the Golgi, the small vesicles, and the PM (Hammond et al., 2014), whereas the ER harbors the transmembrane 4-phosphatase enzyme Sac1 that destroys any PtdIns4P there. Using the P4M probe (Hammond et al., 2014), we estimated that half of the P4M stain is in the PM and half is in the Golgi. In our modeling (Fig. 1 and Falkenburger et al., 2013) and in experimental tests (de Rubio et al., 2018), PM PtdIns4P is considered an alternative direct substrate of receptor-activated PLC (Table S2 and Table S4) in addition to the main substrate PtdIns(4,5)P2. Mass spectrometry reports that 50% of the total cellular PtdInsP is gone after 5 s of exposure to Oxo-M (Traynor-Kaplan et al., 2017), presumably meaning that this large fraction of PtdInsP is immediately accessible and susceptible to rapid depletion by PLC at the PM. By 60 s, the total cellular PtdInsP is depleted to 25% of control.
The pool of PtdIns4P in the PM has puzzling properties. Although sizeable, this PM pool seems not as closely coupled to the PM PtdIns(4,5)P2 pool as expected. Three types of experiments suggest that the PM PtdInsP pool is not the main precursor of PM PtdIns(4,5)P2. (i) When the 4-phosphatase PJ-Sac1 is recruited by rapamycin dimerization to the PM, either nothing happens to the resting PM PtdIns(4,5)P2 pool (Hammond et al., 2012; Hammond et al., 2014) or the pool is just partially but not fully depleted (Dickson et al., 2014). In either case, the remaining PtdIns(4,5)P2 could be much further depleted by application of a receptor agonist and could still partly recover after removal of agonist. Related experiments suggest that PM PtdInsP can be depleted without affecting PM PtdIns(4,5)P2 and that PM PtdIns(4,5)P2 can be depleted without affecting PM PtdInsP (de Rubio et al., 2018). (ii) In our experiments, when the activity of PI4KIIIα was blocked by Wtn or A1, a small PtdIns4P regeneration during Oxo-M action still seemed to be occurring at the PM, suggesting that regenerating PtdIns4P at the PM is produced by 4-kinases other than PI4KIIIα, kinases that are not inhibited by Wtn and A1. (iii) When PJ-Sac1 is directed by rapamycin dimerization to the Golgi, the resting PM PtdIns(4,5)P2 pool (reported by KCNQ ion channels) drops within 30 s by 40% (Dickson et al., 2014), and within just 60 s, the regeneration of PM PtdIns(4,5)P2 (reported by PHPLCδ1 probes) during long agonist application is fully blocked (Fig. 6 D). Taken together, we interpret these findings to mean that during regeneration of PtdIns(4,5)P2, much of the necessary PtdIns4P precursor generated by PI4KIIIα is coming from the Golgi in a protected manner that exposes it neither to dephosphorylation by the PJ-Sac1 that has been artificially translocated to the PM nor to activated PLC. Perhaps the PtdIns4P is converted to PtdIns(4,5)P2 in transit (Fig. 1). To be more cautious, rather than concluding that agonist accelerates just the PI4KIIIα enzyme, we might have to say that agonist accelerates the arrows that collectively represent A1-sensitive production and/or delivery of PI4KIIIα products.
Quantitative questions that remain
Fig. 1 and our model are only approximate representations to be revised as we continue to learn more from future research. The locations of synthesis of PtdIns need better specification. Traditionally it is the ER, but are there subdomains of the ER that communicate most efficiently with the Golgi? Myo-inositol is one of the precursor ingredients for PtdIns synthesis. We have shown it can be rate limiting so that a cell that is starved for myo-inositol and unable to retrieve it from Ins(1,4,5)P3 cannot sustain regeneration of PtdIns(4,5)P2 beyond a few minutes (Fig. 3 E). Supplying extra myo-inositol in the medium or in the intracellular solution dramatically increased the resting PM PtdIns(4,5)P2 pools in 2 h or 12 min, respectively (Dai et al., 2016). Unexpectedly, however, mass spectrometry revealed that exposing cells to myo-inositol overnight did not increase the total cellular amount (in all pools) of the necessary parent compound PtdIns (Dai et al., 2016), although it almost doubled the total amount of cellular PtdInsP2 and PtdInsP. Perhaps of the many recently identified pools of PtdIns listed above, only a small subset is effectively in the pipeline to generate PtdIns4P and PM PtdIns(4,5)P2 during receptor activation. Possibly, the Golgi and the ER or just subdomains of these organelles, such as the trans-Golgi, supply the precursor for PtdIns4P and PtdIns(4,5)P2 synthesis. In this way, the other larger pools of PtdIns are off the express track and are not affected. The dynamics of the pools of PtdIns and of the precursors myo-inositol and phosphatidic acid remain to be determined.
There are other issues. How would Golgi PtdIns4P be delivered to the PM? What are the molecular determinants of the unconventional reaction arrow between the Golgi and the PM lumping a lipid transfer with a 5-kinase (Fig. 1), and how else does Golgi PtdIns4P get to the PM? What are the kinetic parameters and pools of lipid exchange reactions, such as the coupled PtdIns/phosphatidic acid exchange reaction represented as separate arrows on the far left and far right of the figure (inspired by Nir2; Chang and Liou, 2015; Kim et al., 2015) or retrograde transfer of PtdIns4P to the ER by oxysterol-binding protein–related proteins (ORPs; Sohn et al., 2018)? Does Golgi PtdIns4P hydrolysis by activation of PLCβ directly affect PtdIns(4,5)P2 regeneration? Does a pool of PtdIns5P contribute significantly to PtdIns(4,5)P2 regeneration? Can these processes be incorporated into a self-consistent model?
Conclusions
Activation of muscarinic receptors engages both an early fast and a second gradual but large acceleration of lipid kinases. An accelerated PI4KIIIα pathway participates in the regeneration of PM PtdIns(4,5)P2 but is less important for regeneration of PM PtdIns4P. Regeneration of PM PtdIns(4,5)P2 depends on PtdIns4P synthesized elsewhere, including in the Golgi.
Supplementary Material
lists the initial conditions and parameters for the model shown in Fig. 4.
describes the differential equation for the model shown in Fig. 4.
lists the initial conditions and parameters for the model shown in Fig. 7 and Fig. S9.
describes the differential equations for the model shown in Fig. 7 and Fig. S9.
Acknowledgments
Jeanne M. Nerbonne served as editor.
We thank Lea M. Miller for technical assistance, Dr. Alexis Traynor-Kaplan for help with mass spectrometry, and Drs. Bjoern Falkenburger, Jill B. Jensen, Martin Kruse, Luis Vaca, and Oscar Vivas for insightful comments on the manuscript.
This work was supported by a grant from the National Institutes of Health (R37-NS08174), by the Basic Science Research Program through the National Research Foundation of Korea funded by the Ministry of Education (2019R1A6A3A03031486), and by the Wayne E. Crill Endowed Professorship. The Virtual Cell is supported by the National Institute of General Medical Sciences/National Institutes of Health (grant R24 GM137787).
The authors declare no competing financial interests.
Author contributions: J. Myeong, L. de la Cruz, S.-R. Jung, J.-H. Yeon, B.-C. Suh, D.-S. Koh, and B. Hille designed and planned the experiments. J. Myeong, L. de la Cruz, J.-H. Yeon, and S.R. Jung performed the experiments. J. Myeong analyzed the data. J. Myeong, D.-S. Koh, and B. Hille interpreted the data and wrote the paper.
References
- Anderson K.E., Kielkowska A., Durrant T.N., Juvin V., Clark J., Stephens L.R., and Hawkins P.T.. 2013. Lysophosphatidylinositol-acyltransferase-1 (LPIAT1) is required to maintain physiological levels of PtdIns and PtdInsP2 in the mouse. PLoS One. 8 e58425 10.1371/journal.pone.0058425 [DOI] [PMC free article] [PubMed] [Google Scholar]
- Balla T. 2013. Phosphoinositides: tiny lipids with giant impact on cell regulation. Physiol. Rev. 93:1019–1137. 10.1152/physrev.00028.2012 [DOI] [PMC free article] [PubMed] [Google Scholar]
- Balla A., Tuymetova G., Tsiomenko A., Várnai P., and Balla T.. 2005. A plasma membrane pool of phosphatidylinositol 4-phosphate is generated by phosphatidylinositol 4-kinase type-III alpha: studies with the PH domains of the oxysterol binding protein and FAPP1. Mol. Biol. Cell. 16:1282–1295. 10.1091/mbc.e04-07-0578 [DOI] [PMC free article] [PubMed] [Google Scholar]
- Balla A., Kim Y.J., Varnai P., Szentpetery Z., Knight Z., Shokat K.M., and Balla T.. 2008. Maintenance of hormone-sensitive phosphoinositide pools in the plasma membrane requires phosphatidylinositol 4-kinase IIIalpha. Mol. Biol. Cell. 19:711–721. 10.1091/mbc.e07-07-0713 [DOI] [PMC free article] [PubMed] [Google Scholar]
- Baskin J.M., Wu X., Christiano R., Oh M.S., Schauder C.M., Gazzerro E., Messa M., Baldassari S., Assereto S., Biancheri R., et al. . 2016. The leukodystrophy protein FAM126A (hyccin) regulates PtdIns(4)P synthesis at the plasma membrane. Nat. Cell Biol. 18:132–138. 10.1038/ncb3271 [DOI] [PMC free article] [PubMed] [Google Scholar]
- Berridge M.J., Downes C.P., and Hanley M.R.. 1989. Neural and developmental actions of lithium: a unifying hypothesis. Cell. 59:411–419. 10.1016/0092-8674(89)90026-3 [DOI] [PubMed] [Google Scholar]
- Bojjireddy N., Botyanszki J., Hammond G., Creech D., Peterson R., Kemp D.C., Snead M., Brown R., Morrison A., Wilson S., et al. . 2014. Pharmacological and genetic targeting of the PI4KA enzyme reveals its important role in maintaining plasma membrane phosphatidylinositol 4-phosphate and phosphatidylinositol 4,5-bisphosphate levels. J. Biol. Chem. 289:6120–6132. 10.1074/jbc.M113.531426 [DOI] [PMC free article] [PubMed] [Google Scholar]
- Bojjireddy N., Guzman-Hernandez M.L., Reinhard N.R., Jovic M., and Balla T.. 2015. EFR3s are palmitoylated plasma membrane proteins that control responsiveness to G-protein-coupled receptors. J. Cell Sci. 128:118–128. 10.1242/jcs.157495 [DOI] [PMC free article] [PubMed] [Google Scholar]
- Boura E., and Nencka R.. 2015. Phosphatidylinositol 4-kinases: Function, structure, and inhibition. Exp. Cell Res. 337:136–145. 10.1016/j.yexcr.2015.03.028 [DOI] [PubMed] [Google Scholar]
- Burke J.E. 2018. Structural Basis for Regulation of Phosphoinositide Kinases and Their Involvement in Human Disease. Mol. Cell. 71:653–673. 10.1016/j.molcel.2018.08.005 [DOI] [PubMed] [Google Scholar]
- Chang C.L., and Liou J.. 2015. Phosphatidylinositol 4,5-Bisphosphate Homeostasis Regulated by Nir2 and Nir3 Proteins at Endoplasmic Reticulum-Plasma Membrane Junctions. J. Biol. Chem. 290:14289–14301. 10.1074/jbc.M114.621375 [DOI] [PMC free article] [PubMed] [Google Scholar]
- Choi J., Chen J., Schreiber S.L., and Clardy J.. 1996. Structure of the FKBP12-rapamycin complex interacting with the binding domain of human FRAP. Science. 273:239–242. 10.1126/science.273.5272.239 [DOI] [PubMed] [Google Scholar]
- Choi S., Hedman A.C., Sayedyahossein S., Thapa N., Sacks D.B., and Anderson R.A.. 2016. Agonist-stimulated phosphatidylinositol-3,4,5-trisphosphate generation by scaffolded phosphoinositide kinases. Nat. Cell Biol. 18:1324–1335. 10.1038/ncb3441 [DOI] [PMC free article] [PubMed] [Google Scholar]
- Chung J., Nakatsu F., Baskin J.M., and De Camilli P.. 2015. Plasticity of PI4KIIIα interactions at the plasma membrane. EMBO Rep. 16:312–320. 10.15252/embr.201439151 [DOI] [PMC free article] [PubMed] [Google Scholar]
- Cowan A.E., Moraru I.I., Schaff J.C., Slepchenko B.M., and Loew L.M.. 2012. Spatial modeling of cell signaling networks. Methods Cell Biol. 110:195–221. 10.1016/B978-0-12-388403-9.00008-4 [DOI] [PMC free article] [PubMed] [Google Scholar]
- Dai G., Yu H., Kruse M., Traynor-Kaplan A., and Hille B.. 2016. Osmoregulatory inositol transporter SMIT1 modulates electrical activity by adjusting PI(4,5)P2 levels. Proc. Natl. Acad. Sci. USA. 113:E3290–E3299. 10.1073/pnas.1606348113 [DOI] [PMC free article] [PubMed] [Google Scholar]
- de Barry J., Janoshazi A., Dupont J.L., Procksch O., Chasserot-Golaz S., Jeromin A., and Vitale N.. 2006. Functional implication of neuronal calcium sensor-1 and phosphoinositol 4-kinase-β interaction in regulated exocytosis of PC12 cells. J. Biol. Chem. 281:18098–18111. 10.1074/jbc.M509842200 [DOI] [PubMed] [Google Scholar]
- de Rubio R.G., Ransom R.F., Malik S., Yule D.I., Anantharam A., and Smrcka A.V.. 2018. Phosphatidylinositol 4-phosphate is a major source of GPCR-stimulated phosphoinositide production. Sci. Signal. 11:eaan1210 10.1126/scisignal.aan1210 [DOI] [PMC free article] [PubMed] [Google Scholar]
- Dickson E.J., and Hille B.. 2019. Understanding phosphoinositides: rare, dynamic, and essential membrane phospholipids. Biochem. J. 476:1–23. 10.1042/BCJ20180022 [DOI] [PMC free article] [PubMed] [Google Scholar]
- Dickson E.J., Falkenburger B.H., and Hille B.. 2013. Quantitative properties and receptor reserve of the IP3 and calcium branch of Gq-coupled receptor signaling. J. Gen. Physiol. 141:521–535. 10.1085/jgp.201210886 [DOI] [PMC free article] [PubMed] [Google Scholar]
- Dickson E.J., Jensen J.B., and Hille B.. 2014. Golgi and plasma membrane pools of PI(4)P contribute to plasma membrane PI(4,5)P2 and maintenance of KCNQ2/3 ion channel current. Proc. Natl. Acad. Sci. USA. 111:E2281–E2290. 10.1073/pnas.1407133111 [DOI] [PMC free article] [PubMed] [Google Scholar]
- Erickson M.G., Alseikhan B.A., Peterson B.Z., and Yue D.T.. 2001. Preassociation of calmodulin with voltage-gated Ca2+ channels revealed by FRET in single living cells. Neuron. 31:973–985. 10.1016/S0896-6273(01)00438-X [DOI] [PubMed] [Google Scholar]
- Falkenburger B.H., Jensen J.B., and Hille B.. 2010. Kinetics of PIP2 metabolism and KCNQ2/3 channel regulation studied with a voltage-sensitive phosphatase in living cells. J. Gen. Physiol. 135:99–114. 10.1085/jgp.200910345 [DOI] [PMC free article] [PubMed] [Google Scholar]
- Falkenburger B.H., Dickson E.J., and Hille B.. 2013. Quantitative properties and receptor reserve of the DAG and PKC branch of Gq-coupled receptor signaling. J. Gen. Physiol. 141:537–555. 10.1085/jgp.201210887 [DOI] [PMC free article] [PubMed] [Google Scholar]
- Hallcher L.M., and Sherman W.R.. 1980. The effects of lithium ion and other agents on the activity of myo-inositol-1-phosphatase from bovine brain. J. Biol. Chem. 255:10896–10901. [PubMed] [Google Scholar]
- Hammond G.R., Fischer M.J., Anderson K.E., Holdich J., Koteci A., Balla T., and Irvine R.F.. 2012. PI4P and PI(4,5)P2 are essential but independent lipid determinants of membrane identity. Science. 337:727–730. 10.1126/science.1222483 [DOI] [PMC free article] [PubMed] [Google Scholar]
- Hammond G.R., Machner M.P., and Balla T.. 2014. A novel probe for phosphatidylinositol 4-phosphate reveals multiple pools beyond the Golgi. J. Cell Biol. 205:113–126. 10.1083/jcb.201312072 [DOI] [PMC free article] [PubMed] [Google Scholar]
- Hansen S.H., Olsson A., and Casanova J.E.. 1995. Wortmannin, an inhibitor of phosphoinositide 3-kinase, inhibits transcytosis in polarized epithelial cells. J. Biol. Chem. 270:28425–28432. 10.1074/jbc.270.47.28425 [DOI] [PubMed] [Google Scholar]
- Hille B., Dickson E.J., Kruse M., Vivas O., and Suh B.C.. 2015. Phosphoinositides regulate ion channels. Biochim. Biophys. Acta. 1851:844–856. 10.1016/j.bbalip.2014.09.010 [DOI] [PMC free article] [PubMed] [Google Scholar]
- Hirose K., Kadowaki S., Tanabe M., Takeshima H., and Iino M.. 1999. Spatiotemporal dynamics of inositol 1,4,5-trisphosphate that underlies complex Ca2+ mobilization patterns. Science. 284:1527–1530. 10.1126/science.284.5419.1527 [DOI] [PubMed] [Google Scholar]
- Horowitz L.F., Hirdes W., Suh B.C., Hilgemann D.W., Mackie K., and Hille B.. 2005. Phospholipase C in living cells: activation, inhibition, Ca2+ requirement, and regulation of M current. J. Gen. Physiol. 126:243–262. 10.1085/jgp.200509309 [DOI] [PMC free article] [PubMed] [Google Scholar]
- Inoue T., Heo W.D., Grimley J.S., Wandless T.J., and Meyer T.. 2005. An inducible translocation strategy to rapidly activate and inhibit small GTPase signaling pathways. Nat. Methods. 2:415–418. 10.1038/nmeth763 [DOI] [PMC free article] [PubMed] [Google Scholar]
- Itsuki K., Imai Y., Hase H., Okamura Y., Inoue R., and Mori M.X.. 2014. PLC-mediated PI(4,5)P2 hydrolysis regulates activation and inactivation of TRPC6/7 channels. J. Gen. Physiol. 143:183–201. 10.1085/jgp.201311033 [DOI] [PMC free article] [PubMed] [Google Scholar]
- Jung S.R., Seo J.B., Deng Y., Asbury C.L., Hille B., and Koh D.S.. 2016. Contributions of protein kinases and β-arrestin to termination of protease-activated receptor 2 signaling. J. Gen. Physiol. 147:255–271. 10.1085/jgp.201511477 [DOI] [PMC free article] [PubMed] [Google Scholar]
- Jung S.R., Kushmerick C., Seo J.B., Koh D.S., and Hille B.. 2017. Muscarinic receptor regulates extracellular signal regulated kinase by two modes of arrestin binding. Proc. Natl. Acad. Sci. USA. 114:E5579–E5588. 10.1073/pnas.1700331114 [DOI] [PMC free article] [PubMed] [Google Scholar]
- Keum D., Kruse M., Kim D.I., Hille B., and Suh B.C.. 2016. Phosphoinositide 5- and 3-phosphatase activities of a voltage-sensing phosphatase in living cells show identical voltage dependence. Proc. Natl. Acad. Sci. USA. 113:E3686–E3695. 10.1073/pnas.1606472113 [DOI] [PMC free article] [PubMed] [Google Scholar]
- Kienitz M.C., Vladimirova D., Müller C., Pott L., and Rinne A.. 2016. Receptor Species-dependent Desensitization Controls KCNQ1/KCNE1 K+ Channels as Downstream Effectors of Gq Protein-coupled Receptors. J. Biol. Chem. 291:26410–26426. 10.1074/jbc.M116.746974 [DOI] [PMC free article] [PubMed] [Google Scholar]
- Kim Y.J., Guzman-Hernandez M.L., Wisniewski E., and Balla T.. 2015. Phosphatidylinositol-Phosphatidic Acid Exchange by Nir2 at ER-PM Contact Sites Maintains Phosphoinositide Signaling Competence. Dev. Cell. 33:549–561. 10.1016/j.devcel.2015.04.028 [DOI] [PMC free article] [PubMed] [Google Scholar]
- Kirk C.J., Creba J.A., Downes C.P., and Michell R.H.. 1981. Hormone-stimulated metabolism of inositol lipids and its relationship to hepatic receptor function. Biochem. Soc. Trans. 9:377–379. 10.1042/bst0090377 [DOI] [PubMed] [Google Scholar]
- Ko J., Myeong J., Kwak M., Jeon J.H., and So I.. 2019a Identification of phospholipase C β downstream effect on transient receptor potential canonical 1/4, transient receptor potential canonical 1/5 channels. Korean J. Physiol. Pharmacol. 23:357–366. 10.4196/kjpp.2019.23.5.357 [DOI] [PMC free article] [PubMed] [Google Scholar]
- Ko J., Myeong J., Shin Y.C., and So I.. 2019b Differential PI(4,5)P2 sensitivities of TRPC4, C5 homomeric and TRPC1/4, C1/5 heteromeric channels. Sci. Rep. 9:1849 10.1038/s41598-018-38443-0 [DOI] [PMC free article] [PubMed] [Google Scholar]
- Komatsu T., Kukelyansky I., McCaffery J.M., Ueno T., Varela L.C., and Inoue T.. 2010. Organelle-specific, rapid induction of molecular activities and membrane tethering. Nat. Methods. 7:206–208. 10.1038/nmeth.1428 [DOI] [PMC free article] [PubMed] [Google Scholar]
- Lees J.A., Zhang Y., Oh M.S., Schauder C.M., Yu X., Baskin J.M., Dobbs K., Notarangelo L.D., De Camilli P., Walz T., and Reinisch K.M.. 2017. Architecture of the human PI4KIIIα lipid kinase complex. Proc. Natl. Acad. Sci. USA. 114:13720–13725. 10.1073/pnas.1718471115 [DOI] [PMC free article] [PubMed] [Google Scholar]
- Li Y., Gamper N., Hilgemann D.W., and Shapiro M.S.. 2005. Regulation of Kv7 (KCNQ) K+ channel open probability by phosphatidylinositol 4,5-bisphosphate. J. Neurosci. 25:9825–9835. 10.1523/JNEUROSCI.2597-05.2005 [DOI] [PMC free article] [PubMed] [Google Scholar]
- Liang H., He S., Yang J., Jia X., Wang P., Chen X., Zhang Z., Zou X., McNutt M.A., Shen W.H., and Yin Y.. 2014. PTENα, a PTEN isoform translated through alternative initiation, regulates mitochondrial function and energy metabolism. Cell Metab. 19:836–848. 10.1016/j.cmet.2014.03.023 [DOI] [PMC free article] [PubMed] [Google Scholar]
- Liu Y., Kahn R.A., and Prestegard J.H.. 2014. Interaction of Fapp1 with Arf1 and PI4P at a membrane surface: an example of coincidence detection. Structure. 22:421–430. 10.1016/j.str.2013.12.011 [DOI] [PMC free article] [PubMed] [Google Scholar]
- Luzio J.P., Brake B., Banting G., Howell K.E., Braghetta P., and Stanley K.K.. 1990. Identification, sequencing and expression of an integral membrane protein of the trans-Golgi network (TGN38). Biochem. J. 270:97–102. 10.1042/bj2700097 [DOI] [PMC free article] [PubMed] [Google Scholar]
- Mardones G.A., Snyder C.M., and Howell K.E.. 2006. Cis-Golgi matrix proteins move directly to endoplasmic reticulum exit sites by association with tubules. Mol. Biol. Cell. 17:525–538. 10.1091/mbc.e05-05-0447 [DOI] [PMC free article] [PubMed] [Google Scholar]
- Myeong J., Kwak M., Jeon J.P., Hong C., Jeon J.H., and So I.. 2015. Close spatio-association of the transient receptor potential canonical 4 (TRPC4) channel with Gαi in TRPC4 activation process. Am. J. Physiol. Cell Physiol. 308:C879–C889. 10.1152/ajpcell.00374.2014 [DOI] [PubMed] [Google Scholar]
- Myeong J., Ko J., Kwak M., Kim J., Woo J., Ha K., Hong C., Yang D., Kim H.J., Jeon J.H., and So I.. 2018. Dual action of the Gαq-PLCβ-PI(4,5)P2 pathway on TRPC1/4 and TRPC1/5 heterotetramers. Sci. Rep. 8:12117 10.1038/s41598-018-30625-0 [DOI] [PMC free article] [PubMed] [Google Scholar]
- Nakamura T.Y., Nakao S., and Wakabayashi S.. 2019. Emerging Roles of Neuronal Ca2+ Sensor-1 in Cardiac and Neuronal Tissues: A Mini Review. Front. Mol. Neurosci. 12:56 10.3389/fnmol.2019.00056 [DOI] [PMC free article] [PubMed] [Google Scholar]
- Nakanishi S., Catt K.J., and Balla T.. 1994. Inhibition of agonist-stimulated inositol 1,4,5-trisphosphate production and calcium signaling by the myosin light chain kinase inhibitor, wortmannin. J. Biol. Chem. 269:6528–6535. [PubMed] [Google Scholar]
- Nakanishi S., Catt K.J., and Balla T.. 1995. A wortmannin-sensitive phosphatidylinositol 4-kinase that regulates hormone-sensitive pools of inositolphospholipids. Proc. Natl. Acad. Sci. USA. 92:5317–5321. 10.1073/pnas.92.12.5317 [DOI] [PMC free article] [PubMed] [Google Scholar]
- Nakatsu F., Baskin J.M., Chung J., Tanner L.B., Shui G., Lee S.Y., Pirruccello M., Hao M., Ingolia N.T., Wenk M.R., and De Camilli P.. 2012. PtdIns4P synthesis by PI4KIIIα at the plasma membrane and its impact on plasma membrane identity. J. Cell Biol. 199:1003–1016. 10.1083/jcb.201206095 [DOI] [PMC free article] [PubMed] [Google Scholar]
- Nishikawa K., Toker A., Wong K., Marignani P.A., Johannes F.J., and Cantley L.C.. 1998. Association of protein kinase Cmu with type II phosphatidylinositol 4-kinase and type I phosphatidylinositol-4-phosphate 5-kinase. J. Biol. Chem. 273:23126–23133. 10.1074/jbc.273.36.23126 [DOI] [PubMed] [Google Scholar]
- Nishimura T., Gecht M., Covino R., Hummer G., Surma M.A., Klose C., Arai H., Kono N., and Stefan C.J.. 2019. Osh Proteins Control Nanoscale Lipid Organization Necessary for PI(4,5)P2 Synthesis. Mol. Cell. 75:1043–1057.e8. 10.1016/j.molcel.2019.06.037 [DOI] [PMC free article] [PubMed] [Google Scholar]
- Olivença D.V., Uliyakina I., Fonseca L.L., Amaral M.D., Voit E.O., and Pinto F.R.. 2018. A Mathematical Model of the Phosphoinositide Pathway. Sci. Rep. 8:3904 10.1038/s41598-018-22226-8 [DOI] [PMC free article] [PubMed] [Google Scholar]
- Pemberton J.G., Kim Y.J., Humpolickova J., Eisenreichova A., Sengupta N., Toth D.J., Boura E., and Balla T.. 2020. Defining the subcellular distribution and metabolic channeling of phosphatidylinositol. J. Cell Biol. 219:e201906130 10.1083/jcb.201906130 [DOI] [PMC free article] [PubMed] [Google Scholar]
- Quinn K.V., Behe P., and Tinker A.. 2008. Monitoring changes in membrane phosphatidylinositol 4,5-bisphosphate in living cells using a domain from the transcription factor tubby. J. Physiol. 586:2855–2871. 10.1113/jphysiol.2008.153791 [DOI] [PMC free article] [PubMed] [Google Scholar]
- Sbrissa D., Naisan G., Ikonomov O.C., and Shisheva A.. 2018. Apilimod, a candidate anticancer therapeutic, arrests not only PtdIns(3,5)P2 but also PtdIns5P synthesis by PIKfyve and induces bafilomycin A1-reversible aberrant endomembrane dilation. PLoS One. 13:e0204532 10.1371/journal.pone.0204532 [DOI] [PMC free article] [PubMed] [Google Scholar]
- Schaff J., Fink C.C., Slepchenko B., Carson J.H., and Loew L.M.. 1997. A general computational framework for modeling cellular structure and function. Biophys. J. 73:1135–1146. 10.1016/S0006-3495(97)78146-3 [DOI] [PMC free article] [PubMed] [Google Scholar]
- Sherman W.R., Munsell L.Y., Gish B.G., and Honchar M.P.. 1985. Effects of systemically administered lithium on phosphoinositide metabolism in rat brain, kidney, and testis. J. Neurochem. 44:798–807. 10.1111/j.1471-4159.1985.tb12886.x [DOI] [PubMed] [Google Scholar]
- Sims C.E., and Allbritton N.L.. 1998. Metabolism of inositol 1,4,5-trisphosphate and inositol 1,3,4,5-tetrakisphosphate by the oocytes of Xenopus laevis. J. Biol. Chem. 273:4052–4058. 10.1074/jbc.273.7.4052 [DOI] [PubMed] [Google Scholar]
- Sohn M., Korzeniowski M., Zewe J.P., Wills R.C., Hammond G.R.V., Humpolickova J., Vrzal L., Chalupska D., Veverka V., Fairn G.D., et al. . 2018. PI(4,5)P2 controls plasma membrane PI4P and PS levels via ORP5/8 recruitment to ER-PM contact sites. J. Cell Biol. 217:1797–1813. 10.1083/jcb.201710095 [DOI] [PMC free article] [PubMed] [Google Scholar]
- Suh B.C., and Hille B.. 2006. Does diacylglycerol regulate KCNQ channels? Pflugers Arch. 453:293–301. 10.1007/s00424-006-0092-3 [DOI] [PubMed] [Google Scholar]
- Szentpetery Z., Balla A., Kim Y.J., Lemmon M.A., and Balla T.. 2009. Live cell imaging with protein domains capable of recognizing phosphatidylinositol 4,5-bisphosphate; a comparative study. BMC Cell Biol. 10:67 10.1186/1471-2121-10-67 [DOI] [PMC free article] [PubMed] [Google Scholar]
- Szentpetery Z., Várnai P., and Balla T.. 2010. Acute manipulation of Golgi phosphoinositides to assess their importance in cellular trafficking and signaling. Proc. Natl. Acad. Sci. USA. 107:8225–8230. 10.1073/pnas.1000157107 [DOI] [PMC free article] [PubMed] [Google Scholar]
- Tanimura A., Nezu A., Morita T., Turner R.J., and Tojyo Y.. 2004. Fluorescent biosensor for quantitative real-time measurements of inositol 1,4,5-trisphosphate in single living cells. J. Biol. Chem. 279:38095–38098. 10.1074/jbc.C400312200 [DOI] [PubMed] [Google Scholar]
- Tóth J.T., Gulyás G., Tóth D.J., Balla A., Hammond G.R., Hunyady L., Balla T., and Várnai P.. 2016. BRET-monitoring of the dynamic changes of inositol lipid pools in living cells reveals a PKC-dependent PtdIns4P increase upon EGF and M3 receptor activation. Biochim. Biophys. Acta. 1861:177–187. 10.1016/j.bbalip.2015.12.005 [DOI] [PMC free article] [PubMed] [Google Scholar]
- Traynor-Kaplan A., Kruse M., Dickson E.J., Dai G., Vivas O., Yu H., Whittington D., and Hille B.. 2017. Fatty-acyl chain profiles of cellular phosphoinositides. Biochim. Biophys. Acta Mol. Cell Biol. Lipids. 1862:513–522. 10.1016/j.bbalip.2017.02.002 [DOI] [PMC free article] [PubMed] [Google Scholar]
- van Rheenen J., Achame E.M., Janssen H., Calafat J., and Jalink K.. 2005. PIP2 signaling in lipid domains: a critical re-evaluation. EMBO J. 24:1664–1673. 10.1038/sj.emboj.7600655 [DOI] [PMC free article] [PubMed] [Google Scholar]
- Willars G.B., Nahorski S.R., and Challiss R.A.. 1998. Differential regulation of muscarinic acetylcholine receptor-sensitive polyphosphoinositide pools and consequences for signaling in human neuroblastoma cells. J. Biol. Chem. 273:5037–5046. 10.1074/jbc.273.9.5037 [DOI] [PubMed] [Google Scholar]
- Xu C., Watras J., and Loew L.M.. 2003. Kinetic analysis of receptor-activated phosphoinositide turnover. J. Cell Biol. 161:779–791. 10.1083/jcb.200301070 [DOI] [PMC free article] [PubMed] [Google Scholar]
- Zaika O., Lara L.S., Gamper N., Hilgemann D.W., Jaffe D.B., and Shapiro M.S.. 2006. Angiotensin II regulates neuronal excitability via phosphatidylinositol 4,5-bisphosphate-dependent modulation of Kv7 (M-type) K+ channels. J. Physiol. 575:49–67. 10.1113/jphysiol.2006.114074 [DOI] [PMC free article] [PubMed] [Google Scholar]
- Zaika O., Tolstykh G.P., Jaffe D.B., and Shapiro M.S.. 2007. Inositol triphosphate-mediated Ca2+ signals direct purinergic P2Y receptor regulation of neuronal ion channels. J. Neurosci. 27:8914–8926. 10.1523/JNEUROSCI.1739-07.2007 [DOI] [PMC free article] [PubMed] [Google Scholar]
- Zewe J.P., Miller A.M., Sangappa S., Wills R.C., Goulden B.D., and Hammond G.R.V.. 2020. Probing the subcellular distribution of phosphatidylinositol reveals a surprising lack at the plasma membrane. J. Cell Biol. 219:e201906127 10.1083/jcb.201906127 [DOI] [PMC free article] [PubMed] [Google Scholar]
Associated Data
This section collects any data citations, data availability statements, or supplementary materials included in this article.
Supplementary Materials
lists the initial conditions and parameters for the model shown in Fig. 4.
describes the differential equation for the model shown in Fig. 4.
lists the initial conditions and parameters for the model shown in Fig. 7 and Fig. S9.
describes the differential equations for the model shown in Fig. 7 and Fig. S9.
Data Availability Statement
All data needed to evaluate the conclusions in the paper are presented in the paper or the supplemental materials.


