

Abstract
This study examines critical issues in accounting for urinary dilution in peri-implantation samples used to assess environmental exposures. Early pregnancy could impact creatinine excretion, which could bias biomarker measurement and interpretation when creatinine adjustment is used. We compared creatinine levels pre-implantation with levels soon after implantation at 3–6 weeks gestation. Using data and urine specimens from 145 women who conceived, we used linear mixed models to estimate the effect of pregnancy on creatinine concentrations. We also studied whether creatinine adjustment is biased when using pooled, within-person samples rather than averaging individually-adjusted results. For this, we grouped 2,655 daily urinary estrogen metabolite and associated creatinine measures into 762 mathematically-constructed sample pools, and compared averaged individual measures with pooled measures using weighted kappa coefficients and t-tests. Urinary creatinine concentration declined an average of 14% (95% CI: −19%, −11%) from pre- to post-implantation. While there was strong correlation between results based on the two creatinine adjustment methods, adjustment based on pooled specimens introduced a small 3% (95% CI: 2%, 4%) underestimation of the analyte compared to averaging individually-adjusted samples. Post-implantation creatinine declines could introduce errors in biomonitoring results when comparing exposure measures from pre- and post-implantation. Though pooled creatinine adjustment underestimated adjusted analyte concentrations, the bias was small and agreement excellent between pooled and averaged individually-adjusted assessments.
Keywords: urinary dilution, creatinine, pregnancy, implantation, specimen pooling
Introduction
Population-based environmental studies of reproductive health and birth outcomes have long used urinary measurements to assess exposure to exogenous environmental chemicals and their metabolites (biomonitoring). Although the normal physiologic changes of pregnancy have the potential to impact biomonitoring, relatively little is known about how such changes may influence biomarker measurement and interpretation, especially in early pregnancy. In urine biomonitoring studies, accounting for differences in recent fluid intake and consequent differential dilution of urine samples across participants is critical for reducing measurement error and drawing appropriate comparisons and inferences (1). Urinary dilution is commonly accounted for through urinary creatinine concentration adjustment, a method which assumes that, over a given collection interval, the creatinine excretion rate is similar across individuals, and is fairly constant (2–4). Assessing a biomarker per gram of excreted creatinine therefore should be a measure that is relatively robust to recent water consumption. However, creatinine excretion can vary based on multiple factors, including sex, age, diet, athleticism, and body mass index (BMI) (1,2,4–8). When exposures or health outcomes of interest alter kidney function, creatinine may not be a reliable method of adjustment; its use may lead to misclassification and confounding (2,4,9–11). These issues were recently considered by O’Brien et al. (2016) in a causal framework (11). They carried out extensive simulations and recommended strategies for handling adjustment when some risk factors for disease can also affect kidney function, and hence bias exposure assessment.
Normal pregnancy is known to substantially alter kidney function and creatinine excretion, but it is not clear how early in pregnancy this occurs (2,12–15). Only one study (8) of 11 women has shown that creatinine excretion begins to change as early as 4 weeks after the last menstrual period (LMP). Early pregnancy changes in creatinine excretion have important implications for exposure assessment during the periconceptional period. Thus, our first objective was to investigate whether creatinine levels change around pregnancy implantation, and whether those changes are modified by age, parity, or BMI.
When measuring exposures that vary substantially over time, specimen pooling is a cost-effective approach to reduce variability, conserve archived specimens, decrease the proportion of specimens below the limit of detection (LOD), and reduce exposure misclassification (16,17). Pooling methods usually combine equal aliquots of biospecimens and then measure the compounds of interest, including creatinine, in the entire pool, with results representing an average level. However, because aliquots are volume- and not concentration-based, pooled specimens could be biased when standardized by creatinine (18). Therefore, our second objective was to investigate whether creatinine adjustment could lead to bias in biomarker concentrations when accounting for urinary dilution in pooled specimens from the peri-conceptional period.
Methods
Study population
We used data and specimens from the Early Pregnancy Study (EPS), a prospective cohort study conducted in North Carolina from 1982–86, and approved by the National Institute of Environmental Health Sciences (NIEHS) institutional review board (19,20). Analyses for this paper were determined to be not human subjects research by the Yale University institutional review board. Participants, all of whom gave informed consent, were women (n=221) without known fertility problems or chronic illnesses who were attempting to become pregnant. Most participants were white (96%), college graduates (71%), and parous (52%). The participants collected daily first morning urine specimens (defined as the first void after rising to begin a new day) for 6 months if they did not conceive or experienced an early pregnancy loss, or through 8 weeks post-LMP if they did conceive. The season of sampling varied across participants, and depended on the timing of their study participation. Specimens were collected in polypropylene jars without preservatives and stored for up to 2 weeks in home freezers before being transported on ice to a central freezer and stored at −20°C (21). Participants kept a daily log of intercourse and menstrual bleeding. In total, 740 menstrual cycles were observed during the study, including 541 non-conception cycles and 199 conception cycles. Pregnancy was presumed if human chorionic gonadotropin (hCG) levels were >0.025 ng/mL for ≥3 consecutive days (20). Once a pregnancy was identified, the day of implantation was defined as the first day of that pregnancy where hCG was at least 0.01 ng/mL and remained elevated. If hCG declined to baseline before 6 weeks gestation (42 days post-LMP), this was considered an early pregnancy loss. There were 48 early pregnancy losses and 151 clinical pregnancies (15 clinical miscarriages and 136 live births).
Objective 1: Creatinine and implantation status
Pooled urine specimens.
As part of previously conducted research (21), stored daily EPS specimens were pooled within individual women, using three equal aliquots from samples collected approximately one week apart (Figure 1). “Pre-implantation” pooled samples were from a single menstrual cycle, with the first two specimens from after the end of menses and before ovulation, and the third from after ovulation. If a participant conceived during the menstrual cycle, then the third specimen was post-ovulation but pre-implantation. These pooled samples are collectively referred to as “pre-implantation” in this paper, and include non-conception cycles (n=539) and conception cycles (n=198), of which 48 are early loss cycles.
Figure 1.
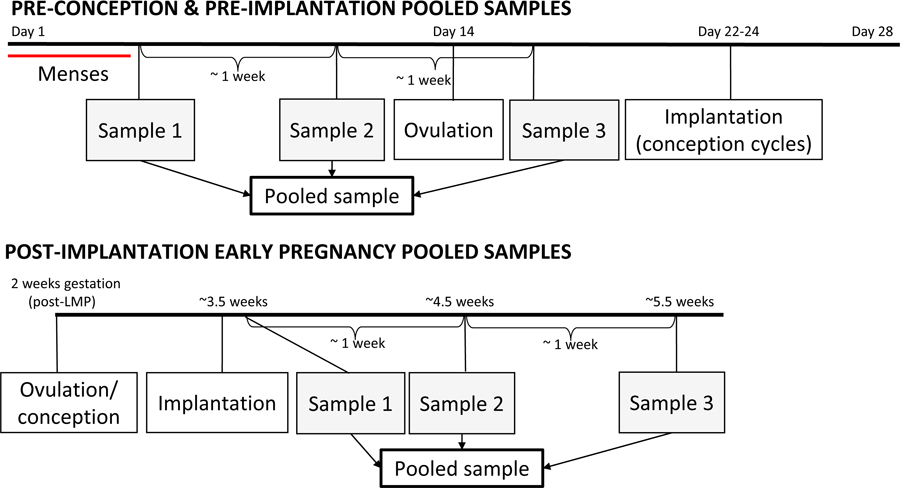
Pooled sampling strategy for urine specimens from a theoretical 28-day cycle, and from early pregnancy. In cases of conception, implantation typically occurs 8–10 days after ovulation. Gestational weeks are measured from the start of the last menstrual period (LMP), so early pregnancy pooled samples span 3–6 weeks gestation.
“Post-implantation” pooled samples consisted of three specimens collected approximately one week apart starting after the day of implantation, all from the same pregnancy. This time period corresponds to the first 3 to 6 weeks of gestation as measured from the LMP. Post-implantation pooled samples include 145 pregnancies (151 clinical pregnancies minus 6 missing samples) that resulted in either clinical pregnancy loss (n=15) or live birth (n=135).
Creatinine concentration (mg/dL) was measured in each pooled sample using a spectrophotometric procedure (Jaffe reaction) performed on an Olympus AU400e chemistry analyzer, with a urine creatinine calibrator and reagents from Beckman Coulter, Inc. (Irving, TX).
Predictors of creatinine.
Potential predictors of creatinine levels were implantation status, age, BMI, and parity. Age and BMI have previously been associated with creatinine, with increased age and BMI associated with decreased creatinine concentration (1,7). We also hypothesized that parity could influence creatinine, but to our knowledge, parity has not been previously investigated.
Statistical analysis.
We calculated medians and inter-quartile ranges (IQRs) for creatinine concentration, stratified by the predictors of interest, using the first pooled sample (to avoid the need to account for within-subject correlations of creatinine concentration across multiple cycles). For the one subject missing the first sample, the second pooled sample was used. All of the pooled samples were used to examine the relationship between the predictors and urinary creatinine concentration using linear mixed models with a random intercept for each subject to account for within-woman correlations since each subject contributed multiple urine pools (using SAS, version 9.4, PROC MIXED, REML method; code is available upon request). The dependent variable was the creatinine concentration (mg/dL) of each urine pool, which was natural-log transformed to achieve normality and treated continuously.
Covariates.
To determine how best to represent each covariate, we looked at unadjusted associations with creatinine. Covariate representations included continuous and categorical (e.g. deciles, or using clinically meaningful cut-points) structures. The final form was chosen based on visual inspection and the lowest value of the Akaike Information Criterion (AIC). Based on this process, age was treated continuously; BMI modeled categorically, with the categories of <18.5 kg/m2 (underweight), 18.5–24.9 kg/m2 (normal weight), and ≥25 kg/m2 (overweight); and parity was dichotomous, with categories of nulliparous and parous. Implantation status was dichotomous: pre-implantation and post-implantation.
We also examined whether offspring sex or carrying twins (6 pregnancies) influenced creatinine, using linear regression, while adjusting for implantation status, age, BMI, and parity. We found no statistically significant association of post-implantation creatinine with offspring sex (female compared to male: β=−0.049; 95% CI: −0.17, 0.078; p=0.45), and twins had somewhat higher post-implantation concentrations compared to singletons (β=0.15; 95% CI: −0.15, 0.46; p=0.31) but with a very wide confidence interval, so we excluded these covariates from further analyses.
Linear mixed models.
We constructed four mixed models: an intercept-only model, used to calculate the intraclass correlation coefficient (ICC) of creatinine; a model with only pre- and post-implantation status; an interactions model with implantation status, age, BMI, and parity, along with the three products of implantation status and age, BMI, and parity; and a final model including only implantation status, age, BMI, and parity. Relative percent change in creatinine concentration was calculated by exponentiating each beta estimate, subtracting it from 1, and then multiplying it by 100. Residual plots were visually examined for normality for all models.
We hypothesized that parity could act as a modifier for changes in creatinine due to implantation status, as parous subjects might demonstrate a heightened or more rapid physiologic response to pregnancy. We also hypothesized a possible interaction between age and implantation status. Interactions were considered for inclusion in the final model if their associated p-values were less than 0.2.
Sensitivity analyses.
In the first set of sensitivity analyses, our objective was to determine whether pre-implantation creatinine levels differed between non-conception and conception cycles, and to confirm the decision to group early losses with pre-implantation samples, and clinical losses with live births, in our models of creatinine concentration. We used a linear mixed model to compare whether pre-implantation creatinine levels differed between non-conception and conception cycles. In a separate mixed model, we examined whether pre-implantation creatinine concentration differed by eventual cycle outcome (non-conception, early loss, clinical loss, or live birth). Finally, we examined whether the average within-woman change in creatinine from pre- to post-implantation, as measured using the difference between the conception cycle sample and post-implantation sample, was different for pregnancies ending in clinical losses compared to live births.
The second set of sensitivity analyses aimed to determine whether grouping nulliparous subjects based on gravidity led to different results compared to collapsing parity on gravidity. These analyses also used linear mixed models to evaluate whether nulliparous subjects who had never been pregnant had a different effect of implantation on their creatinine compared to nulliparous subjects with a history of pregnancy. We also examined wither pre-implantation creatinine levels differed by parity (nulliparous/nulligravid, nulliparous/with pregnancy history, or parous).
The last sensitivity analysis assessed the average within-woman change in creatinine from pre- to post-implantation, as measured using the difference between the conception cycle sample and the post-implantation sample, and stratified by maternal and pregnancy outcome characteristics: parity (nulliparous or parous, and nulliparous/nulligravid, nulliparous/with pregnancy history, or parous), BMI, age, pregnancy outcome (clinical loss or live birth), fetal sex, and twins. This analysis was carried out using PROC ANOVA, with average mean differences calculated for each maternal or pregnancy outcome characteristic, along with f-values and p-values. The aim of this analysis was to compare our main findings from linear mixed models with a within-subject analysis that excluded non-conception cycles, to confirm that any observed changes in creatinine from pre- to post-implantation were not confounded by differences between nonconception and conception cycles.
Objective 2: Creatinine measurement in pooled specimens
Urine specimens.
A total of 2,655 daily urine samples from EPS were used to compare two creatinine adjustment approaches for pooled samples, including 2,214 pre-implantation samples and 441 post-implantation samples. The samples had previously been assayed for estrone-3 glucuronide (E1G, ng/mL) and creatinine (mg/mL), and all measurements were above the LOD (22,23). These daily samples were grouped into 762 pooling sets containing 3 observations each (666 pre-implantation and 96 post-implantation sets), after excluding 72 pooling sets with missing E1G or creatinine values. Because creatinine and E1G measurements were focused on ovulation and implantation windows, occasional samples from a given menstrual cycle were not assayed, leading to 227 missing daily E1G values, and 278 missing daily creatinine values.
Sample pooling.
Creatinine is used to standardize urinary measurements of exogenous environmental chemicals or endogenous compounds to account for differences in urinary dilution across specimens, by dividing the measured concentration of the compound of interest by the creatinine concentration (crt). Given an unlimited assay budget one would likely prefer to measure the analyte of interest (E1G in this analysis) and creatinine in each individual sample comprising the pool, and then average the adjusted concentrations (Method 1). However, in pooled sampling strategies, analytes of interest and creatinine are typically measured directly in the pooled sample Method 2). To assess the difference in results based on these approaches, we mathematically compared the methods:
| Method 1: |
| Method 2: |
We examined whether the use of Method 2 can contribute to bias in the measurement of an analyte in a pooled urine sample when standardizing by creatinine. Using the same E1G and creatinine data described for Method 1, we applied Method 2 to approximate what would have been measured in a hypothetical pooled sample. Because the units in each of these methods are mass-volume proportions, or concentrations, there is no connection between the volume of a pooled sample and any potential bias.
Statistical analysis.
Creatinine-adjusted E1G concentrations (ng/mg crt) estimated with Method 1 and Method 2 were natural-log transformed to approximate normality and compared visually via scatter plots and with Spearman correlation coefficients. For each method, we ranked the E1G concentrations by deciles and then calculated a weighted kappa coefficient to determine the agreement between the two methods. We then calculated the mean difference in creatinine-adjusted E1G concentrations between the two methods and compared them using a paired, two-sided t-test. Analysis was carried out in SAS, version 9.4, and the code is available upon request.
Results
Objective 1: Creatinine and implantation status
Creatinine concentrations were higher pre-implantation, with a median pre-implantation concentration of 136 mg/dL (IQR 107–166 mg/dL) and a median post-implantation concentration of 113 mg/dL (IQR 89–147 mg/dL) (Table 1). Creatinine concentrations also were lower for older age groups, and for parous compared to nulliparous women. The ICC was 0.55 across all samples and 0.60 for pre-implantation samples only.
Table 1.
Urinary creatinine concentration (mg/dL) of pooled samples by maternal characteristic
| Characteristic | Participants, n | Median creatinine (IQR) |
|---|---|---|
| Implantation status | ||
| Pre-implantation | 221 | 136 (107–166) |
| Post-implantation | 145 | 113 (89–147) |
| Age | ||
| <26 years old (Q1) | 56 | 148 (127–176) |
| 26–31 years old (Q2–Q3) | 121 | 134 (105–162) |
| >31 years old (Q4) | 44 | 127 (107–157) |
| Body mass index | ||
| Underweight (BMI<18.5) | 21 | 126 (91–168) |
| Normal weight (BMI 18.5–24.9) | 175 | 138 (109–168) |
| Overweight (BMI≥25) | 25 | 135 (101–159) |
| Parity | ||
| Nulliparous | 107 | 138 (109–170) |
| Parous | 114 | 131 (106–159) |
Note: To eliminate within-subject correlations, pooled samples included here are from the first pre-implantation cycle contributed by a subject, except for post-implantation creatinine concentration which is from post-implantation samples, and one subject for whom first cycle creatinine concentration is missing. For this subject, creatinine concentration from the second cycle is included. IQR, interquartile range; Q1, Q2, Q3, and Q4, quartiles 1, 2, 3, and 4; BMI, body mass index.
After adjustment, post-implantation creatinine levels were 14% lower (95% CI: −19%, −11%) compared to pre-implantation creatinine levels (β=-0.16; 95% CI: −0.21, −0.12; p<0.0001) (Table 2). Creatinine decreased 1% (95% CI: −2%, −0.1%) for each year of age (β=-0.013; 95% CI: −0.025, −0.00075; p=0.037). Creatinine levels for parous subjects were 4% lower (95% CI: −5%, 13%) than levels for nulliparous subjects, but the confidence interval was wide (β=-0.044; 95% CI: −0.13, 0.045; p=0.33). No association was observed with BMI, and confidence intervals were even wider (underweight β=-0.0056; 95% CI: −0.16, 0.14; p=0.94; overweight β= −0.012; 95% CI: −0.15, 0.12; p=0.86). No interactions of implantation status with age, parity, or BMI were significant with a p-value of less than 0.2, and thus they were not included in the main model (Supplementary Information, Table S1). This indicates that the change in creatinine from pre- to post-implantation was not modulated by these maternal characteristics.
Table 2.
Associations of maternal characteristics with longitudinal measures of logged urinary creatinine concentration (mg/dL) from pre-implantation menstrual cycles and the post-implantation period, estimated with linear mixed models
| Covariates | Model 1 | Model 2 | ||
|---|---|---|---|---|
| β (95% CI) | creatinine % change (95% CI) a | β (95% CI) | creatinine % change (95% CI) a | |
| Implantation status b | ||||
| Post-implantation | −0.15 (−0.20, −0.10) | −14% (−18%, −10%) | −0.16 (−0.21, −0.12) | −14% (−19%, −11%) |
| Age, per 1-year increase | −0.013 (−0.025, −0.00075) | −1% (−2%, −0.07%) | ||
| Body mass index b | −0.0056 | −0.06% | ||
| Underweight (BMI<18.5) | (−0.16, 0.14) | (−15%, 15%) | ||
| Overweight (BMI≥25) | −0.012 (−0.15, 0.12) | −1% (−14%, 13%) | ||
| Parity b | ||||
| Parous | −0.044 (−0.13, 0.045) | −4% (−12%, 5%) | ||
Note: A total of 882 pooled samples from 221 subjects are included in this analysis, including 737 pre-implantation samples and 145 post-implantation samples. β, beta estimate; CI, confidence interval; BMI, body mass index.
Relative percent change in creatinine concentration is calculated by exponentiating the beta estimate, subtracting it from 1, and then multiplying it by 100.
The reference group for implantation status is pre-implantation; for BMI is normal weight, 18.5–24.9; and for parity is nulliparous.
Sensitivity analyses.
When we examined whether pre-implantation creatinine concentration was associated with eventual cycle outcome, we found no statistically significant differences in pre-implantation creatinine concentration across the outcomes in comparison to the reference group of non-conception cycles (early loss β=0.034; 95% CI: −0.046, 0.12; p=0.40; clinical loss β=0.013; 95% CI: −0.043, 0.070; p=0.65; live birth β=-0.054; 95% CI: −0.21, 0.11; p=0.51; Supplementary Information, Table S2). This supported grouping creatinine concentrations from early losses with pre-implantation cycles, and those from clinical losses with live births. There was no difference in pre-implantation creatinine levels in conception cycles compared to non-conception cycles (conception cycle adjusted for age, parity, and BMI β=0.00029; 95% CI: −0.053, 0.054; p=0.99). We also found there was no difference in average within-woman creatinine change from pre- to post-implantation for clinical losses compared to live births (clinical loss mean difference, −0.16; 95% CI: −0.42, 0.091; live birth mean difference, −0.16; 95% CI: −0.23, −0.094; comparison of differences, p=0.99).
When nulliparous subjects were further stratified by whether they had ever been pregnant, there was no difference in post-implantation creatinine levels between nulliparous/nulligravid subjects and those who were nulliparous/with a pregnancy history (age-adjusted β=-0.012; 95% CI: −0.15, 0.13; p=0.87; parous subjects age-adjusted β=-0.048; 95% CI: −0.15, 0.051; p=0.34; Supplementary Information, Table S2). There was also no difference in pre-implantation creatinine levels between nulliparous/nulligravid subjects and those who were nulliparous/with a pregnancy history (age-adjusted β=0.015; 95% CI: −0.13, 0.16; p=0.84) or parous subjects (age-adjusted β=-0.048; 95% CI: −0.15, 0.055; p=0.34). This supported grouping all nulliparous subjects together regardless of gravidity in the main model, and dichotomizing parity as a predictor.
When we repeated our analysis using average within-woman differences, we found that the average, unadjusted within-woman change in creatinine from the pre-implantation conception cycle to post-implantation was −0.16 (95% CI: −0.23, −0.097). Across all maternal and pregnancy outcome characteristics, there was no statistically significant difference in average mean change in creatinine from pre- to post-implantation (Supplementary Information, Table S3), and results were fully consistent with findings from linear mixed models reported in Table 2.
Objective 2. Creatinine measurement in pooled specimens
The mean log-transformed, creatinine-adjusted E1G level for all samples using Method 1 was 3.62 ng/mg crt, and 3.59 ng/mg crt for Method 2 (Table 3). The two methods were strongly correlated (Spearman r=0.98) with excellent agreement (kappa=0.90; 95% CI: 0.89, 0.91) (Supplementary Information, Figure S1). Stratifying by implantation status showed the same high correlation and agreement in both pre- and post-implantation pools (pre-implantation r=0.98, kappa=0.88; 95% CI: 0.87, 0.90; post-implantation r=0.99, kappa=0.90; 95% CI: 0.84, 0.97). While results from Methods 1 and 2 were similar, Method 2 consistently underestimated the creatinine-adjusted E1G concentration compared to Method 1 by 3% (95% CI: 2%, 4%), a small but statistically significant amount (Table 3, logged concentration mean difference=0.027 ng/mg crt; 95% CI: 0.020, 0.035; p<0.0001). The underestimation was slightly larger when the samples were restricted to post-implantation samples (0.044 ng/mg crt; 95% CI: 0.025, 0.064; p<0.0001).
Table 3.
Comparison of logged estrogen (E1G) metabolite concentration (ng/mg crt) in pooled urine samples using two different creatinine adjustment methods
| Creatinine adjustment method | Pooled samples, n a | Mean | Median | Mean difference (95% CI) b |
|---|---|---|---|---|
| Method 1 | 762 | 3.62 | 3.59 | |
| Method 2 | 762 | 3.59 | 3.57 | |
| Comparison | 762 | 0.027 (0.020, 0.035) |
Note: The gold standard for creatinine adjustment of pooled samples is Method 1, which uses daily measurements from each sample comprising the pool: . Method 2 uses measurements from the already-pooled sample: .
Only pooled samples where daily measures were also available were used for this analysis, resulting in a total of 762 pooled samples available, including 666 pre-implantation and 96 post-implantation pooled samples.
Discussion
In this study, we examined critical issues in accounting for urinary dilution in peri-implantation samples. We found that urinary creatinine concentration declined early in pregnancy: 14% (95% CI: −19%, −11%) from pre- to post-implantation. While changes in creatinine are generally acknowledged by the end of the first trimester (13 completed weeks post-LMP), the changes we observed occurred much earlier, around 3–6 weeks post-LMP. This has implications for biomonitoring around the time of conception, especially if pregnancy status is unknown, and for comparisons between pre- and post-implantation exposure measures. Given the importance of pre- and peri-conceptional exposures to long-term outcomes (24), our results provide valuable information for biomonitoring in fertility treatment, pre-conception, and pregnancy planning cohorts.
Normal hormonal changes of pregnancy promote the retention of fluid and electrolytes to meet maternal and fetal needs, with an average accumulation of an additional 6–8 L of water by the end of pregnancy. The osmostat for antidiuretic hormone is lowered to promote decreased plasma osmolality, and this also results in a decrease of the thirst threshold (25). Because these declines in plasma osmolality start at 5–8 weeks post-LMP, and reach a nadir at 10 weeks post-LMP (26), the change in the thirst threshold may begin in the early first trimester, promoting increased water consumption and potentially explaining the decreased creatinine concentrations we observed. To help accommodate the substantial increase in water and blood volume during pregnancy, increases especially in relaxin and progesterone promote vasodilation. By the end of the first trimester, kidney volume has increased 30%, and glomerular filtration rate (GFR) has increased 50–80% above pre-pregnancy levels, and will continue to change across pregnancy (12,13). Clinically, these changes are observable in increased urinary flow rate and decreased urinary creatinine concentrations (14).
Previous reseach (8,27,28) suggests that early pregnancy may influence creatinine excretion, GFR, and the rate and volume of urine production. These studies of early pregnancy included 9 to 13 participants, and only one (8) continuously examined changes from pre-conception through pregnancy, with the other two beginning monitoring at 6–7 weeks post-LMP (27,28). Davison and Nobel (1981) observed changes in creatinine excretion beginning at 4 weeks post-LMP, and in urinary output at 12 weeks post-LMP (8). Chapman et al. (1998) found GFR to change by 6 weeks post-LMP compared to a non-pregnant baseline measure taken an average of 7.8 months prior (27), and de Alvarez and Bratvold (1958) observed changes at 8 weeks post-LMP in both GFR and creatinine excretion compared to a non-pregnant baseline selected from the literature (28). Changes to any of these physiologic processes – creatinine excretion, GFR, or urine production – could result in an altered creatinine concentration in a given sample.
In Davison and Noble (1981), 2 of the 11 subjects experienced clinical miscarriages, and for these women changes in creatinine excretion were not as sustained (8). These differences in creatinine excretion were identified beginning about 3 weeks before clinical identification of the miscarriage, or at approximately 6 weeks post-LMP. We did not observe any significant differences in post-implantation creatinine concentration between clinical losses and pregnancies ending in a live birth. Our study focuses on creatinine concentration in very early pregnancy, 3–6 weeks post-LMP, which may be before the changes noted by Davison and Noble (1981) were apparent (8).
Our study also found that creatinine concentration was 1% lower per year of age (95% CI: −2%, −0.1%). Other studies in the general population have found creatinine to decline with age and increase with BMI (1,7). We observed associations with age but not with BMI. As more than half of the EPS cohort was of normal BMI, the power to detect associations between creatinine and overweight or obesity was low.
To our knowledge, no other studies have examined whether parity is associated with creatinine concentration. We hypothesized that kidney function changes might occur slightly earlier or more intensely in parous women, but did not find convincing support for this hypothesis. Instead, we found that parous women had lower creatinine levels both pre- and post-implantation, even after adjustment for age. Moreover, this difference was not evident when comparing nulliparous/nulligravid women and nulliparous women with a history of pregnancy. While confidence intervals were overlapping (Supplementary Information, Table S2), these results suggest that parity may be associated with long-term changes in urinary creatinine concentration.
Early pregnancy changes in creatinine concentration have important implications for biomonitoring studies during the periconceptional period, which is a critical developmental window for the embryo (24). In contexts where creatinine excretion, GFR, or urine production are changing, such as early pregnancy, normalization of biomarkers using urinary creatinine concentration may be inaccurate (29). Altered creatinine excretion could increase or decrease creatinine-adjusted analyte concentrations and render creatinine-adjusted pre- and post-implantation measures incomparable. While recommending an optimal method for adjusting for urinary dilution in the post-implantation period is beyond the scope of this paper, other studies have compared alternative adjustment methods in situations where GFR is changing, such as specific gravity (2). Specific gravity is a reliable option if measurements are available, as it has a higher within-person reproducibility than creatinine, and tends to be robust to subject characteristics, health conditions, and behavioral changes that have been observed to influence creatinine (2,5,6). However, because it is a measure of density, the presence of large molecules like glucose and protein such as may be excreted with diabetes or hypertension can lead to an overestimation of specific gravity (3,30), and we are not aware of any studies comparing the measurement of specific gravity in pooled specimens to the average of individual measures. If creatinine is used to normalize urinary biomarkers during times like the peri-implantation period when creatinine excretion, GFR, or urine production are changing, then repeated measures may be of particular importance, rather than relying on single samples.
We also found that, although some bias was present, the calculated creatinine-adjusted values for pooled samples were highly correlated and agreed well with averages of individually creatinine-adjusted results from the same pool. Specimen pooling can be both cost-effective and powerful if a key exposure biomarker is expensive to assay or quantities of archived specimens are dwindling. With appropriate sampling and measurement techniques, the individual samples in a pool should be representative of the larger samples from which they are drawn, allowing researchers to use just a small amount of each specimen comprising the pool and conserve archived specimens. Weinberg and Umbach (1999), Saha-Chaudhuri et al. (2011), and Saha-Chaudhuri and Weinberg (2013) showed that pooling is a viable approach for case-control and time-to-event studies (31–33). Schisterman and Vexler (2008) demonstrated that for biomarkers where the overall mean concentration is above the LOD, specimen pooling can decrease the number of determinations that fall below the LOD, maximizing quantifiable results (16). Because pooling both physically and arithmetically mixes multiple levels of a biomarker together, this reduces the standard error of the sample mean, thereby reducing the likelihood that the pooled concentration falls below the LOD. Additionally, Perrier et al. (2016) showed that pooling can reduce exposure misclassification, especially for compounds with a short half-life (17). However, these studies did not consider difficulties related to using creatinine adjustment to account for urinary concentrations of compounds of interest. Although Perrier et al. (2016) allude to this problem, no estimation of potential bias or remedy is supplied (17). While we observed that the use of pooled samples resulted in a 3% (95% CI: 2%, 4%) underestimation of analyte concentrations, the magnitude of this bias was small. Whether it is epidemiologically important for pooling based on repeated observations within individuals may depend on the research question and context. For case-control studies, a recent paper by Weinberg et al. (2019) provides simulations that quantify the bias when pooled samples are directly adjusted (Method 2 in this paper), and offers suggested methods for pooling with adjustment that can can avoid the bias, while accounting for disease risk factors that could also influence creatinine (18).
The strengths of our study include the use of repeated measures to determine how creatinine changes in early pregnancy (3–6 weeks post-LMP). To our knowledge, this study documents these changes in the largest cohort to date, as previous studies have included only 9 to 13 participants. Future comparisons of creatinine adjustment in pooled specimens to individually adjusted results from the same pool in exposure biomonitoring situations will further illuminate whether the small bias we observed is replicable and may influence results.
Our study also has weaknesses. By using pooled samples to investigate changes in creatinine concentration from pre- to post-implantation, we are unable to identify the exact week when declines begin, only that declines did begin before 6 weeks post-LMP. Because the EPS cohort is homogeneous in terms of BMI and race, we had low power to detect associations between BMI and creatinine, which have been previously described in the literature, or to investigate potential differences associated with race or ethnicity. This homogeneity may limit the generalizability of our findings. While absolute concentrations of creatinine have been observed to vary by race/ethnicity (1), we are unaware of any data that would support post-implantation declines in creatinine differing by race/ethnicity. We also were unable to assess the impact of diet on creatinine excretion, as meat consumption has been associated with increased creatinine excretion (7). Additionally, creatinine excretion has been shown to vary with time of day (2,7). MacPherson et al. (2018) found creatinine excretion rates in pregnancy to be lower overnight, accompanied by higher overnight creatinine concentrations when urinary flow rate was lower (2). The samples used in our analysis were first-morning urine samples, and thus their creatinine concentrations may be relatively high compared to concentrations during the day. There could also be behavioral changes that accompany early pregnancy, such as night-waking, that could influence changes in creatinine concentrations. Nausea and vomiting of pregnancy (NVP) could also alter hydration status, but is unlikely to impact our findings for two reasons: first, the typical onset of NVP occurs at 6 weeks post-LMP, but our samples represent the time period prior to 6 weeks post-LMP. Second, NVP is likely to contribute to dehydration and increase creatinine concentrations; in contrast, we observed lower urinary creatinine, typically associated with good hydration status. Together, these considerations mean that post-implantation creatinine decreases could be more or less than what we would have measured over the course of 24 hours. To our knowledge, the agreement between multiple 24-hour urine samples and pooled first-morning urine samples across the same time frame has not been investigated for any analyte or exposure. While 24-hour urine samples are the gold standard for measuring creatinine excretion in clinical studies, such monitoring is generally not feasible in exposure assessment contexts or in epidemiologic studies with daily urine collection over relatively long time periods. Instead, urine biomonitoring studies commonly use spot sampling, either one-time or repeated, to assess exposures, and thus, our study reflects the methods and specimens typically used in such contexts.
In this paper, we observed declines in first-morning urinary creatinine concentration beginning early in the first trimester of pregnancy, before 6 weeks post-LMP. Also, direct creatinine-adjustment of within-individual pooled samples evidently results in only a small amount of bias that slightly underestimates adjusted analyte concentrations. Together, these findings have implications for biomonitoring around the time of conception and in contexts where kidney function could be changing. Post-implantation declines in creatinine excretion could lead to exposure misclassification. While measurement errors due to pooled creatinine adjustment can overestimate adjusted analyte concentrations, the bias may be small and agreement should be excellent between pooled and individual sample assays. Future research could help determine whether this bias is epidemiologically or clinically important, depending on the situation.
Supplementary Material
Acknowledgements
Many thanks to Dr. D. Robert McConnaughey for his data management support, and to Drs. Kaitlyn Gam and Kelly Ferguson for their comments on an earlier draft of this manuscript. This research was supported, in part, by the intramural research program of the NIH (project numbers ES103333–01 and ES103086), and by a doctoral fellowship at the Yale School of Public Health.
Footnotes
Conflict of interest: The authors declare they have no actual or potential competing financial interests or conflicts of interest.
Supplementary Information: Supplementary information is available at the Journal of Exposure Science & Environmental Epidemiology’s website.
References
- 1.Barr DB, Wilder LC, Caudill SP, Gonzalez AJ, Needham LL, Pirkle JL. Urinary creatinine concentrations in the U.S. population: Implications for urinary biologic monitoring measurements. Environ Health Perspect. 2005;113(2):192–200. [DOI] [PMC free article] [PubMed] [Google Scholar]
- 2.MacPherson S, Arbuckle TE, Fisher M. Adjusting urinary chemical biomarkers for hydration status during pregnancy. J Expo Sci Environ Epidemiol. 2018;28(June):481–93. [DOI] [PMC free article] [PubMed] [Google Scholar]
- 3.Sauvé JF, Lévesque M, Huard M, Drolet D, Lavoué J, Tardif R, et al. Creatinine and specific gravity normalization in biological monitoring of occupational exposures. J Occup Environ Hyg. 2015;12(2):123–9. [DOI] [PubMed] [Google Scholar]
- 4.Hays SM, Aylward LL, Blount BC. Variation in urinary flow rates according to demographic characteristics and body mass index in NHANES: potential confounding of associations between health outcomes and urinary biomarker concentrations. Environ Health Perspect. 2015;123(4):293–300. [DOI] [PMC free article] [PubMed] [Google Scholar]
- 5.Miller RC, Brindle E, Holman DJ, Shofer J, Klein NA, Soules MR, et al. Comparison of specific gravity and creatinine for normalizing urinary reproductive hormone concentrations. Clin Chem. 2004;50(5):924–32. [DOI] [PubMed] [Google Scholar]
- 6.Carrieri M, Trevisan A, Bartolucci GB. Adjustment to concentration-dilution of spot urine samples: correlation between specific gravity and creatinine. Int Arch Occup Environ Health. 2001;74(1):63–7. [DOI] [PubMed] [Google Scholar]
- 7.Boeniger MF, Lowry LK, Rosenberg J. Interpretation of Urine Results Used To Assess Chemical Exposure With Emphasis on Creatinine Adjustments: A Review. Am Ind Hyg Assoc J. 1993;54(10):615–27. [DOI] [PubMed] [Google Scholar]
- 8.Davison JM, Noble MC. Serial changes in 24 hour creatinine clearance during normal menstrual cycles and the first trimester of pregnancy. Br J Obstet Gynaecol. 1981;88(1):10–7. [DOI] [PubMed] [Google Scholar]
- 9.Weaver VM, Kotchmar DJ, Fadrowski JJ, Silbergeld EK. Challenges for environmental epidemiology research: Are biomarker concentrations altered by kidney function or urine concentration adjustment? J Expo Sci Environ Epidemiol. 2016;26(1):1–8. [DOI] [PubMed] [Google Scholar]
- 10.Aylward LL, Hays SM, Smolders R, Koch HM, Cocker J, Jones K, et al. Sources of Variability in Biomarker Concentrations. J Toxicol Environ Heal − Part B Crit Rev. 2014;17(1):45–61. [DOI] [PubMed] [Google Scholar]
- 11.O’Brien KM, Upson K, Cook NR, Weinberg CR. Environmental chemicals in urine and blood: Improving methods for creatinine and lipid adjustment. Environ Health Perspect. 2016;124(2):220–7. [DOI] [PMC free article] [PubMed] [Google Scholar]
- 12.Abduljalil K, Furness P, Johnson TN, Rostami-Hodjegan A, Soltani H. Anatomical, physiological and metabolic changes with gestational age during normal pregnancy: a database for parameters required in physiologically based pharmacokinetic modelling. Clin Pharmacokinet. 2012;51(6):365–96. [DOI] [PubMed] [Google Scholar]
- 13.Cheung KL, Lafayette RA. Renal Physiology of Pregnancy. Adv Chronic Kidney Dis. 2013;20(3):209–14. [DOI] [PMC free article] [PubMed] [Google Scholar]
- 14.Odutayo A, Hladunewich M. Obstetric Nephrology : Renal Hemodynamic and Metabolic Physiology in Normal Pregnancy. Clin J Am Soc Nephrol. 2012;7(December):2073–80. [DOI] [PubMed] [Google Scholar]
- 15.Baba Y, Furuta I, Zhai T, Ohkuchi A, Yamada T, Takahashi K, et al. Effect of urine creatinine level during pregnancy on dipstick test. J Obstet Gynaecol Res. 2017;43(6):967–73. [DOI] [PubMed] [Google Scholar]
- 16.Schisterman EF, Vexler A. To pool or not to pool, from whether to when: Applications of pooling to biospecimens subject to a limit of detection. Paediatr Perinat Epidemiol. 2008;22(5):486–96. [DOI] [PMC free article] [PubMed] [Google Scholar]
- 17.Perrier F, Giorgis-Allemand L, Slama R, Philippat C. Within-subject Pooling of Biological Samples to Reduce Exposure Misclassification in Biomarker-based Studies. Epidemiology. 2016;27(3):378–88. [DOI] [PMC free article] [PubMed] [Google Scholar]
- 18.Weinberg CR, Shi M, O’Brien KM, Umbach DM. Adjustment for Urinary Creatinine or Serum Lipids for Analytes Assayed in Pooled Specimens. Epidemiology. 2019;30(5):768–79. [DOI] [PMC free article] [PubMed] [Google Scholar]
- 19.Wilcox AJ, Weinberg CR, Wehmann RE, Armstrong EG, Canfield RE, Nisula BC. Measuring early pregnancy loss: laboratory and field methods. Fertil Steril. 1985;44(3):366–74. [PubMed] [Google Scholar]
- 20.Wilcox AJ, Weinberg CR, O’Connor JF, Baird DD, Schlatterer JP, Canfield RE, et al. Incidence of early loss of pregnancy. N Engl J Med. 1988;319(4):189–94. [DOI] [PubMed] [Google Scholar]
- 21.Jukic AM, Calafat AM, McConnaughey DR, Longnecker MP, Hoppin JA, Weinberg CR, et al. Urinary Concentrations of Phthalate Metabolites and Bisphenol A and Associations with Follicular-Phase Length, Luteal-Phase Length, Fecundability, and Early Pregnancy Loss. Environ Health Perspect. 2016. March;124(3):321–8. [DOI] [PMC free article] [PubMed] [Google Scholar]
- 22.Baird DD, Weinberg CR, Wilcox AJ, McConnaughey DR, Musey PI. Using the ratio of urinary oestrogen and progesterone metabolites to estimate day of ovulation. Stat Med. 1991;10(2):255–66. [DOI] [PubMed] [Google Scholar]
- 23.Baird DD, Weinberg CR, Zhou H, Kamel F, McConnaughey DR, Kesner JS, et al. Preimplantation urinary hormone profiles and the probability of conception in healthy women. Fertil Steril. 1999;71(1):40–9. [DOI] [PubMed] [Google Scholar]
- 24.Fleming TP, Watkins AJ, Velazquez MA, Mathers JC, Prentice AM, Stephenson J, et al. Origins of Lifetime Health Around the Time of Conception: Causes and Consequences. Lancet. 2018;391(May):1842–52. [DOI] [PMC free article] [PubMed] [Google Scholar]
- 25.Blackburn ST. Maternal, Fetal, and Neonatal Physiology. 3rd ed. St. Louis: Elsevier; 2007. [Google Scholar]
- 26.Lindheimer MD, Davison JM. Osmoregulation, the secretion of arginine vasopressin and its metabolism during pregnancy. Eur J Endocrinol. 1995;132:133–43. [DOI] [PubMed] [Google Scholar]
- 27.Chapman AB, Abraham WT, Zamudio S, Coffin C, Merouani A, Young D, et al. Temporal relationships between hormonal and hemodynamic changes in early human pregnancy. Kidney Int. 1998;54(6):2056–63. [DOI] [PubMed] [Google Scholar]
- 28.de Alvarez RR, Bratvold GE. Renal Glomerulotubular Mechanisms During Normal Pregnancy. Am J Obstet Gynecol. 1958;75(5):931–44. [DOI] [PubMed] [Google Scholar]
- 29.Waikar SS, Sabbisetti VS, Bonventre JV. Normalization of urinary biomarkers to creatinine during changes in glomerular filtration rate. Kidney Int. 2010;78(5):486–94. [DOI] [PMC free article] [PubMed] [Google Scholar]
- 30.Chadha V, Garg U, Alon US. Measurement of urinary concentration: A critical appraisal of methodologies. Pediatr Nephrol. 2001;16(4):374–82. [DOI] [PubMed] [Google Scholar]
- 31.Weinberg CR, Umbach DM. Using Pooled Exposure Assessment to Improve Efficiency in Case-Control Studies. Biometrics. 1999;55(September):718–26. [DOI] [PubMed] [Google Scholar]
- 32.Saha-Chaudhuri P, Umbach DM, Weinberg CR. Pooled exposure assessment for matched case-control studies. Epidemiology. 2011;22(5):704–12. [DOI] [PMC free article] [PubMed] [Google Scholar]
- 33.Saha-Chaudhuri P, Weinberg CR. Specimen pooling for efficient use of biospecimens in studies of time to a common event. Am J Epidemiol. 2013;178(1):126–35. [DOI] [PMC free article] [PubMed] [Google Scholar]
Associated Data
This section collects any data citations, data availability statements, or supplementary materials included in this article.