

Abstract
Trace amine-associated receptor 1 (Taar1) impacts methamphetamine (MA) intake. A mutant allele (Taar1m1J) derived from the DBA/2J mouse strain codes for a non-functional receptor, and Taar1m1J/m1J mice consume more MA than mice possessing the reference Taar1+ allele. To study the impact of this mutation in a genetically diverse population, heterogeneous stock-collaborative cross (HS-CC) mice, the product of an 8-way cross of standard and wild-derived strains, were tested for MA intake. HS-CC had low MA intake, so a HS-CC by DBA/2J strain F2 intercross was created to transfer the mutant allele onto the diverse background, and used for selective breeding. To study residual variation in MA intake existing in Taar1m1J/m1J mice, selective breeding for higher (MAH) vs. lower (MAL) MA intake was initiated from Taar1m1J/m1J F2 individuals; a control line of Taar1+/+ individuals (MAC) was retained. The lines were also examined for MA-induced locomotor and thermal responses, and fluid and tastant consumption. Taar1m1J/m1J F2 mice consumed significantly more MA than Taar1+/+ F2 mice. Response to selection was significant by generation 2 and there were corresponding differences in fluid consumed. Fluid consumption was not different in non-MA drinking studies. Taar1m1J/m1J genotype (MAL or MAH vs. MAC mice) was associated with heighted MA locomotor and reduced hypothermic responses. MAL mice exhibited greater sensitization than MAH mice, but the selected lines did not consistently differ for thermal or tastant phenotypes. Residual variation among high risk Taar1m1J/m1J mice appears to involve mechanisms associated with neuroadaptation to MA, but not sensitivity to hypothermic effects of MA.
Keywords: 2-bottle choice, hypothermia, psychostimulant, self-administration, saccharin, selective breeding, sensitization, trace amine-associated receptor 1, quinine
INTRODUCTION
Dangerous levels of methamphetamine (MA) exposure and deaths associated with excessive chronic use continue to rise.1,2 Though social and environmental factors impact MA use, genetic factors also have an important role.3–9 Animal models possess unique advantages for the investigation of genetic contributions to drug-related phenotypes, because they allow drug exposure history, developmental and adult environment, and genetic composition to be more precisely controlled than is possible in human populations. Selective breeding in rodents is a key strategy for identifying genetic contributors to risk for drug intake and other drug-related traits.10–15 We used bidirectional selective breeding to create lines of mice that consume markedly different amounts of MA14,16,17 and identified the trace amine-associated receptor 1 gene, Taar1, as a major contributor to genetic risk for MA intake.18–20 However, considerable residual variation in MA consumption remains among the mice bred for high MA intake, although they all possess a high risk, Taar1m1J/m1J genotype.19,21 This raised the possibility that genetic background differences modify the impact of the Taar1m1J/m1J genotype on MA intake. Here, we describe a new selective breeding project designed to address this prospect.
Quantitative trait locus (QTL) mapping led to a series of investigations that identified Taar1 as the quantitative trait gene that accounts for 60% of the heritable variation in MA intake in the MA high drinking (MAHDR) and MA low drinking (MALDR) lines.10,18–20 MA is a direct agonist at TAAR1, the receptor expressed by Taar1,22,23 which is an intracellularly-located stimulatory G protein-coupled receptor.24 A non-synonymous single nucleotide polymorphism (SNP) spontaneously arose in the non-synonymous coding sequence of Taar1 within the DBA/2J (D2) mouse colony at The Jackson Laboratory,19 from which this strain and the C57BL/6J (B6) strain were sourced for the production of F2 cross populations that served as the progenitors of the MA drinking (MADR) lines. Mouse SNP rs33645709 changes a cytosine to adenine, and is a proline to threonine mutation at amino acid position 77.18 The mutant Taar1m1J allele was fixed in the D2 strain at The Jackson Laboratory, between 2001 and 2003.19 The Taar1m1J allele expresses a receptor that does not exhibit a cAMP response to MA and other direct agonists in cell culture, a response that is exhibited by the receptor expressed by the reference Taar1+ allele.18,25
Using banked DNA samples, we determined that selective breeding for high MA intake resulted in fixation of the Taar1m1J allele in MAHDR mice in the first selection generation, so that all mice of this line have the homozygous Taar1m1J/m1J genotype. The MALDR mice all possess at least one copy of the Taar1+ allele and are thus, either Taar1m1J/+ or Taar1+/+.18,19 Phenotypic dominance for low MA intake in heterozygotes is evident.19 However, although the replacement of Taar1m1J with Taar1+ in MAHDR mice using a CRISPR-Cas9 knock-in approach converted MA intake to levels seen in MALDR mice,20 within the MAHDR line, considerable individual variation in MA intake remains, whereas variation in the MALDR line is considerably smaller.19,20 We hypothesize that there are genetic variants in specific individuals of the MAHDR line that modify, and in this case reduce, the high MA intake phenotype in the presence of the high risk Taar1m1J/m1J genotype. Discovery of these variants could lead to information about mechanisms relevant to therapeutic development.
Successful selective breeding requires additive genetic variance resulting in deviance from the mean phenotype due to the inheritance of particular alleles.26 To determine whether a source of variation in MA intake among Taar1m1J/m1J individuals is genetic, rather than solely environmental, we designed a second selective breeding project. We considered that additional genetic factors relevant to risk for MA intake might be discovered by initiating this selection from a more genetically diverse population. Heterogeneous stock collaborative cross (HS-CC) mice capture more than 90% of the genetic diversity in Mus musculus.27.28 However, the mutant Taar1m1J allele is not found in any of the 8 inbred strains from which the HS-CC were derived. We therefore speculated that although this population has favorable genetic diversity, there would be little variation in MA intake, and examined this in the initial study reported here. Based on the outcome of low MA intake and variance, and our goal of identifying modifiers of MA intake in the presence of the high risk Taar1m1J/m1J genotype, we introduced the Taar1m1J allele into the HS-CC by crossing them with D2 mice. We then pursued selective breeding from the F2 generation, using only those individuals that were Taar1m1J/m1J. Successful selective breeding for higher (MAH) vs. lower (MAL) MA intake from this population substantiates the influence of other genes on MA intake that modify the impact of the Taar1m1J/m1J genotype. A control Taar1+/+ line (MAC) was retained for comparison.
We also tested the selected lines for several additional traits to examine specific hypotheses about the relationships of these traits with different levels of MA intake. Because drug-induced stimulation and sensitization engage some of the same brain mechanisms associated with drug reward and use,29,30 we measured sensitivity to MA-induced locomotor activation and sensitization in the new selected lines. Existing data indicate that reduced TAAR1 function is related to enhanced sensitivity to MA stimulant effects,31 therefore we predicted that MAC mice would exhibit reduced stimulation and sensitization, compared to MAH and MAL mice. In a set of selected lines bred for differential sensitivity to the locomotor stimulant effects of MA, the high stimulation line exhibited higher MA-induced sensitization, but lower MA intake, compared to the low stimulation line.32 Therefore, we predicted that the MAH line would exhibit reduced locomotor stimulation and sensitization, compared to the MAL line. To determine whether the genetic differences arising from selective breeding have a role in sensitivity to an effect of MA that has consistently differentiated the MADR lines and is strongly impacted by Taar1 genotype,18,19,33 we also tested the MAH, MAL and MAC mice for sensitivity to MA effects on body temperature. Because TAAR1 function is important for MA-induced hypothermia,18,33 we expected to observe a hypothermic response in MAC mice, with no hypothermic response in MAH or MAL mice. However, it is possible that non-Taar1-related genetic changes produced by selective breeding within the Taar1m1J/m1J mice are relevant to MA-induced hypothermia, in which case we would expect greater hypothermia in MAL than MAH mice, as this trait has been demonstrated to be associated with lower MA intake in several studies.18,19 Finally, the potential impact of differences in taste sensitivity or preference for naturally rewarding substances on MA intake was considered by measuring the voluntary consumption of a non-psychoactive bitter (quinine, QUIN) and a sweet (saccharin, SACC) tastant in a 2-bottle choice procedure. Differences in the consumption of these substances have not been found for the MADR lines.16,17 The potential impact of differences in overall fluid consumption was also considered, for which small differences (~ 0.5 ml greater volume intake in MAHDR, compared to MALDR) have been previously documented for the MADR lines.16,17
METHODS
Subjects
All experiments were performed in accordance with the National Institutes of Health Guidelines for the Care and Use of Laboratory Animals and were approved by the Institutional Animal Care and Use Committee at the VA Portland Health Care System (VAPORHCS). All mice were initially group housed in polycarbonate shoebox cages (28.5 × 17.5 ×12 cm) on Bed-o’Cob bedding (The Andersons, Inc., Maumee, OH, USA) and maintained on a 12:12 h light:dark cycle, with lights on at 5:00AM. The HS-CC mice were obtained from Dr. Robert Hitzemann (Oregon Health & Science University, Portland, OR, USA) and the D2 mice were purchased from The Jackson Laboratory (Bar Harbor, ME, USA). Breeding pairs remained with offspring throughout the rearing period, and offspring were weaned at 21 ± 1 days of age and group housed with same-sex littermates, 2–5 per cage. Mice had free access to tap water and laboratory rodent block food (Purina 5LOD PicoLab Rodent Diet; Animal Specialties, Woodburn, OR, USA) at all times.
HS-CC mice
The HS-CC line was created by Dr. Robert Hitzemann and is maintained in the VAPORHCS veterinary medical unit. They were derived by the systematic cross-breeding of 8 mouse strains, including 129S1/SvImJ, A/J, C57BL/6J, CAST/EiJ, NOD/ShiLtJ, NZO/HILtJ, PWK/PhJ and WSB/EiJ. Three of the strains are wild-derived (CAST/EiJ, PWK/PhJ and WSB/EiJ) and the line is similar to the Diversity Outbred (DO) population.34 The HS-CC colony consists of 48 actively breeding families and is perpetuated by a rotational breeding scheme using 1 male and 1 female offspring from each family. This strategy yields a highly genetically diverse population that is especially suitable for studying individual differences. A population of 57 adult (60 ± 1 days of age) HS-CC mice (27 male and 30 female) that included mice from all 48 families were tested for 2-bottle choice MA drinking (detailed below). HS-CC mice used for the selective breeding project are described in the next section.
Creation of the Taar1m1J/m1J MA high and low, and Taar1+/+ control, drinking lines
The general breeding scheme for the selective breeding project is illustrated in Figure 1. One male or female HS-CC mouse from each of the 48 families was crossed with a D2 mouse to create the F1 generation. Two mice from each of these 48 breeding pairs (1 male and 1 female per pair) were then randomly chosen and intercrossed to create the F2 generation, with no brother-sister mating. The first 2 litters of F2 offspring (551 mice, 258 male and 293 female) were genotyped for Taar1. The frequencies of the Taar1 genotypes in the F2 animals were 158 Taar1+/+ (76 male and 82 female); 253 Taar1 +/m1J (117 male and 136 female); and 140 Taar1m1J/m1J (65 male and 75 female). One-hundred and twenty of the Taar1m1J/m1J mice (n=60/sex) were phenotyped for MA intake (methods described below), and breeders were selected on the basis of high vs. low MA intake, as previously described for the MADR lines.14,16,17 This established the MAH and MAL lines, respectively. To provide a comparison group of mice with the Taar1+/+ genotype, 118 Taar1+/+ mice (59/sex) were phenotyped to verify their low MA intake. Data from 1 female mouse were lost due to tube leakage, leaving a final population size of 117, from which breeding pairs were chosen across the small range of intake values to establish the MAC line. Thirteen breeding pairs per line were set up to establish each of the lines, and ~30/sex/line were phenotyped for each subsequent selection generation, for a total of 5 selection generations. The non-selected MAC line was phenotyped for MA drinking in generation 1 and 3. The average age of the mice tested for the selective breeding project was 56 ± 1 days of age.
Figure 1.

Flowchart detailing the methods used to create selected lines from a founding population of heterogeneous stock-collaborative cross (HS-CC) mice crossed with the DBA/2J (D2) strain (F1) and then their offspring crossed again (F2) for the purpose of introducing the Taar1m1J/m1J mutation into the HS-CC stock and generating mice homozygous for each Taar1 allele. The resulting F2 offspring were genotyped for Taar1, and then 120 Taar1m1J/m1J (60/sex) and 118 Taar1+/+ (59/sex) mice were tested for voluntary methamphetamine (MA) intake. Selective breeding ensued from the highest and lowest MA consuming Taar1m1J/m1J mice to establish the MAH and MAL lines, respectively. Breeders for the control line were chosen across the narrow range of MA intake values for the Taar1+/+ mice. Colors in the chart match those designating specific genotypes in other figures.
Drugs, reagents, and biological samples
(+)MA hydrochloride was purchased from Sigma Aldrich (St. Louis, MO, USA) and dissolved in tap water for drinking studies or in sterile 0.9% saline (Baxter Healthcare Corp., Deerfield, IL, USA) for IP injection. Saccharin sodium salt (SACC) and quinine hemisulfate (QUIN) were obtained from Sigma Aldrich and dissolved in tap water for tastant studies. Genomic DNA was extracted from ear punch samples using QuickExtract DNA extraction solution (Qiagen, Valecia, CA, USA) and Taar1 was amplified (forward 5’-ctttctgctgggctgtctga-3’, reverse 5’-caacagcgctcaacagttctc-3’) and genotype determined utilizing a rtPCR assay, based on standard Taqman procedures35 and methods similar to those fully detailed in our previous publications.18,19
Two-bottle choice MA drinking
Mice were isolate-housed and given access to 2 water-filled graduated cylinders fitted with stoppers and sipper tubes, and were weighed every 2 days. They were habituated to drinking from these tubes on days 1 and 2, and then on Days 3–6, one tube contained water and the other contained 20 mg MA/l of water, and on Days 7–10, the tubes contained water vs. 40 mg MA/l of water. Water was available at all times and MA was available for 18h/day, beginning 3 h before dark onset until 3 h after light onset. During the 6 h when MA was not available, mice had access to a single water tube. The relative positions of the water and MA tubes were switched every other day to account for potential drinking side preferences. Days 4 and 6 (20 mg/l), and days 8 and 10 (40 mg/l) represent days when MA was on the same side as the previous day (not switched), and account for potential differences in intake associated with tube location. Thus, we averaged data from days 4 and 6 and days 8 and 10 to calculate MA intake (g/kg), preference ratio (ml consumed from the MA tube/total ml consumed from both tubes), and total volume consumed from both tubes during MA access. This procedure is identical to that used to characterize mice for our previous MADR selective breeding projects.14,16,17,19
MA-induced locomotor stimulation, sensitization and conditioned activation
Locomotor data were collected in automated activity monitors (40 cm W × 40 cm L × 30 cm H; Omnitech Electronics, Columbus, OH, USA) equipped with 16 photocell beams and detectors per axis that dissected the open space at a 2 cm distance above the acrylic plastic chamber floor. Beam interruptions were converted into horizontal distance traveled (cm) using Fusion software (Omnitech Electronics). Each monitor was enclosed in an Environmental Control Chamber (Accuscan, Columbus, OH, USA) equipped with a fan that provided ventilation and masked external noise from reaching the animal during testing. A 3.3 Watt incandescent light bulb was illuminated during testing.
Our standard 12-day procedure was used,32,36 (see Table 1 for experimental timeline), which measures distance traveled after saline injection on days 1 and 2, distance after an initial MA injection on day 3, distance after MA injection on an every other day schedule (days 5, 7, 9, and 11), and distance after a final saline treatment on day 12. On each of these days, mice were transported to the testing room, then weighed and left undisturbed to acclimate to the testing environment for 1 h. Injections were given immediately before placement into the center of the activity monitor, and volume of injection was 10 ml/kg. The MA dose was 1 mg/kg, based on prior studies indicating that this dose avoids a ceiling effect, allowing for sensitization to be measured.32 Activity tests were 60 minutes in duration, with data collected in 5-min periods, beginning at least 2 hours after lights on and ending no later than 2 hours before lights off. Mice remained in the colony room on intervening days (4, 6, 8 and 10). From distance measurements, three scores were calculated for each mouse to quantify acute stimulation, sensitization, and conditioned activation. For acute stimulation, distance after saline on day 2 was used as a measure of habituated baseline activity and subtracted from the day 3 distance after initial MA treatment. For a measure of sensitization, the day 3 distance after initial MA treatment was subtracted from distance after the final MA treatment on day 11. As a measure of conditioned activation, baseline distance after saline treatment on day 2 was subtracted from distance after saline treatment on day 12; by day 12, mice had received MA multiple times in the activity monitors. These are standard indices in our lab,32,36 allowing us to qualitatively consider current and historical results. Data were collected for progenitor HS-CC × D2 F2 cross mice of the Taar1+/+ and Taar1m1J/m1J genotypes (n=14–16/sex/genotype; average age 80 ± 1 days), and for each of the selected lines for generations S1-S4 (S1: n=15–20/sex/line, average age=87 ± 2 days; S2: n=10–21/sex/line, average age=67 ± 1 days; S3: n=14–19/sex/line, average age=72 ± 1 days; S4: n=10–20/sex/line, average age=68 ± 1 days). Data were lost for a total of 5 mice across all generations due to equipment or injection issues (1 female S2 MAL; 1 female S4 MAC; 1 male S4 MAC; 1 female S4 MAH; 1 female S4 MAL). The group sizes listed are numbers after removal of these individuals.
Table 1.
Methods for measuring MA-induced locomotor stimulation, sensitization and conditioned activation
| Day of Testing | ||||||||||||
|---|---|---|---|---|---|---|---|---|---|---|---|---|
| 1 | 2 | 3 | 4 | 5 | 6 | 7 | 8 | 9 | 10 | 11 | 12 | |
| Inject: | SAL | SAL | MA | none | MA | none | MA | none | MA | none | MA | SAL |
| Test: | Yes | Yes | Yes | No | Yes | No | Yes | No | Yes | No | Yes | Yes |
MA, 1 mg/kg MA; none, no injection given; No, mice remain in colony room with no testing; SAL, saline; Yes, activity test for 60 minutes;
MA-induced change in body temperature
Core body temperature was measured with a Thermalert model TH-8 digital thermometer (Sensortek, Clifton, NJ, USA) according to our previously established methods.18,19 Mice were weighed and housed for a 1-h acclimation period in custom-built, ventilated acrylic plastic chambers.37,38 Each 16-cubicle chamber isolated the mice from each other via perforated acrylic plastic walls and served the purpose of preventing huddling-related temperature regulation. Baseline (T0) temperature was obtained by rectal insertion of a lubricated temperature probe, saline or 2 mg/kg MA was immediately injected, and then temperatures were measured at T30, 60, 90, 120 & 180 post-injection. Mice were returned to their individual cubicles between temperature recordings. MA effects on body temperature were characterized in MAH, MAL and MAC mice for selection generations S2 and S5 (S2: n=10/sex/line/treatment group, average age=83 ± 1 days; S5: n=10/sex/line/treatment group, average age=86 ± 1 days).
Two-bottle choice novel tastant drinking
Consumption of MA could be impacted by its bitter taste and/or by preference for rewarding substances. We examined this by measuring SACC and QUIN consumption and preference. Total volume consumed was also measured. Concentrations and methods were consistent with our previous studies in MADR mice.16,17 Mice were acclimated on days 1 and 2 to drinking from the same type of graduated drinking tubes described for two-bottle choice MA drinking. A counterbalanced design was used so that mice had access to SACC and then QUIN or QUIN and then SACC, with water as the alternative choice. Thus, on days 3–18, 2 SACC (1.6 mM and 3.2 mM) and 2 QUIN (0.015 mM and 0.03 mM) concentrations were offered for 4 days each in ascending order, with the positions of the water and tastant tubes switched every 2 days. Mice were from third or fourth litter offspring from the S3 and S5 selection generations of the MAC, MAH and MAL lines (S3: n=10/sex/line; average age=85 ± 1 days; S5: n=10/sex/line; average age=67 ± 1 days).
Data analysis
Data were analyzed with Statistica, version 13.3 software (TIBCO Software, Palo Alto, CA, USA). HS-CC F2 MA intake data and locomotor difference score data used to provide indices of MA-induced locomotor effects were evaluated for normality. With the exception of data for mice with the Taar1+/+ genotype that almost without exception avoid MA, all data were normally distributed. We applied factorial analysis of variance (ANOVA) with repeated measures as appropriate to allow multi-factor analysis. Sex was included as a factor in all initial analyses and then data were considered for the sexes combined if no significant effects involving sex that would impact interpretation of MA or genotype effects were found. Three-way interactions were further considered by two-way ANOVA within each level of a relevant factor. Two-way interactions were examined for significant simple effects, and post hoc mean comparisons (Newman-Keuls or Dunnett) were applied when simple effects were significant or to examine main effects. Mean comparisons were restricted to those appropriate for evaluating specific hypotheses rather than testing for all possible differences, to reduce type I error. Correlations were performed using Pearson’s r. The significance level was set at p<.05. Finally, selection response realized heritability, h2, was calculated as the ratio of the response to selection (R) over the selection differential (S), as detailed in Falconer & Mackay (1996), and previously calculated for the MADR lines.14,16,17
RESULTS
Two-bottle choice MA drinking in HS-CC mice
Our previous studies have measured MA intake only in mice that possess genes from the D2 and B6 inbred strains, and mice with the Taar1+ allele have consistently consumed little MA, with a small range in MA intake. Although all of the HS-CC mice have the Taar1+/+ genotype, additional genes present in this genetically diverse population could increase the range of MA intake amounts among individuals. MA intake, MA preference ratio, and total fluid consumption data for the HS-CC mice are presented in Figure 2. There were no significant effects of sex or MA concentration on mg/kg MA consumed (Figure 2a). Low preference ratios (Figure 2b) indicated avoidance of consuming fluid from the MA-containing tube. There was a significantly lower preference ratio for the higher MA concentration (F1,55=11.64, p=.001), but no effect of sex. For total volume of fluid consumed during the 18-h test period (Figure 2c), there was a significant effect of sex (F1,55=7.71, p=.007) and of concentration (F1,55=58.94, p<.001), but no interaction. Although males consumed about 0.9 ml (18%) more than females, more total fluid was consumed overall during the time when the higher MA concentration was offered. Frequency distributions for the 20 and 40 mg/l MA concentrations (Figure 2d,e) show that the population was skewed toward low MA intake. Eighty-four % of the mice consumed < 1 mg/kg MA/18h from each MA concentration. Overall, the low MA consumption and preference of these Taar1+/+ mice are consistent with data obtained from all other populations possessing this genotype.18–20 Based on the extremely limited variability in MA intake in this population, selective breeding was not considered viable. Therefore, we proceeded with a plan to examine variable MA intake among individuals with the Taar1m1J/m1J genotype by introducing the Taar1m1J allele into the HS-CC line, and proceeding with selective breeding, as illustrated in Figure 1.
Figure 2.

HS-CC mice, which do not possess the Taar1m1J/m1J genotype, exhibit low levels of MA intake and preference in a two-bottle choice MA drinking procedure. Means ± SEM for a) MA intake (mg/kg/18h), b) preference ratio (ml from MA tube/total ml), and c) total volume consumed (ml/18h) during the time that the 20 and 40 mg/l MA concentrations were available. Also shown are frequency distributions for mg/kg MA consumed for the d) 20 mg/l and e) 40 mg/l MA concentrations, illustrating low intake and variation. N=57 (27 male and 30 female). ***p<.001 for the effect of MA concentration in b and the main effect of sex in c.
Two-bottle choice MA drinking in HS-CC × D2 F2 mice
MA consumption data for the HS-CC × D2 F2 mice of the 2 homozygote Taar1 genotypes are presented in Figure 3. Means for MA intake, MA preference ratio and total volume consumed are presented in Figure 3a–c. There was a significant genotype × MA concentration interaction for mg/kg MA consumed (F1,233=70.45, p<.001), with greater MA intake by Taar1m1J/m1J mice compared to Taar1+/+ mice at both MA concentrations, and concentration-dependent effects only in the Taar1m1J/m1J mice (F1,235=193.66, p<.001). For preference ratio, there were significant main effects of genotype (F1,233=410.66, p<.001) and concentration (F1,233=15.61, p<.001), with greater MA preference in Taar1m1J/m1J compared to Taar1+/+ mice and reduced preference overall for the higher MA concentration. For total volume of fluid consumed, there was only a significant effect of concentration (F1,233=93.01, p<.001), with greater volume consumed of about 0.8 ml during the time when the higher MA concentration was available. There were no effects of sex for any of these variables. The frequency distributions for the 2 genotypes shown in Figure 3d–e reflect restricted variation for the Taar1+/+ compared to the Taar1m1J/m1J genotype mice for both MA concentrations. For the 40 mg/l MA concentration, 75% of the Taar1+/+ mice consumed < 1 mg/kg MA/18h, compared to 5% of the Taar1m1J/m1J mice. Twenty-one % of the Taar1m1J/m1J mice consumed amounts of MA that were above the maximum of 5.85 mg/kg MA consumed by the highest consuming Taar1+/+ mouse. Correlations between Taar1 genotype and MA intake, preference and total volume consumed for the 2 MA concentrations are listed in Table 2. All correlations were significant for MA intake and preference, but not total volume. Individuals from the phenotypically variable Taar1m1J/m1J population served as the progenitors for selective breeding for high and low MA intake.
Figure 3.

HS-CC × DBA/2J F2 mice possessing the Taar1m1J/m1J genotype exhibit higher levels of MA intake and preference than those with the Taar1+/+ genotype in a two-bottle choice MA drinking procedure. Means ± SEM for a) MA intake (mg/kg/18h), b) preference ratio (ml from MA tube/total ml), and c) total volume consumed (ml/18h) during the time that the 20 and 40 mg/l MA concentrations were available for Taar1m1J/m1J and Taar1+/+ F2 mice. Also shown are frequency distributions for mg/kg MA consumed for the d) 20 mg/l and e) 40 mg/l MA concentrations, illustrating higher intake and variation in the Taar1m1J/m1J mice. N=237 (58–60/sex/genotype). ***p<.001 for the effect of MA concentration; +++p<.001 for the effect of genotype.
Table 2:
Correlations between MA drinking phenotypes and Taar1 genotype in different mouse populations.
| MA Concentration | Phenotype | F2 | S1 | S3 |
|---|---|---|---|---|
| 20 mg/l | mg/kg MA | 0.71*** | 0.66*** | 0.64*** |
| preference ratio | 0.74*** | 0.70*** | 0.73*** | |
| total volume | 0.03 | 0.16* | 0.10 | |
| 40 mg/l | mg/kg MA | 0.64*** | 0.67*** | 0.61*** |
| preference ratio | 0.76*** | 0.75*** | 0.73*** | |
| total volume | 0.001 | 0.20** | 0.13 |
F2, HS-CC × DBA/2J F2 cross; MA, methamphetamine; S1, selection generation 1 of the MAH, MAL and MAC lines; S3, selection generation 3 of the MAH, MAL and MAC lines. N = 237 for F2, 178 for S1, and 177 for S3;
p<.05;
p<0.01;
p<.001
Selection for High and Low MA Intake in Taar1m1J/m1J mice from the HS-CC × D2 F2 cross
Selective breeding of the MAH and MAL lines was based on the amount of MA consumed (mg/kg) during the time that mice had access to 40 mg/l MA versus water, the same selection index used to create the MADR lines. MA consumption, preference and total volume consumed data for the 40 mg/l concentration are presented in Figure 4. Data for the 20 mg/l MA concentration are presented in Supplementary Information Figure S1. Means ± SEM are shown for the HS-CC × D2 F2 founding population (S0), parents selected to produce offspring for each generation (S1-S5), and the phenotyped offspring for each selection generation (S1-S4). The S5 generation offspring were produced by selected parents, but were not themselves tested for MA intake; thus, only the parent means for this generation are shown.
Figure 4.

Selection results for the MAH and MAL lines and characterization of the MAC line. Shown are means ± SEM mg/kg/18h MA intake in a) the MAH/MAL selection study for the originating F2 (S0), parents selected for breeding generations S1-S5, and S1-S4 generation MAH and MAL offspring, and in b) the MAC line for their originating F2 (G0), parents selected for breeding (G2 and G4) and G1 and G3 offspring. Also shown are means ± SEM for c,d) preference ratio for the mice that generated the data in a and b, and means ± SEM for e,f) total volume (ml) consumed for the same mice. For the F2, n=58–60/sex for each of the S0 and G0 populations; for the S1-S5/G2 and G5 parents, n=13/sex/line for each generation; for offspring, n=28–32/sex/line/generation. All statistical symbols refer to comparisons between offspring and F2 or between offspring of the 2 lines. *p<.05, **p<.01, ***p<.001 for the difference from the F2; +p<.05, +++p<.001 for the effect of line; ++p<.01 for the main effect of line in c.
MA consumption (mg/kg/18h; 40 mg/l MA)
There was a significant bidirectional response to selection, as indicated by the divergence of both lines from the founding population (Figure 4a). Divergence from the F2 population was examined with sex × generation ANOVAs that included the F2 and MAH offspring data or the F2 and MAL offspring data. In both cases, there was a significant main effect of generation (F4,346=4.17, p=.003 for the F2 and MAH line; F4,346=4.86, p<.001 for the F2 and MAL line). The S4 MAH mice consumed significantly more MA on average than did F2 mice. The S4 MAL mice consumed significantly less MA than did F2 mice. For the F2/MAH analysis, there was also a significant main effect of sex (F1,346=4.17, p=.042). Females consumed about 0.6 mg/kg (13%) more MA than males.
Next, to examine line differences, a sex × line × generation ANOVA was performed. There were significant line × generation (F3,456=6.64, p<.001) and sex × generation (F3,456=2.75, p=.043) interactions, but no effects of sex that included line. MAH mice consumed significantly more MA than MAL mice in generations S2 through S4. Overall, female S2 and S3 mice consumed 1.0 and 0.9 mg/kg (25 and 22%) more MA than male mice (ps<.05); there was no sex difference in S1 or S4.
Mice of the randomly bred MAC line (Figure 4b), which possess the Taar1+/+ genotype, were tested in generations G1 and G3 to confirm their expected low MA intake. A sex × generation ANOVA yielded no significant findings. Data for the MAC, MAL and MAH lines were then examined together in a sex × line × generation ANOVA, for common generations 1 and 3. There was a significant line × generation interaction (F2,343=4.16, p=.016), but no significant effect of sex. MAC mice of both generations consumed significantly less MA on average than either the MAH or MAL lines (ps<.001).
MA preference ratio (ml MA tube : total ml; 40 mg/l MA)
For the ANOVA including F2 and MAL preference ratio data (Figure 4c), there were no significant findings. For the F2 and MAH data, there was a significant main effect of generation (F4,346=2.78, p=.027), but no effect of sex. MAH mice of the S4 generation had a larger mean preference ratio than F2 mice. When preference ratio data for the MAH and MAL mice were compared, there was a significant main effect of line (F1,456=10.03, p=.002), but no significant interaction with generation nor significant effects involving sex. The MAH mice had a larger preference ratio than the MAL mice (Figure 4c).
For the MAC line (Figure 4d), a sex × generation ANOVA detected no significant differences. When preference ratio data were compared for all 3 mouse lines, there was a significant main effect of line (F2,343=207.48, p<.001), but no other significant effects. MAC mice had a significantly smaller preference ratio, compared to both MAH and MAL mice (ps<.001).
Total volume (total ml/18h; water and 40 mg/l MA)
The effect of generation was significant for each ANOVA that included F2 and MAH total volume data (F4,346=5.30, p<.001) or F2 and MAL total volume data (F4,346=12.17, p<.001) (Figure 4e). The S3 and S4 generation MAH mice consumed significantly more total volume than F2 mice, and the S2-S4 generation MAL mice consumed significantly less total volume than F2 mice. There was also a significant main effect of sex in both the F2/MAH analysis (F1,346=7.25, p=.007), and F2/MAL analysis (F1,346=8.67, p=.003). Males consumed more total volume than females, with a difference of about 0.5 ml in both cases. When the MAH and MAL mice were compared for total volume, there was a significant line × generation interaction (F3,456=12.81, p<.001) and a significant main effect of sex (F1,456=9.73, p=.002). S2-S4 MAH mice consumed more total fluid from the 2 tubes than MAL mice, and males consumed about 0.5 ml more than females.
For the MAC line (Figure 4f), there was a significant effect of generation (F2,229=3.76, p=.025); however, post hoc tests did not reach the significance criterion. When all 3 lines were compared, there was a significant main effect of sex (F1,343=4.14, p=.043) and a line × generation interaction (F2,343=12.79, p<.001). Males consumed about 0.4 ml more total fluid than females. In generation 1, there were significant differences among the lines in total amount of fluid consumed (F2,343=3.84, p=.023). MAC mice consumed less total fluid than both MAH and MAL mice (p<.05). In generation 3, there were also significant differences among the lines (F2,343=28.31, p<.001). In this later generation, the MAH line consumed more total fluid than both the MAL and MAC lines (ps<.001), and the MAC line consumed more total fluid than the MAL line (p<.05).
Heritability and correlations
Realized heritability, h2, calculated from the slope of the regression of the selection response (R, based on offspring means) on the selection differential (cumulative S, based on population and selected parent means), was 0.165. Thus, approximately 17% of the variance in MA consumption between the MAH and MAL lines can be attributed to genetic differences. Data from the MAC, MAL and MAH lines from generations 1 and 3 were used to examine correlations with Taar1 genotype (Table 2). For generation 1, the correlations with MA intake and preference for the 20 and 40 mg/l concentrations were significant and Taar1 genotype accounted for 44–56% of the variance in these traits. Correlations of Taar1 genotype with total volume consumed during the same time period were statistically significant, but Taar1 genotype accounted for only 3–4% of the variance. For the generation 3 animals, results were similar for MA intake and preference with Taar1 genotype accounting for 37–53% of the variance in these traits. Correlations with total volume consumed were not significant for generation 3.
Changes in MA intake across selection generations were accompanied by changes in total fluid consumed. Correlations were calculated for each of the lines between MA intake and total volume in each generation. Data are presented in Supplementary Information Table S1. For all lines, there were significant correlations between mg/kg MA intake and ml of fluid consumed. This included the MAC line, which consumed little MA, compared to the other 2 lines. Significant correlations were seen at each generation in all lines, except for the MAL line in the S1 and S4 generations. However, the correlations for the MAL and MAH lines were virtually identical in the S3 generation, at r=0.60 (n=59) and 0.61 (n=60), respectively, although their mg/kg MA intake was significantly different (Figure 4a).
MA-induced locomotor stimulation, sensitization and conditioned activation in HS-CC × D2 F2 mice
Locomotor activity data (distance in cm) are shown in Figure 5 for HS-CC × D2 F2 mice of the Taar1m1J/m1J and Taar1+/+ genotypes. F2 mice of these genotypes served as the progenitors of the MAL/MAH selected lines and MAC non-selected line, respectively. A repeated measures sex × Taar1 genotype × day ANOVA for the 60-min test period (Figure 5a) identified a significant Taar1 genotype × day interaction (F7,406=11.97, p<.001), but no sex effects. For both Taar1m1J/m1J and Taar1+/+ mice, there were significant effects of day (F7,406=120.85, p<.001 and F7,406=34.67, p<.001, respectively) and for both genotypes, distance traveled was greater on MA treatment days (3, 5, 7, 9, 11) than on saline treatment days (1, 2, 12). However, distance traveled was significantly greater in Taar1m1J/m1J mice, compared to Taar1+/+ mice, on all MA treatment days, while there was no significant effect of Taar1 genotype on saline treatment days. Figure 5b shows mean values for MA-induced acute stimulation (Day 3 corrected by subtraction of the Day 2 baseline; D3-D2), sensitization (Day 11 corrected by subtraction of the Day 3 initial response after MA; D11-D3), and conditioned activation (Day 12 corrected by subtraction of Day 2 baseline; D12-D2). There was a significant main effect of Taar1 genotype for all three measures (F1,58=9.54, p=.003; F1,58=7.18, p=.01; and F1,58=7.47, p=.008, respectively), with Taar1m1J/m1J mice exhibiting significantly higher levels of all traits. There were no significant sex effects.
Figure 5.
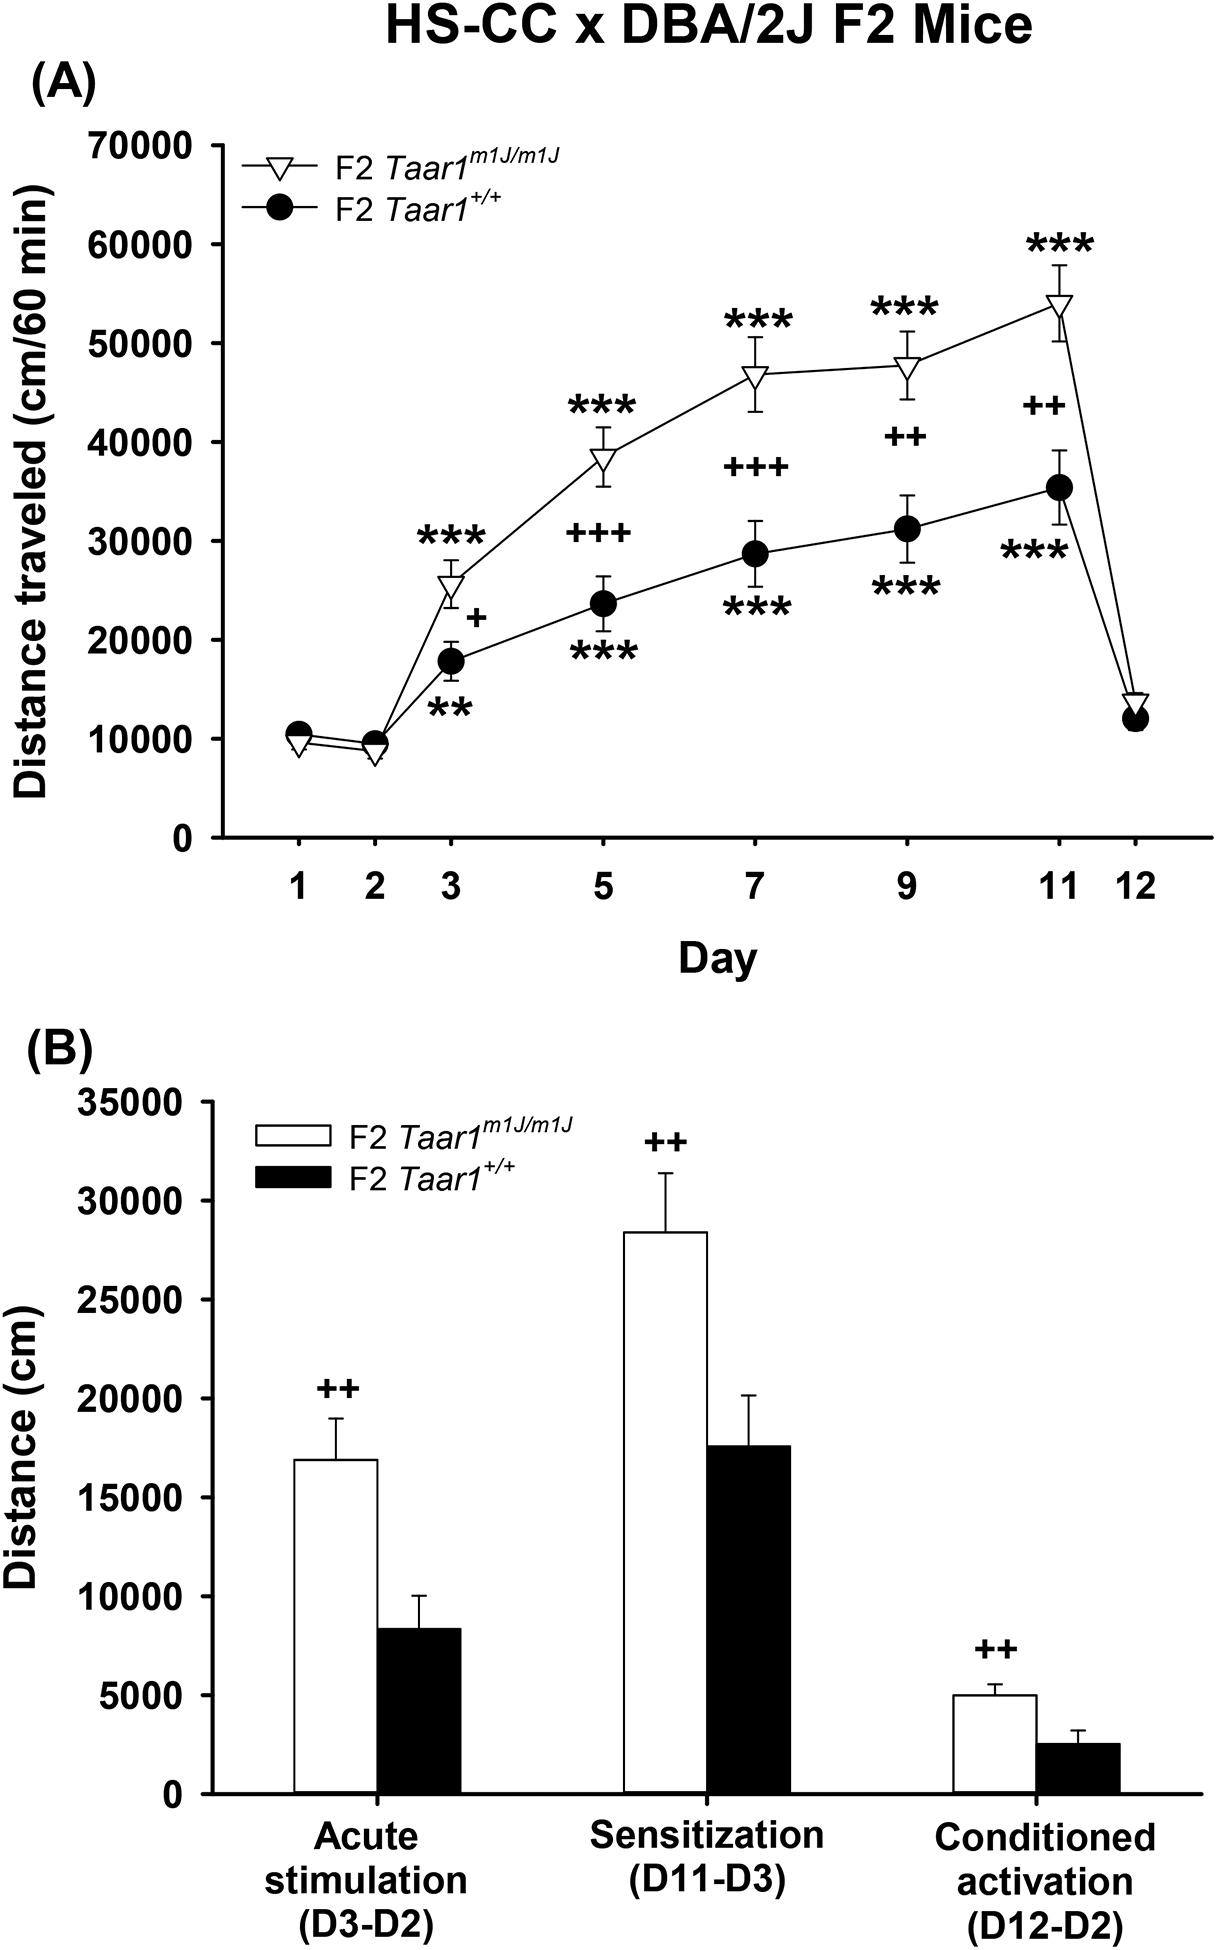
HS-CC × DBA/2J F2 mice possessing the Taar1m1J/m1J genotype exhibit higher levels of MA-induced stimulation, sensitization and conditioned activation, compared to those with the Taar1+/+ genotype. Shown in a) are means ± SEM for distance traveled (cm/60 min) on each test day after treatment with saline (days 1, 2 and 12) or 1 mg/kg MA (days 3, 5, 7, 9 and 11). Shown in b) are means ± SEM for scores derived by subtraction of baseline day 2 for acute MA response from day 3 for acute stimulation (D3-D2); initial MA response on day 2 subtracted from final MA response on day 11 for sensitization (D11-D3), and habituated baseline on day 2 subtracted from activity after saline treatment on day 12, following 5 MA exposures in the apparatus, for the conditioned activation measure (D12-D2). n=7–9/sex/genotype. **p<.01, ***p<.001 for the difference from days 1, 2 and 12; +p<.05, ++p<.01, +++p<.001 for the effect of genotype.
MA-induced locomotor stimulation, sensitization and conditioned activation in MAH, MAL and MAC mice
The same locomotor behaviors were examined in generations S1-S4 of the 3 selected lines. Relative line differences were not consistent across generation and did not show a consistent pattern of change with increasing generation. Two types of analyses were performed. For each independent study (each generation), a repeated measures sex × line × day ANOVA was performed, as described for the F2 mice. The full time courses and statistical results across day are presented in Supplementary Information Figure S2. To examine changes across generation, the acute stimulation, sensitization and conditioned activation measures, were examined by sex × line × generation ANOVAs; these data are shown in Figure 6 and described here.
Figure 6.

MA-induced acute stimulation, sensitization and conditioned activation in MAC, MAL and MAH mice across generations. Shown are means ± SEM for a) acute stimulation (D3-D2), b) sensitization (D11-D3) and c) conditioned activation (D12-D2) across generations. Generations labeled S1-S4 are for MAL and MAH mice; these are non-selected generations G1-G4 for MAC mice. n= 10–21/sex/line. +p<.05, ++p<.01, +++p<.001 for the effect of line, irrespective of generation (there was no significant line × generation interaction for any trait).
The sex x× line × generation ANOVA for MA-induced acute stimulation (Figure 6a), detected a significant sex × generation interaction (F3,349=3.34, p=.02), associated with greater stimulation in males than in females only in generation S3 (p<.01). There was also a main effect of line (F2,349=10.34, p<.001), but the line difference was not dependent upon generation, indicating that this trait did not mirror changes in MA intake across generations. Overall, the MAC line was less acutely stimulated by MA than the MAH (p=.02) or MAL (p<.001) line; the MAL and MAH lines did not significantly differ. Data are shown in Figure 6a collapsed on sex, since sex effects were not line-dependent.
For MA-induced sensitization (Figure 6b) and conditioned activation (Figure 6c), the sex × line × generation ANOVAs identified only a significant main effect of line (F2,349=6.28, p=.002 and F2,349=5.52, p=.004, respectively), with overall greater sensitization in the MAL, compared to the MAH (p=.02) and MAC (p<.001) lines, and reduced conditioned activation in the MAC line, compared to the MAH (p=.03) and MAL (p=.005) lines.
MA-induced change in body temperature in MAH, MAL and MAC mice
Mice from the S2 and S5 generations were tested to examine potential generation-dependent line differences in thermal response to MA. Outcomes were similar for the 2 generations, and the results reflected greater sensitivity of mice with the Taar1+/+ genotype to the hypothermic effect of MA, and no impact of selective breeding for high vs. low MA intake on the thermal response to MA.
Data for each selection generation (S2 and S5) were analyzed separately by repeated measures sex × line × dose (0 or 2 mg/kg MA) × time ANOVAs. For the S2 mice (Figure 7a,b), there were significant line × dose × time (F10,540=12.5, p<.001) and sex × dose × time (F5,540=5.9, p<.001) interactions. Sex did not play a role in line differences in sensitivity to MA effects on body temperature. Therefore, we focused our attention on the line differences in response to treatment across time. For both mice treated with saline (Figure 7a) and MA (Figure 7b), there was a significant line × time interaction (F10,285=3.8, p<.001 and F10,285=12.5, p<.001, respectively). There were no differences among the mouse lines for body temperature after saline at T0-T90. At T120 and T180 the saline-treated MAH line had significantly higher body temperatures than the saline-treated MAL or MAC lines. There was a significant effect of time within each line (ps<.001). When compared to baseline body temperature (T0), the MAC and MAL lines had a significantly lower mean body temperature at T90-T180, and the MAH line had a lower body temperature at T180. For mice treated with MA, there was no effect of line at T0; however, from T30 through T120, the effect of line was significant (ps<.01), with MAC mice having lower mean body temperatures than MAH or MAL mice at each time point. There was a significant effect of time within each line (ps<.001). Compared to baseline body temperature (T0), the MAC line exhibited significant hypothermia at T30-T90, while the MAH and MAL lines displayed similar degrees of hyperthermia at T30-T120.
Figure 7.

The MAC line, but not the MAH or MAL line, is sensitive to the hypothermic effect of MA. Shown are means ± SEM for core body temperature (°C) after a) saline or b) 2 mg/kg MA administration in S2 generation mice and c) saline or d) 2 mg/kg MA administration in S5 generation mice. n= 10/sex/line/dose. Hatch mark (#) significance symbol colors are matched to line to indicate mean differences, with pink=MAC, blue=MAL, and black=MAH. #p<.05, ##p<.01, ###p<.001 for difference from baseline (T0) for the line indicated by symbol color; +p<.05, ++p<.01, +++p<.001 for the difference between one line and the other 2 lines, except for T0 in d, where MAC differed from MAL.
Results were similar for the S5 mice. There were significant line × dose × time (F10,540=9.8, p<.001), and sex × dose × time (F5,540=6.5, p<.001) interactions. Again, sex did not interact with line. For mice treated with saline (Figure 7c) and mice treated with MA (Figure 7d), there was a significant line × time interaction (F10,285=2.5, p=.007 and F10,285=11.7, p<.001, respectively). For the saline-treated mice, the lines differed only at T0 (p=.02), when the MAC line had significantly higher mean body temperature than the MAH or MAL lines. There was a significant effect of time within each line (ps<.001). Compared to baseline body temperature (T0), the MAC line had significantly lower mean body temperatures at T60-T180, and the MAL and MAH lines had a lower body temperature at T180. For MA-treated mice, there was a significant effect of line at T0-T90. At T0, the MAC line had a significantly higher mean body temperature than the MAL line, and at T30-T90 the MAC line had significantly lower body temperatures than both the MAH and MAL lines. Compared to baseline body temperature (T0), the MAC line displayed significant hypothermia at T30-T90, with significant hyperthermia in the MAH and MAL lines at T60-T120 and T30-T120, respectively.
Two-bottle choice novel tastant MA drinking in MAH, MAL and MAC mice
Mice from the S3 (Figure 8) and S5 (Figure 9) generations were tested for SACC and QUIN consumption to examine potential correspondence with changes in MA consumption across selection. General outcomes were that MAH mice consumed more SACC than MAL and MAC, but the lines did not consistently differ or exhibit increasing differences in QUIN intake across selection generation.
Figure 8.
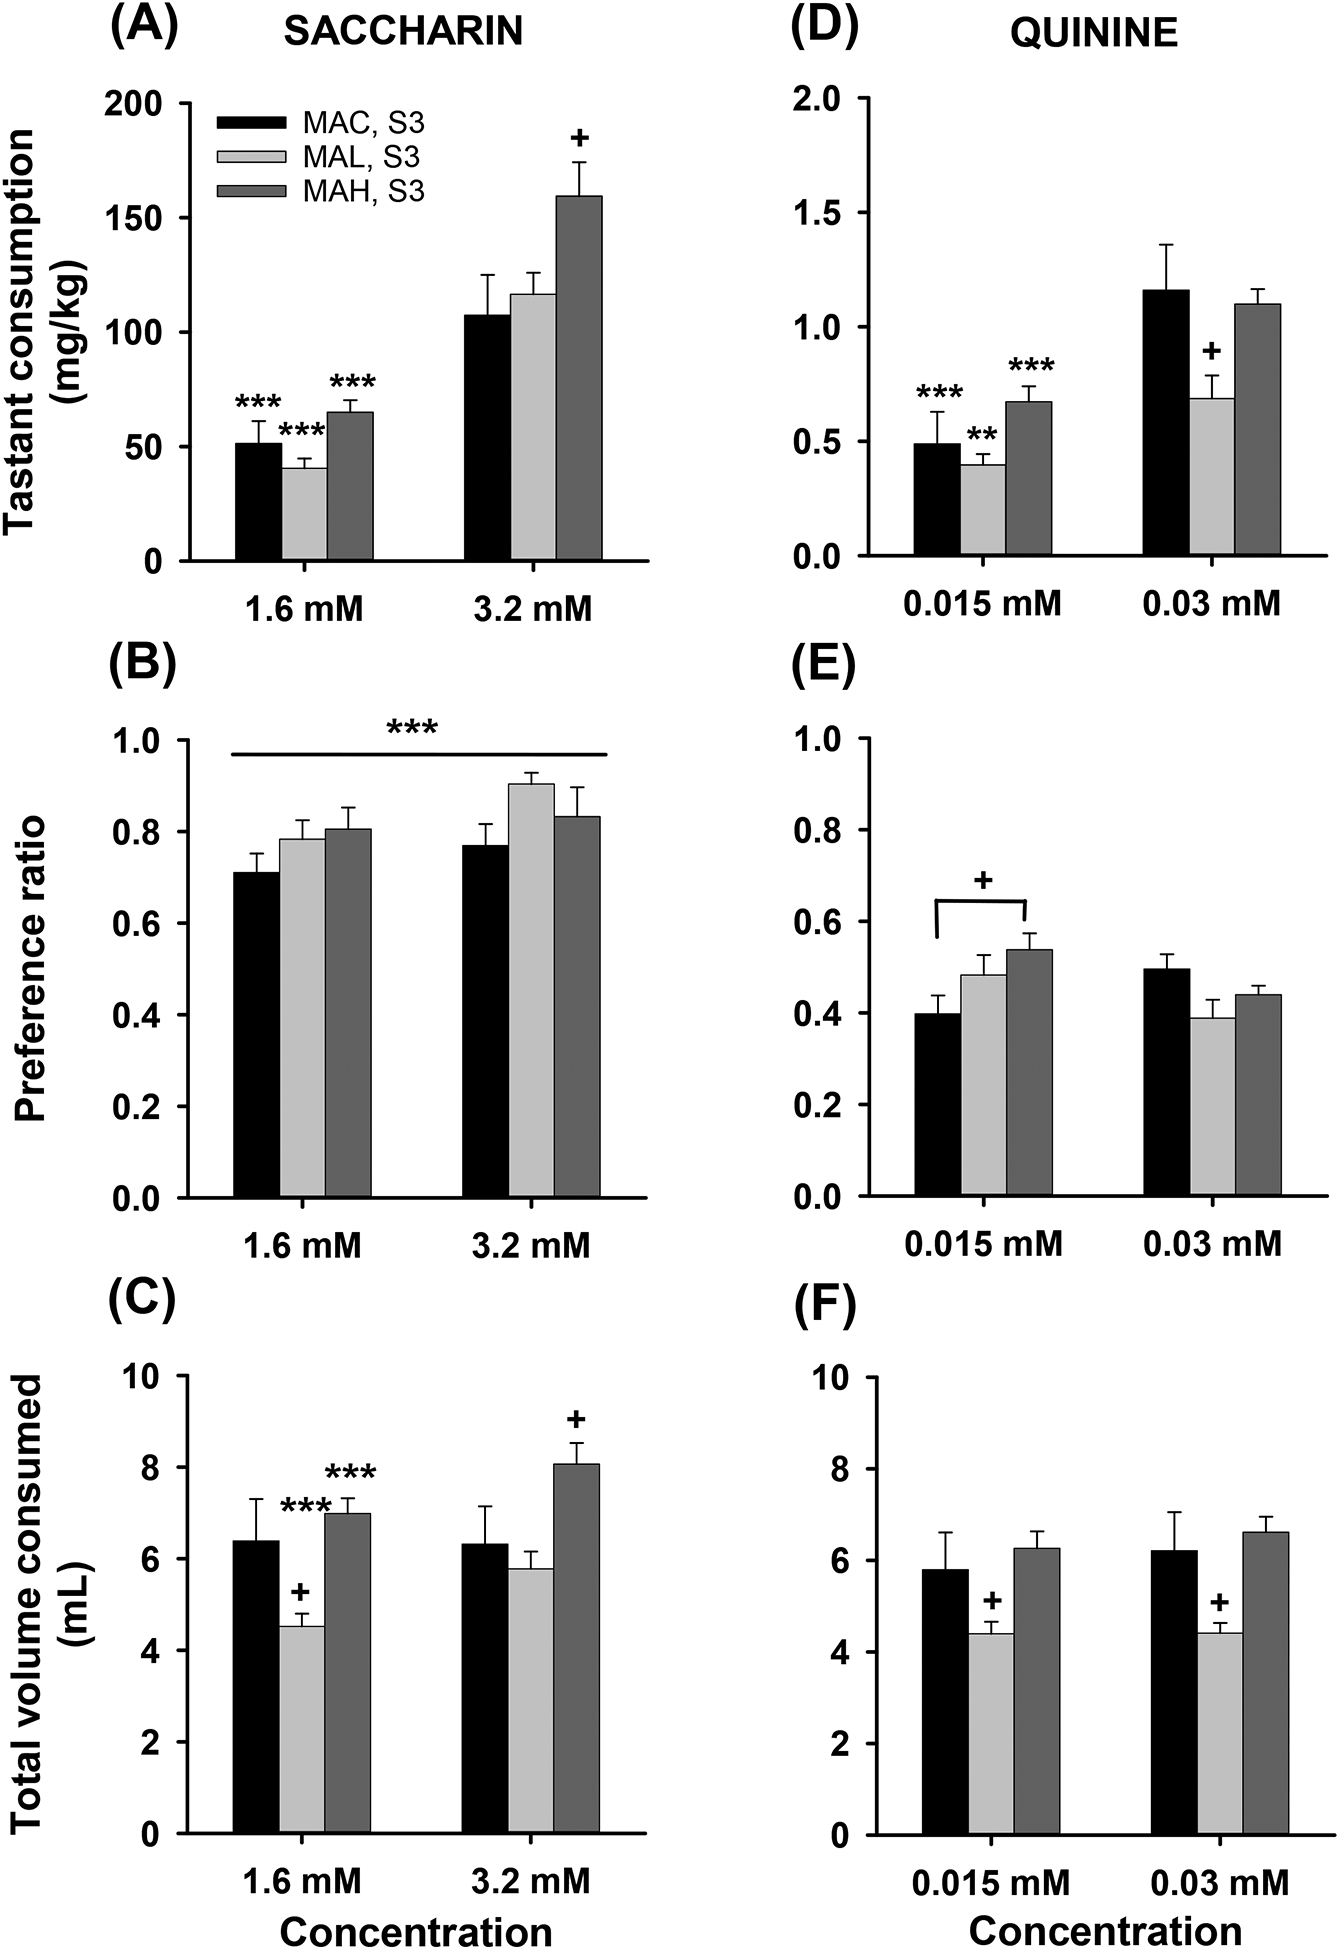
Tastant consumption in S3 MAH, MAL and MAC mice. Means ± SEM for a) saccharin intake (mg/kg), b) saccharin preference ratio, c) total volume (ml) consumed for each saccharin concentration (1.6 and 3.2 mM) offered, d) quinine intake (mg/kg), e) quinine preference ratio, and f) total volume (ml) consumed for each quinine concentration (0.0015 and 0.03 mM) offered. n=10/sex/line. **p<.01, ***p<.001 for the effect of concentration; +p<.05 for the difference between one line and the other two lines or the 2 indicated lines in e.
Figure 9.
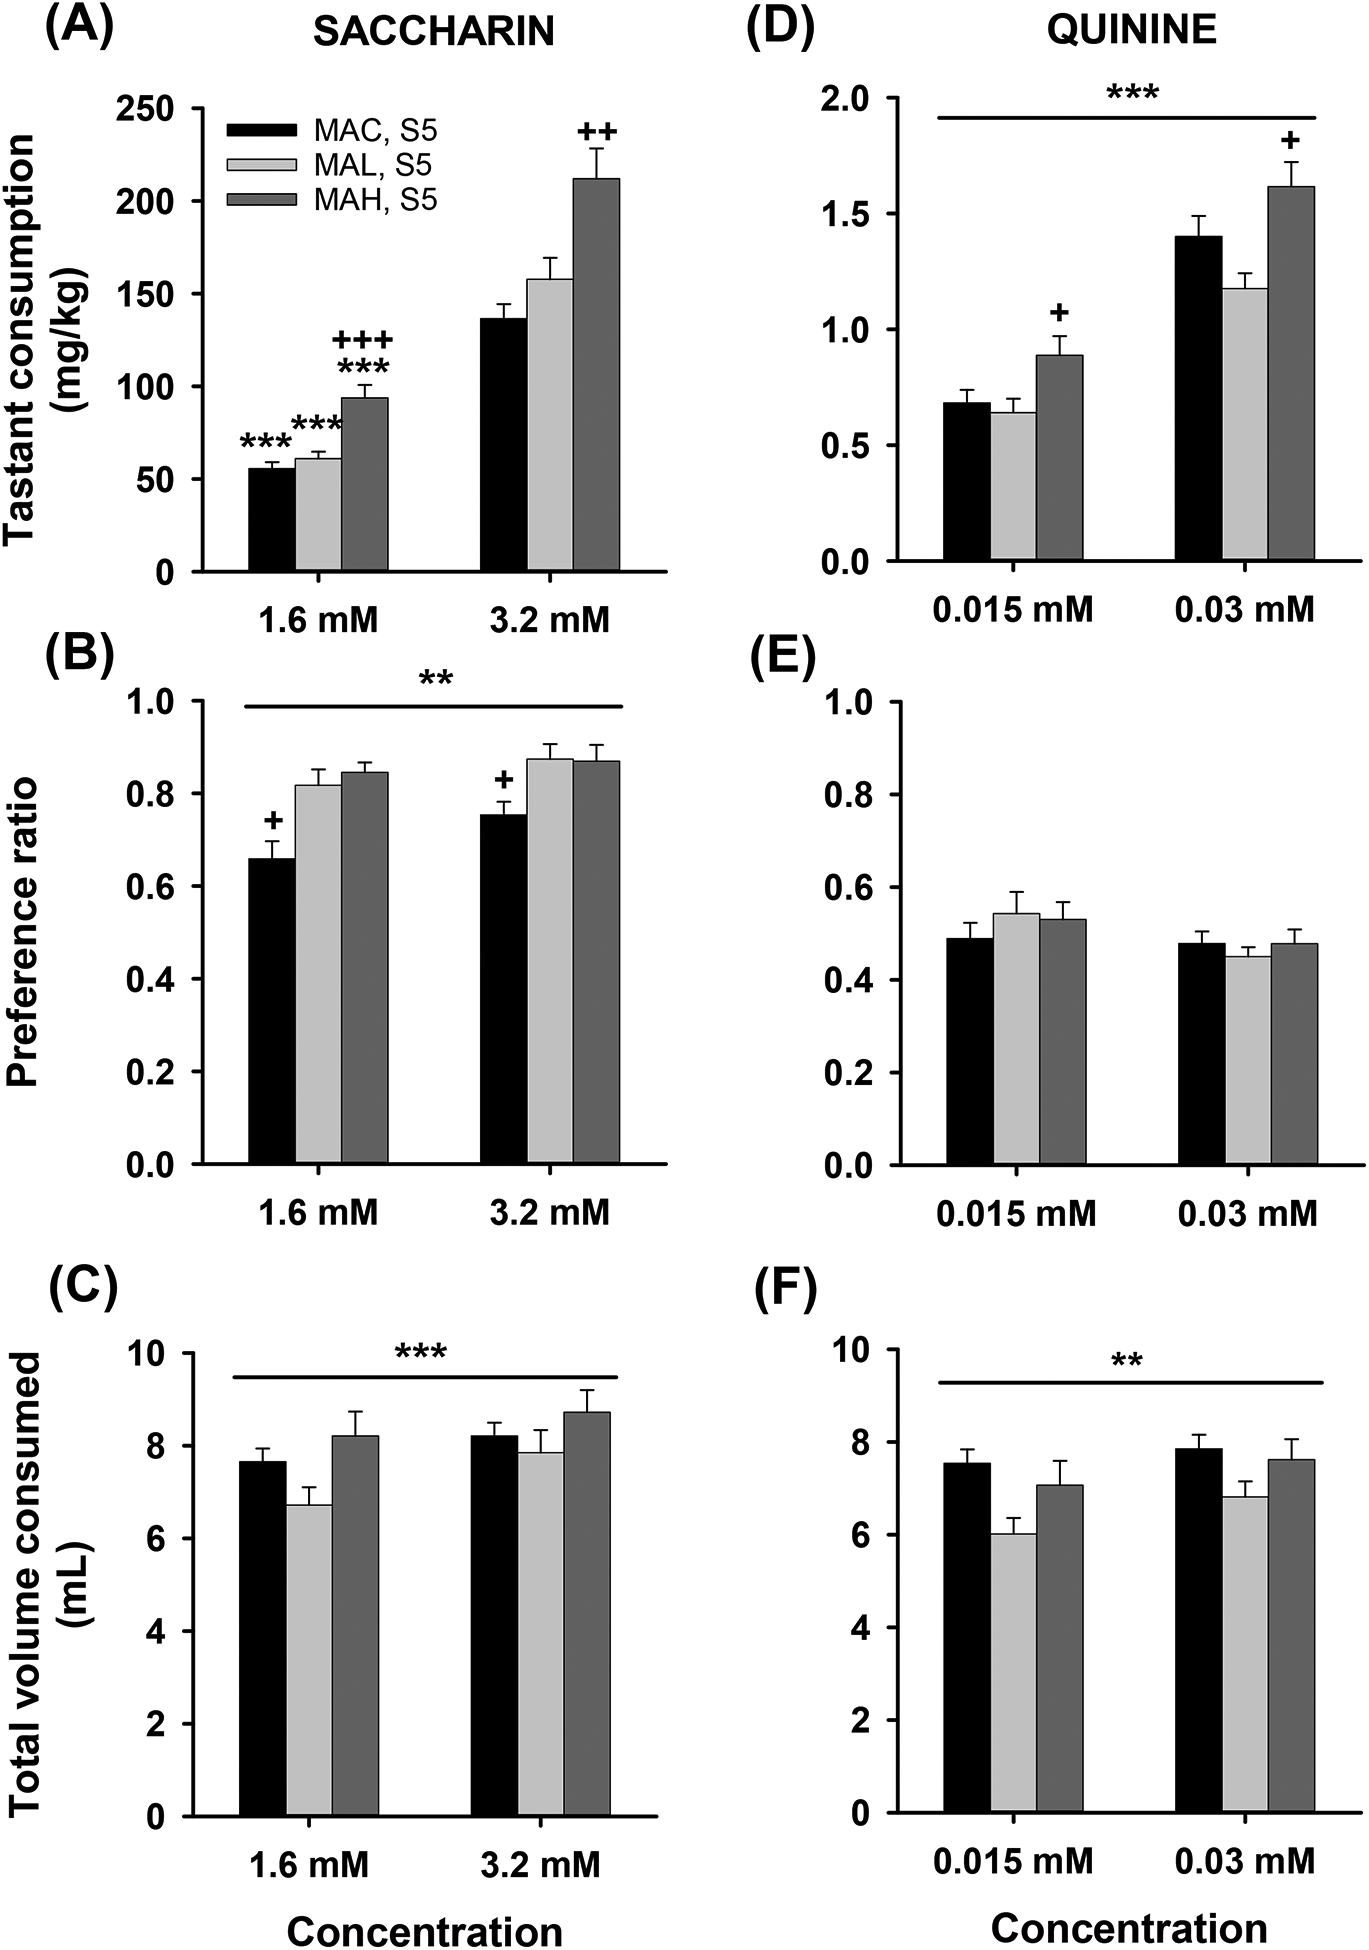
Tastant consumption in S5 MAH, MAL and MAC mice. Means ± SEM for a) saccharin intake (mg/kg), b) saccharin preference ratio, c) total volume (ml) consumed for each saccharin concentration (1.6 and 3.2 mM) offered, d) quinine intake (mg/kg), e) quinine preference ratio, and f) total volume (ml) consumed for each quinine concentration (0.0015 and 0.03 mM) offered. n=10/sex/line. **p<.01, ***p<.001 for the effect of concentration; +p<.05, ++p<.01, +++p<.001 for the difference between one line and the other two lines.
Saccharin and quinine consumption in S3 MAH, MAL and MAC mice
For the S3 generation, a repeated measures sex × line × concentration ANOVA for SACC consumed detected a significant line × concentration interaction (F2,54=5.18, p=.009), but no significant effects of sex (Figure 8a). There was a significant difference among the lines for the higher concentration (F2,57=3.71, p=.03, respectively), with the MAH line consuming more SACC than both the MAL and MAC lines. All lines exhibited concentration-dependent increases in SACC consumption. For SACC preference ratio (Figure 8b), there was a significant effect of SACC concentration (F1,54=13.91, p<.001), with a greater preference for the higher concentration, but there were no significant sex or line effects. For total volume consumed (Figure 8c), there was a significant line × concentration interaction (F2,54=12.0, p<.001), but no significant effects of sex. For each concentration of SACC, there was a significant effect of line (F2,57=4.8, p=.012 and F2,57=4.16, p=.021, respectively), but the patterns of line differences varied. For the 1.6 mM concentration, both the MAH and MAC consumed more total fluid than the MAL line, but for the 3.2 mM concentration, the MAH line consumed more total fluid than the MAL and MAC lines. Total volume increased with increasing concentration in the MAH and MAL, but not MAC, lines.
The same S3 mice were evaluated for QUIN drinking in our counterbalanced design. For QUIN consumption (Figure 8d), there was a significant sex × line × concentration interaction (F2,54=4.24, p=.019). Data were examined within each concentration. For the 0.015 mM QUIN concentration, there were no significant results. For the 0.3 mM concentration, there were significant main effects of sex (F1,54=4.30, p=.043) and line (F2,54=3.97, p=.025), but no interaction. Females consumed about 0.3 mg/kg (37%) more QUIN than males. Because there were no interactions of sex with line for either concentration, data were further considered for the effects of line and concentration collapsed on sex. There was a significant line × concentration interaction (F2,57=5.25, p=.008), with significant line differences only for the higher QUIN concentration (F2,57=3.66, p=.032). MAL mice consumed less QUIN than MAH and MAC mice. Mice of each line consumed higher doses of QUIN from the higher QUIN concentration solution.
For QUIN preference ratio (Figure 8e), there was a significant sex × line × concentration interaction (F2,54=4.28, p=.019). For the analysis of sex and line effects at the 0.015 mM QUIN concentration, there was only a significant effect of line (F2,54=3.28, p=.045). For the 0.03 mM concentration there were no significant effects of sex or line. Due to the absence of a sex × line interaction for either concentration, data were further considered for the effects of line and concentration collapsed on sex. There was a significant line × concentration interaction (F2,57=6.52, p=.0028). There were no line differences for the higher concentration, but for the lower QUIN concentration, MAC mice had a lower preference ratio than MAH mice.
For total volume consumed (Figure 8f), there was a significant main effect of line (F2,54=4.22, p=.020), but no effects of sex or concentration. Overall, the MAL line consumed less total fluid than the MAH and MAC lines.
Saccharin and quinine consumption in S5 MAH, MAL and MAC mice
For the S5 generation, a repeated measures sex × line × concentration ANOVA for SACC consumption detected a significant line × concentration interaction (F2,53=3.28, p=.046), but no significant effects of sex (Figure 9a). There was a significant effect of line for each SACC concentration (F2,56=17.37, p<.001 and F2,56=10.02, p<.001, respectively), with the MAH line consuming more than the MAL and MAC lines at both concentrations. All lines exhibited concentration-dependent increases in SACC consumption. For SACC preference ratio (Figure 9b), there were significant effects of line (F2,53=9.45, p<.001) and concentration (F1,53=8.70, p=.005), but no interactions. The MAH and MAL lines exhibited greater SACC preference than the MAC line, regardless of concentration, and the preference ratio was larger for the higher SACC concentration. For total volume consumed (Figure 9c), there was a significant effect of concentration (F1,53=12.60, p<.001) only. Total volume consumed was greater when the higher SACC concentration was offered.
When the same S5 mice were evaluated for QUIN consumption (Figure 9d), there were significant effects of line (F2,53=6.58, p=.003) and concentration (F1,53=184.88, p<.001). The MAH line consumed more QUIN than the MAL or MAC line, and QUIN intake increased with increasing QUIN concentration. For QUIN preference ratio (Figure 9e), there were no significant findings. For total volume consumed (Figure 9f), there was only a significant main effect of concentration (F1,53=8.58, p=.005), with increased total volume when the higher QUIN concentration solution was offered.
DISCUSSION
We found that the genetically diverse HS-CC mice voluntarily consume little MA. All 8 strains used to generate the HS-CC mice possess the Taar1+/+ genotype;25 thus all HS-CC mice are Taar1+/+, the Taar1 genotype associated with low levels of MA intake in multiple genetic models.18–20 The low MA intake of virtually every HS-CC mouse suggests that other genes or genetic variants in this diverse population were not able to oppose the effect of Taar1+ to elevate MA intake. Based on a comparison of the D2 and B6, the region around Taar1 on chromosome 10 is SNP poor and the Taar1m1J SNP is the only missense variant in over 7 Mb of the surrounding region.25 Crossing the HS-CC mice with the D2 strain, the only mouse strain known to possess the mutant Taar1m1J allele,25 resulted in higher levels of MA intake, specifically in mice of the Taar1m1J/m1J genotype. These data suggest that Taar1 genotype impacts MA intake in a highly genetically diverse population. Similar to the residual variation found in MAHDR mice, Taar1m1J/m1J mice of the HS-CC × D2 F2 cross exhibit considerable variation in MA intake. Selective breeding from Taar1m1J/m1J HS-CC × D2 F2 individuals differentiated them into the higher and lower MA consuming MAH and MAL lines. These data reveal the presence of modifiers of risk for MA intake. Behavioral assays performed in these lines and the Taar1+/+ MAC line also support Taar1 genotype effects on MA intake, and sensitivity to stimulant, sensitizing, conditioned activating and hypothermic effects of MA, without consistent effects on the consumption of or preference for a sweet or bitter tastant. Selective breeding for higher and lower MA consumption from Taar1m1J/m1J individuals did not alter thermal response to MA, but had impacts on stimulant responses and on SACC consumption. Thus, genes that contribute to locomotor responses to MA and avidity for a natural reward may have been altered by selective breeding.
The majority of the selection response in the MADR lines occurred in the first generation of selection, and genotyping of archived samples indicated fixation of the Taar1m1J allele in MAHDR mice of each replicate selection in the first generation.19 Furthermore, the phenotypic correlation of Taar1 genotype with MA intake during 2-bottle choice for water vs. 40 mg MA/l ranged from r=0.81 to 0.96 across multiple genetic models, including the MADR lines, all possessing alleles only from the D2 and B6 inbred strains.19 Thus, Taar1 genotype accounted for 66 to 92% of the variance in MA intake in these mice. In the current HS-CC × D2 F2 mice, the correlation was 0.64 and in the generations of selection in which the MAC lines were tested for MA intake alongside the MAH and MAL lines, the correlations were 0.67 and 0.61. Therefore, Taar1 genotype accounted for 37 – 45% of the phenotypic variance in this population. This suggests that additional genes important for MA intake are present in the genetically diverse HS-CC population, so that Taar1 has an important role, but not as exclusive a role as in the D2/B6 populations. A future direction of ours is to perform QTL and gene expression analyses (e.g., from RNA-Seq data), comparing the Taar1+/+ MAC line to the Taar1m1J/m1J MAL and MAH lines, to identify other important genes and gene variants.
To investigate potential genetic modifiers of the impact of the Taar1m1J/m1J genotype effect on MA intake, we created the MAH and MAL lines. The selection was successful and the realized heritability of 0.165 indicates that about 17% of the variability in MA intake between the MAH and MAL lines is associated with genetic differences. This is in contrast with the heritability for the MADR selection of 0.34 to 0.38 across replicate lines.14,16,17 However, for the MADR lines, Taar1 allele varied and accounted for 60% of the genetic variance.10 The expectation for the current lines was reduced heritability, because all individuals in this population shared the same Taar1 genotype. The divergent lines provide the tool for a genome-wide search for modifiers using QTL and expression tools to compare MAH and MAL mice.
Selected rodent lines have been created for a number of addiction-related traits and used not only for genetic and genomic investigations, but also to identify clusters of traits that are pleiotropically influenced by genes that impact the selection trait.39–44 Such data provide information about common genetic risk factors across traits. We initiated such studies in the MAH and MAL lines by examining several traits that we knew to be impacted by Taar1 and some that we predicted could be impacted by the residual variation found among Taar1m1J/m1J individuals. By including the MAC mice in these studies, we verified the previously identified role for Taar1 in MA-induced stimulation and hypothermia.18–20,31,33 We found no impact of selective breeding from the Taar1m1J/m1J individuals on the thermal response to MA, but did observe an effect on acute stimulation that was not sustained across selection generations. An effect on magnitude of MA-induced sensitization was sustained, with the MAL mice exhibiting greater magnitude. These data suggest that genes related to the residual variation in MA intake among mice with the high risk Taar1m1J/m1J genotype play a role in this neuroadaptive response to MA, and that more extreme levels of MA-induced sensitization are associated with less MA intake. A similar relationship was found in lines of mice bred for MA-induced stimulant response, which displayed greater MA-induced sensitization and less MA intake.32 There was no difference between the MAH and MAL lines in conditioned activation.
It is possible that extreme sensitivity to MA-induced locomotor sensitization is aversive, akin to psychotic symptoms experienced in some individuals with high levels of MA use, and this leads to an aversion for MA-containing solutions. Alternatively, the line more susceptible to sensitization may experience reward at lower doses of MA, resulting in reduced intake. One way to examine this would be to examine MA reward using a conditioned place preference procedure across multiple MA doses, a study we have planned. If this hypothesis is correct, mice of the MAL line would be predicted to display place preference at lower MA doses. Mice lacking TAAR1 function, including Taar1m1J/m1J and Taar1 knockout mice, are insensitive to aversive effects of MA, compared to those with functional TAAR1.17,18,45 The absence of aversion likely tips the hedonic scale toward MA reward and preference, as seen in the MAHDR mice16,17 and the MAH and MAL mice, relative to MAC mice. As a consequence of their Taar1m1J/m1J genotype, the MAH and MAL lines both express non-functional TAAR1,18 and are likely to be insensitive to aversive effects of MA, as they are to hypothermic effects, which are mediated by TAAR1, and may play a role in aversion.18,33 In the absence of aversion, selective breeding may have impacted non-TAAR1-related mechanisms underlying MA reward that are associated with the residual variation in MA intake. Some data indicate that susceptibility to MA-induced sensitization predicts greater MA self-administration,46 and it is not surprising that dopamine function has been implicated in both traits. For example, data in rats indicate that susceptibility to amphetamine-induced locomotor sensitization is associated with higher basal dopamine levels,47 increased nucleus accumbens dopamine and reduced ventral tegmental area dopamine.48 On the other hand, our MAHDR mice exhibit blunted basal dopamine levels in the nucleus accumbens and medial prefrontal cortex,49 but greater MA-induced sensitization at higher doses of MA.16 Furthermore, Gatica et al.50 found that firing patterns in dorsolateral striatal neurons reflecting hyperfunction were associated with individual susceptibility to amphetamine-induced sensitization. The potential impact of constitutive absence of functional TAAR1 in these relationships is not known.
Our previously selected MADR lines did not differ in the consumption of QUIN or SACC solutions,16,17 suggesting that selection for differential MA intake was not associated with bitter or sweet taste sensitivity or intake of a natural reward. In the current studies, S3 MAL line mice consumed less QUIN than MAC and MAH mice, but this difference was not found when reexamined in the S5 generation. A more consistent outcome was obtained for SACC, with selective breeding for higher levels of MA intake corresponding with higher SACC intake in both S3 and S5 generation mice, suggesting that a higher sweet intake may be associated with higher MA intake. Selective breeding of rats for high and low SACC intake predicted higher levels of self-administration of cocaine, alcohol and heroin,51 and self-administration of amphetamine predicted individual differences in sucrose intake in rats.52 Human addiction to a number of drugs, including alcohol, cocaine, nicotine, opioids and amphetamines, is associated with preference for higher sweet concentrations.53–56 Addictive drugs and natural rewards, such as sweet substances, share many neurobiological effects.57,58 Furthermore, naloxone, the opioid receptor antagonist, which as well as the longer acting antagonist naltrexone, has been found to reduce alcohol intake59,60 and also reduced intake, seeking and incubated craving for sucrose in rats.61,62 However, some rodent studies have not confirmed a relationship between drug and sweet intake, for example, for cocaine,63,64 alcohol,65,66 and methamphetamine.16,17 Our data suggest that when Taar1 variation is the major driver of differences in MA intake, as in the MADR lines, natural reward mechanisms may be of reduced importance compared to when non-Taar1 mechanisms are important, as in the MAH and MAL lines.
Although we observed few sex differences in our previous studies of the traits examined here,19 we recognize the importance of screening for sex differences and used males and females in all of the current studies. We found some sex differences, but they rarely interacted with genotype or line. Thus, in the selection study, females consumed more MA than males in some but not all generations, and males consumed more fluid than females. A sex difference for MA-induced stimulation was specific to a single generation of the selected lines and was not line-dependent. Similarly, for the pattern of locomotor responses across days, a sex effect that involved line occurred only in the S3 generation. For QUIN intake, there was a 3-way interaction of sex, lines and concentration, but when data were examined at each concentration, only a main effect of sex with females consuming more QUIN than males was found. Overall, genotype-dependent responses to the MA traits examined here were not sex-dependent, and sex did not play a critical role in response to selection.
The elephant in the room for the current selection is total volume consumed. This trait diverged in concert with MA intake, during the time that the MA intake phenotype was being measured. By the end of selection of our previous MADR lines, a total volume difference of about 0.5 ml more fluid intake in MAHDR than MALDR mice emerged in 2,16,17 but not a third replicate selection.14 However, that volume differences was considerably smaller than in the current selection beginning from these naturally higher MA-consuming Taar1m1J/m1J mice, for which the total volume intake difference was about 2.5 ml by the end of selection. This raises the possibility that higher MA intake was driven by larger drinking volumes, rather than sensitivity to rewarding or other effects of MA. However, it should be noted that a total volume difference was found between the MAH and MAL lines when S3 mice were tested for SACC drinking, but not when S5 mice were tested. This suggests that the total volume difference may occur specifically when MA intake is also occurring. It is possible that the lines experience differences in thirst, due to consuming different doses of MA and perhaps due to dose-dependent behavioral activation. Others have found excessive, non-regulatory drinking, measured as schedule-induced polydipsia, to be increased by MA-sensitization,67 and associated with a higher propensity for amphetamine self-administration,68 something that we could explore in our models. That said, correlations between MA intake and volume consumed were found within each of the selected lines, even the low MA-consuming MAC line, indicating that tendency to consume higher total fluid volumes impacts total MA intake across a broad range of intake amounts.
Supplementary Material
ACKNOWLEDGEMENTS
We would like to thank Zhen Zhu for assistance with data collection. Funding for this project was provided by NIH/NIDA U01DA041579 (TJP), NIH/NIDA R01DA046081 (TJP), NIH/NIDA P50DA018165 (TJP), NIH/NIDA T32DA07262 (JRKM), Department of Veterans Affairs Merit Review Grant I01BX002106 (TJP), the VA Research Career Scientist Program (TJP), and NIH grant TL1TR002371 (AMS). The contents of this article do not represent the views of the US Department of Veterans Affairs or the United States Government. The authors declare no conflict of interest regarding the present research.
Footnotes
DATA AVAILABLITY STATEMENT
The data that support the findings of this study are available from the corresponding author upon reasonable request.
REFERENCES
- 1.NIDA. “Methamphetamine” National Institute on Drug Abuse, 16 Oct. 2019, https://www.drugabuse.gov/publications/research-reports/methamphetamine. Accessed 16 Dec. 2019NIDA. [Google Scholar]
- 2.World Drug Report 2019. (United Nations publication, Sales No. E.19.XL.8)
- 3.Bousman CA, Glatt SJ, Everall IP, Tsuang MT. Genetic association studies of methamphetamine use disorders: A systematic review and synthesis. Am J Med Genet. 2009;150B:1025–1049. [DOI] [PubMed] [Google Scholar]
- 4.Iamjan SA, Thanoi S, Watiktinkorn P, Nudmamud-Thanoi S, Reynolds GP. BDNF (Val66Met) genetic polymorphism is associated with vulnerability for methamphetamine dependence. Pharmacogenomics. 2015;16:1541–1545. [DOI] [PubMed] [Google Scholar]
- 5.Iamjan SA, Thanoi S, Watiktinkorn P, Reynolds GP, Nudmamud-Thanoi S. Genetic variation of GRIA3 gene is associated with vulnerability to methamphetamine dependence and its associated psychosis. J Psychopharmacol. 2018;32:309–315. [DOI] [PubMed] [Google Scholar]
- 6.Kobayashi H, Ujike H, Iwata N, et al. The adenosine A2A receptor is associated with methamphetamine dependence/psychosis in the Japanese population. Behav Brain Funct. 2010;6:50. [DOI] [PMC free article] [PubMed] [Google Scholar]
- 7.Sim MS, Hatim A, Reynolds GP, Mohamed Z. Association of a functional FAAH polymorphism with methamphetamine-induced symptoms and dependence in a Malaysian population. Pharmacogenomics. 2013;14:505–514. [DOI] [PubMed] [Google Scholar]
- 8.Veerasakul S, Watiktinkorn P, Thanoi S, Reynolds GP, Nudmamud-Thanoi S. Association of polymorphisms in GAD1 and GAD2 genes with methamphetamine dependence. Pharmacogenomics. 2017;18:17–22. [DOI] [PubMed] [Google Scholar]
- 9.Zhao Y, Peng S, Jiang H, Du J, Yu S, Zhao M. Variants in GABBR1 gene are associated with methamphetamine dependence and two years’ relapse after drug rehabilitation. J Neuroimmune Pharmacol. 2018;13:523–531. [DOI] [PubMed] [Google Scholar]
- 10.Belknap JK, McWeeney S, Reed C, et al. Genetic factors involved in risk for methamphetamine intake and sensitization. Mamm Genome. 2013;24:446–458. [DOI] [PMC free article] [PubMed] [Google Scholar]
- 11.Bell RL, Hauser S, Rodd ZA, et al. A genetic animal model of alcoholism for screening medications to treat addiction. Int Rev Neurobiol. 2016;126:179–261. [DOI] [PMC free article] [PubMed] [Google Scholar]
- 12.Ferguson LB, Zhang L, Kircher D, et al. Dissecting brain networks underlying alcohol binge drinking using a systems genomics approach. Mol Neurobiol. 2019;56:2791–2810. [DOI] [PMC free article] [PubMed] [Google Scholar]
- 13.Froehlich JC. Genetic factors in alcohol self-administration. Journal Clin Psychiatry. 1995;56 (Suppl 7):15–23. [PubMed] [Google Scholar]
- 14.Hitzemann R, Iancu OD, Reed C, Baba H, Lockwood DR, Phillips TJ. Regional analysis of the brain transcriptome in mice bred for high and low methamphetamine consumption. Brain Sci. 2019;9:155. [DOI] [PMC free article] [PubMed] [Google Scholar]
- 15.Phillips TJ, Shabani S. An animal model of differential genetic risk for methamphetamine intake. Front Neurosci. 2015;9:327. [DOI] [PMC free article] [PubMed] [Google Scholar]
- 16.Shabani S, McKinnon CS, Reed C, Cunningham CL, Phillips TJ. Sensitivity to rewarding or aversive effects of methamphetamine determines methamphetamine intake. Genes Brain Behav. 2011;10:625–636. [DOI] [PMC free article] [PubMed] [Google Scholar]
- 17.Wheeler JM, Reed C, Burkhart-Kasch S, et al. Genetically correlated effects of selective breeding for high and low methamphetamine consumption. Genes Brain Behav. 2009;8:758–771. [DOI] [PMC free article] [PubMed] [Google Scholar]
- 18.Harkness JH, Shi X, Janowsky A, Phillips TJ. Trace amine-associated receptor 1 regulation of methamphetamine intake and related traits. Neuropsychopharmacology. 2015;40:2175–2184. [DOI] [PMC free article] [PubMed] [Google Scholar]
- 19.Reed C, Baba H, Zhu Z, et al. A spontaneous mutation in Taar1 impacts methamphetamine-related traits exclusively in DBA/2 mice from a single vendor. Front Pharmacol. 2017;8:993. [DOI] [PMC free article] [PubMed] [Google Scholar]
- 20.Stafford AM, Reed C, Baba H, et al. Taar1 gene variants have a causal role in methamphetamine intake and response and interact with Oprm1. eLife. 2019;8:e46472. [DOI] [PMC free article] [PubMed] [Google Scholar]
- 21.Shabani S, Houlton SK, Hellmuth L, et al. A mouse model of binge-level methamphetamine use. Front Neurosci. 2016;10:496. [DOI] [PMC free article] [PubMed] [Google Scholar]
- 22.Bunzow JR, Sonders MS, Arttamangkul S, et al. Amphetamine, 3,4-methylenedioxymethamphetamine, lysergic acid diethylamide, and metabolites of the catecholamine neurotransmitters are agonists of a rat trace amine receptor. Mol Pharmacol. 2001;60:1181–1188. [DOI] [PubMed] [Google Scholar]
- 23.Wolinsky TD, Swanson CJ, Smith KE, et al. The Trace Amine 1 receptor knockout mouse: an animal model with relevance to schizophrenia. Genes Brain Behav. 2007;6:628–639. [DOI] [PubMed] [Google Scholar]
- 24.Underhill SM, Hullihen PD, Chen J, et al. Amphetamines signal through intracellular TAAR1 receptors coupled to Galpha13 and GalphaS in discrete subcellular domains. Mol Psychiatry. 2019. Epub ahead of print. [DOI] [PMC free article] [PubMed] [Google Scholar]
- 25.Shi X, Walter NA, Harkness JH, et al. Genetic polymorphisms affect mouse and human trace amine-associated receptor 1 function. PloS One. 2016;11:e0152581. [DOI] [PMC free article] [PubMed] [Google Scholar]
- 26.Falconer DS, Mackay TFC. Introduction to Quantitative Genetics. 4th edition. Essex, Longman Group Ltd; 1996 [Google Scholar]
- 27.Keane TM, Goodstadt L, Danecek P, et al. Mouse genomic variation and its effect on phenotypes and gene regulation. Nature. 2011;477:289–294. [DOI] [PMC free article] [PubMed] [Google Scholar]
- 28.Roberts A, Pardo-Manuel de Villena F, Wang W, McMillan L, Threadgill DW. The polymorphism architecture of mouse genetic resources elucidated using genome-wide resequencing data: implications for QTL discovery and systems genetics. Mamm Genome. 2007;18:473–481. [DOI] [PMC free article] [PubMed] [Google Scholar]
- 29.Mizoguchi H, Yamada K, Nabeshima T. Neuropsychotoxicity of abused drugs: involvement of matrix metalloproteinase-2 and −9 and tissue inhibitor of matrix metalloproteinase-2 in methamphetamine-induced behavioral sensitization and reward in rodents. J Pharmacol Sci. 2008;106:9–14. [DOI] [PubMed] [Google Scholar]
- 30.Steketee JD, Kalivas PW. Drug wanting: behavioral sensitization and relapse to drug-seeking behavior. Pharmacol Rev. 2011;63:348–365. [DOI] [PMC free article] [PubMed] [Google Scholar]
- 31.Lindemann L, Meyer CA, Jeanneau K, et al. Trace amine-associated receptor 1 modulated dopaminergic activity. J Pharmacol Exp Ther. 2008;324:948–956. [DOI] [PubMed] [Google Scholar]
- 32.Kamens HM, Burkhart-Kasch S, McKinnon CS, Li N, Reed C, Phillips TJ. Sensitivity to psychostimulants in mice bred for high and low stimulation to methamphetamine. Genes Brain, Behav. 2005;4:110–125. [DOI] [PubMed] [Google Scholar]
- 33.Miner NB, Elmore JS, Baumann MH, Phillips TJ, Janowsky A. trace amine-associated receptor 1 regulation of methamphetamine-induced neurotoxicity. Neurotoxicology. 2017;63:57–69. [DOI] [PMC free article] [PubMed] [Google Scholar]
- 34.Saul MC, Philip VM, Reinholdt LG, Chesler EJ. High-diversity mouse populations for complex traits. Trends Genet. 2019;35:501–514. [DOI] [PMC free article] [PubMed] [Google Scholar]
- 35.Shen GQ, Abdullah KG, Wang QK. The TaqMan method for SNP genotyping. Methods Mol Bio. 2009;578:293–306. [DOI] [PubMed] [Google Scholar]
- 36.Scibelli AC, McKinnon CS, Reed C, et al. Selective breeding for magnitude of methamphetamine-induced sensitization alters methamphetamine consumption. Psychopharmacology. 2011;214:791–804. [DOI] [PMC free article] [PubMed] [Google Scholar]
- 37.Crabbe JC, Kosobud A, Tam BR, Young ER, Deutsch CM. Genetic selection of mouse lines sensitive (cold) and resistant (hot) to acute ethanol hypothermia. Alcohol Drug Res. 1987;7:163–174. [PubMed] [Google Scholar]
- 38.Crabbe JC, Feller DJ, Dorow JS. Sensitivity and tolerance to ethanol-induced hypothermia in genetically selected mice. J Pharmacol Exp Ther. 1989;249:456–461. [PubMed] [Google Scholar]
- 39.Giorgi O, Piras G, Corda MG. The psychogenetically selected Roman high- and low-avoidance rat lines: a model to study the individual vulnerability to drug addiction. Neurosci Biobehav Rev. 2007;31:148–163. [DOI] [PubMed] [Google Scholar]
- 40.Gubner NR, Reed C, McKinnon CS, Phillips TJ. Unique genetic factors influence sensitivity to the rewarding and aversive effects of methamphetamine versus cocaine. Behav Brain Res. 2013;256:420–427. [DOI] [PMC free article] [PubMed] [Google Scholar]
- 41.Murphy JM, Stewart RB, Bell RL, et al. Phenotypic and genotypic characterization of the Indiana University rat lines selectively bred for high and low alcohol preference. Behav Genet. 2002;32:363–388. [DOI] [PubMed] [Google Scholar]
- 42.Oberlin B, Best C, Matson L, Henderson A, Grahame N. Derivation and characterization of replicate high- and low-alcohol preferring lines of mice and a high-drinking crossed HAP line. Behav Genet. 2011;41:288–302. [DOI] [PMC free article] [PubMed] [Google Scholar]
- 43.Perkel JK, Bentzley BS, Andrzejewski ME, Martinetti MP. Delay discounting for sucrose in alcohol-preferring and nonpreferring rats using a sipper tube within-sessions task. Alcohol Clin Exp Res. 2015;39:232–238. [DOI] [PMC free article] [PubMed] [Google Scholar]
- 44.Phillips TJ, Kamens HM, Wheeler JM. Behavioral genetic contributions to the study of addiction-related amphetamine effects. Neurosci Biobehav Rev. 2008;32:707–759. [DOI] [PMC free article] [PubMed] [Google Scholar]
- 45.Shabani S, McKinnon CS, Cunningham CL, Phillips TJ. Profound reduction in sensitivity to the aversive effects of methamphetamine in mice bred for high methamphetamine intake. Neuropharmacology. 2012;62:1134–1141. [DOI] [PMC free article] [PubMed] [Google Scholar]
- 46.Jodogne C, Marinelli M, Le Moal M, Piazza PV. Animals predisposed to develop amphetamine self-administration show higher susceptibility to develop contextual conditioning of both amphetamine-induced hyperlocomotion and sensitization. Brain Res. 1994;657:236–244. [DOI] [PubMed] [Google Scholar]
- 47.Azocar VH, Sepulveda G, Ruiz C, Aguilera C, Andres ME, Fuentealba JA. The blocking of kappa-opioid receptor reverses the changes in dorsolateral striatum dopamine dynamics during the amphetamine sensitization. J Neurochem. 2019;148:348–358. [DOI] [PubMed] [Google Scholar]
- 48.Scholl JL, Feng N, Watt MJ, Renner KJ, Forster GL. Individual differences in amphetamine sensitization, behavior and central monoamines. Physiol Behav. 2009;96:493–504. [DOI] [PMC free article] [PubMed] [Google Scholar]
- 49.Lominac KD, McKenna CL, Schwartz LM, et al. Mesocorticolimbic monoamine correlates of methamphetamine sensitization and motivation. Front Syst Neurosci. 2014;8:70. [DOI] [PMC free article] [PubMed] [Google Scholar]
- 50.Gatica RI, Aguilar-Rivera MI, Azocar VH, Fuentealba JA. Individual differences in amphetamine locomotor sensitization are accompanied with changes in dopamine release and firing pattern in the dorsolateral striatum of rats. Neuroscience. 2020;427:116–126. [DOI] [PubMed] [Google Scholar]
- 51.Carroll ME, Morgan AD, Anker JJ, Perry JL, Dess NK. Selective breeding for differential saccharin intake as an animal model of drug abuse. Behav Pharmacol. 2008;19:435–460. [DOI] [PubMed] [Google Scholar]
- 52.DeSousa NJ, Bush DE, Vaccarino FJ. Self-administration of intravenous amphetamine is predicted by individual differences in sucrose feeding in rats. Psychopharmacology. 2000;148:52–58. [DOI] [PubMed] [Google Scholar]
- 53.Kampov-Polevoy A, Garbutt JC, Janowsky D. Evidence of preference for a high-concentration sucrose solution in alcoholic men. Am J Psychiatry. 1997;154:269–270. [DOI] [PubMed] [Google Scholar]
- 54.Janowsky DS, Pucilowski O, Buyinza M. Preference for higher sucrose concentrations in cocaine abusing-dependent patients. J Psychiatr Res. 2003;37:35–41. [DOI] [PubMed] [Google Scholar]
- 55.Pomerleau CS, Garcia AW, Drewnowski A, Pomerleau OF. Sweet taste preference in women smokers: comparison with nonsmokers and effects of menstrual phase and nicotine abstinence. Pharmacol Biochem Behav. 1991;40:995–999. [DOI] [PubMed] [Google Scholar]
- 56.Weiss G. Food fantasies of incarcerated drug users. Int J Addict. 1982;17:905–912. [DOI] [PubMed] [Google Scholar]
- 57.Lemon CH, Brasser SM, Smith DV. Alcohol activates a sucrose-responsive gustatory neural pathway. J Neurophysiol. 2004;92:536–544. [DOI] [PubMed] [Google Scholar]
- 58.Volkow ND, Wise RA. How can drug addiction help us understand obesity? Nat Neurosci. 2005;8:555–560. [DOI] [PubMed] [Google Scholar]
- 59.Bilbao A, Robinson JE, Heilig M, et al. A pharmacogenetic determinant of mu-opioid receptor antagonist effects on alcohol reward and consumption: evidence from humanized mice. Biol Psychiatry. 2015;77:850–858. [DOI] [PubMed] [Google Scholar]
- 60.Gianoulakis C, de Waele JP, Thavundayil J. Implication of the endogenous opioid system in excessive ethanol consumption. Alcohol. 1996;13:19–23. [DOI] [PubMed] [Google Scholar]
- 61.Grimm JW, Manaois M, Osincup D, Wells B, Buse C. Naloxone attenuates incubated sucrose craving in rats. Psychopharmacology. 2007;194:537–544. [DOI] [PMC free article] [PubMed] [Google Scholar]
- 62.Henderson-Redmond A, Czachowski C. Effects of systemic opioid receptor ligands on ethanol- and sucrose seeking and drinking in alcohol-preferring (P) and Long Evans rats. Psychopharmacology. 2014;231:4309–4321. [DOI] [PMC free article] [PubMed] [Google Scholar]
- 63.Gahtan E, Labounty LP, Wyvell C, Carroll ME. The relationships among saccharin consumption, oral ethanol, and i.v. cocaine self-administration. Pharmacol Biochem Behav. 1996;53:919–925. [DOI] [PubMed] [Google Scholar]
- 64.Gosnell BA, Krahn DD, Yracheta JM, Harasha BJ. The relationship between intravenous cocaine self-administration and avidity for saccharin. Pharmacol Biochem Behav. 1998;60:229–236. [DOI] [PubMed] [Google Scholar]
- 65.Crabbe JC, Spence SE, Brown LL, Metten P. Alcohol preference drinking in a mouse line selectively bred for high drinking in the dark. Alcohol. 2011;45:427–440. [DOI] [PMC free article] [PubMed] [Google Scholar]
- 66.Phillips TJ, Crabbe JC, Metten P, Belknap JK. Localization of genes affecting alcohol drinking in mice. Alcohol Clin Exp Res. 1994;18:931–941. [DOI] [PubMed] [Google Scholar]
- 67.Hawken ER, Beninger RJ. The amphetamine sensitization model of schizophrenia symptoms and its effect on schedule-induced polydipsia in the rat. Psychopharmacology. 2014;231:2001–2008. [DOI] [PubMed] [Google Scholar]
- 68.Piazza PV, Mittleman G, Deminiere JM, Le Moal M, Simon H. Relationship between schedule-induced polydipsia and amphetamine intravenous self-administration. Individual differences and role of experience. Behav Brain Res. 1993;55:185–193. [DOI] [PubMed] [Google Scholar]
Associated Data
This section collects any data citations, data availability statements, or supplementary materials included in this article.