

Abstract
Endothelial cells (ECs) are an active component of the immune system and interact directly with inflammatory cytokines. While ECs are known to be polarized cells, the potential role of apicobasal polarity in response to inflammatory mediators has been scarcely studied. Acute inflammation is vital in maintaining healthy tissue in response to infection; however, chronic inflammation can lead to the production of systemic inflammatory cytokines and deregulated leukocyte trafficking, even in the absence of a local infection. Elevated levels of cytokines in circulation underlie the pathogenesis of sepsis, the leading cause of intensive care death. Because ECs constitute a key barrier between circulation (luminal interface) and tissue (abluminal interface), we hypothesize that ECs respond differentially to inflammatory challenge originating in the tissue versus circulation as in local and systemic inflammation, respectively. To begin this investigation, we stimulated ECs abluminally and luminally with the inflammatory cytokine tumor necrosis factor alpha (TNF-α) to mimic a key feature of local and systemic inflammation, respectively, in a microvascular mimetic (μSiM-MVM). Polarized IL-8 secretion and polymorphonuclear neutrophil (PMN) transmigration were quantified to characterize the EC response to luminal versus abluminal TNF-α. We observed that ECs uniformly secrete IL-8 in response to abluminal TNF-α and is followed by PMN transmigration. The response to abluminal treatment was coupled with the formation of ICAM-1-rich membrane ruffles on the apical surface of ECs. In contrast, luminally stimulated ECs secreted five times more IL-8 into the luminal compartment than the abluminal compartment and sequestered PMNs on the apical EC surface. Our results identify clear differences in the response of ECs to TNF-α originating from the abluminal versus luminal side of a monolayer for the first time and may provide novel insight into future inflammatory disease intervention strategies.
Keywords: tissue-chip, apicobasal polarity, sepsis, neutrophils, inflammation, endothelial cells
Insight Box
Aggressive inflammation is described as a maladaptive response to infection, leading to inappropriate tissue damage and increased morbidity. The transition from local to systemic inflammation is a hallmark of sepsis, the leading cause of intensive care deaths. In this work, we utilize a vascular mimetic to elucidate the distinguishing characteristics of remedial and maladaptive inflammation, with a focus on the role of the vascular endothelium. This approach enabled us to discover that endothelial cells respond differentially to tissue-side (local) versus circulation-side (systemic) cytokines and that this response can dictate the ensuing innate immune response. While anti-inflammatory therapies for the treatment of sepsis have all failed to date, this discovery may permit the development of novel pharmaceuticals with more refined immunosuppressive effects.
INTRODUCTION
Inflammation is the overarching process by which the body protects itself from infection or injury. As such, inflammation involves the coordination of numerous classes of leukocytes, host tissue cells and soluble inflammatory mediators to mount an immune response and restore homeostasis. In severe cases, inflammation can become pathogenic, manifesting as a maladaptive immune response that drives host-tissue damage. In these cases, inflammation often transitions from local (acute; cytokine production primarily in the tissue) to systemic (elevated serum cytokine content). One prominent example of this transition is that of sepsis, in which the host immune response to bacterial infection (acute phase) progresses beyond the remedial state, leading to elevated serum cytokines (systemic phase), deregulated leukocyte trafficking, multiorgan failure and, in many cases, death [1]. Following years of failed clinical trials for pharmaceuticals aimed at limiting maladaptive immunity, sepsis treatment is mainly confined to critical patient support and symptom management [2]. Furthering our understanding of the molecular mechanisms distinguishing the remedial immune response to local infection from the maladaptive immune response to systemic inflammatory cytokines/bacterial products may facilitate the development of novel anti-inflammatory therapies with narrowed and primarily beneficial immunosuppressive effects.
Vascular endothelial cells (ECs) provide an important link between the cardiovascular system and the immune system. In the context of infection, inflammatory cytokines and bacterial products modulate vascular barrier function by direct action on vascular ECs. In accordance, tumor necrosis factor alpha (TNF-α) [3], interleukin 1 beta (IL-1β) [4] and lipopolysaccharide [5] all induce dose-dependent increases in vascular permeability in vitro. Elevated vascular permeability dictates leukocyte transendothelial migration, permitting the resolution of an underlying infection. Furthermore, cytokine signaling alters EC expression and localization of intercellular adhesion molecule 1 (ICAM-1), interleukin 8 (IL-8) and platelet endothelial cell adhesion molecule 1 (PECAM-1), all of which participate in the leukocyte adhesion cascade [6]. While these phenomena permit immune regulation at the EC level, excessive EC stimulation in chronic inflammation may itself underly the development of maladaptive immunity. In line with this understanding, ECs are implicated in the pathogenesis of a number of inflammatory diseases, including sepsis [7], atherosclerosis [8] and the recent global pandemic coronavirus disease (COVID-19) [9].
While much has been learned about ECs in immunity, the consequence of EC apicobasal polarity (i.e. defined apical and basal surfaces) is largely unknown. Vascular ECs have been shown to display distinct apical (luminal or blood facing) and basal (abluminal or basement membrane facing) membranes both in vitro and in vivo [10, 11]. To facilitate apical membrane designation and proper lumen formation, stable β1 integrin binding precedes VE-cadherin interactions with cell polarity regulators, Pals1 and Par3 [12, 13]. In a study by Zovein and colleagues, endothelial β1 integrin deletion in mice resulted in a loss of cell polarity, noting the ubiquitous expression of cell–cell adhesion proteins: Claudin-5, PECAM-1, VE-cadherin and CD99 [14]. Recently, Mossu and colleagues demonstrated that EC apicobasal polarity has a direct influence on vascular barrier formation in an in vitro model of the blood–brain barrier (BBB), where abluminal stimulation with pericyte conditioned media decreased BBB permeability and luminal stimulation had little to no effect [15]. These data are intriguing because they demonstrate differential homeostatic endothelial function when stimulated luminally versus abluminally by the same factors. These results, together with the notion that ECs constitute a tight barrier between the tissue and circulation, motivate our hypothesis that ECs respond differentially to inflammatory cytokines originating in the tissue versus those originating in circulation as in local inflammation and systemic inflammation/sepsis, respectively.
In local inflammation, tissue-resident macrophages secrete inflammatory cytokines in the extravascular space in response to infection or injury which diffuse to the basal surface of ECs. In contrast, systemic inflammation is characterized by the presence of elevated cytokines in the circulation which engage the apical EC surface. Here, we model these two inflammatory scenarios by stimulating ECs luminally or abluminally with the pro-inflammatory cytokine, TNF-α. Polymorphonuclear neutrophils (PMNs) are considered the first responders of innate immune leukocytes, with broad implications in sepsis pathogenesis [16, 17]. ECs secrete the PMN chemoattractant IL-8 (CXCL8) and upregulate the adhesion molecule ICAM-1 in response to TNF-α signaling [18]. Thus, we specifically hypothesize that these EC responses, and the subsequent PMN migration dynamics, depend on the side of the EC layer first exposed to TNF-α. To test our hypotheses, we utilize a new platform from our lab: the silicon nanomembrane enabled microvascular mimetic (μSiM-MVM) [15, 19, 20]. Silicon nanomembranes uniquely provide both a highly permeable and optically transparent cell culture substrate [21], allowing us to access high-quality live cell and fluorescence microscopy on a barrier model without interference from the membrane used to create luminal and abluminal compartments [22]. By using human cells in the μSiM-MVM, we can then study the response of the vasculature to tissue-side versus blood-side stimulation with the reductionism afforded by an in vitro device.
Our results show that abluminal stimulation of ECs with TNF-α induces expression and subsequent secretion of IL-8 to the luminal and abluminal chambers of the μSiM-MVM and allows for PMN diapedesis across the EC monolayer. In contrast, luminal stimulation of ECs with TNF-α induces a highly polarized secretion of IL-8 to the luminal chamber of the μSiM-MVM, sequestering PMNs on the apical EC surface. Additionally, blocking antibodies targeting ICAM-1 significantly reduce PMN transmigration across abluminally stimulated ECs. Confocal analysis reveals a difference in ICAM-1 spatial organization on the surface of luminally versus abluminally stimulated ECs; pronounced ICAM-1-rich membrane ruffles are seen exclusively on the apical EC surface of abluminally stimulated ECs. These results generate a new hypothesis that morphological changes in ECs stimulated abluminally may have a role in facilitating PMN transmigration, which should be tested in future studies. Finally, by taking advantage of the live cell imaging made possible in the μSiM-MVM, we characterize the dynamics of PMN migration (cell speed and persistence) above and below the EC monolayer. PMN tracking revealed that apical motility parameters are not predictive of the ultimate cell transmigration fate. Additionally, we find distinct basal/perivascular migration characteristics of IL-8-stimluated and fMLP-stimulated PMNs, suggesting divergent immune responses to host versus pathogen-derived chemoattractants.
MATERIALS AND METHODS
μSiM-MVM fabrication
Microfluidic devices featuring ultrathin and highly permeable silicon membranes (μSiM) were fabricated as previously described [22, 23]. Briefly, 100- and 300-μm silicone gaskets (Trelleborg Sealing Solutions, Trelleborg, Sweden) and pressure sensitive adhesives (3M, Maplewood, MN) are cut to size and layered around a nanoporous silicon nitride membrane (SiMPore Inc., West Henrietta, NY) (Fig. 1A). Layers are irreversibly bonded following a UV-ozone exposure and thermal incubation. The ‘nanomembranes’ used in these experiments were 100-nm-thick nanoporous silicon nitride (NPN; ~60-nm pores; ~15% porous) [24]. A full schematic of the μSiM-MVM can be found in the online supplement (Supplementary Fig. S1).
Figure 1.
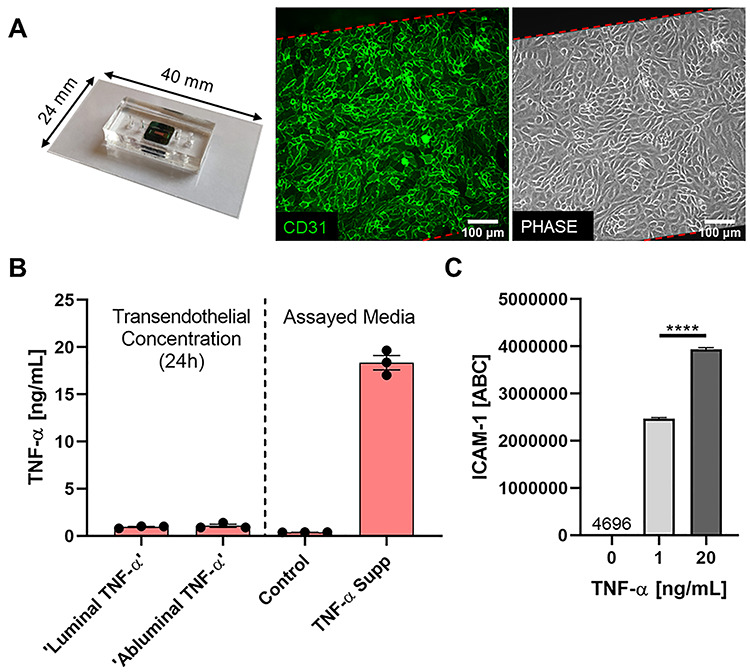
Modeling luminal versus abluminal inflammation in a microvascular mimetic. (A) Microfluidic, silicon membrane-enabled microvascular mimetics (μSiM-MVMs) were assembled and sterilized, and HUVECs were seeded at high density (40 000 cells/cm2). Epifluorescence (green: CD31, PECAM-1) and phase microscopy were utilized to characterize HUVECs in the μSiM-MVM unit and ensure confluency. (B) TNF-α transendothelial flux was quantified for assay development. TNF-α supplemented media (TNF-α Supp) and control media were added to their respective channels (e.g. ‘Luminal TNF-α’ group was loaded with TNF-α supplemented media luminally and control media abluminally) and devices were incubated for 24 h. Trans-compartment media was collected and TNF-α concentration was determined by ELISA. Control and TNF-α media (right) were assayed in parallel to ensure that proper TNF-α concentrations were achieved at hour 0 and build confidence in ELISA results. In either case, ~1-ng/ml TNF-α was observed in the trans-compartment following 24-h incubation, thus confluent HUVECs function as a restrictive barrier to TNF-α and cells are primarily exposed in a polarized manor (20:0–1 ng/ml) for the 24-h experiment. (C) Flow cytometry analysis of HUVEC ICAM-1 expression following 24-h single-side stimulation with 0 (control)-, 1- or 20-ng/ml TNF-α. Statistically different levels of inflammation-induced ICAM-1 expression, as measured by ABC, ensure HUVECs differentially respond to 1- versus 20-ng/ml TNF-α. ABCs were statistically compared by ANOVA with Tukey’s multiple comparisons tests, ****P < 0.0001.
Cell culture
Pooled human umbilical vein endothelial cells (HUVECs) were purchased from Vec Technologies Inc. (Rensselaer, NY) and maintained in T25 tissue culture treated plastic flasks at 5% CO2, 37°C prior to device seeding. HUVECs were used between passages 2 and 7. Autoclaved μSiM-MVMs were transferred to a sterile cell culture hood and exposed to UV for 15 min. Devices were coated with 0.17-mg/ml fibronectin (Corning Inc., Corning, NY) for 1 h at RT. The luminal channel of the coated device was then gently perfused with trypsinized HUVECs at a density of 40 000 cells/cm2. Devices were maintained at 5% CO2, 37°C in a sterile petri dish with a moisten kimwipe for humidity control. HUVECs were statically grown in devices for 24 h prior to experimentation. When stated, μSiM-MVMs were perfused luminally (apical EC surface engagement) or abluminally (basal EC engagement) with 20-ng/ml human recombinant TNF-α (R&D Systems, Minneapolis, MN) in MCDB-131 complete media (Vec Technologies, Rensselaer, NY) and incubated at 5% CO2, 37°C for an additional 24 h. Negative control devices were filled with clean media and maintained in an identical fashion. The vehicle for delivery of TNF-α comprised of 1× PBS with 0.1% bovine serum albumin (BSA). The final concentration of vehicle in treatment media was 0.02%; thus, an explicit vehicle control was unnecessary.
TNF-α transendothelial flux
The μSiM-MVMs were perfused luminally or abluminally with TNF-α supplemented media [20 ng/ml] and incubated for 24 h as stated previously. Media was gently collected from the trans-channel following the 24-h incubation (i.e. opposite channel to which TNF-α was added at hour 0) and TNF-α content was quantified by ELISA (Human TNF-alpha Quantikine ELISA; R&D Systems, Minneapolis, MN). Media (both control and TNF-α supplemented) added at hour 0 was assayed in parallel.
ICAM-1 flow cytometry
HUVECs were seeded and grown to confluency in tissue culture-treated 6-well plates. Confluent HUVEC monolayers were incubated with 0-, 1- or 20-ng/ml TNF-α for 24 h. Stimulated HUVECs were trypsinized and incubated on ice with anti-human ICAM-1 monoclonal mouse IgG1 conjugated to Alexa Fluor 488 (R&D Systems, Minneapolis, MN). In parallel, Quantum Simply Cellular anti-Mouse IgG beads (Bang Laboratories Inc., Fishers, IN) were incubated with saturating concentrations of the same conjugated antibody. Geometric mean fluorescence intensity was determined by flow cytometry (Guava Easycyte Mini; Luminex, Austin, TX). Geometric mean intensity was converted to antibody binding capacity (ABC) by establishing a standard curve using the Simply Cellular beads. This conversion allowed for direct quantification of ICAM-1 expression on the HUVEC surface.
Immunocytochemistry
Following experimentation, μSiM-MVMs were exposed to warm (37°C) 4% paraformaldehyde in PBS and incubated at 5% CO2, 37°C for 5 min. Once fixed, cells were exposed to a solution of 0.1% Triton X-100 for 1 min at RT and quickly rinsed with clean PBS to ensure even permeabilization without further damaging the cell. Cells were blocked in a solution of 10% BSA in PBS at RT for 1 h. Antibodies were purchased as follows: human ICAM-1/CD54 PE conjugated (BioLegend, Sand Diego, CA); human VE-cadherin (BV9) Alexa Fluor 488 conjugated mouse monoclonal IgG2a (Santa Cruz Biotechnology, Dallas, TX); human PECAM-1/CD31 mouse monoclonal IgG1 (R&D Systems, Minneapolis, MN) and anti-mouse IgG-FITC produced in goat (Sigma-Aldrich, St. Louis, MO). Antibodies were used at manufacturer recommended concentrations for immunocytochemistry (ICC). In general, antibodies were diluted to working concentrations in PBS and loaded into both the luminal and abluminal channels of the μSiM-MVM to ensure even exposure. Samples were counterstained with 1-μg/ml DAPI when appropriate. Epifluorescence images were recorded in situ on a Nikon TS100 microscope. Microscope and camera settings (exposure, gain, etc.) were maintained consistent across experimental replicates to ensure accurate representation of the specific label.
In confocal experiments, μSiM-MVMs were preprocessed to minimize working distance and maximize image quality. Polydimethylsiloxane support layers (see Supplementary Fig. S1) were carefully removed and the remainder of the device was inverted and placed on a fresh coverslip. The modified assembly was transferred to a FV1000 Olympus laser scanning confocal microscope stage and a 60× water objective was focused on the nanomembrane substrate. Z-stack images were collected over 8 μm (starting at the nanomembrane, Z = 0 μm, and moving through the cell monolayer) at a step size of 0.49 μm. Raw images were imported and analyzed in FIJI. Two cells from each of the three independent experiments/devices were analyzed for ICAM-1 intensity on (as marked by DAPI) or off the nucleus. 3D reconstructions were made using the 3D Viewer plugin in FIJI.
Transendothelial electrical resistance
HUVECs were seeded on fibronectin coated PET membranes (1-μm pores, 0.33 cm2 inserts, VWR, Radnor, PA) and grown to confluency. Cells were exposed to TNF-α or control media in an identical fashion as μSiM-MVMs. Transendothelial electrical resistance (TEER) was measured using an ENDOHM-24G-SNAP cell culture cup electrode attached to an epithelial volt/ohm meter (EVOM2; World Precision Instruments, Sarasota, FL). HUVECs were exposed to thrombin (Sigma, St. Louis, MO; 5 U/ml) for 30 min at 5% CO2, 37°C to act as a barrier disrupting positive control.
Small molecule permeability
HUVECs were seeded in μSiM-MVMs as stated previously. Once confluent (24 h post-seed), HUVECs were exposed to control medial or TNF-α [20 ng/ml] media (luminally or abluminally) for an additional 24 h. Following treatment, devices were loaded luminally with 10- or 70-kDa FITC-dextran [1 mg/ml] (Sigma, St. Louis, MO) in MCDB-131 complete media and returned to the incubator (37°C, 5% CO2) for 1 h. Media was gently sampled from the abluminal channel and transferred to a black 96-well plate. Sample volumes were adjusted to 50 μl to allow for accurate readings. Depending on the tracer used, a 10- or 70-kDa FITC-dextran reference ladder was prepared as follows: 200-, 100-, 50-, 25-, 12.5-, 6.25-, 3.125- and 0-μg/ml in MCDB-131 complete media. Reference samples were transferred in 50-μl aliquots to the sample 96-well plate. Fluorescence intensity was measured at 490/520 nm Ex/Em in a microplate reader (Tecan, Männedorf, Switzerland). Permeability coefficients (Pe) were calculated by inputting the FITC-dextran flux into the following equation (1):
 |
(1) |
where JF is the flux of FITC-dextran into the abluminal channel (mass/time), A is the membrane area (0.014 cm2) and Ci is the concentration of FITC-dextran added to the luminal channel (1 mg/ml).
IL-8 detection
Media was collected from the luminal and abluminal channels of the μSiM-MVM, and IL-8 was detected using a Human IL-8/CXCL8 DuoSet sandwich ELISA (R&D Systems, Minneapolis, MN) following manufacturer protocols.
PMN migration
PMNs were isolated following an IRB approved protocol as previously described [22, 25]. Briefly, whole blood was drawn from consenting healthy donors via venipuncture into sodium heparin containing vacuum tubes. Whole blood was cooled to room temperature and density separated using a solution of 1-Step Polymorph (Accurate Chemical & Scientific Co., Westbury, NY) following manufacturer protocols. The PMN-rich layer was transferred to a sterile 15-ml falcon tube and diluted in a neutrophil wash buffer comprised of calcium- and magnesium-free Hank’s balanced salt solution with added 10 mM 4-(2-hydroxyethyl)-1-piperazineethanesulfonic acid and 5-mg/ml BSA. PMNs were washed twice (pelleted and resuspended) and then subjected to an RBC lysis step in which the PMN-rich solution is exposed to 4.5 ml of 1/6× PBS for 1 min, and subsequently equilibrated following the addition of 1.5 ml of 4× PBS. PMNs were washed a final time before being transferred to a 1-ml Eppendorf tube in neutrophil wash buffer and placed on a rotating stand. The use of human subjects and the neutrophil isolation protocol was approved by the Research Subjects Review Board at the University of Rochester. Written consent was acquired prior to the collection of human patient whole blood. PMNs were used within 5 h of blood draw to ensure cell viability. Prepped μSiM-MVMs were perfused with clean, IL-8 (R&D Systems, Minneapolis, MN) or N-Formylmethionyl-leucyl-phenylalanine (fMLP; Sigma-Aldrich, St. Louis, MO; 10 nM) supplement HUVEC media, and PMNs were introduced in the luminal channel at a density of 4.5 million/ml (in MCDB-131 complete media). The final IL-8 vehicle (1× PBS with 0.1% BSA) concentration in MCDB-131 was at most 0.037%, and thus clean media constituted the negative control. Phase time lapse movies were recorded on a Nikon TS100 with a stage-top incubation chamber (Carl Zeiss AG, Oberkochen, Germany). Images were collected at 8 fpm over 30 min for all time lapse experiments. In ICAM-1 blocking experiments, function blocking anti-hICAM-1 or isotype control antibodies (R&D Systems, Minneapolis, MN) were added to the luminal channel of abluminally stimulated μSiM-MVMs (TNF-α [20 ng/ml] added 24 h prior) and incubated at 37°C, 5% CO2 for 30 min. PMNs were added to the luminal channel in antibody-containing media and images were recorded as previously stated.
PMN tracking
Automated transmigration tracking was performed using a custom-made MATLAB script. Before performing automated PMN counting, images from each time series were preprocessed in MATLAB to improve the uniformity of the lighting in space and time. For each video, the mean pixel intensity for the entire time series was computed, and then all pixel intensity values in each frame were scaled such that the mean pixel intensity for each frame matched the time series average. This provided a minor adjustment that accounted for any brightness nonuniformities in time. Next, a Gaussian blur was applied to each image (using the MATLAB function ‘imgaussfilt.m’ with a standard deviation of 30 pixels) and subsequently each blurred image was subtracted from each original image; each resulting image was rescaled such that the pixel intensity mean and standard deviation were 122 and 41 (for 8-bit images with pixel intensities ranging from 0 to 255). These resulting images were then used for automated identification of PMNs. This small image adjustment removed a moderate spatial nonuniformity present in the microscope lighting.
Following pre-processing, luminal and abluminal PMNs were automatically identified and counted separately in MATLAB software (MathWorks; Natick, MA) using an adapted version of a previously described particle tracking algorithm [26]. Luminal cells were identified in each 8-bit image by locating regions with at least 160 contiguous pixels (490 μm2) of intensity value 190 or greater. Similarly, abluminal cells were identified in each image by locating regions with at least 400 contiguous pixels (1200 μm2) of intensity value 80 or lower.
To check the fidelity of the automated tracking, we also used FIJI to hand quantify percent PMN transmigration. The Cell Counting plugin in FIJI was used to select luminal cells in the first frame as well as frame by frame select instance of PMN transmigration. The number of transmigration events was normalized to the total number of PMNs in the first frame to obtain a single value for percent transmigration per experimental replicate. While the automated tracking did show similar transmigration trends compared with the hand tracking methods, we ultimately concluded that the hand tracking more reliably distinguished luminal and abluminal cells; therefore, these data were utilized exclusively to perform robust statistics and draw conclusions in this paper.
For manual speed and persistence calculations, 10 luminal and abluminal (when applicable) PMNs were randomly selected from three independent experiments (30 total PMNs) and were tracked using the Manual Tracking plugin in FIJI. To validate the accuracy of the tracking methodology, one experimental replicate was tracked in its entirety. That same data set was tracked using the random selection method and the results were compared (Supplementary Fig. S2). We drew similar conclusions from the two data sets and therefore relied on the random PMN selection methodology for all remaining experiments.
Statistical analysis
All cell culture experiments were performed in triplicate (three independent devices) unless otherwise stated. Each experimental replicate was performed on separate days, in separate devices, with sequential passages of HUVECs. Experimental groups and controls were performed in parallel (one replicate for each group per day). Results are reported in mean ± standard error of mean (SEM). Statistical analysis was performed in JMP Pro 14 (SAS Institute; Cary, NC) and Prism (GraphPad Software, Inc.; San Diego, CA).
RESULTS
Luminal and abluminal TNF-α differentially regulate small molecule EC permeability independent of ICAM-1, PECAM-1 and TEER
First, we investigated the potential differences in ECs response to inflammatory cytokines delivered abluminally (analogous to cytokine production in the tissue) versus those delivered luminally (mimicking systemic cytokine presence). Pooled HUVECs were seeded in fibronectin-coated μSiM-MVMs and grown to confluency over 24 h. Optically transparent nanoporous membranes allowed for in situ validation of vascular markers (CD31) and live cell monitoring of monolayer confluency prior to experimentation (Fig. 1A). Once confluent, HUVECs were stimulated luminally or abluminally with TNF-α supplemented media [20 ng/ml] for an additional 24 h. Control devices were filled with fresh media in parallel. Confluent HUVEC monolayers were probed for their ability to limit the transport of TNF-α within our system. Trans-compartment TNF-α concentrations were determined by ELISA, 24 h after the addition of 20-ng/ml TNF-α to the respective channel. HUVECs functioned as a restrictive barrier to TNF-α (Fig. 1B), with a polarized concentration gradient achieved over the 24-h experiment (20:0–1 ng/ml).
To ensure that HUVECs can distinguish between these two cytokine concentrations, HUVEC ICAM-1 surface expression was investigated via flow cytometry. HUVECs grown to confluency in a 6-well plate were incubated with 0-, 1- or 20-ng/ml TNF-α for 24 h. Quantified flow cytometry results showed a near 60% increase in ICAM-1 expression (as measured by ABC) on HUVECs stimulated with 20- (ABC of 3 934 419 ± 37 258) versus 1-ng/ml (ABC of 2 468 792 ± 25 462; Fig. 1C) TNF-α. Thus, we conclude HUVECs respond differently to 1- versus 20-ng/ml TNF-α, and a polarized inflammatory environment was achieved and sustained over the duration of the incubation with TNF-α.
In situ ICC was used to quickly probe the effects of polarized cytokine stimulation on the EC response. Following stimulation with TNF-α, EC VE-Cadherin immunofluorescent staining showed modest changes in intensity and morphology across treatment groups (Fig. 2A). Therefore, TEER and small-molecule permeability were used to quantify the functional impact of direction stimulation of ECs with TNF-α on junctional integrity. Conventional TEER analysis in a Transwell™ system showed that both luminal and abluminal TNF-α induced a significant decrease in EC resistance compared with control. However, no significant differences were observed between treatment groups (Fig. 2B). Among TEER results, decreases in EC permeability due to TNF-α exposure were like that of thrombin, a known barrier disrupting agent. When permeability experiments were repeated in the μSiM-MVM using small molecule flux as an indicator of vascular integrity, we found a significant increase in HUVEC permeability in response to abluminal TNF-α with respect to control, which was not observed following luminal exposure (Fig. 2C). These data suggest a subtle, but significant difference in vascular barrier integrity when stimulated abluminally versus luminally with TNF-α, that may not be distinguishable by TEER in traditional Transwell™ systems. Following permeability experiments, we sought to determine the impact of luminal and abluminal TNF-α on surface expression of EC proteins, ICAM-1 and PECAM-1. Upon stimulation with TNF-α, HUVECs upregulated ICAM-1 with no visible difference between luminal or abluminal treatment groups (Fig. 3A). Additionally, no apparent changes across control or treatment groups were observed under PECAM-1 immunofluorescent staining (Fig. 3B). Overall, these results indicate for the first time that EC apicobasal polarity facilitates distinct barrier responses to luminal versus abluminal TNF-α as measured by small molecule flux, while the increased expression of ICAM-1 and PECAM-1 rearrangement are independent of the direction of stimulation.
Figure 2.
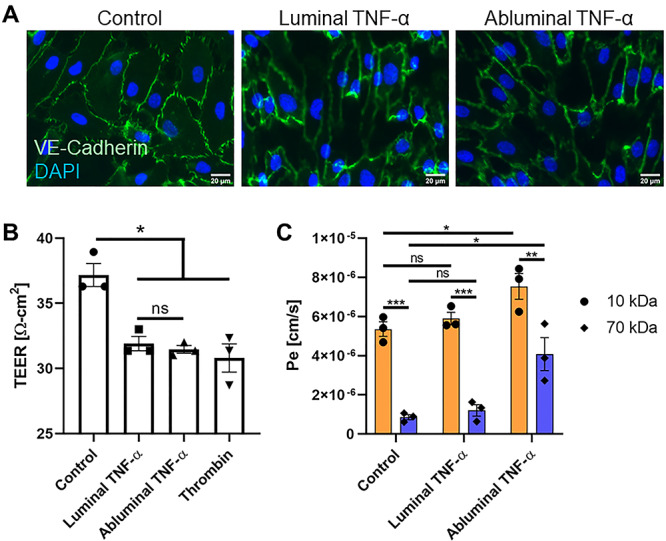
VE-cadherin and vascular permeability analysis following luminal or abluminal TNF-α delivery. (A) VE-cadherin immunofluorescence staining on HUVECs upon luminal or abluminal TNF-α stimulation revealed potential, yet equivocal changes in intensity and morphology across treatment groups. Scale bars = 20 μm, n = 3 independent experiments and devices, representative images shown. (B) TEER measurements were taken in traditional Transwell™ permeable support systems 24 h post-HUVEC treatment to determine the functional impact of polarized TNF-α stimulation of HUVEC barrier function. TEER revealed a statistically significant increase in EC permeability following cytokine stimulation (when compared with negative control), independent of EC apicobasal polarity. N = 3 independent experiments, error bars represent standard error of mean, means were statistically compared by ANOVA with Tukey’s multiple comparisons test, *P < 0.05 and ns = no significance. (C) Small-molecule [10 (orange) and 70 (blue) kDa FITC-dextran] permeability measurements performed in the μSiM-MVM showed a significant increase in HUVEC permeability in response to abluminal TNF-α with respect to control, which was not observed following luminal treatment. N = 3 independent experiments and devices, error bars represent standard error of mean, means were statistically compared by ANOVA with Tukey’s multiple comparisons test, *P < 0.05 and ns = no significance.
Figure 3.
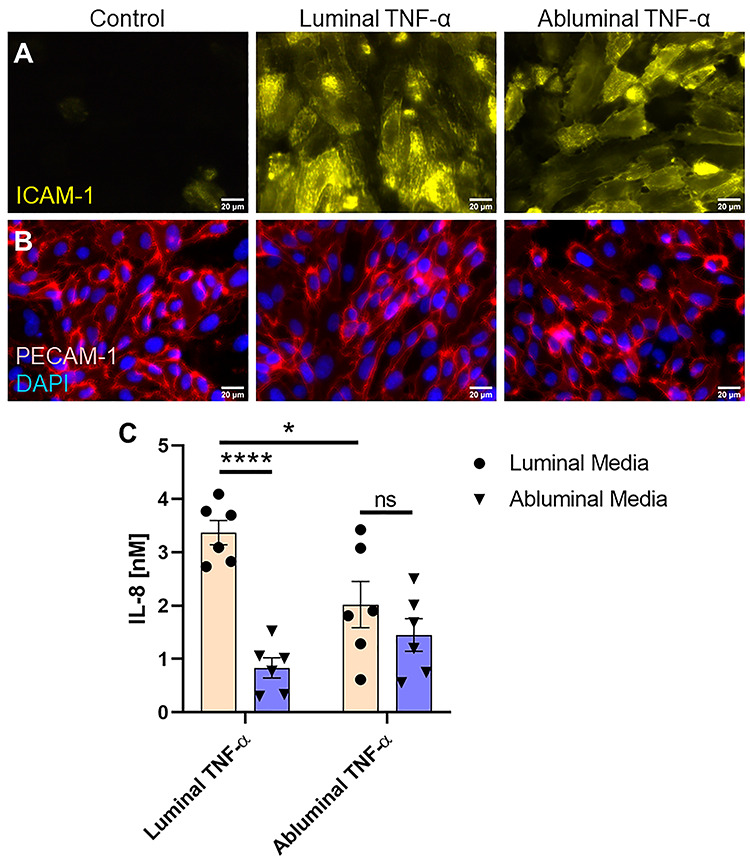
EC expression of insoluble and soluble proteins in response to luminal or abluminal TNF-α. (A) Immunofluorescence staining of EC ICAM-1 revealed upregulation of the surface adhesion protein, with no visible difference between luminal and abluminal stimulation groups. Scale bars = 20 μm, n = 3 independent experiments and devices, representative images shown. (B) PECAM-1 staining showed no obvious differences between treatment groups and controls all together. Scale bars = 20 μm, n = 3 independent experiments and devices, representative images shown. (C) Soluble IL-8 content in CCM was quantified by ELISA. Luminal TNF-α exposure induced a gradient of soluble IL-8 favoring luminal presentation. Abluminal TNF-α exposure, however, failed to induce a statistically significant difference in IL-8 secretion directed toward the luminal versus abluminal compartments, suggesting uniform secretion of the chemoattractant. N = 6 independent experiments and devices across treatment groups, error bars represent standard error of mean, means were statistically compared by ANOVA with Tukey’s multiple comparisons test, *P < 0.05, ****P < 0.0001 and ns = no significance.
Directional EC stimulation drives polarized secretion of IL-8
Next, we sought to assess the effects of directional cytokine stimulation on EC chemokine secretion. After TNF-α treatment, cell culture media (CCM) was collected from both the luminal and abluminal channels of the μSiM-MVM and IL-8 was quantified using an IL-8/CXCL8 sandwich ELISA (Fig. 3C). The EC monolayer and accompanying nanoporous membrane provided a separation barrier between the luminal and abluminal channels, allowing for independent CCM collection, a key feature of the μSiM-MVM in the facilitation of this work. Luminal TNF-α induced luminal and abluminal secretion of IL-8 equal to 3.37 ± 0.23 and 0.83 ± 0.19 nM, respectively, effectively establishing a trans-EC gradient favoring luminal presentation of the PMN chemoattractant. Conversely, abluminal TNF-α failed to establish a gradient, with statistically indistinguishable concentrations of IL-8 between luminal and abluminal channels (2.01 ± 0.43 and 1.45 ± 0.31 nM, respectively). These results again indicate that the apicobasal polarity of ECs makes them sensitive to the direction of cytokine engagement and permits distinct patterns of chemokine secretion.
Abluminal TNF-α induces a robust PMN transmigration response
Next, PMN transmigration across luminally and abluminally stimulated HUVEC monolayers was quantified to determine the consequence of EC apicobasal polarity to leukocyte diapedesis. We hypothesized that the negative IL-8 gradient (i.e. toward the lumen), following luminal TNF-α treatment, would sequester PMNs in the luminal chamber. However, it was less clear how PMNs would respond to high levels of IL-8 on both sides of ECs as observed following abluminal TNF-α treatment within our mimetic. Freshly isolated human PMNs were loaded in the luminal channels of TNF-α treated and media only treated μSiM-MVMs. In addition, fMLP, a strong PMN chemoattractant, was added abluminally forming a potent positive chemotactic gradient as a positive control. In this case, fMLP supplemented media was loaded into the abluminal channel immediately following the addition of PMNs to the luminal channel without any TNF-α stimulation of ECs. Devices were transferred to a heated incubation stage fixed to a phase contrast inverted microscope. A 40× objective was focused on the EC monolayer and images were collected at 8 fpm over 30 min. The use of phase contrast microscopy allowed for label-free detection of luminally crawling (shown as phase bright), highly transient/probing and abluminally crawling (shown as phase dark) PMNs (Fig. 4A) [15, 22].
Figure 4.
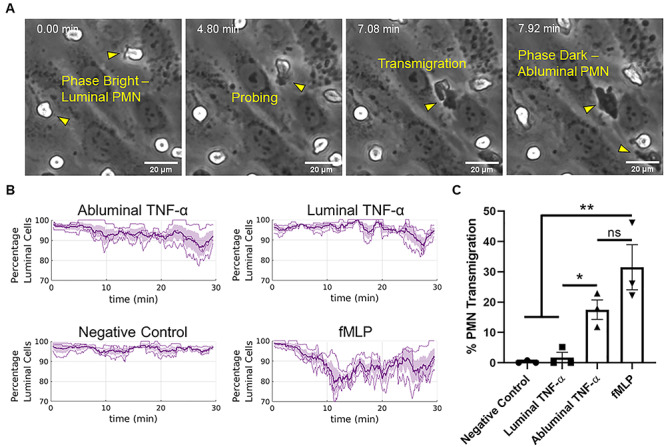
Abluminal TNF-α drives PMN transmigration. (A) PMNs transition from phase bright (luminal) to phase dark (perivascular/abluminal) as they traverse the endothelium within the μSiM-MVM, allowing for automated tracking of PMN transmigration without exogenous dyes. (B) Automated tracking was used to quantify the ratios of luminal PMNs to total PMNs (percentage luminal cells) following luminal or abluminal TNF-α treatment of ECs (20 ng/ml for 24 h). Additionally, fMLP was perfused in the abluminal compartment of independent devices as a positive control for transmigration. N = 3 independent experiments and devices, dark lines represent time-dependent mean, shaded regions represent standard error of mean. (C) Percent PMN transmigration was also quantified by hand as a means of validating the automated tracking and drawing statistically robust conclusions from the data set. Percent transmigration was defined as the ratio of the number of cells in the first frame of the time lapse movie to the number of cells that transmigrate over the course of 30 min. Both automated and hand tracking revealed a robust transmigration response to abluminal TNF-α EC stimulation. N = 3 independent experiments and devices, means were statistically compared with fMLP (positive control) by ANOVA with Tukey’s multiple comparisons test, treatments were compared with unpaired t-tests, *P < 0.05, **P < 0.005 and ns = no significance.
To collect migration data without bias, we developed an automated tracking algorithm in MATLAB. Following experimentation, PMN migration videos were imported into the custom MATLAB script and time course transmigration data were collected. Abluminal TNF-α resulted in a robust transmigration response (Fig. 4B). Conversely, both the negative control and luminal TNF-α treatment groups resulted in very few to zero transmigration events. To validate the automated analysis of transmigration, the percent PMN transmigration, defined as the ratio of transmigrated PMNs after 30 min to the total number of PMNs in the first frame, was also manually quantified. These results showed that abluminal TNF-α induced a statistically significant increase in PMN transmigration compared with the luminal treatment group (Fig. 4C; n = 3, P < 0.05), corroborating the results presented by the automated tracking.
A negative gradient of IL-8 sequesters PMNs on the apical EC surface
With the discovery of distinct PMN transmigration responses to luminal versus abluminal TNF-α, we next conducted experiments to determine the degree to which soluble IL-8 directs this phenomenon. Due to the low CCM volumes available after collection (~10 μl), we opted to use recombinant human IL-8 (rhIL-8) supplemented in media at the concentrations secreted in response to directional TNF-α stimulation, shown in Fig. 3C. By introducing IL-8 in this way, we also eliminate other potential EC-secreted factors that might affect PMN transmigration, allowing us to probe the specific effects of the exogenously added IL-8.
First, unstimulated devices were rinsed with clean media and subsequently loaded with exogenous rhIL-8 supplemented media in the luminal or abluminal compartments in a manner that mimicked the secreted concentrations following TNF-α stimulation (referred to as ‘mock treatments’). Images were collected at the time of PMN loading and following a 30-min incubation. Both mock luminal TNF-α treatment (establishing a negative gradient: 3.4-nM exogenous IL-8 added luminally and 0.8-nM exogenous IL-8 added abluminally) and mock abluminal TNF-α treatment (establishing a near neutral gradient: 2-nM exogenous IL-8 added luminally and 1.4-nM exogenous IL-8 added abluminally) were insufficient to induce transmigration (Fig. 5A and C). Transmigration was observed, however, with a positive (tissue directed) gradient of IL-8 (0-nM IL-8 luminally and 2-nM IL-8 abluminally). This suggests that bilateral IL-8 secretion alone is insufficient to explain the transmigration results following abluminal TNF-α treatment.
Figure 5.
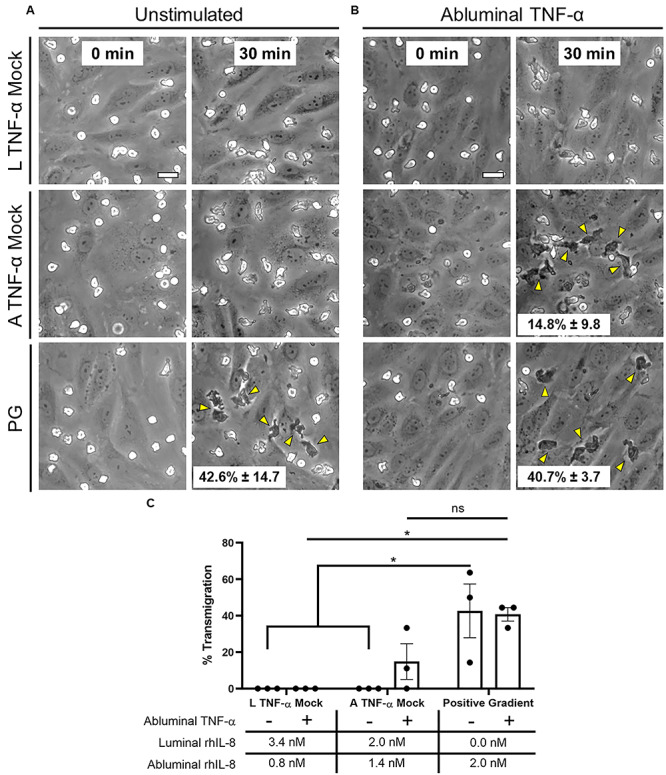
PMN transmigration potential following exogenous IL-8 addition. (A) μSiM-MVMs were loaded luminally with PMNs as well as luminally and abluminally with recombinant human IL-8 at the concentrations determined by ELISA: Luminal (L) TNF-α Mock = 3.4-nM IL-8 luminally and 0.8-nM IL-8 abluminally, Abluminal (A) TNF-α Mock = 2-nM IL-8 luminally and 1.4-nM IL-8 abluminally, Positive Gradient (PG) = 0-nM IL-8 luminally and 2-nM IL-8 abluminally. Phase images were collected at time of PMN loading (first column) and following 30 min of incubation (second column). Neither mock treatment resulted in PMN transmigration. PMN transmigration was observed, however, in the positive gradient group. Representative images shown. N = 3 independent experiments and devices. (B) Experiments were repeated in devices exposed to abluminal TNF-α [20 ng/ml, 24 h]. PMN transmigration was again not observed in the luminal TNF-α mock group but was recovered in the abluminal TNF-α mock group. Scale bars = 20 μm, n = 3, representative images shown. Yellow arrows emphasize transmigration events. Quantification was performed by hand by dividing the number of phase white PMNs in the first image to the number of phase dark PMNs in the final image (listed as mean ± SEM on respective images). (C) Mean percent PMN transmigration was statistically compared by two-way ANOVA with Sidak’s multiple comparisons test, *P < 0.05 and ns = no significance.
In light of these negative findings with unstimulated ECs, we hypothesized that additional TNF-α responses, specifically the upregulation of the PMN ligand ICAM-1 on the apical surface of ECs, decreased vascular barrier function (Figs 2C and 3A), and potential surface bound IL-8 [27, 28] were needed to promote PMN transmigration in the absence of a positive soluble chemokine gradient. To test this hypothesis, μSiM-MVMs were subjected to abluminal TNF-α treatment as before, followed by repeated washing of the media. Rinsed devices were re-perfused with the same levels of exogenous IL-8 as in the previous mock treatments. Transmigration was observed with exogenously added positive (0/2-nM IL-8) and near neutral (2/1.4-nM IL-8) IL-8 gradients (Fig. 5B and C), but not in case of an exogenously added negative gradient (3.4/0.8-nM IL-8). These results suggest that a combination of IL-8 secretion and immobilization patterns, ICAM-1 expression and vascular barrier state determine the likelihood of transmigration. This interplay may explain the paradoxical roles reported for IL-8 in inflammation, driving PMNs to the site of inflammation in some cases [29], or sequestering them in circulation in others [30].
PMN luminal and perivascular dynamics correlate with cytokine stimulation, uncoupled from EC apicobasal polarity and PMN transmigration fate
Given our ability to readily observe and quantify PMN dynamics in the μSiM-MVM, we sought to further study the differential effects of luminal and abluminal TNF-α stimulation of ECs on PMN motility. Thus, PMNs were manually tracked and their dynamics were quantified (Supplementary Movies S1–S4). When compared with the non-treated control group, PMNs on the apical surface of both luminally and abluminally stimulated ECs showed a noticeable increase in population motility as highlighted by the shift of the probability density functions (PDFs) towards higher speeds (Fig. 6A). Slightly higher mean speeds were seen in the luminal TNF-α group (17.37 μm/min) compared with abluminal TNF-α (14.88 μm/min). In addition to PMN speeds, the persistence of the cells was calculated by the following equation (2):
 |
(2) |
where  is equal to the displacement of the PMN over the course of the experiment and
  is equal to the total distance traveled by the leukocyte; PMNs with a persistence value close to 1 take a relatively direct path to their destination, whereas PMNs with a value close to 0 take a non-direct path, increasing their total distance traveled in relation to their displacement. For apically migrating PMNs, we found that TNF-α reduced PMN persistence compared with both fMLP treatment and negative controls, regardless of whether ECs were stimulated luminally or abluminally (Fig. 6B). Interestingly, PMNs crawling perivascularly (between the ECs and the membrane) in response to abluminal TNF-a treatment displayed both higher mean speeds (VTNF/IL-8 = 15.51 μm/min; VfMLP = 13.14 μm/min; Fig. 6C) and lower mean persistence (PTNF/IL-8 = 0.10; PfMLP = 0.14 μm/min; Fig. 6D) when compared with cells crawling perivascularly in response to fMLP treatment. This result indicates that the motility parameters of speed and persistence are sensitive to the type of inflammatory stimulus used, regardless of the location of PMN crawling. Altogether, these results also indicate that apical speed and persistence are not predictive of the ultimate transmigration fate of PMNs.
Figure 6.
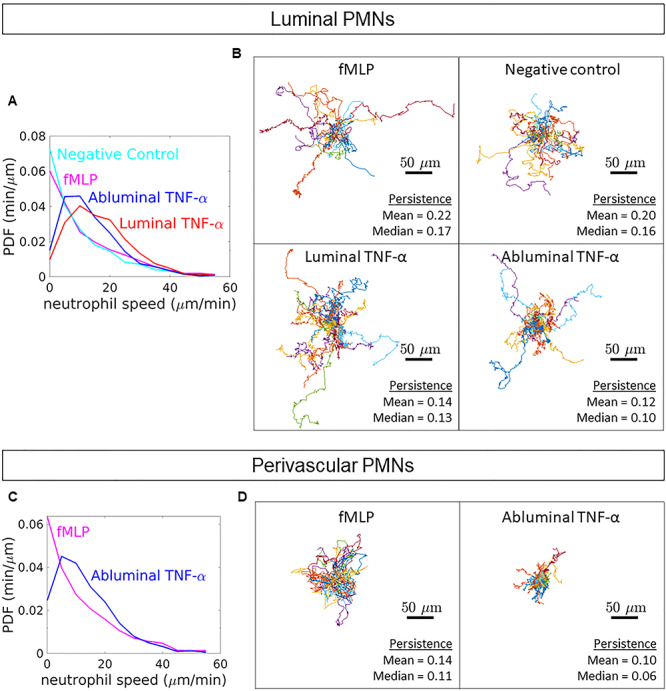
PMN dynamics following directional cytokine stimulation. (A) PDFs of luminal PMN speeds were calculated from hand tracks. Mean luminal PMN speeds were calculated from instantaneous velocities as follows: negative control = 10.87 ± 2.44 μm/min, fMLP = 13.30 ± 3.39 μm/min, luminal TNF-α = 17.37 ± 2.13 μm/min and abluminal TNF-α = 14.88 ± 1.92 μm/min. (B) Additionally, PMN persistence, defined as the ratio of displacement to total pathlength, was quantified. Spider plots depict hand tracks stemming from a universal origin. (C) Analyses were repeated for PMNs crawling in the perivascular space (between the HUVECs and the nanoporous membrane). Mean perivascular PMN speeds were calculated from instantaneous velocities as follows: fMLP = 13.14 ± 3.18 μm/min and abluminal TNF-α = 14.51 ± 2.16 μm/min. (D) Persistence of perivascular PMNs was determined as well; spider plots shown. For all conditions: n = 30, three independent experiments and devices, 10 PMNs per device. A comprehensive statistical summary based on population means can be found in the online supplement (Supplementary Figs S3 and S4).
ICAM-1 reorganization on apical membrane ruffles follows abluminal cytokine stimulation
While our exogenous IL-8 addition experiments suggest an inhibitory role of soluble IL-8 in the case of luminal TNF-α, the results fail to identify the facilitator of PMN transmigration following abluminal TNF-α. Specifically, the lack of transmigration in the ‘mock abluminal TNF-α’ group on unstimulated ECs (Fig. 5A) and subsequent recovery of transmigration in the same group on abluminally stimulated ECs (Fig. 5B) suggests that other TNF-α-dependent factors are needed to drive PMN transmigration within our system. Previous works have implicated both EC surface bound-IL-8 and disrupted vascular barrier as important players in cytokine driven PMN transmigration; however, our quantified PMN dynamics urged us to pursue the influence of ICAM-1 surface expression patterns in driving transmigration following polarized TNF-α.
In order to directly probe the influence of ICAM-1 in driving PMN transmigration, we opted to block ICAM-1 on the surface of abluminally stimulated ECs (where transmigration was previously observed) and repeat transmigration experiments. ICAM-1 antibody blocking resulted in a significant reduction in PMN transmigration events with respect to isotype control (Fig. 7A), suggesting that ICAM-1 plays at least a partial role in the polarized response of ECs to TNF-α within our system. Interestingly, epifluorescence data previously presented (Fig. 3A) failed to reveal unequivocal differences in expression levels of ICAM-1 on luminally or abluminally stimulated ECs, and thus elevated ICAM-1 expression is not sufficient to induce transmigration in our system.
Figure 7.
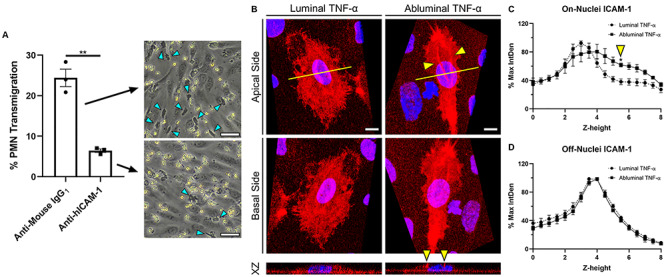
ICAM-1 reorganization on membrane ruffles following abluminal stimulation of ECs. (A) Percent PMN transmigration across abluminally stimulated ECs following ICAM-1 (Anti-hICAM-1) or isotype control (Anti-Mouse-IgG1) antibody blocking. Scale bar = 50 μm, n = 3, representative images shown. Mean percent transmigration was statistically compared by unpaired t-test, **P < 0.005. (B) Representative 3D reconstruction of confocal stacks depicting apical (top row, view from apical side of the cell) and basal (bottom row, inverted image showing view from basal side of cell) ICAM-1 expression following polarized cytokine (TNF-α [20 ng/ml]; 24 h) stimulation. Yellow arrows emphasize ICAM-1 rich ruffles present above EC nuclei following abluminal TNF-α treatment. N = 3 independent experiments and devices, 2 cells per device, representative images shown. XZ projection was collected at the mid-nucleus cross-section (yellow line) to show ruffles extension in the Z plane. Scale bars = 10 μm. ICAM-1 label intensity was quantified as follows: (C) ICAM-1 label integrated density at each z-height in the nuclear region as marked by DAPI and (D) ICAM-1 label integrated density at each z-height on the periphery of the cell. Integrated densities were normalized to respective image maximum values. Plots represent mean ± SEM values at each z-stack height (0.49-μm increments, 8-μm total height). Zero micrometer represents nanoporous membrane focus. For both on- and off-nuclei measurements, ICAM-1 intensity following luminal or abluminal TNF-α exposure was statistically compared at each respective z-height by two-way ANOVA with Sidak’s multiple comparisons test, *P < 0.05.
While fluorescence microscopy (Fig. 3A) cannot distinguish between the apical and basal expression of ICAM-1 on the optically thin periphery of ECs, confocal microscopy can distinguish between the apical and basal membranes in the nuclear/perinuclear region where ECs display maximal thickness (Fig. 7B; Supplementary Movies S5 and S6). Examining this region of ECs in the μSiM-MVM, we found that ICAM-1 localizes to the apical and basal EC surface regardless of whether TNF-α is applied luminally or abluminally. However, we also found that ICAM-1-rich membrane ruffles appear and extend several microns above the apical surface when ECs are stimulated abluminally (Fig. 7C). While similar ruffles could be seen with luminal TNF-α treatment, they were significantly less pronounced (Fig. 7B and C). These observations were quantified to reveal a statistically significant increase in ICAM-1 intensity 5.5 μm above the nanomembrane support following abluminal TNF-α compared with luminal treatment (Fig. 7C and D). While more study will be necessary to determine if these ruffles have a role in PMN transmigration, they do suggest a hypothesis that the potential directional cue in the case of abluminal treatment with TNF-α may be ‘morphological changes in ECs’ rather than a difference in overall levels of ICAM-1 expression.
DISCUSSION
In this study, we used a microvascular mimetic (μSiM-MVM) to elucidate differential EC responses to luminal versus abluminal stimulation by the pro-inflammatory cytokine, TNF-α. While greatly simplified compared with in vivo vasculature, the nanomembrane-based platform uniquely enabled a simulation of the vascular EC response to localized infection in tissue (acute inflammation), compared with the response to circulating cytokines during systemic inflammation (as observed in sepsis). We simulated these scenarios in the μSiM-MVM by presenting TNF-α to either the ‘blood-side’ or ‘tissue-side’ of the device. TNF-α is a key mediator of the immune response in sepsis and primary bacterial infection, with profound effects on EC function. Signaling through EC expressed TNFR1/2, TNF-α increases vascular permeability and facilitates leukocyte recruitment in inflamed microenvironments. Specifically, ICAM-1, a leukocyte adhesion molecule, is upregulated in response to TNF-α, allowing for elevated LFA-1 (CD11a) and Mac-1 (CD11b) binding and firm adhesion of leukocytes to the EC surface [31]. VE-cadherin undergoes dynamic opening and closing following TNF-α exposure, leading to a decrease in EC barrier function and increased paracellular transmigration [32]. In addition, PECAM-1 is hypothesized to be redistributed on HUVECs under TNF-α stimulation, although the impact of this change on leukocyte transmigration is less understood [33, 34]. With the exception of ICAM-1 expression [35], no previous studies have asked if the same responses occur if TNF-α is delivered to the abluminal EC surface.
In agreement with the findings of Morzycki and colleagues, our results show that increases in EC ICAM-1 expression were similar following luminal or abluminal exposure to TNF-α [35]. In a system similar to that used by Morzycki and colleagues (polycarbonate filter Transwell™ system), we analyzed the permeability (as measured by TEER) of HUVECs following luminal or abluminal TNF-α exposure. In so doing, we observed an increase in vascular permeability in both cases of stimulation when compared with control. However, no difference was observed between treatment groups, suggesting a similar regulation of permeability regardless of which EC surface first receives inflammatory signals. Interestingly, when these results were repeated in our device (the μSiM-MVM) using an established small-molecule permeability methodology, we observed a significant increase in HUVEC permeability when cells were stimulated abluminally with TNF-α with respected to control, which was not observed following luminal treatment. While this discrepancy may be due in part to variations in the model systems (Transwell versus μSiM-MVM), we suspect that the failure to distinguish differences between polarized treatments with TEER may be a result of signal saturation; given the statistical similarity of TEER values when ECs were treated with TNF-α (regardless of side) and thrombin (our barrier disruption positive control), we hypothesize that EC barriers were disrupted to a degree that ion flux was so high that it was insensitive to small differences in the gap size between cells. Because the dextran molecules used for molecular permeability measurements are much larger than ions in TEER, their diffusion should be more sensitive to subtle changes in junctional status when attempting to compare larger permeability values. Of the two measures of barrier function, molecular permeability is also the more physiologically meaningful metric. Altogether, these results demonstrate an important feature of EC apicobasal polarity in regulating ICAM-1 expression and vascular permeability: while ICAM-1 expression may be conserved across cases of systemic and local infection, vascular permeability may be differentially regulated in a manner that is detectable through the flux of small molecules.
In addition to modulating surface associated EC proteins, TNF-α is known to induce the EC secretion of the potent PMN chemoattractant molecule, IL-8 [36]. Polarized secretion of IL-8 following IL-1β stimulation has been previously observed in epithelial cells [37]. To our knowledge, the influence of TNF-α on the direction of IL-8 secretion in ECs, however, has not been previously studied. Here, we found a luminally directed gradient of IL-8 follows luminal TNF-α, and near equal luminal and abluminal IL-8 secretion occurs with abluminal TNF-α. Though we originally anticipated that abluminal stimulation might compel PMN transmigration by creating a chemokine gradient that favored the abluminal channel within our system, our results instead suggest that the luminal stimulation of ECs creates a lumen-directed IL-8 gradient that sequesters PMNs on the apical EC surface. It seems that the lack of a negative gradient with abluminal stimulation is permissive, but not facilitative, of PMN transendothelial migration.
IL-8 interacts with PMN-expressed G-protein coupled receptors, CXCR1 and CXCR2, driving actin cytoskeleton reorganization, integrin conformational changes and ultimately directed migration [38] towards the highest perceived chemoattractant concentration. While this mechanism is key in the recruitment of PMNs to the site of infection, overstimulation can lead to receptor desensitization and decreased PMN-EC interactions [39, 40]. In addition to soluble IL-8, proteoglycan-bound IL-8 plays a major role in directed leukocyte diapedesis [41]. In a study by Marshall and colleagues, a reduction in heparin sulfate (a proteoglycan to which IL-8 may bind) sheading (a known effect of TNF-α activity [42]) resulted in an increase in PMN transmigration suggesting the importance of the EC surface bound chemokine in directing this response [43]. Given this literature, we can suggest two conclusions based on our results: (i) elevated luminal IL-8 content is a result of increased proteoglycan sheading in response to luminal TNF-α, which in turn, due to the lack of surface bound IL-8 and elevated soluble IL-8, may reduce the ability of PMNs to transmigrate or (ii) elevated luminal IL-8 is a result of increase mRNA induction and secretion in response to luminal TNF-α, which functions to sequester PMNs through CXCR1/2 desensitization, regardless of the status of the EC proteoglycans and their IL-8 content. Future work should address these open questions by studying the effects of polarized cytokine stimulation of EC glycocalyx sheading and PMN receptor desensitization.
The lack of PMN transmigration in response to exogenous bilateral IL-8 across unstimulated ECs suggests that other TNF-α effects were responsible for transmigration in the case of abluminal EC stimulation. We hypothesized that ICAM-1 expression might be polarized differently following luminal versus abluminal stimulation, thus guiding or halting PMNs across the endothelium. While confocal analysis revealed that ICAM-1 labeling appears to occur on both the apical and basal surfaces of ECs, independent of luminal or abluminal TNF-α treatment, the latter treatment did result in pronounced, ICAM-1-rich membrane ruffles extending from the apical surface of ECs. Previously, Wojciak-Stothard and colleagues demonstrated the Rac-dependent formation of EC membrane ruffles in response to TNF-α stimulation [44]. Furthermore, van Buul and colleagues have implicated the formation of apical membrane ‘cups’ rich in ICAM-1 in the transmigration of leukocytes. Thus, ECs may form membrane ruffles dense in ICAM-1 in response to abluminal TNF-α as a means to recruit PMNs toward the infection foci in the underlying tissue, but testing this hypothesis will require the design of new experiments that eliminate ruffles without affecting ICAM-1 expression. We did, however, conduct ICAM-1 function blocking experiments showing significantly reduced PMN transmigration across abluminally stimulated ECs compared with controls.
The μSiM-MVM uses an optically transparent and highly permeable nanoporous membrane to create luminal and abluminal compartments [15, 20, 22–24]. The glass-like transparency allowed us to monitor live PMN migration dynamics without the need for exogenous dyes. In so doing, we found a direct correlation between cytokine presence and PMN dynamics (speed and persistence), uncoupled from luminal or abluminal EC stimulation. The increase in luminal PMN speed following apical EC stimulation is consistent with previous results [45], which noted an increase in ICAM-1 engagement and a subsequent increase in EC stiffness correlated with elevated PMN speed. An inverse relationship between PMN speed and persistence (increased speed = decreased persistence) has also been reported previously [46]. Building on these earlier findings, we found that PMN speed and persistence are indistinguishable in cases of luminal or abluminal EC stimulation. These results are supported by our epifluorescence and confocal data showing indistinguishable increases in ICAM-1 levels for luminal versus abluminal TNF-α.
Interestingly, PMNs crawled faster but with less persistence in the perivascular space (between the ECs and the nanoporous membrane) when transmigration was driven by TNF-a/IL-8 as compared with fMLP. This may indicate important differences between cytokine and bacterial-derived chemoattractants in directing transmigration. While cytokines invoke a cascade of signaling events on both ECs and PMNs that appear to promote coordination, fMLP acts directly on PMNs and has no known receptors on ECs. Slower speeds with higher persistence in the case of fMLP suggest a determination to follow unambiguous signals, while faster speeds and lower persistence in the case of TNF-a/IL-8 suggest probing, possibly stimulated by more subtle and less potent sources. Much more can be done to study these scenarios in the μSiM-MVM, including the addition of a collagen gel to monitor the migration of PMNs on the tissue side of the device in 3D [22, 23].
It should be noted that while the μSiM-MVM does provide a highly controlled platform to molecularly deconstruct the EC response to polarized cytokine delivery, it cannot account for all complexities surrounding the in vivo vascular anatomy. For the purpose of this study, the μSiM-MVM does not incorporate the co-culture of proximal cell types seen in tissues in vivo (e.g. lung epithelial cells, pericytes or tissue resident macrophages). Development of organ-specific microvasculature models that enable co-culture of other relevant cell types may aid in the investigation of these phenomena in a narrowed context. Furthermore, our studies examining the effect of polarized inflammation were performed on EC barriers stimulated with TNF-α for 24 h. While this is an established and highly relevant time-point in the pathogenesis of inflammation [3, 31, 47], it does not account for the potential differences in effects of short-term inflammation (e.g. 4 h). One of the challenges of early timepoint studies with primary human PMNs is the short bench life of the cells. Once isolated, PMNs are viable for study for 5–6 h; hence in this work, all transmigration studies were performed within 5 h of blood draw. Unfortunately, this condition limits the ability to simultaneously prepare μSiM-MVMs for short-term stimulation studies. Nonetheless, future work would benefit from investigating earlier timepoints, potentially with the use of neutrophil-like HL-60 cells to overcome the time-constraints associated with the recruitment and collection of healthy donor PMNs.
In summary, this study provides evidence for important functional differences in the response of vascular ECs to luminal versus abluminal stimulation with the inflammatory cytokine, TNF-α. This understanding may ultimately lead to the development of therapies that consider EC apicobasal polarity to safely suppress maladaptive immune function. Designing interventions capable of restoring the function of the vasculature while preserving the remedial innate immune response must be a feature of future sepsis interventions if they are to avoid the failures of the past. Platforms such as the μSiM-MVM that enable reductionist studies using human cell lines and physiologically relevant cytokines can reveal powerful and biologically relevant conclusions that will ultimately hasten the discovery of these new therapeutics.
Supplementary Material
ACKNOWLEDGEMENTS
We gratefully acknowledge the help and support from R. Breidenstein and D. Galvin III for efforts in device fabrication, M. Youngman for phlebotomy work and B. Engelhardt, S. Aydin, S. Soldati and M. Nielsen for guidance during manuscript preparation.
Contributor Information
Alec T Salminen, Email: asalmine@ur.rochester.edu, Department of Biomedical Engineering, University of Rochester, Rochester, NY, USA.
Jeffrey Tithof, Email: jtithof@ur.rochester.edu, Department of Mechanical Engineering, University of Rochester, Rochester, NY, USA.
Yara Izhiman, Email: yizhiman@u.Rochester.edu, Department of Biomedical Engineering, University of Rochester, Rochester, NY, USA.
Elysia A Masters, Email: emaster5@ur.rochester.edu, Department of Biomedical Engineering, University of Rochester, Rochester, NY, USA.
Molly C McCloskey, Email: mmcclos3@ur.rochester.edu, Department of Biomedical Engineering, University of Rochester, Rochester, NY, USA.
Thomas R Gaborski, Email: trgbme@rit.edu, Department of Biomedical Engineering, University of Rochester, Rochester, NY, USA; Department of Biomedical Engineering, Rochester Institute of Technology, Rochester, NY, USA.
Douglas H Kelley, Email: d.h.kelley@rochester.edu, Department of Mechanical Engineering, University of Rochester, Rochester, NY, USA.
Anthony P Pietropaoli, Email: Anthony_Pietropaoli@URMC.Rochester.edu, Medicine, Pulmonary Disease and Critical Care, University of Rochester Medical Center, Rochester, NY, USA.
Richard E Waugh, Email: richard.waugh@rochester.edu, Department of Biomedical Engineering, University of Rochester, Rochester, NY, USA.
James L McGrath, Email: jmcgrath@ur.rochester.edu, Department of Biomedical Engineering, University of Rochester, Rochester, NY, USA.
Conflicts of Interest
J.M. and T.G. are co-founders of SiMPore, an early-stage company commercializing ultrathin silicon-based technologies.
Funding
This work was supported by the US Public Health Service through the National Institutes of Health: [R01 HL125265 to R.W. and R43 GM137651 to J.L.M., R35GM119623 to T.G., T32 HL066988 to A.S., 1RF1AG057575-01 to D.H.K.].
References
- 1. Hotchkiss RS, Moldawer LL, Opal SM et al. Sepsis and septic shock. Nat Rev Dis Primers 2016;2:16045. [DOI] [PMC free article] [PubMed] [Google Scholar]
- 2. Zeni F, Freeman B, Natanson C. Anti-inflammatory therapies to treat sepsis and septic shock: a reassessment. Crit Care Med 1997;25:1095–100. [DOI] [PubMed] [Google Scholar]
- 3. Goldblum SE, Hennig B, Jay M et al. Tumor necrosis factor alpha-induced pulmonary vascular endothelial injury. Infect Immun 1989;57:1218–26. [DOI] [PMC free article] [PubMed] [Google Scholar]
- 4. Puhlmann M, Weinreich DM, Farma JM et al. Interleukin-1beta induced vascular permeability is dependent on induction of endothelial tissue factor (TF) activity. J Transl Med 2005;3:37. [DOI] [PMC free article] [PubMed] [Google Scholar]
- 5. Zheng X, Zhang W, Hu X. Different concentrations of lipopolysaccharide regulate barrier function through the PI3K/Akt signalling pathway in human pulmonary microvascular endothelial cells. Sci Rep 2018;8:9963. [DOI] [PMC free article] [PubMed] [Google Scholar]
- 6. Filippi M-D. Neutrophil transendothelial migration: updates and new perspectives. Blood 2019;133:2149. [DOI] [PMC free article] [PubMed] [Google Scholar]
- 7. Opal SM, Poll T. Endothelial barrier dysfunction in septic shock. J Intern Med 2015;277:277–93. [DOI] [PubMed] [Google Scholar]
- 8. Gimbrone MA Jr, García-Cardeña G. Endothelial cell dysfunction and the pathobiology of atherosclerosis. Circ Res 2016;118:620–36. [DOI] [PMC free article] [PubMed] [Google Scholar]
- 9. Teuwen L-A, Geldhof V, Pasut A et al. COVID-19: the vasculature unleashed. Nat Rev Immunol 2020;20:389–391. [DOI] [PMC free article] [PubMed] [Google Scholar]
- 10. Worzfeld T, Schwaninger M. Apicobasal polarity of brain endothelial cells. J Cereb Blood Flow Metab 2016;36:340–62. [DOI] [PMC free article] [PubMed] [Google Scholar]
- 11. Brinkmann BF, Steinbacher T, Hartmann C et al. VE-cadherin interacts with cell polarity protein Pals1 to regulate vascular lumen formation. Mol Biol Cell 2016;27:2811–21. [DOI] [PMC free article] [PubMed] [Google Scholar]
- 12. Yamamoto H, Ehling M, Kato K et al. Integrin beta1 controls VE-cadherin localization and blood vessel stability. Nat Commun 2015;6:6429. [DOI] [PubMed] [Google Scholar]
- 13. Lizama CO, Zovein AC. Polarizing pathways: balancing endothelial polarity, permeability, and lumen formation. Exp Cell Res 2013;319:1247–54. [DOI] [PMC free article] [PubMed] [Google Scholar]
- 14. Zovein AC, Luque A, Turlo KA et al. Beta1 integrin establishes endothelial cell polarity and arteriolar lumen formation via a Par3-dependent mechanism. Dev Cell 2010;18:39–51. [DOI] [PMC free article] [PubMed] [Google Scholar]
- 15. Mossu A, Rosito M, Khire T et al. A silicon nanomembrane platform for the visualization of immune cell trafficking acros the human blood–brain barier under flow. J Cereb Blood Flow Metab 2018;39:395–410. [DOI] [PMC free article] [PubMed] [Google Scholar]
- 16. Shen XF, Cao K, Jiang JP et al. Neutrophil dysregulation during sepsis: an overview and update. J Cell Mol Med 2017;21:1687–97. [DOI] [PMC free article] [PubMed] [Google Scholar]
- 17. Lerman YV, Kim M. Neutrophil migration under normal and sepsis conditions. Cardiovasc Hematol Disord Drug Targets 2015;15:19–28. [DOI] [PMC free article] [PubMed] [Google Scholar]
- 18. Ley K, Laudanna C, Cybulsky MI et al. Getting to the site of inflammation: the leukocyte adhesion cascade updated. Nat Rev Immunol 2007;7:678–89. [DOI] [PubMed] [Google Scholar]
- 19. Masters EA, Salminen AT, Begolo S et al. An in vitro platform for elucidating the molecular genetics of S. aureus invasion of the osteocyte lacuno-canalicular network during chronic osteomyelitis. Nanomed Nanotechnol Biol Med 2019;21:102039. [DOI] [PMC free article] [PubMed] [Google Scholar]
- 20. Hudecz D, Khire T, Chung HL et al. Ultrathin silicon membranes for in situ optical analysis of nanoparticle translocation across a human blood–brain barrier model. ACS Nano 2020;14:1111–1122. [DOI] [PMC free article] [PubMed] [Google Scholar]
- 21. Carter RN, Casillo SM, Mazzocchi AR et al. Ultrathin transparent membranes for cellular barrier and co-culture models. Biofabrication 2017;9:015019. [DOI] [PMC free article] [PubMed] [Google Scholar]
- 22. Salminen AT, Zhang J, Madejski GR et al. Ultrathin dual-scale nano- and microporous membranes for vascular transmigration models. Small 2019;15:e1804111. [DOI] [PMC free article] [PubMed] [Google Scholar]
- 23. Khire T, Salminen A, Swamy H et al. Microvascular mimetics for the study of leukocyte-endothelial interactions. Cell Mol Bioeng 2020;13:125–139. [DOI] [PMC free article] [PubMed] [Google Scholar]
- 24. DesOrmeaux JP, Winans JD, Wayson SE et al. Nanoporous silicon nitride membranes fabricated from porous nanocrystalline silicon templates. Nanoscale 2014;6:10798–805. [DOI] [PubMed] [Google Scholar]
- 25. Chung HH, Chan CK, Khire TS et al. Highly permeable silicon membranes for shear free chemotaxis and rapid cell labeling. Lab Chip 2014;14:2456–68. [DOI] [PMC free article] [PubMed] [Google Scholar]
- 26. Kelley DH, Ouellette NT. Using particle tracking to measure flow instabilities in an undergraduate laboratory experiment. Am J Phys 2011;79:267–73. [Google Scholar]
- 27. DiVietro JA, Smith MJ, Smith BRE et al. Immobilized IL-8 triggers progressive activation of neutrophils rolling in vitro on P-selectin and intercellular adhesion molecule-1. J Immunol 2001;167:4017. [DOI] [PubMed] [Google Scholar]
- 28. Middleton J, Neil S, Wintle J et al. Transcytosis and surface presentation of IL-8 by venular endothelial cells. Cell 1997;91:385–95. [DOI] [PubMed] [Google Scholar]
- 29. Mukaida N. Pathophysiological roles of interleukin-8/CXCL8 in pulmonary diseases. Am J Physiol Lung Cell Mol Physiol 2003;284:L566–77. [DOI] [PubMed] [Google Scholar]
- 30. Sônego F, Castanheira FVES, Ferreira RG et al. Paradoxical roles of the neutrophil in sepsis: protective and deleterious. Front Immunol 2016;7:155. [DOI] [PMC free article] [PubMed] [Google Scholar]
- 31. Yang L, Froio RM, Sciuto TE et al. ICAM-1 regulates neutrophil adhesion and transcellular migration of TNF-alpha-activated vascular endothelium under flow. Blood 2005;106:584–92. [DOI] [PMC free article] [PubMed] [Google Scholar]
- 32. Dejana E, Orsenigo F, Lampugnani MG. The role of adherens junctions and VE-cadherin in the control of vascular permeability. J Cell Sci 2008;121:2115–22. [DOI] [PubMed] [Google Scholar]
- 33. Muller WA. The role of PECAM-1 (CD31) in leukocyte emigration: studies in vitro and in vivo. J Leukoc Biol 1995;57:523–8. [DOI] [PubMed] [Google Scholar]
- 34. Romer LH, McLean NV, Yan HC et al. IFN-gamma and TNF-alpha induce redistribution of PECAM-1 (CD31) on human endothelial cells. J Immunol 1995;154:6582–92. [PubMed] [Google Scholar]
- 35. Morzycki W, Sadowska J, Issekutz AC. Interleukin-1 and tumour necrosis factor alpha induced polymorphonuclear leukocyte-endothelial cell adhesion and transendothelial migration in vitro: the effect of apical versus basal monolayer stimulation. Immunol Lett 1990;25:331–40. [DOI] [PubMed] [Google Scholar]
- 36. Smart SJ, Casale TB. TNF-alpha-induced transendothelial neutrophil migration is IL-8 dependent. Am J Phys 1994;266:L238–45. [DOI] [PubMed] [Google Scholar]
- 37. Holtkamp GM, Van Rossem M, Vos AF et al. Polarized secretion of IL-6 and IL-8 by human retinal pigment epithelial cells. Clin Exp Immunol 1998;112:34–43. [DOI] [PMC free article] [PubMed] [Google Scholar]
- 38. Zeilhofer HU, Schorr W. Role of interleukin-8 in neutrophil signaling. Curr Opin Hematol 2000;7:178–82. [DOI] [PubMed] [Google Scholar]
- 39. Luscinskas FW, Kiely JM, Ding H et al. In vitro inhibitory effect of IL-8 and other chemoattractants on neutrophil-endothelial adhesive interactions. J Immunol 1992;149:2163–71. [PubMed] [Google Scholar]
- 40. Huber AR, Kunkel SL, Todd RF et al. Regulation of transendothelial neutrophil migration by endogenous interleukin-8. Science 1991;254:99–102. [DOI] [PubMed] [Google Scholar]
- 41. Hoogewerf AJ, Kuschert GS, Proudfoot AE et al. Glycosaminoglycans mediate cell surface oligomerization of chemokines. Biochemistry 1997;36:13570–8. [DOI] [PubMed] [Google Scholar]
- 42. Nieuwdorp M, Meuwese MC, Mooij HL et al. Tumor necrosis factor-alpha inhibition protects against endotoxin-induced endothelial glycocalyx perturbation. Atherosclerosis 2009;202:296–303. [DOI] [PubMed] [Google Scholar]
- 43. Marshall LJ, Ramdin LS, Brooks T et al. Plasminogen activator inhibitor-1 supports IL-8-mediated neutrophil transendothelial migration by inhibition of the constitutive shedding of endothelial IL-8/heparan sulfate/syndecan-1 complexes. J Immunol 2003;171:2057–65. [DOI] [PubMed] [Google Scholar]
- 44. Wójciak-Stothard B, Entwistle A, Garg R et al. Regulation of TNF-α-induced reorganization of the actin cytoskeleton and cell-cell junctions by rho, Rac, and Cdc42 in human endothelial cells. J Cell Physiol 1998;176:150–65. [DOI] [PubMed] [Google Scholar]
- 45. Lyck R, Enzmann G. The physiological roles of ICAM-1 and ICAM-2 in neutrophil migration into tissues. Curr Opin Hematol 2015;22:53–9. [DOI] [PubMed] [Google Scholar]
- 46. Oakes PW, Patel DC, Morin NA et al. Neutrophil morphology and migration are affected by substrate elasticity. Blood 2009;114:1387–95. [DOI] [PMC free article] [PubMed] [Google Scholar]
- 47. Brown JA, Pensabene V, Markov DA et al. Recreating blood-brain barrier physiology and structure on chip: a novel neurovascular microfluidic bioreactor. Biomicrofluidics 2015;9:054124. [DOI] [PMC free article] [PubMed] [Google Scholar]
Associated Data
This section collects any data citations, data availability statements, or supplementary materials included in this article.