

Abstract
When the novel coronavirus entered the US, most US states implemented lockdown measures. In April–May 2020, state governments started political discussions about whether it would be worth the risk to reduce protective measures. In a highly politicized environment, risk perceptions and preferences for risk mitigation may vary by political inclinations. In April–May 2020, we surveyed a nationally representative sample of 5517 members of the University of Southern California’s Understanding America Study. Of those, 37% identified as Democrats, 32% as Republican, and 31% as Third Party/Independent. Overall, Democrats perceived more risk associated with COVID-19 than Republicans, including for getting infected, being hospitalized and dying if infected, as well as running out of money as a result of the pandemic. Democrats were also more likely than Republicans to express concerns that states would lift economic restrictions too quickly, and to report mask use and social distancing. Generally, participants who identified as Third Party/Independent fell in between. Democrats were more likely to report watching MSNBC or CNN (vs. not), while Republicans were more likely to report watching Fox News (vs. not), and Third Party/Independents tended to watch neither. However, political inclinations predicted reported policy preferences, mask use, and social distancing, in analyses that accounted for differences in use of media sources, risk perceptions, and demographic background. In these analyses, participants’ reported media use added to the partisan divide in preferences for the timing of lifting economic restrictions and reported protective behaviors. Implications for risk communication are discussed.
Supplementary Information
The online version of this article (10.1007/s11166-020-09336-3) contains supplementary material, which is available to authorized users.
Keywords: COVID-19 risk perceptions, Political beliefs and polarization, Probability-based internet panel, Pandemic preparedness, Health policy
Introduction
When COVID-19 started its spread across the United States, many states initially announced school closures and bans of large gatherings (Yeung et al. 2020). To limit disease transmission, the Centers for Disease Control and Prevention (2020a) recommended protective behaviors such as hand hygiene and social distancing. Mass adoption of these behaviors is especially important when pharmacological interventions are not yet available (Bruine de Bruin et al. 2006).
According to theories of decisions about health behavior, people who perceive greater risks are more willing to implement protective behaviors and more likely to prefer government policies designed to mitigate risk (Fischhoff 2013; Rosenstock 1974; Rogers 1975). Links between perceived risks and protective behaviors have traditionally been studied for familiar risks like seasonal influenza (Brewer et al. 2004; Bruine de Bruin and Carman 2018). With emerging diseases like COVID-19, objective risk information is, at least initially, scarce, uncertain, and subject to change. Yet, as the COVID-19 crisis progressed in the United States in March 2020, risk perceptions of getting COVID-19 and dying if infected were already associated with taking more protective actions, such as handwashing and social distancing (Bruine de Bruin and Bennett 2020).
However, perceptions of risk may be socially constructed, and therefore vary with political inclinations (Kasperson and Kasperson 1996; Leiserowitz 2006; Sjöberg 2000). A recent paper in Nature Human Behaviour warned that political polarization during a pandemic may lead individuals with different political inclinations to arrive at different conclusions about the level of threat and appropriate actions to be taken (van Bavel et al. 2020). In a risk perception study conducted across ten countries, individualistic worldviews and prosocial values were a stronger predictor of risk perceptions of getting COVID-19 than were knowledge about the risk (Dryhurst et al. 2020).
Especially in the United States, self-identifying as Democrat rather than Republican has been associated with higher perceived risk of getting COVID-19, perhaps reflecting differences in worldviews and values (Dryhurst et al. 2020). These differences were also reflected in the political discourse about COVID-19 in the United States: Republican President Trump initially aligned COVID-19 risks with seasonal influenza risks and argued that the country did not shut down for 36,000 influenza deaths per year (National Public Radio 2020). As the economic impacts of the COVID-19 pandemic became clear, calls for re-opening the economy started emerging, especially from Republican politicians (New York Times 2020a).
Political polarization of risk may be amplified due to different news sources being preferred by individuals varying in political inclinations (Iyengar and Hahn 2009). Exposure to media coverage has been linked to risk perceptions and policy-specific knowledge (Barabas and Jerit 2009; Combs and Slovic 1978). In the United States, self-identified Democrats tend to prefer CNN while self-identified Republicans tend to prefer Fox News (Iyengar and Hahn 2009). Indeed, television news coverage may be relatively partisan, with Fox News having the most conservative audience among major media outlets (Hamilton 2006; cf. Lott and Hassett 2014). Polls have shown that Fox News viewers were less worried about COVID-19 than CNN viewers, as early as March 2020 (Motta et al. 2020).
Although it has been documented that the political inclinations and associated media use of US residents predict their risk perceptions and worry about getting COVID-19 (Dryhurst et al. 2020; Motta et al. 2020), less is known about their contribution to risk perceptions for experiencing negative economic consequences during the pandemic, their preferences for the timing of opening the economy, and their tendencies to implement protective behaviors. Before the COVID-19 pandemic, a majority of US residents across the political spectrum viewed individuals as personally responsible for their own protective health behaviors to mitigate their health risks (Robert and Booske 2011). In contrast, there was a political divide in regard to implementing societal change to improve health outcomes, for which Democrats showed more support than Republicans (Robert and Booske 2011; see also Gollust et al. 2009). Thus, people’s political inclinations may be especially important for understanding their policy preferences as compared to risk perceptions and protective behaviors.
While the COVID-19 outbreak was affecting the United States in April–May 2020, we sought to understand how people’s political inclinations and media use were associated with (1) their risk perceptions for getting infected with COVID-19, getting hospitalized or dying from it, and running out of money; (2) their preferences for government policies, and (3) their tendencies to implement protective behaviors such as wearing face masks, hand washing and social distancing.
Method
Sample
Survey data collection was approved by the University of Southern California’s Institutional Review Board, as part of the Understanding America Study (UAS) (see https://uasdata.usc.edu for more information about the UAS Longitudinal Study). To obtain a nationally representative sample, UAS members were recruited from randomly selected US addresses, sampling probabilities were adjusted for underrepresented populations, and internet-connected tablets were provided to consenting individuals as needed (Alattar et al. 2018; Kapteyn et al. 2020). Address-recruited online panels tend to be better than opt-in online panels at achieving national representativeness and minimizing survey errors (Kennedy et al. 2020; Tourangeau et al. 2013). Following the survey literature (Valliant et al. 2013), post-stratification weights were used to further align the present sample with the U.S. adult population regarding age, gender, race/ethnicity, education and location (see https://uasdata.usc.edu/page/Weights for more information about how the survey weights were constructed).
We analyzed survey data collected in April 29–May 26, 2020, with 5517 of 6117 (90%) invited UAS members who also reported their political affiliation in a separate survey a month later. After applying post-stratification weights (described above), descriptive statistics indicated that of these participants, 20% were aged 65 and older, 48% male, 66% non-Hispanic white, 13% were non-Hispanic African-American, 17% Hispanic/Latinx, 8% other ethnic minority groups, 34% with a college degree. Table S1 in the Electronic Supplementary Material shows the weighted and unweighted demographic characteristics of responders, as compared to non-responders, as well as the national US population. The survey dataset (numbered UAS 242) and associated documentation are publicly available from the UAS website (https://uasdata.usc.edu/index.php).
Measures
Risk perceptions
We asked participants the following risk perception questions: (1) “On a scale from 0 to 100%, what is the chance that you will get the coronavirus in the next three months?”; (2) “If you do get infected with the coronavirus, what is the percent chance you will be hospitalized (spend at least one night in the hospital) from it?”; (3) “If you do get infected with the coronavirus, what is the percent chance you will die from it?” and (4) “What is the percent chance that you will run out of money because of the coronavirus in the next three months?” Each risk perception question was presented with a validated visual linear response scale ranging from 0% to 100% (Bruine de Bruin and Carman 2018).
Policy preferences
To assess their preferences for opening up the economy, we asked participants the following question: “Thinking about the decisions by a number of state governments to impose significant restrictions on public activity because of the coronavirus outbreak, is your greater concern that state governments will (a) lift the restrictions too quickly or (b) not lift the restrictions quickly enough?” The same question was asked about their own state government.
Protective behaviors
We also asked participants to report on protective behaviors: “Which of the following have you done in the last seven days to keep yourself safe from coronavirus in addition to what you normally do?” Subsequently, participants indicated whether or not (yes/no) they had implemented the following protective behaviors recommended by the Centers for Disease Control and Prevention (2020a): (1) “worn a mask or other face covering”; (2) “washed hands with soap or used hand sanitizer several times per day,” (3) “avoided public spaces, gatherings, or crowds,” (4) “avoided contact with people who could be high-risk”, and (5) “canceled or postponed air travel for work” and “canceled or postponed air travel for pleasure”, for which responses were combined.
Media sources used
Participants were asked: “Which of the following information sources have you used to learn about the coronavirus in the past 7 days?” Response options included Fox News, MSNBC, and CNN.
Political inclination
On a separate survey conducted a month later, participants were asked: “Regardless of if or how you are registered to vote, are you more closely aligned with any of the following?” Response options included: Democrats, Republicans, Independents (no political party), Libertarians, Green Party, some other party, and not aligned with any political party. We grouped participants who did not identify as Democrat and Republican together in one category referred to as ‘Third Party/Independent’.
Results
Demographic differences by political inclination and media sources used
In our sample, 37% of participants identified as Democrats, 32% as Republican, and 31% as Third Party/Independent. Additionally, 27% of participants indicated watching Fox News as their source of information about COVID-19 over the past 7 days, while 33% indicated watching MSNBC or CNN.
Table 1 shows differences in media sources used, by political inclination. While only 18% of Democrats reported watching Fox News for their information about COVID-19 over the past 7 days, 41% of Republicans reported doing so. By comparison, 57% of Democrats and 13% of Republicans reported watching MSNBC or CNN for their information about COVID-19 over the past 7 days. Participants who identified as Third Party/Independent fell in between, with 22% reporting that they watched Fox News, and 26% reporting that they watched MSNBC or CNN to obtain information about COVID-19. Overall, watching Fox News (vs. not) was more likely among Republicans, watching MSNBC or CNN (vs. not) was more likely among Democrats, while the participants identifying as Third Party/Independent were more likely to report that they did not use either source (Table 2).
Table 1.
Differences by political inclination
| Variable | Democrats (N = 2025) |
Republicans (N = 1784) |
Third Party/Independent (N = 1708) |
|---|---|---|---|
| Media source used (%) | |||
| Used Fox News | 18% | 41%do | 22%d |
| Used MSNBC or CNN | 57%ro | 13% | 26%r |
| Demographics (%) | |||
| Aged 65 or older | 21%o | 25%do | 12% |
| Male | 45% | 55%do | 47% |
| White | 50% | 84%do | 66%d |
| African-American | 23%ro | 2% | 12%r |
| Hispanic/Latinx | 21%ro | 12% | 17%r |
| Other minority | 9%r | 6% | 9%r |
| College degree | 43%ro | 29% | 29% |
| Mean (SD) COVID-19 risk perceptions | |||
| Getting infected | 26.11 (22.13)ro | 21.96 (21.33) | 23.82 (22.17)r |
| Getting hospitalized if infected | 30.83 (28.43)ro | 27.25 (28.65) | 27.42 (27.23) |
| Dying if infected | 22.14 (25.54)r | 18.44 (24.31) | 21.32 (24.72)r |
| Running out of money | 20.87 (28.50)r | 13.25 (23.01) | 21.11 (27.33)r |
| Policy preferences (%) | |||
| Concern states open too quickly | 90%ro | 48% | 71%r |
| Concern own state open too quickly | 88%ro | 46% | 69%r |
| Protective behaviors (%) | |||
| Worn mask or face covering | 88%ro | 75% | 78% |
| Washed hands | 95%ro | 93%o | 91% |
| Avoided public spaces or crowds | 89%ro | 79% | 83%r |
| Avoided high-risk individuals | 84%ro | 80% | 78% |
| Canceled travel | 51%ro | 45% | 47% |
Post-stratification weights were applied. Chi-square tests examined differences in demographic variables, policy preferences and protective behaviors. T-tests examined differences in COVID-19 risk perceptions. r=Significantly higher than Republicans (p < .05). d = significantly higher than Democrats (p < .05). o = significantly higher than others (p < .05). White, African-American, and other minorities were not Hispanic/Latinx
Table 2.
Differences by media sources used
| Fox News | MSNBC or CNN | |||
|---|---|---|---|---|
| Variable | Did use (N = 1461) |
Did not use (N = 4056) |
Did use (N = 1815) |
Did not use (N = 3702) |
| Political affiliation (%) | ||||
| Democrat | 25% | 41%*** | 63%*** | 24% |
| Republican | 49%*** | 26% | 12% | 42%*** |
| Third Party/Independent | 26% | 33%*** | 25% | 34%*** |
| Demographics (%) | ||||
| Aged 65 or older | 28%*** | 17% | 22%** | 18% |
| Male | 52%** | 47% | 50% | 48% |
| White | 62% | 67%** | 55% | 71%*** |
| African-American | 17%*** | 11% | 22%*** | 9% |
| Hispanic/Latinx | 16% | 17% | 17% | 16% |
| Other minority | 7% | 8% | 10%*** | 7% |
| College degree | 23% | 38%*** | 40%*** | 31% |
| Mean (SD) COVID-19 risk perceptions | ||||
| Getting infected | 22.23 (21.28) | 24.72 (22.16)*** | 25.20 (22.25) ** | 23.50 (21.78) |
| Getting hospitalized if infected | 30.79 (29.92)** | 27.84 (27.49) | 30.71 (28.92) *** | 27.59 (27.76) |
| Dying if infected | 22.26 (25.32)** | 20.12 (24.78) | 22.76 (26.01) *** | 19.67 (24.34) |
| Running out of money | 19.75 (27.93) | 18.24 (26.37) | 19.31 (26.92) | 18.32 (26.74) |
| Policy preferences (%) | ||||
| Concern states open too quickly | 60% | 74%*** | 85%*** | 63% |
| Concern own state open too quickly | 60% | 72%*** | 83%*** | 61% |
| Protective behaviors (%) | ||||
| Worn mask or face covering | 54%*** | 45% | 88%*** | 80% |
| Washed hands | 93% | 93% | 94%** | 92% |
| Avoided public spaces or crowds | 84% | 84% | 91%*** | 80% |
| Avoided high-risk individuals | 83%* | 80% | 84%*** | 79% |
| Canceled travel | 54%*** | 45% | 54%*** | 45% |
Note: Highest values between users and non-users are flagged ***p < 0.001; **p < 0.01; *p < 0.05; Post-stratification weights were applied. Chi-square tests examined differences in demographic variables, policy preferences and protective behaviors. T-tests examined differences in COVID-19 risk perceptions. White, African-American, and other minorities were not Hispanic/Latinx
Table 1 also shows demographic characteristics, by political inclinations. Compared to Republicans, Democrats were significantly less likely to be aged 65 or older, less likely to be male, less likely to be non-Hispanic white and more likely to be non-Hispanic African-American, Hispanic/Latinx, or other minority, and more likely to have a college degree. Participants who identified as Third Party/Independent fell in between Republicans and Democrats in terms of the percent who were male, the percent who were non-Hispanic white, non-Hispanic African-American, Hispanic/Latinx, or other minority, and the percent who had a college degree; they were however significantly younger than both Democrats and Republicans.
Table 2 shows demographic characteristics, by media sources used. Watching Fox News (vs. not) was more likely among participants who were aged 65 or older, male, African-American, and without a college degree. Watching MSNBC or CNN (vs. not) was more likely among participants who were aged 65 or older, African-American or other minority, and with a college degree.
COVID-19 risk perceptions by political inclination and media sources used
Table 1 shows differences in mean reported COVID-19 risk perceptions by participants’ political inclination. Overall, mean reported risk perceptions were found to be significantly higher among Democrats than among Republicans, for getting infected in the next three months (26% vs. 22%), getting hospitalized if infected (31% vs. 27%), dying if infected (22% vs. 18%); and running out of money in the next three months (21% vs. 13%). Participants with Third Party/Independent political inclinations fell in between Democrats and Republicans, in terms of these risk perceptions (Table 1). Compared to national estimates of infection rates, hospitalization rates among those infected, and the case-fatality rate, participants’ mean reported risk perceptions appear to reflect large overestimations.1
However, response distributions showed large disagreements in reported risk perceptions, even among participants reporting the same political inclination (Fig. 1).2 The mass of each response distribution was at the lower end of the scale, though more so for Republicans than for Democrats, with all showing a long tail towards the higher end of the scale (Fig. 1). Additionally, response distributions revealed a seemingly disproportionate use of the 50% response, which was similar among Republicans and Democrats (Fig. 1; Table S2). Partially, this may reflect a tendency among participants to use the 50% response to express that they do not know what answer to give rather than to express a numerical answer (Fischhoff and Bruine de Bruin 1999; Bruine de Bruin & Carman 2012). Even without the 50% responses, mean risk perceptions seemed relatively high, and differences by political inclination remained (Table S2).
Fig. 1.
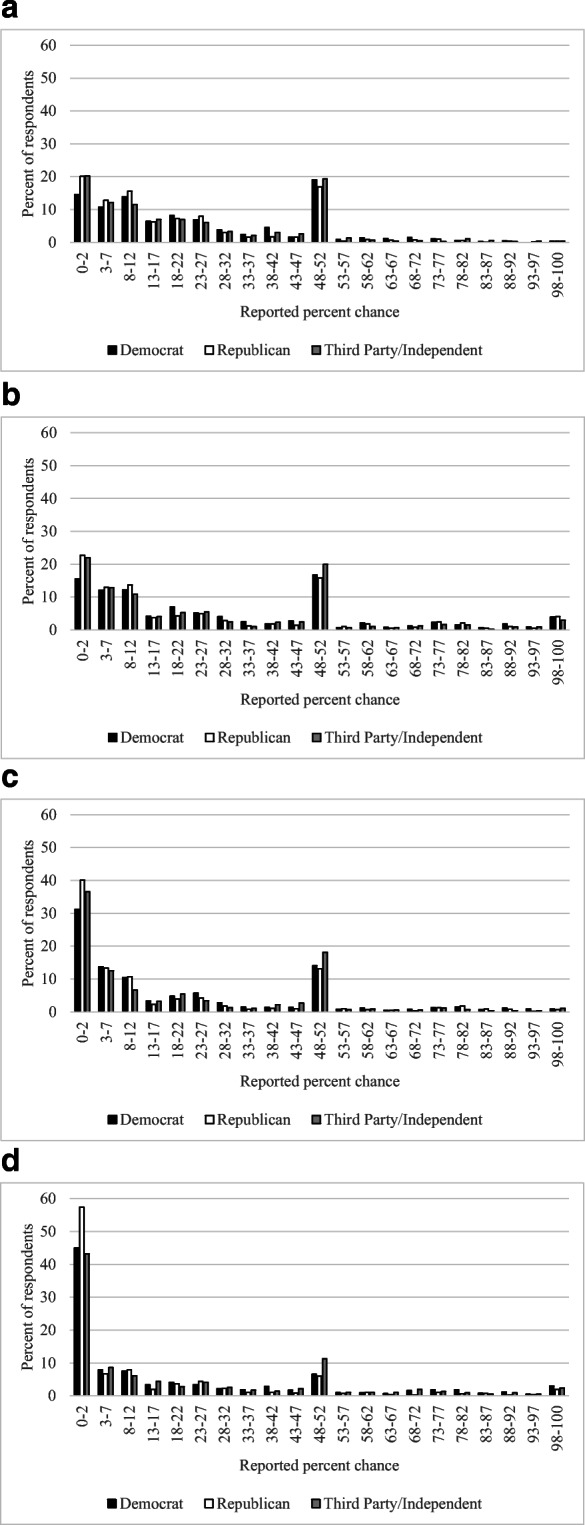
Response distributions for the reported percent chance of (a) getting infected in the next three months; (b) getting hospitalized if infected; (c) dying if infected and (d) running out of money in the next three months. Note: Except for those at the end points, the categories of reported percent chance were created such that the midpoint reflected a response ending in 0 or 5, which tend to be relatively more frequent (Bruine de Bruin and Carman 2018). The relatively excessive use of 50% responses tends to occur across probability questions and may partially reflect participants being unsure what to answer (Fischhoff and Bruine de Bruin 1999; Bruine de Bruin and Carman 2012)
Each of the differences in risk perceptions between Democrats and Republicans that were seen in the descriptive statistics still held in linear regressions that controlled for media sources used and demographics, whether 50% responses were included in the risk perceptions (Table 3; see Table S4 for associated Pearson correlations) or excluded from the risk perceptions (Table S5). Additionally, these regressions suggested that Republicans perceived higher risks than participants identifying as Third Party/Independent, reaching significance for all but the risk of getting infected. These regressions also suggested that the risk perceptions of Democrats and participants with Third Party/Independent inclinations were not significantly different, seen in overlapping confidence intervals for regression estimates.
Table 3.
Unstandardized linear regression coefficients (95% confidence interval), for models predicting COVID-19 risk perceptions
| Perceived risk of getting infected | Perceived risk of getting hospitalized if infected | Perceived risk of dying if infected | Perceived risk of running out of money | |
|---|---|---|---|---|
| Political inclination | ||||
| Democrat (vs. Republican) |
3.94*** (2.28, 5.60) |
4.83*** (2.76, 6.91) |
4.53*** (2.72, 6.34) |
6.28*** (4.36, 8.20) |
| Third Party/Independent (vs. Republican) |
1.40 (0.12, 2.93) |
1.92* (0.01, 3.83) |
4.27*** (2.61, 5.93) |
4.93*** (3.16, 6.68) |
| Media sources used | ||||
| Fox News (vs. not) |
−1.45* (−2.86, −0.28) |
0.76 (−1.01, 2.53) |
−0.26 (−1.81, 1.29) |
2.11* (0.47, 3.74) |
| MSNBC or CNN (vs. not) |
1.14 (−0.26, 2.54) |
1.42 (−0.32, 3.16) |
2.08** (0.56, 3.61) |
−1.17 (−2.78, 0.44) |
| Control variables | ||||
| At risk age group 65+ (vs. younger) |
−1.92* (−3.42, −0.41) |
14.24*** (12.35, 16.12) |
14.05*** (12.41, 15.69) |
−9.30*** (−11.04, −7.56) |
| Male (vs. not) |
−2.12*** (−3.29, −0.95) |
0.06 (−1.41, 1.52) |
−0.96 (−2.24, 0.32) |
−3.96*** (−5.31, −2.60) |
| African-American (vs. White) |
−3.91*** (−5.81, −2.01) |
−0.07 (−2.45, 2.30) |
0.18 (−1.89, 2.25) |
9.01*** (6.82, 11.21) |
| Hispanic/Latinx (vs. White) |
−0.67 (−2.31, 0.98) |
0.32 (−1.73, 2.37) |
0.47 (−1.32, 2.26) |
6.19*** (4.30, 8.09) |
| Other minorities (vs. White) |
0.65 (−1.57, 2.87) |
3.03* (0.25, 5.80) |
0.77 (−1.66, 3.19) |
2.62* (0.06, 5.19) |
| College education (vs. not) |
−0.27 (−1.53, 0.99) |
−8.83*** (−10.40, −7.26) |
−10.42*** (−11.79, −9.05) |
−11.89*** (−13.33, −10.43) |
***p < 0.001; **p < 0.01; *p < 0.05
N = 5517. Post-stratification weights were applied. Significant differences between Democrats and others are seen in non-overlapping confidence intervals (p < .05). Risk perceptions were reported on a 0–100% scale. White, African-American, and other minorities were not Hispanic/Latinx
Table 2 shows that mean reported COVID-19 risk perceptions also showed some variation with preferred media source. Participants who reported watching Fox News (vs. not) reported somewhat lower mean risks of getting infected (22% vs. 25%), but somewhat higher risks of getting hospitalized if infected (31% vs. 28%), dying if infected (22% vs. 20%), and running out of money (20% vs. 18%). In linear regressions that accounted for other characteristics, only the first and last of these were significant (Table 3). Table 2 also shows that participants who reported watching MSNBC or CNN (vs. not) reported somewhat higher risks of getting infected (25% vs. 24%), getting hospitalized if infected (31% vs. 28%), dying if infected (23% vs. 20%), and running out of money (19% vs. 18%). In the linear regressions, only the difference for dying if infected remained significant (Table 3). Removing the 50% responses from these risk perceptions reduced the mean risks but generally showed similar patterns by media source used (Table S3; Table S5).
Additionally, the linear regressions provided insights into other individual differences in risk perceptions. We found that older people perceived less risk of getting infected with COVID-19 and running out of money, but greater risk of getting hospitalized and dying if infected. Men reported seeing less risk than women, especially for getting infected and running out of money. Compared to non-Hispanic white participants, African-American participants perceived less risk for getting infected with COVID-19. African-Americans, Hispanic/Latinx and other minorities all perceived more risk than non-Hispanic whites for running out of money. Having a college education (vs. not) was associated with perceiving less of each of the reported risks, which reached significance for getting hospitalized and dying if infected, as well as for running out of money.
Policy preferences by political inclination and media sources used
Table 1 shows that reported preferences for the timing of lifting restrictions were subject to systematic and significant political polarization. Specifically, Democrats were most likely to express concerns that states in general would lift restrictions too quickly (90%), Republicans were least likely to do so (48%), and the participants who identified as leaning Third Party/Independent fell in between (71%). The response pattern was similar for participants’ own state governments, with 88% of Democrats indicating concern that their own state governments would lift restrictions too quickly, compared to 46% for Republicans and 69% for participants leaning Third Party/Independent. Differences in these policy preferences between Democrats, Republicans, and Third Party/Independents were statistically significant in logistic regressions that accounted for COVID-19 risk perceptions, media use, and demographic characteristics (Table 4; see Table S4 for associated Pearson correlations). The odds of Democrats expressing concern about restrictions being lifted too quickly were 6 times greater than the odds of Republicans doing so, both for states in general and participants’ own state.3 Additionally, the odds of Third Party/Independent participants expressing concern about restrictions being lifted too quickly were 2 times higher than the odds of Republicans doing so, for states in general and participants’ own state. These estimates were largely unaffected by whether or not risk perceptions were included in the model, or whether or not 50% responses were excluded from the risk perceptions (Tables S6–S7).4
Table 4.
Logistic regressions (odd ratios) predicting concern about restrictions being lifted too quickly
| Concern states lift restrictions too quickly | Concern own state lift restrictions too quickly | |
|---|---|---|
| Political inclination | ||
| Democrat (vs. Republican) |
6.02*** (4.94, 7.34) |
5.97*** (4.93, 7.22) |
| Third party/Independent (vs. Republican) |
2.22*** (1.91, 2.59) |
2.27*** (1.95, 2.64) |
| Media sources used | ||
| Fox News (vs. not) |
0.55*** (0.48, 0.65) |
0.66*** (0.57, 0.77) |
| MSNBC or CNN (vs. not) |
2.12*** (1.78, 2.51) |
1.88*** (1.59, 2.22) |
| Transformed COVID-19 risk perceptionsa | ||
| Getting infected |
1.06** (1.02, 1.10) |
1.04* (1.01, 1.08) |
| Getting hospitalized, if infected |
1.06** (1.02, 1.10) |
1.06** (1.02, 1.10) |
| Dying, if infected |
1.08*** (1.04, 1.13) |
1.10*** (1.05, 1.15) |
| Running out of money |
1.00 (1.00, 1.00) |
1.00 (0.98, 1.03) |
| Control variables | ||
| At risk age group 65+ (vs. younger) |
1.35** (1.13, 1.62) |
1.27** (1.06, 1.52) |
| Male (vs. not) |
0.67*** (0.58, 0.76) |
0.70*** (0.62, 0.80) |
| African-American (vs. White) |
1.09 (0.85, 1.39) |
0.99 (0.78, 1.24) |
| Hispanic/Latinx (vs. White) |
1.07 (0.89, 1.29) |
1.03 (0.86, 1.24) |
| Other minorities (vs. White) |
0.89 (0.69, 1.14) |
0.91 (0.71, 1.16) |
| College education (vs. not) |
1.06 (0.91, 1.22) |
0.93 (0.81, 1.07) |
***p < 0.001; **p < 0.01; *p < 0.05; a Risk perceptions were assessed on a 0–100% scale. For these logistic regressions, risk perceptions were divided by 10 so that the odds ratios reflect the change associated with a 10% change in risk perceptions while leaving their significance levels and estimates for the other variables in the model unaffected
N = 5517. Post-stratification weights were applied. White, African-American, and other minorities were not Hispanic/Latinx
Table 2 shows that these policy preferences also differed with participants’ reported use of media sources. Specifically, indicating concern that states in general would open too quickly was less common among participants who watched Fox News than those who did not (60% vs. 74%) and more common among participants who watched MSNBC or CNN than those who did not (85% vs. 63%). A similar pattern was found for own states, among participants who watched Fox News rather than not (60% vs. 72%) and among participants who watched MSNBC or CNN rather than not (83% vs. 61%). The logistic regressions that accounted for other individual differences suggested that participants who watched Fox News (vs. not) had lower odds of expressing concern that restrictions would be lifted too quickly (0.55 for states in general, 0.66 for own state), and participants who watched MSNBC or CNN (vs. not) had higher odds of expressing concern that restrictions would be lifted too quickly (2.12 for states in general, 1.88 for own state). Including risk perceptions (with or without the 50% responses) in the logistic regressions did not affect these odds ratios (Table S6-S7).
Additional variables in the logistic regression provided further insights into individual differences in policy preferences (Table 4). Overall, participants who perceived greater risks of getting infected with COVID-19, getting hospitalized and dying if infected were more likely to express concern that restrictions would be lifted too quickly, by states in general and their own state. Risk perceptions for running out of money did not play an additional role in predicting expressions of these concerns. Participants who were aged 65 or older and who were female were also significantly more likely to be concerned that restrictions would be lifted too quickly.
Protective behaviors by political inclination and media sources used
Looking at the protective behaviors recommended by the Centers for Disease Control and Prevention (2020a), political polarization was most pronounced for reporting the use of a face mask and avoiding public spaces or crowds (Table 1): Although the majority in each group indicated implementing these two protective behaviors, Democrats were the most likely to report implementing the use of a face mask and avoiding public spaces or crowds (88% and 89%, respectively), with Republicans being the least likely to report them (75% and 79%, respectively) and the remaining participants falling in between (78% and 83%, respectively). Democrats and Republicans were significantly different from each other for these two protective behaviors, before and after controlling for demographic characteristics, media use, and risk perceptions (Table 1 and Table 5; see Table S4 for Pearson correlations). Overall, Democrats were 1.76 times more likely than Republicans to wear a face mask, and 1.45 times more likely to avoid public spaces or crowds. Participants identifying as Third party/Independent were no more likely to wear a face mask than Republicans, though they were 1.23 times more likely to avoid public spaces or crowds (Table 5). These estimates were largely unaffected by including or excluding risk perceptions in the models, or removing 50% responses from the risk perceptions (Tables S8–S9).
Table 5.
Logistic regressions predicting self-reported protective behaviors
| Wore mask or face covering | Washed hands | Avoided public spaces or crowds | Avoided high-risk individuals | Canceled travel | |
|---|---|---|---|---|---|
| Political inclination | |||||
| Democrat (vs. Republican) |
1.76*** (1.44, 2.16) |
0.95 (0.69, 1.31) |
1.45** (1.17, 1.79) |
1.15 (0.94, 1.40) |
0.92 (0.79, 1.08) |
| Third Party/Independent (vs. Republican) |
1.09 (0.92, 1.29) |
0.75* (0.57, 0.97) |
1.23* (1.02, 1.48) |
0.90 (0.76, 1.07) |
0.99 (0.86, 1.15) |
| Media sources used | |||||
| Fox News (vs. not) |
1.05 (0.88, 1.24) |
0.85 (0.66, 1.10) |
0.98 (0.82, 1.17) |
1.15 (0.97, 1.36) |
1.31*** (1.14, 1.49) |
| MSNBC or CNN (vs. not) |
1.69*** (1.41, 2.03) |
1.35* (1.04, 1.77) |
2.10*** (1.72, 2.57) |
1.30** (1.10, 1.54) |
1.27*** (1.12, 1.45) |
| Transformed COVID-19 risk perceptionsa | |||||
| Getting infected |
1.03 (0.99, 1.06) |
1.05 (0.99, 1.11) |
1.03 (0.99, 1.08) |
0.98 (0.94, 1.01) |
1.01 (0.98, 1.04) |
| Getting hospitalized, if infected |
1.05* (1.01, 1.09) |
1.15*** (1.08, 1.23) |
1.10*** (1.05, 1.15) |
1.07** (1.03, 1.12) |
1.06*** (1.03, 1.09) |
| Dying, if infected |
1.01 (0.97, 1.06) |
0.88*** (0.82, 0.94) |
0.97 (0.92, 1.01) |
0.98 (0.94, 1.03) |
0.97 (0.93, 1.00) |
| Running out of money |
0.94*** (0.91, 0.96) |
0.98 (0.94, 1.02) |
1.00 (0.97, 1.03) |
1.01 (0.98, 1.04) |
1.05*** (1.03, 1.08) |
| Control variables | |||||
| At risk age group 65+ (vs. younger) |
1.35** (1.10, 1.65) |
1.67** (1.21, 2.30) |
1.83*** (1.46, 2.30) |
1.33** (1.09, 1.62) |
1.18* (1.01, 1.36) |
| Male (vs. female) |
0.83** (0.72, 0.95) |
0.70** (0.56, 0.86) |
0.86 (0.74, 1.00) |
0.80** (0.70, 0.92) |
1.04 (0.93, 1.16) |
| African-American (vs. White) |
1.44** (1.12, 1.85) |
1.17 (0.82, 1.65) |
0.85 (0.66, 1.09) |
0.91 (0.73, 1.14) |
1.99*** (1.66, 2.39) |
| Hispanic/Latinx (vs. White) |
1.42** (1.16, 1.74) |
1.94*** (1.37, 2.76) |
1.26* (1.02, 1.57) |
1.27* (1.04, 1.56) |
2.21*** (1.89, 2.59) |
| Other minorities (vs. White) |
1.46* (1.09, 1.95) |
0.74 (0.52, 1.07) |
0.81 (0.61, 1.07) |
0.85 (0.66, 1.08) |
1.63*** (1.33, 2.00) |
| College education (vs. not) |
1.26** (1.07, 1.47) |
1.72*** (1.32, 2.22) |
1.59*** (1.33, 1.89) |
1.18* (1.01, 1.38) |
1.11 (0.98, 1.26) |
***p < 0.001; **p < 0.01; *p < 0.05;
aRisk perceptions were assessed on a 0–100% scale. For these logistic regressions, risk perceptions were divided by 10 so that the odds ratios reflect the change associated with a 10% change in risk perceptions while leaving their significance levels and estimates for the other variables in the model unaffected
N = 5517. Post-stratification weights were applied. White, African-American, and other minorities were not Hispanic/Latinx
Democrats were also slightly more likely than Republicans and Third Party/Independents to report washing hands (95% vs. 93% and 91%), avoiding high-risk individuals (84% vs. 80% and 78%), and canceling travel (51% vs. 45% and 47%), while Republicans and Third Party/Independents were relatively similar (Table 1). However, Democrats and Republicans were not significantly different from each other in terms of these protective behaviors, in logistic regressions accounting for risk perceptions, media use, and demographic differences (Table 5). Additionally, Third Party/Independents only differed from Republicans in terms of being slightly less likely to report hand washing (Table 5). These estimates were largely unaffected by whether or not risk perceptions were included in the model (Table S8), and whether or not risk perceptions included 50% responses (Table S9).
Table 2 shows that participants who reported watching Fox News were at least as likely as participants who reported not watching Fox News to report engaging in each of the five protective behaviors, including wearing a face mask, washing hands, avoiding public spaces or crowds, avoiding high-risk individuals, and canceling travel. Only canceling travel showed a significant difference, with Fox News viewers having 1.31 times the odds of non-viewers, in logistic regressions accounting for other characteristics (Table 5). Whether or not risk perceptions were included in the model did not affect that general response pattern (Table S8), and neither did the inclusion or exclusion of 50% responses from the risk perceptions (Table S9). Participants who reported watching MSNBC or CNN were more likely to engage in each of the five protective behaviors, as compared to those who did not (Table 2). Each of these differences remained significant after accounting for other characteristics, with viewers of MSNBC or CNN from 1.27 to 2.10 times more likely to implement behaviors (respectively for canceling travel and avoiding public spaces or crowd; Table 5). Considering risk perceptions did not affect those conclusions (Table S6).
Additional variables in the logistic regression provided further insights into individual differences in reported protective behaviors (Table 5). Overall, each of the five protective behaviors was systematically more likely to be reported by participants who perceived greater risks of getting hospitalized if infected, with perceived risk of dying additionally increasing the likelihood of reported handwashing and the perceived risk of running out of money additionally increasing the likelihood of canceling travel. Men were less likely than women to implement all protective behaviors, which reached significance for all but avoiding public spaces or crowds. All protective behaviors were also more likely among participants who were aged 65 or older, were Hispanic/Latinx, and had a college education. Additionally, African-Americans and other minorities were more likely to report using face masks and canceling travel.
Discussion
In an effort to curb the spread of COVID-19 in the United States, school closures and bans of large gatherings were announced in March 2020 (Yeung et al. 2020), and the Centers for Disease Control and Prevention (2020a) recommended protective behaviors such as practicing hand hygiene and social distancing, as well as wearing face masks. However, Republican politicians started calling for re-opening of the US economy as early as April–May 2020 (New York Times 2020a). In a highly politicized environment, individuals who differ in political inclinations may disagree about the risks, policy support, and need for protective behaviors (van Bavel et al. 2020). Moreover, such political polarization may be exacerbated by the different news sources being used by individuals with different political inclinations (Iyengar and Hahn, 2009).
Indeed, in a nationally representative survey with US residents conducted in April–May 2020, we found political polarization on every question about risk perception and risk mitigation that we assessed. Although mean risk perceptions were relatively high for both Democrats and Republicans, Democrats tended to perceive greater risks than Republicans, for getting infected with COVID-19 in the next three months, getting hospitalized or dying if infected, and running out of money in the next three months. These differences in risk perceptions held after accounting for differences in media use and demographic characteristics, suggesting that other political disagreements may have informed the political divide in risk perceptions. Possibly, the political discourse about COVID-19 in the United States, and Republicans’ initial comparisons of COVID-19 risk to seasonal flu risk (National Public Radio 2020) may have played a role.
Democrats were also more likely than Republicans to express concern that their own state and states in general would lift restrictions too quickly. Political differences in the policy preferences remained after controlling for risk perceptions, media use, and demographic differences. These differences may reflect other important political disagreements. For example, even before COVID-19, Democrats were more likely than Republicans to support collective strategies (as opposed to individual efforts) for societal change to promote better health outcomes (Gollust et al. 2009; Robert and Booske 2011).
Compared to preferences for opening the US economy, political differences were less pronounced for protective behaviors, suggesting that Democrats and Republicans were somewhat less divided about their own individual initiatives to protect personal health than about government policies. Although the majority of Democrats and Republicans indicated engaging in each protective behavior, Democrats were more likely than Republicans to report using masks and avoiding public spaces or crowds. This difference remained significant after acounting for differences in risk perceptions, media use and demographics. These two behaviors, mask use and social distancing, may be the most politicized, because their requirement by states may go against Republicans’ preferences (Gollust et al. 2009; Robert and Booske 2011).
Differences by political inclinations tended to be more pronounced than differences by media preferences. Yet, participants’ reported media use did seem to add to the partisan divide in policy preferences and protective behaviors. Watching Fox News (vs. not) was associated with being less likely to express concern about states opening too quickly, while watching MSNBC or CNN (vs. not) was associated with being more likely to do so—even when political inclinations and other characteristics were accounted for. Watching MSNBC or CNN was also systematically associated with increased likelihood of implementing protective behaviors before and after accounting for political inclinations, while watching Fox News was not.
Like any study, ours had limitations. Because we reported on a cross-sectional survey, causal conclusions are unwarranted. Moreover, April–May 2020 may have been a time of particular political polarization, because information about the risks associated with COVID-19 was still uncertain and rapidly changing—perhaps leaving more room for (political) interpretation.
The political divide in COVID-19 risk perceptions, policy preferences, and preferences for protective behaviors pose a potential challenge for practitioners and policy makers tasked with reducing the spread of COVID-19. However, actionable steps have been suggested for reducing political polarization (van Bavel et al. 2020). First, highlighting shared challenges could provide a sense of shared identity (van Bavel et al. 2020). Second, providing consistent and accurate messages should reduce partisan-motivated reasoning and inaccurate beliefs (Ahler and Sood 2018). Finally, political polarization in people’s beliefs may be reduced when there is bipartisan support for COVID-19-related measures (Bolsen, Druckman and Cook 2014). Indeed, research about risk and crisis communication has indicated that prevention efforts are more effective when different sources provide consistent and accurate messaging (Glik 2007; Reynolds 2006). Thus, effectively combating health crises such as COVID-19 requires political leadership that aims to unite rather than divide, and to reach across the aisles.
Supplementary Information
(PDF 303 kb)
Acknowledgements
Marco Angrisani, Daniel Bennett, Jill Darling, Tania Gutsche, and Arie Kapteyn are gratefully acknowledged for their help with this study.
Funding
The project described in this paper relies on data from survey(s) administered by the Understanding America Study, which is maintained by the Center for Economic and Social Research (CESR) at the University of Southern California. The content of this paper is solely the responsibility of the authors and does not necessarily represent the official views of USC or UAS. The collection of the UAS COVID-19 survey data is supported in part by the Bill & Melinda Gates Foundation and by grant U01AG054580 from the National Institute on Aging. Additional funding for the collection of the presented survey data was provided by the Schaeffer Center for Health Policy and Economics. Wändi Bruine de Bruin was supported by the National Science Foundation (#2028683) and the Swedish Riksbankens Jubileumsfond Program on Science and Proven Experience ‘Science and Proven Experience’.
Data availability
https://uasdata.usc.edu/index.php (Survey #242).
Compliance with ethical standards
Conflict of interest/competing interests
None
Footnotes
By August 24, 2020, the percent of US residents who ever had a confirmed infection over the course of the pandemic was estimated to be 2%, the percent of hospitalizations among US residents with confirmed infections was 9%, and the case fatality rate or the percent of deaths among individuals with confirmed infections was 2% (Centers for Disease Control and Prevention 2020b; New York Times 2020b). These estimates may not be comparable to participants’ risk perceptions, because they include individuals below the age of 18 (while our participants were adults aged 18 or older), and include information from the period before the survey was conducted (while participants gave expectations for the future). Participants’ actual risk also varies with age, underlying conditions, and time of exposure. For the perceived risk of running out of money, it is more difficult to find an adequate criterion because it depends on how it is defined. The percent of the US population filing for personal bankruptcy in 2020 was .01% by July 2020 (American Bankruptcy Institute 2020).
Interquartile ranges for risk perceptions were very wide including for getting infected in the next three months (8–50 for Democrats, 5–40 for Republicans, and 5–48 for Third Party/Independents), getting hospitalized if infected (6–50 for Democrats, 4–50 for Republicans, and 4–50 for Third Party/Independents), dying if infected (2–44 for Democrats, 1–30 for Republicans, and 1–48 for Independent/Third Party affiliates), and running out of money in the next three months (0–37 for Democrats, 0–20 for Republicans, 0–44 for Third Party/Independents).
For the variable Democrat (vs. Republican), the odds ratio reflects the odds of Democrats expressing concern divided by the odds of Republicans expressing concern. This can be expressed as pd/(1-pd) divided by pr/(1-pr), with pd = probability of Democrat expressing concern and pr = probability of Republican expressing concern. An odds ratio that is not significantly different from 1.00 (seen in a 95% confidence interval that includes 1.00) would have suggested that Democrats and Republicans had similar odds of expressing concern. However, the odds ratio of approximately 6.00 suggested that the odds of Democrats expressing concerns about restrictions being lifted too quickly were 6 times greater than the odds of Republicans doing so.
For the purpose of these and subsequent logistic regressions, the predictor variables for risk perceptions were divided by 10, so that the odds ratios reflected the change in the dependent variable associated with a 10% change in risk perceptions. Doing so had no effect on the significance levels of these odds ratios, while also leaving the estimates for the other variables in the model unaffected.
Publisher’s note
Springer Nature remains neutral with regard to jurisdictional claims in published maps and institutional affiliations.
References
- Alattar L, Messel M, Rogofsky D. An introduction to the Understanding America Study Internet Panel. Social Security Bulletin. 2018;78:13–28. [Google Scholar]
- American Bankruptcy Institute. (2020). July 2020 Bankruptcy Statistics. https://www.abi.org/newsroom/bankruptcy-statistics.
- Barabas J, Jerit J. Estimating the causal effects of media coverage on policy-specific knowledge. American Journal of Political Science. 2009;53(1):73–89. doi: 10.1111/j.1540-5907.2008.00358.x. [DOI] [Google Scholar]
- Brewer N, Weinstein ND, Cuite CL, Herrington JE. Risk perceptions and their relation to behavior. Annals of Behavioral Medicine. 2004;27(2):125–130. doi: 10.1207/s15324796abm2702_7. [DOI] [PubMed] [Google Scholar]
- Bruine de Bruin W, Bennett D. Relationships between initial COVID-19 risk perceptions and protective health behaviors: A national survey. American Journal of Preventive Medicine. 2020;59(2):157–167. doi: 10.1016/j.amepre.2020.05.001. [DOI] [PMC free article] [PubMed] [Google Scholar]
- Bruine de Bruin W, Carman KG. Measuring risk perceptions: What does the excessive use of 50% mean? Medical Decision Making. 2012;32(2):232–236. doi: 10.1177/0272989X11404077. [DOI] [PMC free article] [PubMed] [Google Scholar]
- Bruine de Bruin W, Carman KG. Measuring subjective probabilities: The effect of response mode on the use of focal responses, validity, and respondents’ evaluations. Risk Analysis. 2018;38(10):2128–2143. doi: 10.1111/risa.13138. [DOI] [PMC free article] [PubMed] [Google Scholar]
- Bruine de Bruin W, Fischhoff B, Brilliant L, Caruso D. Expert judgments of pandemic influenza risks. Global Public Health. 2006;2006(1):178–193. doi: 10.1080/17441690600673940. [DOI] [PubMed] [Google Scholar]
- Centers for Disease Control and Prevention. (2020a). How to protect yourself and others. https://www.cdc.gov/coronavirus/2019-ncov/prevent-gettingsick/prevention.html?CDC_AA_refVal=https%3A%2F%2Fwww.cdc.gov%2Fcoronavirus%2F2019-ncov%2Fneed-extra-precautions%2Fwhat-you-can-do.html. Accessed August 24, 2020.
- Centers for Disease Control and Prevention. (2020b). COVIDView: A weekly surveillance summary of US COVID-19 activity. https://www.cdc.gov/coronavirus/2019-ncov/covid-data/covidview/index.html. Accessed August 24, 2020.
- Combs B, Slovic P. Newspaper coverage and causes of death. Journal of Experimental Psychology: Human Learning and Memory. 1978;4:551–578. [Google Scholar]
- Dryhurst, S., Schneider, C. R., Kerr, J., Freeman, A. F. J., Recchia, G., van der Bles, A. M., Spiegelhalter, D., & van der Linden, S. (2020). Risk perception of COVID-19 around the world. Journal of Risk Research, 1–13. 10.1080/13669877.2020.1758193.
- Fischhoff, B. (2013). Risk Perception and Communication. Routledge.
- Fischhoff B, Bruine de Bruin W. Fifty-fifty=50%? Journal of Behavioral Decision Making. 1999;12(2):149–163. doi: 10.1002/(SICI)1099-0771(199906)12:2<149::AID-BDM314>3.0.CO;2-J. [DOI] [Google Scholar]
- Glik D. Risk communication for public health emergencies. Annual Review of Public Health. 2007;28(1):33–54. doi: 10.1146/annurev.publhealth.28.021406.144123. [DOI] [PubMed] [Google Scholar]
- Gollust SE, Lantz PM, Ubel PA. The polarizing effect of news media messages about the social determinants of health. American Journal of Public Health. 2009;99(12):2160–2167. doi: 10.2105/AJPH.2009.161414. [DOI] [PMC free article] [PubMed] [Google Scholar]
- Hamilton JT. All the news that’s fit to sell: How the market transforms information to news. Princeton: Princeton University Press; 2006. [Google Scholar]
- Iyengar S, Hahn KS. Red media, blue media: Evidence of ideological selectivity in media use. Journal of Communication. 2009;59(1):19–39. doi: 10.1111/j.1460-2466.2008.01402.x. [DOI] [Google Scholar]
- Kapteyn A, Angrisani M, Bennett D, Bruine de Bruin W, Darling J, Gutsche T, Liu Y, Meijer E, Perez-Arce F, Schaner S, Thomas K, Weerman B, [The CESR COVID-19 Task Force] Tracking the effect of the COVID-19 pandemic on the lives of American households. Survey Research Methods. 2020;14:179–186. [Google Scholar]
- Kasperson RE, Kasperson JX. The social amplification and attenuation of risk. The Annals of the American Academy of Political and Social Science. 1996;545(1):95–105. doi: 10.1177/0002716296545001010. [DOI] [Google Scholar]
- Kennedy, C., Hatley, N., Lau, A., Mercer, A., Keeter, S., Ferno, J., & Asare-Marfo, D. (2020). Assessing the risks to online polls from bogus respondents. Pew Research Center. https://www.pewresearch.org/methods/2020/02/18/assessing-the-risks-to-online-polls-from-bogus-respondents/.
- Leiserowitz A. Climate change risk perception and policy preferences: The role of affect, imagery, and values. Climatic Change. 2006;77(1-2):45–72. doi: 10.1007/s10584-006-9059-9. [DOI] [Google Scholar]
- Lott JR, Hassett KA. Is newspaper coverage of economic events politically biased? Public Choice. 2014;160(1-2):65–108. doi: 10.1007/s11127-014-0171-5. [DOI] [Google Scholar]
- Motta M, Stecula D, Farhart C. How right-leaning media coverage of COVID-19 facilitated the spread of misinformation in the early stages of the pandemic in the US. Canadian Journal of Political Science. 2020;53:335–342. doi: 10.1017/S0008423920000396. [DOI] [Google Scholar]
- National Public Radio. (2020). Fact check: Trump compares coronavirus to the flu, but it could be 10 times deadlier. https://www.npr.org/sections/coronavirus-live-updates/2020/03/24/820797301/fact-check-trump-compares-coronavirus-to-the-flu-but-they-are-not-the-same. Accessed August 5, 2020.
- New York Times. (2020a). Trump says states can start reopening while acknowledging the decision is theirs. https://www.nytimes.com/2020/04/16/us/politics/coronavirus-trump-guidelines.html. Accessed August 24, 2020.
- New York Times. (2020b). Coronavirus in the US: Latest map and case count. https://www.nytimes.com/interactive/2020/us/coronavirus-us-cases.html. Accessed August 24, 2020.
- Reynolds B. Crisis and risk communication: Pandemic influenza. Washington DC: Centers for Disease Control and Prevention; 2006. [Google Scholar]
- Robert SA, Booske BC. US opinions on health determinants and social policy as health policy. American Journal of Public Health. 2011;101(9):1655–1663. doi: 10.2105/AJPH.2011.300217. [DOI] [PMC free article] [PubMed] [Google Scholar]
- Rogers R. A protection motivation theory of fear appeals and attitude change. The Journal of Psychology. 1975;91:93–114. doi: 10.1080/00223980.1975.9915803. [DOI] [PubMed] [Google Scholar]
- Rosenstock IM. The health belief model and preventive health behavior. Health Education Monographs. 1974;2:354–386. doi: 10.1177/109019817400200405. [DOI] [Google Scholar]
- Sjöberg L. Factors in risk perception. Risk Analysis. 2000;20(1):1–12. doi: 10.1111/0272-4332.00001. [DOI] [PubMed] [Google Scholar]
- Tourangeau R, Conrad FG, Couper MP. The science of web surveys. New York: Oxford University Press; 2013. [Google Scholar]
- Valliant R, Dever JA, Kreuter F. Practical Tools for Designing and Weighting Survey Samples. New York: Springer; 2013. [Google Scholar]
- Van Bavel JJ, Baicker K, Boggio PS, Capraro V, Cichocka A, Cikara M, et al. Using social and behavioural science to support COVID-19 pandemic response. Nature Human Behaviour. 2020;4(5):460–471. doi: 10.1038/s41562-020-0884-z. [DOI] [PubMed] [Google Scholar]
- Yeung, J., Berlinger, J., Renton, A., Wagner, M., Hayes, M., & Rocha, V. (2020). March 13 coronavirus news. https://www.cnn.com/world/live-news/coronavirus-outbreak-03-13-20-intl-hnk/h_b598bc1fba2dc834b255c7c58a3f8c84. .
Associated Data
This section collects any data citations, data availability statements, or supplementary materials included in this article.
Supplementary Materials
(PDF 303 kb)
Data Availability Statement
https://uasdata.usc.edu/index.php (Survey #242).