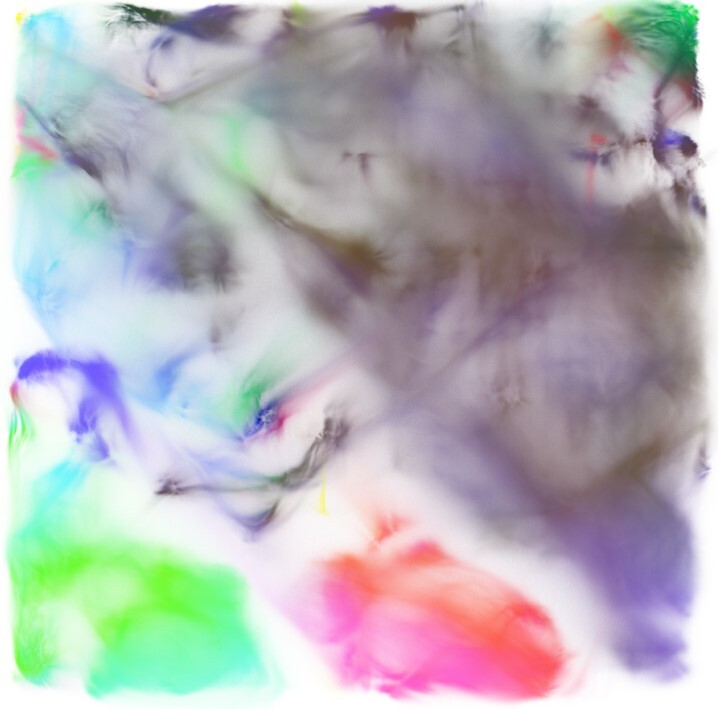
Figure 5.

Raw IMPC Spleen T-cell dataset, processed by GigaSOM.jl and embedded by the Julia implementation of EmbedSOM. The figure shows an aggregate of 1,167,129,317 individual cells. Expression of 3 main markers is displayed in combination as mixed colors: CD8 in red, CD4 in green, and CD161 in blue. A more detailed, annotated version of the visualization is available in Supplementary Fig. S4.
