

Abstract
Obese individuals exhibit altered circulating levels of adipokines, the proteins secreted by adipose tissue to mediate tissue cross-talk and regulate appetite and energy expenditure. The effect of adipokines on neuronal glucose metabolism, however, remains largely unknown. Two adipokines produced in adipose tissue, adiponectin and resistin, can gain access to the central nervous system (CNS), and their levels in the cerebrospinal fluid (CSF) are altered in obesity. We hypothesized that dysregulated adipokines in the CNS may underlie the reported link between obesity and higher risk of neurological disorders like Alzheimer’s disease (AD), by affecting glucose metabolism in hippocampal neurons. Using cultured primary rat hippocampal neurons and mouse hippocampus slices, we show that recombinant adiponectin and resistin, at a concentration found in the CSF, have opposing effects on glucose metabolism. Adiponectin enhanced glucose uptake, glycolytic rate, and ATP production through an AMP-activated protein kinase (AMPK)-dependent mechanism; inhibiting AMPK abrogated the effects of adiponectin on glucose uptake and utilization. In contrast, resistin reduced glucose uptake, glycolytic rate, and ATP production, in part, by inhibiting hexokinase (HK) activity in hippocampal neurons. These data suggest that altered CNS levels of adipokines in the context of obesity may impact glucose metabolism in hippocampal neurons, brain region involved in learning and memory functions.
Keywords: Adiponectin, Resistin, Obesity, Glucose metabolism, Hippocampus, Brain functions
Introduction
Obesity in humans triggers a decline of several neuronal functions including cognitive performance, decrease of neuronal plasticity, decrease in glucose metabolism (the primary source of energy in the brain), and a decrease in the formation of new dendritic spines [1–4]. Despite these reports, little is known about the molecular mechanisms or the metabolic pathways involved in obesity-induced changes in the brain.
Obesity is characterized by an excessive accumulation and maintenance of adipose tissue [5, 6]. The cross-talk between adipose tissue and its environment is typically mediated in three ways: nutritional mechanisms, neural pathways, and via the elaboration of autocrine, paracrine, and endocrine factors termed adipokines [7–9]. Importantly, the function, molecular targets, and potential clinical relevance of many adipokines are still unknown [10]. The levels of circulating adipokines change in parallel with changes in body mass index (BMI), but the direction of change depends on the individual adipokine. For example, in obesity, there is an increase in resistin and a decrease in adiponectin in serum and CSF [11, 12]. Together, these changes associated with obesity could be critical for the onset or progress of the cellular processes that trigger brain dysfunction later in life [10, 13, 14].
Adiponectin is the most abundant adipokine in serum [15]. Adiponectin modulates several metabolic processes in CNS including glucose regulation and fatty acid catabolism in the periphery [16–18]. It is an insulin sensitizer, and circulating concentrations are inversely correlated with insulin resistance and obesity [19–21]. Adiponectin enhances insulin metabolism through the activation of AMPK, which modulates several metabolic pathways [22]. However, little is known about the effect of adiponectin on glucose metabolism in neurons.
The adipokine resistin links obesity to insulin resistance in rodents [23]. Serum and CSF levels of resistin are elevated in human and animal models of obesity and diabetes, implicating dysregulation of resistin in these diseases [24]. Elevated resistin causes insulin resistance in vitro and in vivo, while reduction has the opposite effect [23, 25]. The mechanism of action of resistin still remains poorly understood [26–28].
The published data indicate that adiponectin and resistin have opposing effects on insulin action. Since both adipokines affect glucose metabolism, the principal source of brain energy, they might be involved in proper neuronal function [29, 30]. Glucose metabolism is critical for brain function; in fact, downregulation of glucose metabolism has been correlated with almost all neurodegenerative diseases, including AD [31]. We hypothesized that these adipokines can modulate glucose metabolism in neurons, and thus may underlie the link between obesity and brain dysfunction [13, 32]. We therefore explored the effects of adiponectin and resistin on glucose metabolism in primary neurons and brain slices, specifically targeting the hippocampus as the critical brain region for learning and memory and one of the first affected areas in obesity and AD.
Material and Methods
Animals
The primary neuronal cultures were obtained from pregnant rats Sprague Dawley (n, 7). The hippocampal slices were obtained from 4-month-old male mice (CB57BL/6, n, 9). The animals were obtained from our colony at the Faculty of Biological Sciences, Pontificia Universidad Católica de Chile. Animals were kept in a ventilated room with a natural photoperiod and controlled temperature (yearly minimum = 13.4 ± 0.2 °C; yearly maximum = 24.9 ± 0.2 °C). All experiments followed the National Institutes of Health guidelines (NIH, Baltimore, MD). All procedures were approved by the Bioethical and Biosafety Committee of the Faculty of Biological Sciences of the P. Universidad Católica de Chile. All efforts were made to minimize animals’ distress and suffering as well as to reduce the number of animals used.
Primary Neuronal Cell Culture
Hippocampal neurons were isolated from the forebrains of 17-day-old rat embryos, as previously described [33]. Briefly, the neurons were seeded at a density of 5 × 10⁶ cells/cm2 in poly-D-lysine-coated culture dishes and cultured in Dulbecco’s modified Eagle’s medium (DMEM, Invitrogen, USA) containing 10% (v/v) fetal bovine serum (FBS, Thermo Fisher Scientific Inc., USA). After 30 min, the culture medium was changed to Neurobasal Medium (NeuB, Thermo Fisher Scientific Inc., USA) with B27 serum-free supplement for neural cell culture (Thermo Fisher Scientific Inc., USA), 2 mM L-glutamine, 100 U/mL penicillin, 100 mg/mL streptomycin, and 2.5 mg/mL Fungizone (Thermo Fisher Scientific Inc., USA). The cell cultures were incubated at 5% CO2 in a humidified environment at 37 °C. For all experiments, the neuronal cells were used after 14 days of in vitro (DIV) culture. Cytosine arabinoside was used to prevent non-neuronal cell contamination.
Slice Preparation
Hippocampal slices were prepared according to standard procedures [34]. Briefly, we sectioned transverse slices (350 μm) from the dorsal hippocampus in cold artificial cerebrospinal fluid (ACSF, 124 mM NaCl, 26 mM NaHCO3, 3 mM D-glucose, 2.69 mM KCl, 1.25 mM KH2PO4, 2.5 mM CaCL2, 1.3 mM MgSO4, and 2.60 mM NaHPO4) using a Vibratome (LeicaVT 1000s, Germany). Slices were incubated in ACSF for 1 h at room temperature, then treated with drugs for different times (0–60 min). After the treatment, the slices were used to determine several glucose metabolism parameters: uptake of glucose, glycolytic rate, PFK activity, HK activity, AMPK activity, and levels of ATP/ADP.
Drug Treatment
The neurons and slices were treated with recombinant mouse adiponectin (Adipon, 1, 5, 10, 15 and 20 ng/mL, 15–120 min, Sigma-Aldrich, USA), mouse resistin (10, 50, 100, 150, and 200 pg/mL, 15–120 min, Sigma-Aldrich, USA), cytochalasin B (Cyt B 20 μM, 3 h, inhibitor of GLUT transporters, 0–120 s in time course and 30 min in the pharmacology studies, Sigma-Aldrich USA), AZD5356 (20 nM, 30 min, a pyrrolopyrimidine derived inhibitor of all AKT isoforms, Sigma-Aldrich, USA), metformin hydrochloride (Metformin, 100 mM, AMPK activator, 15–60 min, Abcam, USA), dorsomorphin (Compound C, 1 mM, 15–60 min, potent selective and reversible AMP-kinase inhibitor, Abcam, USA), oligomycin (2 mM, inhibitor of ATP synthase, Sigma-Aldrich, USA) and 2-deoxy-D-glucose (2-DG, 7 mM, 30 min, a competitive inhibitor of hexokinase, Sigma-Aldrich, USA); all the drugs were prepared in NB without B27 in the experiments with primary cultures. In the experiments in slices, the drugs were prepared in ACSF. To inhibit resistin and adiponectin, we heated both proteins at 90 °C for 3 min. Neurons were carefully selected under the microscope to ensure that only plates showing uniform neuronal growth were used. To abolish resistin and adiponectin activity, we heated both proteins at 90 °C for 3 min to heat-inactivate the proteins.
Glucose Uptake Analysis
Glucose uptake was performed as previously described [35]. Briefly, after the drug treatments, neuron cultures were washed with Krebs Henseleit solution supplemented with 0.5 mM glucose [36]. Then, the cells were incubated for 15 s with 1–1.2 μCi glucose ([2-H3]-DG), (PerkinElmer, USA). Glucose uptake was arrested by PBS containing 1 mM HgCl2. The incorporated radioactivity was assayed by liquid scintillation counting. For the slice experiments, hippocampal slices were incubated with the different drugs in ACSF for (0–60 min). The kinetic parameters were determined using a single rectangular hyperbola of the form Vmax * [glc]/(Km + [glc]), which was adjusted to the data by nonlinear regression using SigmaPlot 12 [37].
Glycolytic Rate Determination
Glycolytic rates were determined using previously described methods [36, 38]. Briefly, after treatment with the different drugs, the neurons were placed in tubes containing 5 mM glucose and washed twice in Krebs Henseleit solution (11 mM Na2HPO4, 122 mM NaCl, 3.1 mM KCl, 0.4 mM KH2PO4, 1.2 mM MgSO4, and 1.3 mM CaCL2, pH 7.4) containing the appropriate concentration of glucose. After equilibration in 0.5 mL of Hank’s balanced salt solution/glucose (3 mM) at 37 °C for 10 min, 0.5 mL of Hank’s balanced salt solution containing 3 mM of [3-3H] glucose (PerkinElmer, USA) was added, with a final specific activity of 1–3 disintegrations/min/pmol (approximately 1 mCi/mmol). Aliquots of 100 μL were then transferred to another tube, placed inside a capped scintillation vial containing 0.5 mL of water, and incubated at 45 °C for 48 h. After this vapor-phase equilibration step, the tube was removed from the vial, a scintillation mixture was added, and the 3H2O was assayed by liquid scintillation counting over a 5-min period. The glycolytic rate was determined after drug treatment in slices as described above, at different times (0–60 min).
Quantification of Hexokinase (HK) Activity
After drug treatment, the hippocampal neuron cultures or slices were washed with PBS, treated with Trypsin/EDTA, and centrifuged at 500g for 5 min at 4 °C. Then, the tissue was resuspended in isolation medium (250 mM sucrose, 20 mM HEPES, 10 mM KCl, 1.5 mM MgCl2, 1 mM EDTA, 1 mM DTT, 2 mg/mL aprotinin, 1 mg/mL pepstatin A, and 2 mg/mL leupeptin) at a 1:3 dilution, sonicated at 4 °C, and centrifuged at 1500g for 5 min at 4 °C. To quantify the HK activity of the supernatant, the purified fraction was mixed with reaction medium (25 mM Tris-HCl, 1 mM DTT, 0.5 mM NADP/Na+, 2 mM MgCl2, 1 mM ATP, 2 U/mL G6PDH, and 10 mM glucose), and incubated at 37 °C for 30 min. The reaction was stopped by the addition of 10% trichloroacetic acid (TCA), and the generation of NADPH was measured at 340 nm [35].
Measurement of Glucose Oxidation Through the Pentose Phosphate Pathway
Glucose oxidation via the pentose phosphate pathway (PPP) was measured as previously described [39] based on the difference in 14CO2 production from [1-14C] glucose (decarboxylated in the 6-phosphogluconate dehydrogenase-catalyzed reaction and in the Kreb’s cycle) and [6-14C] glucose (only decarboxylated in the Kreb’s cycle). After treatment, the neurons/slices were collected by trypsinization. Cell pellets were resuspended in O2-saturated Krebs Henseleit buffer (11 mM Na2HPO4, 122 mM NaCl, 3.1 mM KCl, 0.4 mM KH2PO4, 1.2 mM MgSO4, and 1.3 mM CaCl2, pH 7.4), and 500 μL of this suspension (~ 106 cells) was incubated with 500 μL of Krebs Henseleit solution containing 0.5 μCi D-[1-14C] glucose or 2 μCi D-[6-14C] glucose (PerkinElmer, USA) and 5.5 mM D-glucose (final concentration). The flasks were flushed with O2 for 20 s, sealed with rubber caps, and incubated for 60 min in a 37 °C water bath with shaking. Incubations were stopped by injection of 0.2 mL of 1.75 M HClO4 into the main well, and shaking was continued for another 20 min to facilitate trapping of 14CO2 by benzethonium hydroxide. Radioactivity was assayed by liquid scintillation spectrometry.
ATP Content
After the drug treatments, we measured the ATP levels in whole-cell and slice lysates using an ATP determination kit (cat: A22066, Invitrogen/Molecular Probes) [40].
Activity of Phosphofructokinase and AMP-Activated Protein Kinase
AMP-activated protein kinase (AMPK) activity was measured by ELISA using an antibody specific to the phosphorylated T-172 (active) form of AMPK-α following the manufacturer’s protocol (cat: KHO0651, Thermo Fisher Scientific Inc., USA). Experiments were conducted in triplicate and repeated at least three times [41, 42]. Phosphofructokinase (PFK) activity was measured using the PFK Colorimetric Assay Kit from BioVision (cat: K776, BioVision, USA) according to the manufacturer’s instructions [43].
Immunoblotting
Immunoblotting was performed as previously described [44]. Briefly, neurons were homogenized in RIPA buffer (50 mM Tris-Cl, pH 7.5, 150 mM NaCl, 1% NP-40, 0.5% sodium deoxycholate, and 1% SDS) supplemented with a protease inhibitor cocktail (Sigma-Aldrich, USA) and phosphatase inhibitors (50 mM NaF, 1 mM Na3VO4, and 30 μM Na4P207). Proteins were detected by incubating the samples with primary antibody and followed by a peroxidase-conjugated secondary antibody (Thermo Fisher Scientific Inc., USA), which was then developed using an enhanced chemiluminescence (ECL) kit (Western Lightning Plus ECL, PerkinElmer, USA). The primary antibodies included rabbit anti-phospho-AMPK (Thr172) (2535, 1:1000, Cell Signaling, US), rabbit anti-AMPKα (23A3) (2603, 1:1000, Cell Signaling Technology, USA), rabbit anti-PFKFB2 (D5I5F) (13029, 1:1000, Cell Signaling Technology, USA), and rabbit anti- Phospho-PFKFB2 (Ser483) (D4R1W) (13064, 1:1000, Cell Signaling Technology, USA).
Real-Time PCR
Quantitative real-time RT–PCR was conducted using 18S mRNA as a control, and performed using SYBR Green in accordance with the manufacturer’s instructions [35]. As a housekeeping gene, we used cyclophilin, and the values were calculated using the delta Ct. We used the following sets of primers: 18S gene forward 5′-TCAACGAGGAATGC CTAGTAAGC-3′ and reverse 5′-ACAAAGGGCAGGGA CGTAGTC-3′, cyclophilin: forward 5′- TGGAGATG AATCTGTAGG AGGAG-3′ and reverse 5′- TACCACAT CCATGCCCTCTAGAA-3, GLUT1: forward 5′-ATGG ATCCCAGCAGCAAGA AG-3′ and reverse 5′-AGAG ACCAAAGCGTGGTGAG-3′, GLUT3: forward 5′-GGAT CCCTTGTCCTTCTGCTT-3′ and reverse 5′-ACCA GTTCCCAATGCACAC A-3′, GLUT4: forward 5′-CGGC TCTGACGATGGGGAA-3′ and reverse 5′-TTGT GGGATGG AATCCGGTC-3′.
ADP Content
Following drug treatment, ADP levels were measured in whole-cell lysates from primary neurons and slices using an ADP Assay Kit (Cat: ab83359, Abcam, UK), according to the manufacturer’s instructions [45].
Statistical Analysis
All experiments were performed four times, with triplicates for each condition in each experimental run. The results are expressed as means ± standard error. The data were analyzed by one-way or two-way analysis of variance (ANOVA), followed by Bonferroni’s post hoc test; *p ≤ 0.05 and **p ≤ 0.01 were considered significant. Statistical analyses were performed using Prism software (GraphPad, La Jolla, CA).
Results
Opposing Roles of Adiponectin and Resistin on Glucose Uptake and Utilization in Hippocampal Neurons
We studied the effect of different doses of adiponectin and resistin, reflecting the levels described in the human CSF (normal and high BMI); the levels described in humans are similar to the levels described in rat and mice [11, 12], on glucose uptake in hippocampal neurons at several time points. Significant differences in glucose uptake were detected in the presence of 20 ng/mL of adiponectin beginning 15 min after treatment (35.50 ± 3.02 nmol/106 cells vs 20.43 ± 2.33 nmol/106 cells for control). This positive effect of adiponectin was observed 30, 45, and 60 min after treatment, but not sustained at 120 min after treatment (Fig. 1a). In contrast, treatment with 200 pg/mL resistin (levels in CSF, described in obesity) resulted in a significant decrease in the uptake of glucose beginning 15 min after treatment (11.21 ± 2.11 nmol/106 cells). The inhibitory effect of resistin was observed in the presence of 200 pg/mL resistin at 15, 30, and 45 min after treatment (Fig. 1b).
Fig. 1.
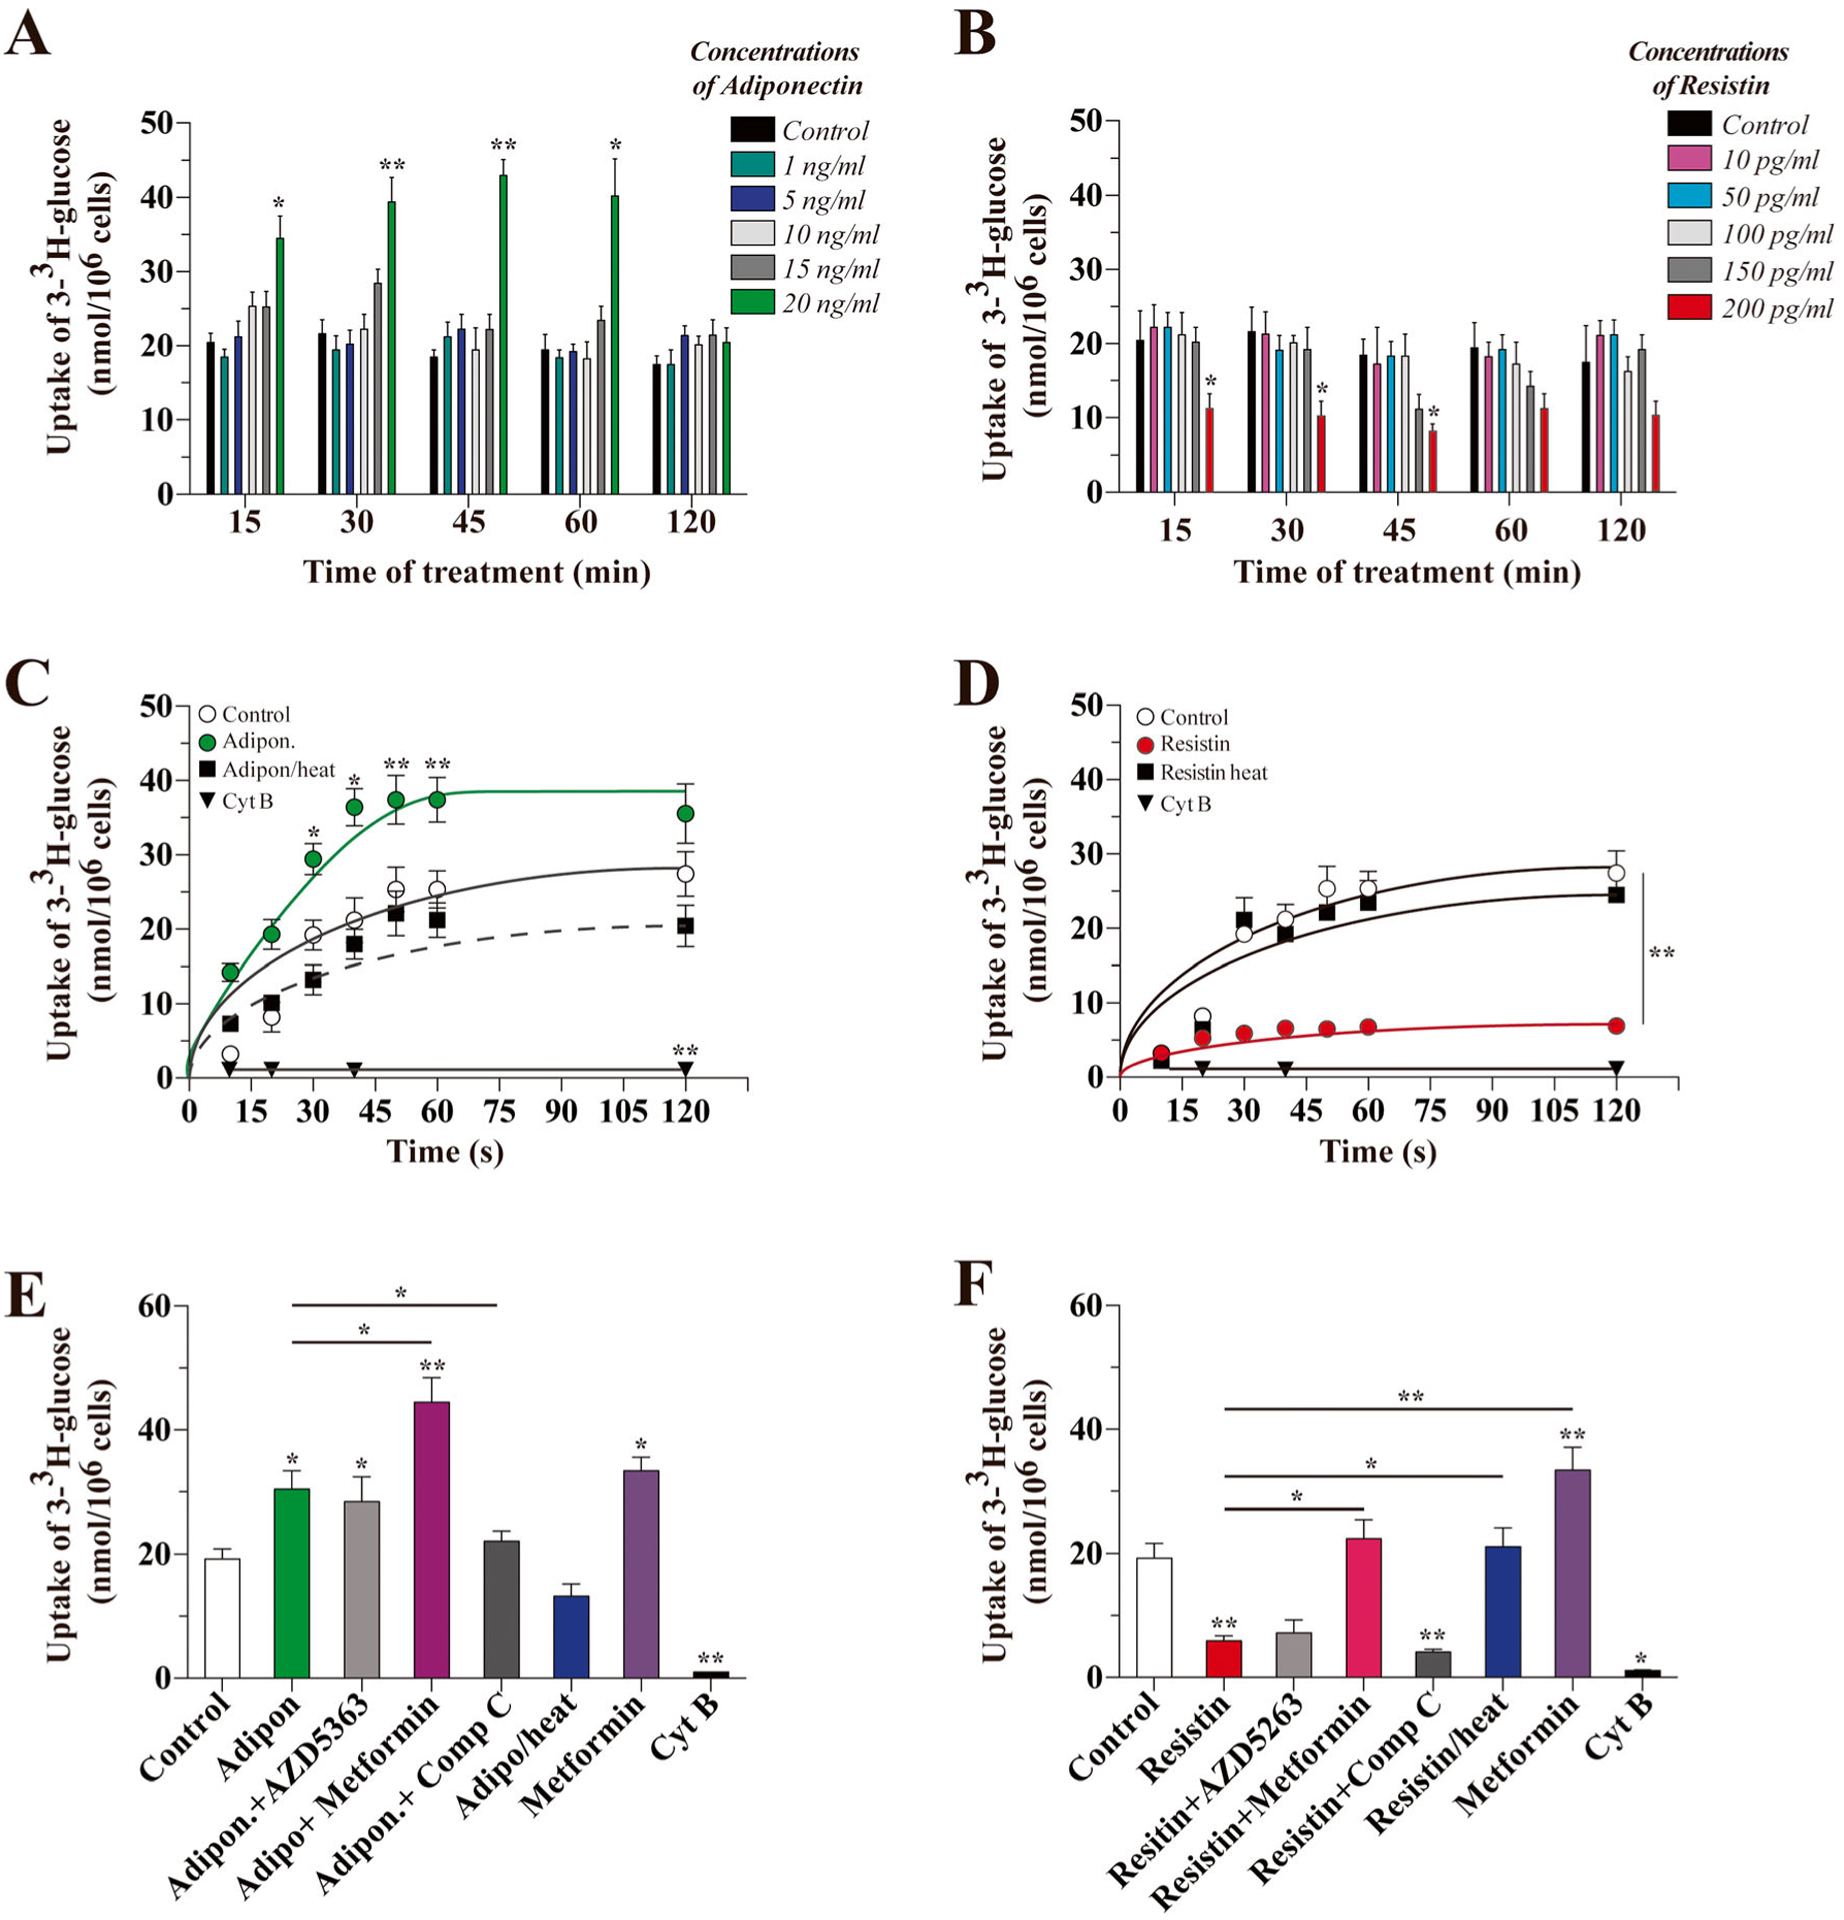
Effects of adiponectin and resistin on glucose uptake in cultured hippocampal neurons. Neuronal cultures treated with varying doses of adiponectin (a) or resistin (b) for the indicated length of time were exposed to radiolabeled 3H-glucose for 15 s to measure glucose uptake. We also measured the uptake of glucose in initial velocity conditions over a 2-min time frame with 20 ng/mL of adiponectin (c) or 200 pg/mL of resistin (d). The proteins lost their activity upon heat-induced denaturation. The effects of adiponectin (e) and resistin (f) on glucose uptake in the presence of activators/inhibitors of AMPK and AKT. Data represent the mean ± SEM of n = 5, each performed in triplicate. *p < 0.01; **p < 0.005, Bonferroni test
We also measured the uptake of 3-3H-glucose in initial velocity conditions. Treatment with 20 ng/mL adiponectin significantly stimulated the uptake of glucose in a time-dependent manner, reaching equilibrium at 45 s. Heat-inactivated adiponectin was unable to stimulate the uptake of 3-3H-glucose. As an internal control, the presence of Cyt B decreased the uptake of 3-3H-glucose by 95% (Fig. 1c). In contrast, 15 min after treatment with resistin, the uptake of 3-3H-glucose was quickly inhibited: we observed an equilibrium in initiation velocity conditions at 15 s (uptake of 5.90 ± 0.73 nmol/106 cells vs 19.23 ± 1.12 nmol/106 cells for control). The presence of Cyt B inhibited 3-3H-glucose uptake and the effect of resistin was abolished by heat inactivation (Fig. 1d).
To determine the mechanism of action of both adipokines, we performed pharmacological studies. We treated the cells for 15 min with adiponectin or resistin and measured the uptake of 3-3H-glucose at 15 s. The effect of adiponectin (30.43 ± 3.11 nmol/106 cells) was independent of an inhibitor of AKT (AZD5363, 28.43 ± 4.02 nmol/106 cells), but was abolished by Compound C (22.12 ± 3.21 nmol/106 cells), while metformin enhanced the effect of adiponectin (44.45 ± 4.77 nmol/106 cells) (Fig. 1e). In the same conditions, the inhibitory effect of resistin (5.9 ± 0.8 nmol/106 cells) was independent of AZD5263 (16.43 ± 1.93 nmol/106 cells) and Compound C (4.10 ± 0.53 nmol/106 cells); however, metformin was able to stimulate the uptake of 3-3H-glucose to control levels (22.43 ± 3.13 nmol/106 cells) (Fig. 1f).
Treatment with Adiponectin-Stimulated Glucose Uptake, While Resistin Decreased the Uptake of Glucose
To study how adiponectin and resistin modulate glucose metabolism, we calculated the kinetic constant for the transporter of 3-3H-glucose. Cells were treated for 15 min with adiponectin or resistin, then we measured the uptake of 3-3H-glucose at 15 s in the presence of different concentrations of glucose (0–30 mM). Treatment with adiponectin or resistin resulted in Vmax values (13.06 ± 1.45 and 12.45 ± 3.50 pmol/106 cells/min, respectively) similar to the control condition (13.01 ± 0.69 pmol/106 cells/min) (Fig. 2a). However, Km values changed after treatment with adipokines: from 9.65 ± 1.33 mM in the control, to 3.34 ± 1.05 mM following adiponectin and 49.33 ± 9.02 mM following resistin (Fig. 2a). These results suggest changes in the affinity of the glucose uptake and not in the expression of GLUTs. In this line, we detected the levels of mRNA for the main GLUTs transporters expressed in hippocampal neurons by qRT-PCR. We did not observe changes in the mRNA levels of GLUT1, 3, or 4 after treatment with adiponectin or resistin for 15 min (Fig. 2b).
Fig. 2.
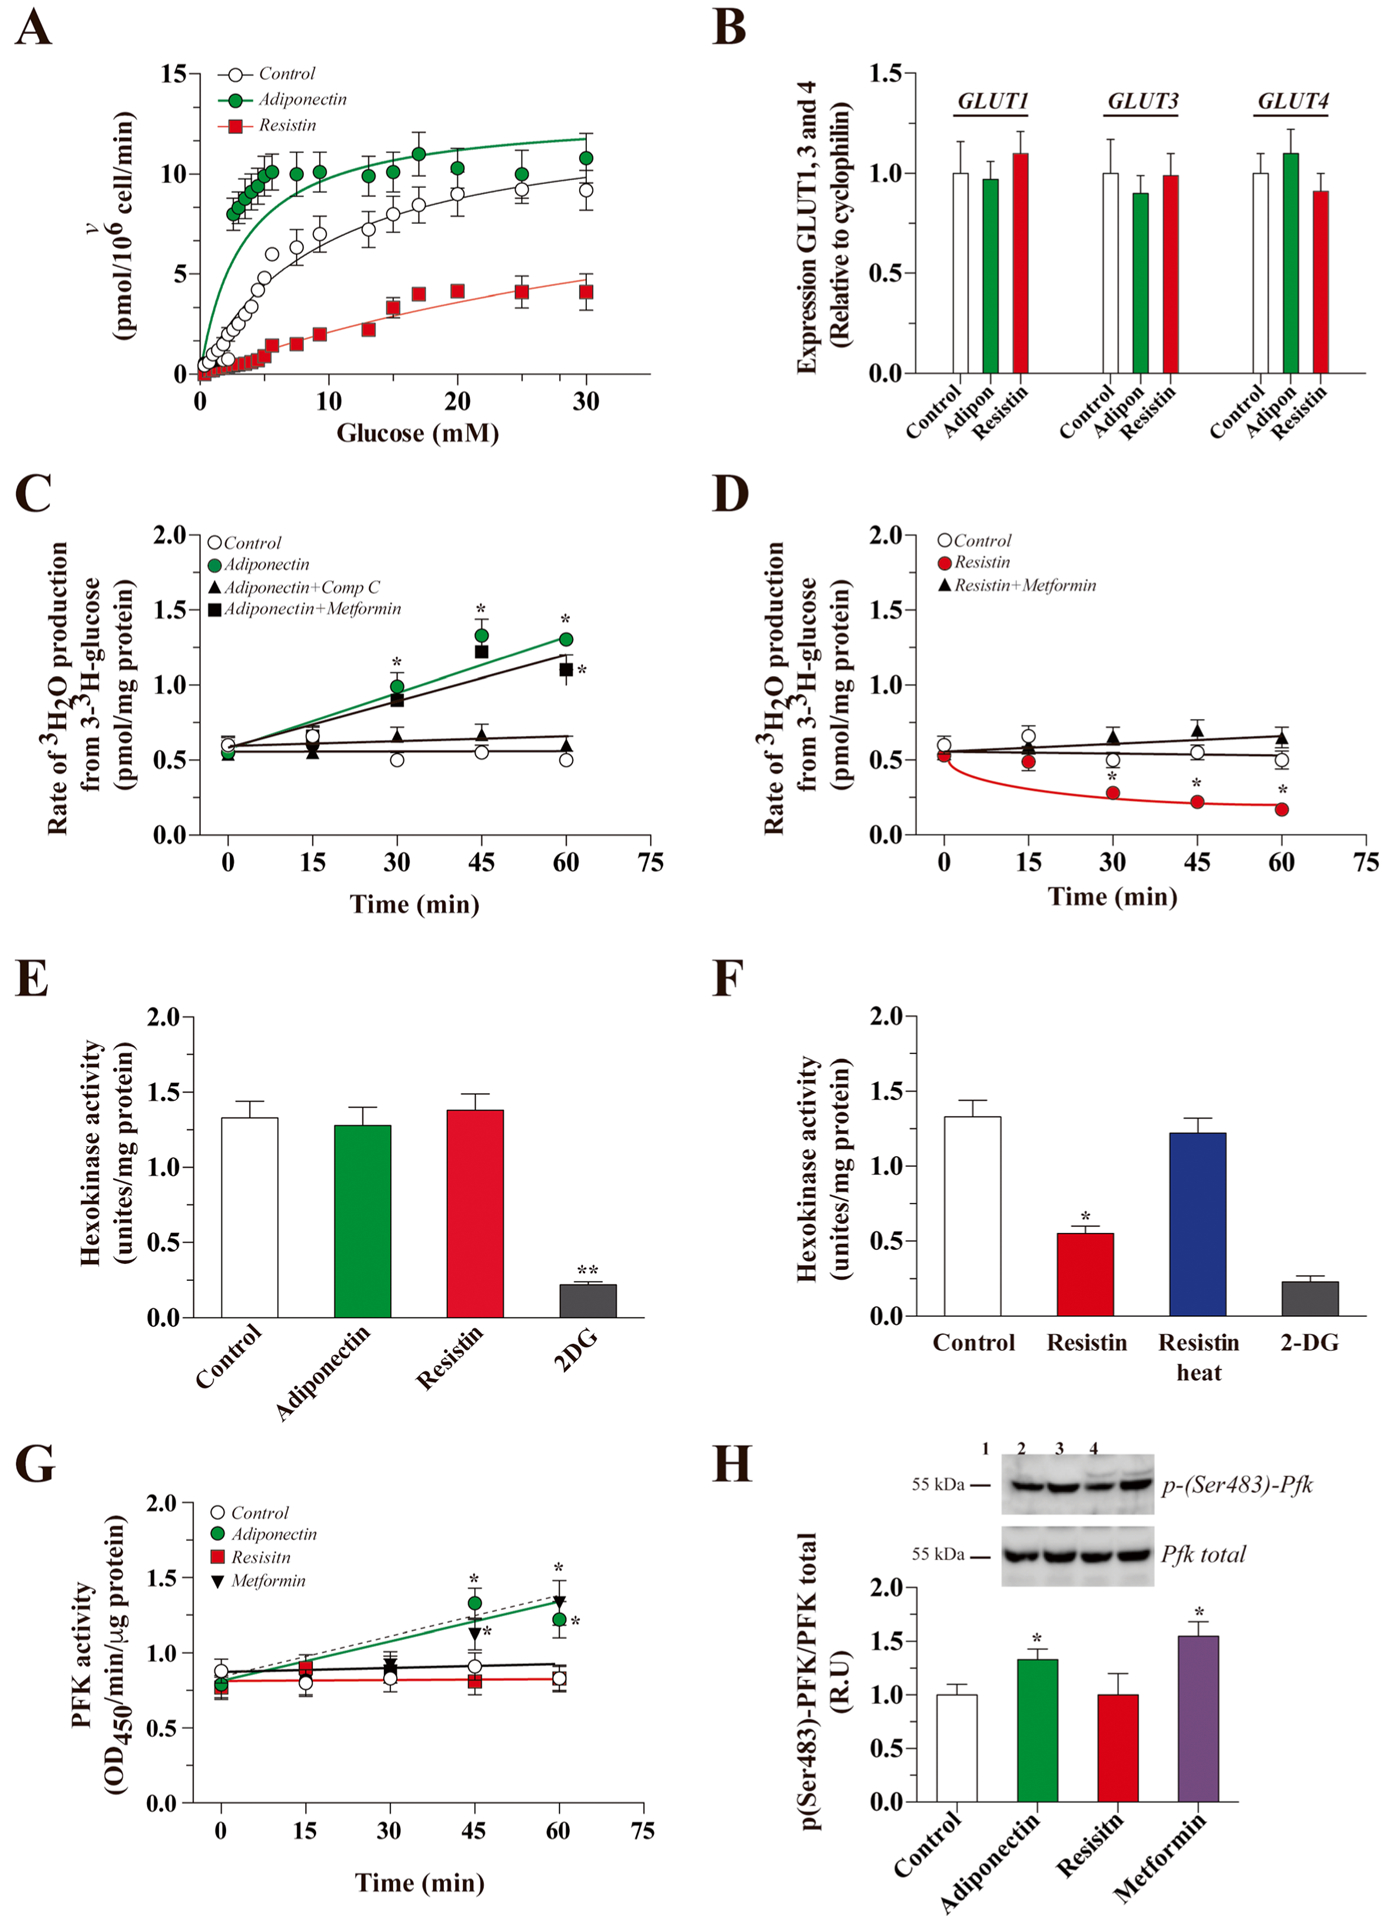
Modulation of glycolytic rate by adiponectin and resistin. The cultures were treated with traces of radioactive 2-deoxyglucose (2-DG) for 15 s, and uptake was measured in the presence of increasing concentrations of unlabeled glucose (0–30 mM) under the control conditions and following adiponectin or resistin treatment (15 min, a). Using qRT-PCR, we measured the levels of GLUT1, 3, and 4 mRNA after treatment with adiponectin or resistin (b). Then, we measured the glycolytic rate after treatment with adiponectin (c) or resistin (d) at several time points. We measured hexokinase activity after treatment with adiponectin (e) or resistin (f). We measured the effect of adiponectin or resistin on the activity of phosphofructokinase 1 (PFK) by ELISA after several treatment times (g) and measured the levels of the activated form of PFK by Western blot (h). The data represent the means ± SEM of n = 3 experiments, each performed in triplicate. The continuous lines in each plot (a) correspond to the best nonlinear regression fit of a rectangular hyperbola to the data using Sigmaplot 12 software
We next calculated the utilization of glucose through glycolysis by measuring the glycolytic rate. Treatment with adiponectin increased the glycolytic rate in a time-dependent manner, with a maximum value of 1.33 ± 0.13 pmol/mg protein after 30 min of treatment (0.55 ± 0.08 pmol/mg protein for control). The effect of adiponectin was significantly blocked by co-incubation with Compound C after 30 min of treatment, while co-incubation with metformin significantly increased the glycolytic rate (Fig. 2c). Treatment with resistin for 30 min significantly decreased the glycolytic rate with a minimum value of 0.17 ± 0.08 nmol/mg protein after 60 min of treatment. The inhibitory effect was abolished by heat inactivation of resistin. Co-incubation with metformin was able to recover the glycolytic rate to a value similar to control conditions (Fig. 2d). Since we detected changes in the glycolytic rate, we measured the activity of HK and PFK, two major regulator points in glycolysis. For HK activity, we did not observe differences after 30 min of treatment with adiponectin (Fig. 2e). However, after treatment with resistin for 30 min, we observed a 58% decrease in HK activity. The effect was abolished by heat inactivation of resistin (Fig. 2f). We also measured PFK activity after treatment with adiponectin and observed an increase in PFK activity after 45 min of treatment (Fig. 2g). The effect of adiponectin on PFK activity was similar to cells treated with metformin. In contrast, treatment with resistin did not induce changes in PFK activity (Fig. 2g). Adiponectin-stimulated PFK activity was correlated with an increase in the activated, phosphorylated, form of p-(Ser483)-PFK (Fig. 2h).
Because glucose could be used by other pathways, we therefore measured the activity of the PPP in the presence of adiponectin or resistin. We did not observe changes after 30 min of treatment with either adipokine (Fig. 3a). The activity of AMPK, a critical sensor for energy metabolism, was increased by adiponectin treatment (6.70 ± 0.61 U/mg protein after 45 min vs untreated control, 4.1 ± 0.41 U/mg protein. The increase in AMPK activity was observed until 60 min after treatment. The effect of adiponectin was similar to the effect of metformin, while Compound C decreased the activity of AMPK. In contrast, resistin did not affect the activity levels of AMPK (Fig. 3b). The activity was correlated with an increase in the activated form of AMPK after treatment with adiponectin for 45 min (Fig. 3c).
Fig. 3.
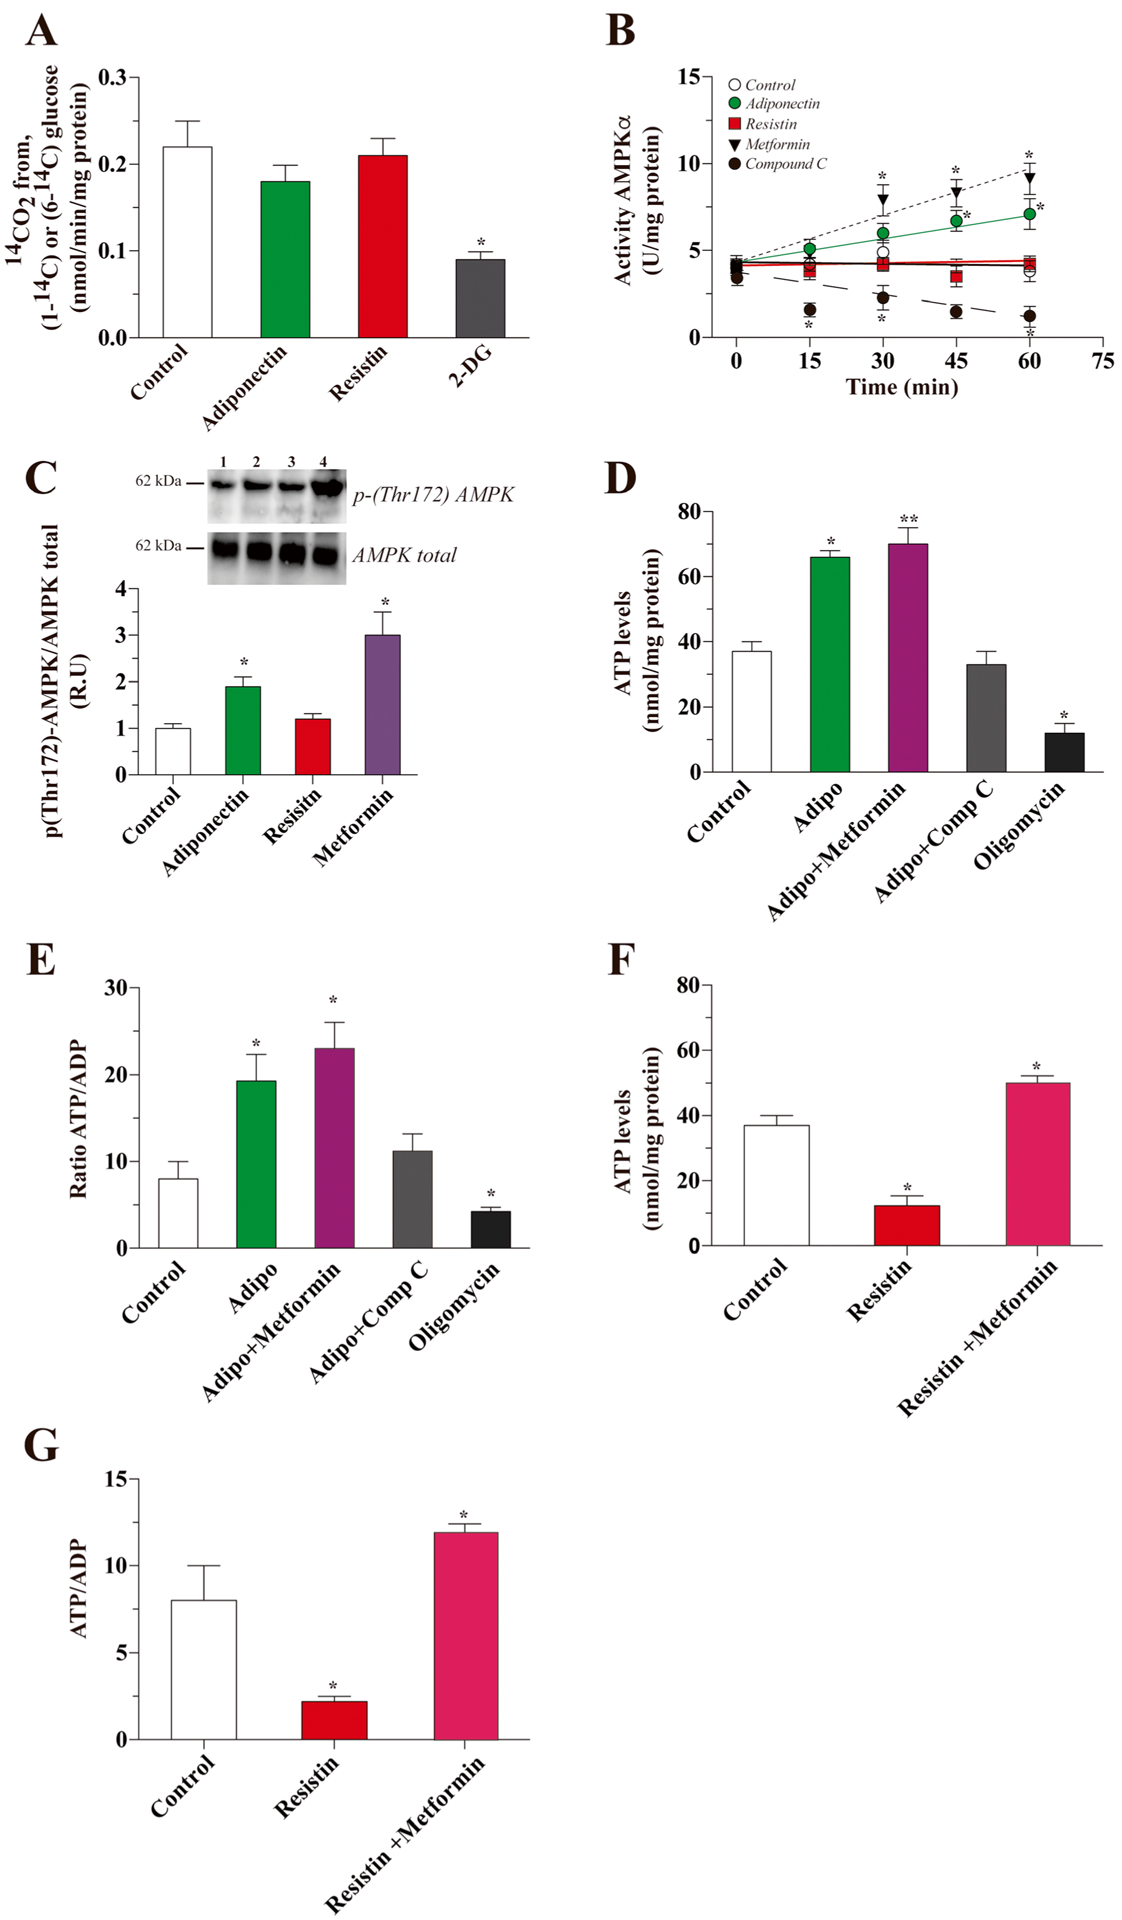
Downstream effect of adiponectin and resistin treatment in hippocampal neurons. Afterward, we studied the effect of adiponectin and resistin on PPP activity and did not observe changes after treatment (a). Then, we measured the levels of activity of AMPK, a master metabolic regulator, using a specific calorimetric kit (b) and Western blot (c). Then, we measured the levels of ATP and the ATP/ADP ratio after treatment for 15 min with adiponectin (d and e) and resistin (f and g). Data represent the mean ± SEM of n = 4, each performed in triplicate. *p < 0.01; **p < 0.005, Bonferroni test
We next measured the levels of ATP. In control conditions, ATP levels were 37 ± 3 nmol/mg protein. After treatment with adiponectin, ATP levels significantly increased (66 ± 2 nmol/mg protein). Co-incubation with metformin potentiated the effect of adiponectin, while co-incubation with Compound C decreased the levels of ATP. In the presence of oligomycin, used as internal control, the ATP levels also decreased significantly (Fig. 3d). ATP levels were proportional to the ATP/ADP ratio (Fig. 3e). In contrast, treatment with resistin decreased both the levels of ATP and the ATP/ADP ratio, and in both cases, co-incubation with metformin was able to recover the levels of both parameters (Fig. 3f, g).
Adiponectin and Resistin Modulates Glucose Metabolism in Mouse Hippocampal Slices
Finally, we observed that treatment with adiponectin for 1 h induced a strong increase in the uptake of 3-3H-glucose in hippocampal slices obtained from wild-type mice. This effect was abolished by co-incubation with Compound C. While treatment with resistin for 1 h induced a 50% decrease in the uptake of glucose, this effect was reversed in the presence of metformin (Fig. 4a). Adiponectin increased the glycolytic rate at both 30 and 45 min after treatment, but not 60 min after treatment. The effect of adiponectin was abolished by co-incubation with Compound C. In contrast, the presence of resistin decreased the glycolytic rate after 45 and 60 min of treatment, and this effect was partially abolished by co-incubation with metformin (Fig. 4b). Adiponectin treatment, but not resistin treatment, was sufficient to significantly increase PFK activity after 30 min (Fig. 4c). Treatment with resistin induced a decrease in HK activity, which was abolished by co-incubation with metformin (Fig. 4d). AMPK activity was stimulated by adiponectin treatment, and this effect was abolished in the presence of Compound C; resistin did not affect AMPK activity (Fig. 4e). Finally, the levels of ATP and the ATP/ADP ratio were both increased after treatment with adiponectin, an effect that was abolished by co-incubation with Compound C. Resistin induced a decrease in both parameters (Fig. 4f, g).
Fig. 4.
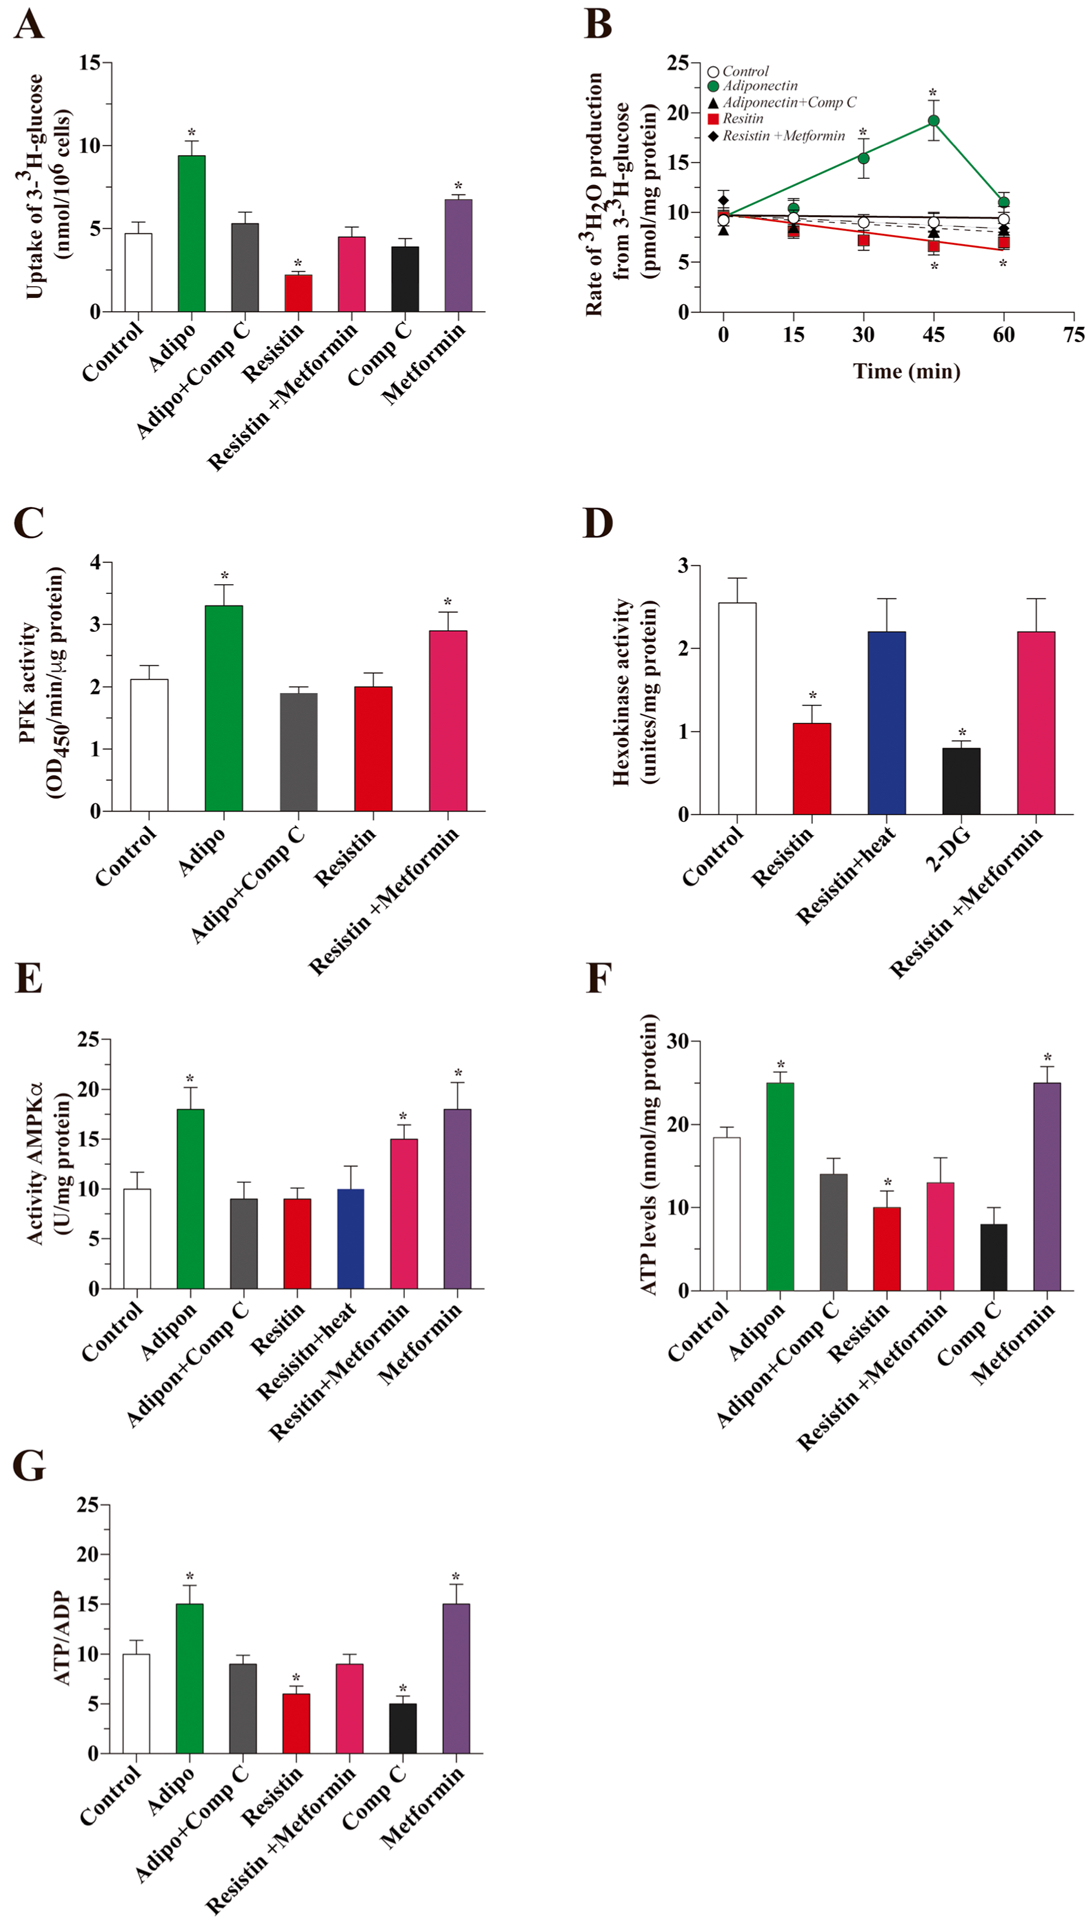
Effects of adiponectin or resistin on glucose metabolism in hippocampal slices. We studied the uptake of radioactive glucose in hippocampal slices. Slices were treated for 1 h with the corresponding drugs (a). We measured the glycolytic rate after treatment with adiponectin or resistin at several time points (b). We also measured the activity of PFK (c) HK (d) and AMPK (e) after 1 h of treatment with adiponectin or resistin in the presence or absence of several inhibitors/activators of AMPK. Finally, we measured the levels of ATP (f) and the ATP/ADP ratio (g)
Discussion
Glucose metabolism is critical for normal neuronal function. The energy requirement of neurons varies considerably between rest and activation states. Most energy produced in the brain is used for the propagation of action potentials and in the maintenance of membrane potentials required for neuronal transmission [29, 31]. Our findings demonstrate direct involvement of two adipokines, adiponectin and resistin, in glucose metabolism in the hippocampus. These results provide direct evidence to support an earlier hypothesis suggesting that the molecules released or produced by the adipose tissue could be the molecular link between obesity and brain dysfunction [8]. Several epidemiological studies have suggested that being overweight or obese increases the risk of AD and dementia [46–49]. In addition, a link between obesity-related complications and AD has been identified by epidemiological research, involving bariatric interventions like a novel therapy for AD [50]. The underlying mechanisms of the association among obesity and AD are not precisely defined, but some mechanistic insights can be inferred. For example, obesity has been associated with several processes related to the acceleration of aging, including the excessive production of free radicals, oxidation, and inflammation [2, 51, 52]. Additionally, interesting studies in Rhesus monkeys with increased BMI due to a high fat diet have shown upregulated neuronal death genes [53]. Additional insights into the links between obesity and AD can be obtained from the altered adipose tissue physiology in these conditions. Obesity is associated with hyperplasia and hypertrophy of adipose tissue and with altered adipogenesis and local inflammation. This can lead to the subsequent release of several cytokines and adipokines, including interleukin-1b (IL-1b), tumor necrosis factor-α (TNF-α), interleukin-18 (IL-18), leptin, adiponectin, and resistin, into the systemic circulation, modulating the function of several organs and leading to the pathogenesis of brain pathologies [54, 55]. Despite all the described evidence, the study of glucose metabolism as a link between obesity (adipokines) and AD has not been described until now. Following this hypothesis, we studied the effect of adiponectin as resistin over the glucose/energy metabolism in the neuronal metabolism.
Adiponectin is the most abundant adipokine circulating in plasma, and its levels are decreased in obesity [12, 56]. Circulating adiponectin enters the brain fluid from the circulation, and the trimer and hexamer forms of adiponectin can be detected in the CSF [57]. Both adiponectin receptors, AdipoR1/R2, are expressed in the brain, mainly in neurons. Binding of adiponectin to its receptors activates the AMPK and AKT pathways [20, 58]. Upon treating rat hippocampal neurons with adiponectin, we observed that glucose metabolism was stimulated in an acute and concentration-dependent manner. In particular, cells treated with a concentration of adiponectin typically found in the CSF of normal weight individuals exhibited a rapid increase in glucose metabolism. The acute effect of adiponectin was independent of changes in the number of GLUTs in the membrane. However, adiponectin treatment promoted glucose uptake in hippocampal neurons. This could be due to a direct modification in the GLUTs or by a change in the activity of glycolytic enzymes downstream. Further, glucose was used mainly through glycolysis for the downstream generation of ATP in the mitochondria. A possible mechanism of the effect of adiponectin is the activation of AMPK [22, 57]. We observed that the effect of adiponectin was abolished in the presence of an inhibitor of AMPK; in the presence of an agonist of AMPK, we observed a greater increase in the effect that with adiponectin alone. Further, glucose that enters the neurons was used mainly through glycolysis for the generation of ATP in the mitochondria. A possible mechanism of the effect of adiponectin is the activation of AMPK [22, 57]. We observed that the effect of adiponectin was abolished in the presence of AMPK inhibitor. In contrast, in the presence of an AMPK agonist, we observed a greater increase in the effect than with adiponectin alone. Further, treatment with adiponectin increased the activity of PFK, a key glycolytic enzyme and regulator of glycolysis. When we treated hippocampal slices with adiponectin, we observed similar effects. However, considering the complexity of this model, we cannot attribute the final result to an effect of adiponectin on neurons alone. By enhancing glucose metabolism, increasing insulin sensitivity, and enhancing mitochondrial function, adiponectin may reduce the risk of several brain pathologies, as increased glucose metabolism in the brain is critical for the prevention of several neurodegenerative diseases, including AD [59–61]. Our findings provide evidence that adiponectin regulates glucose metabolism in the hippocampus (Fig. 5).
Fig. 5.
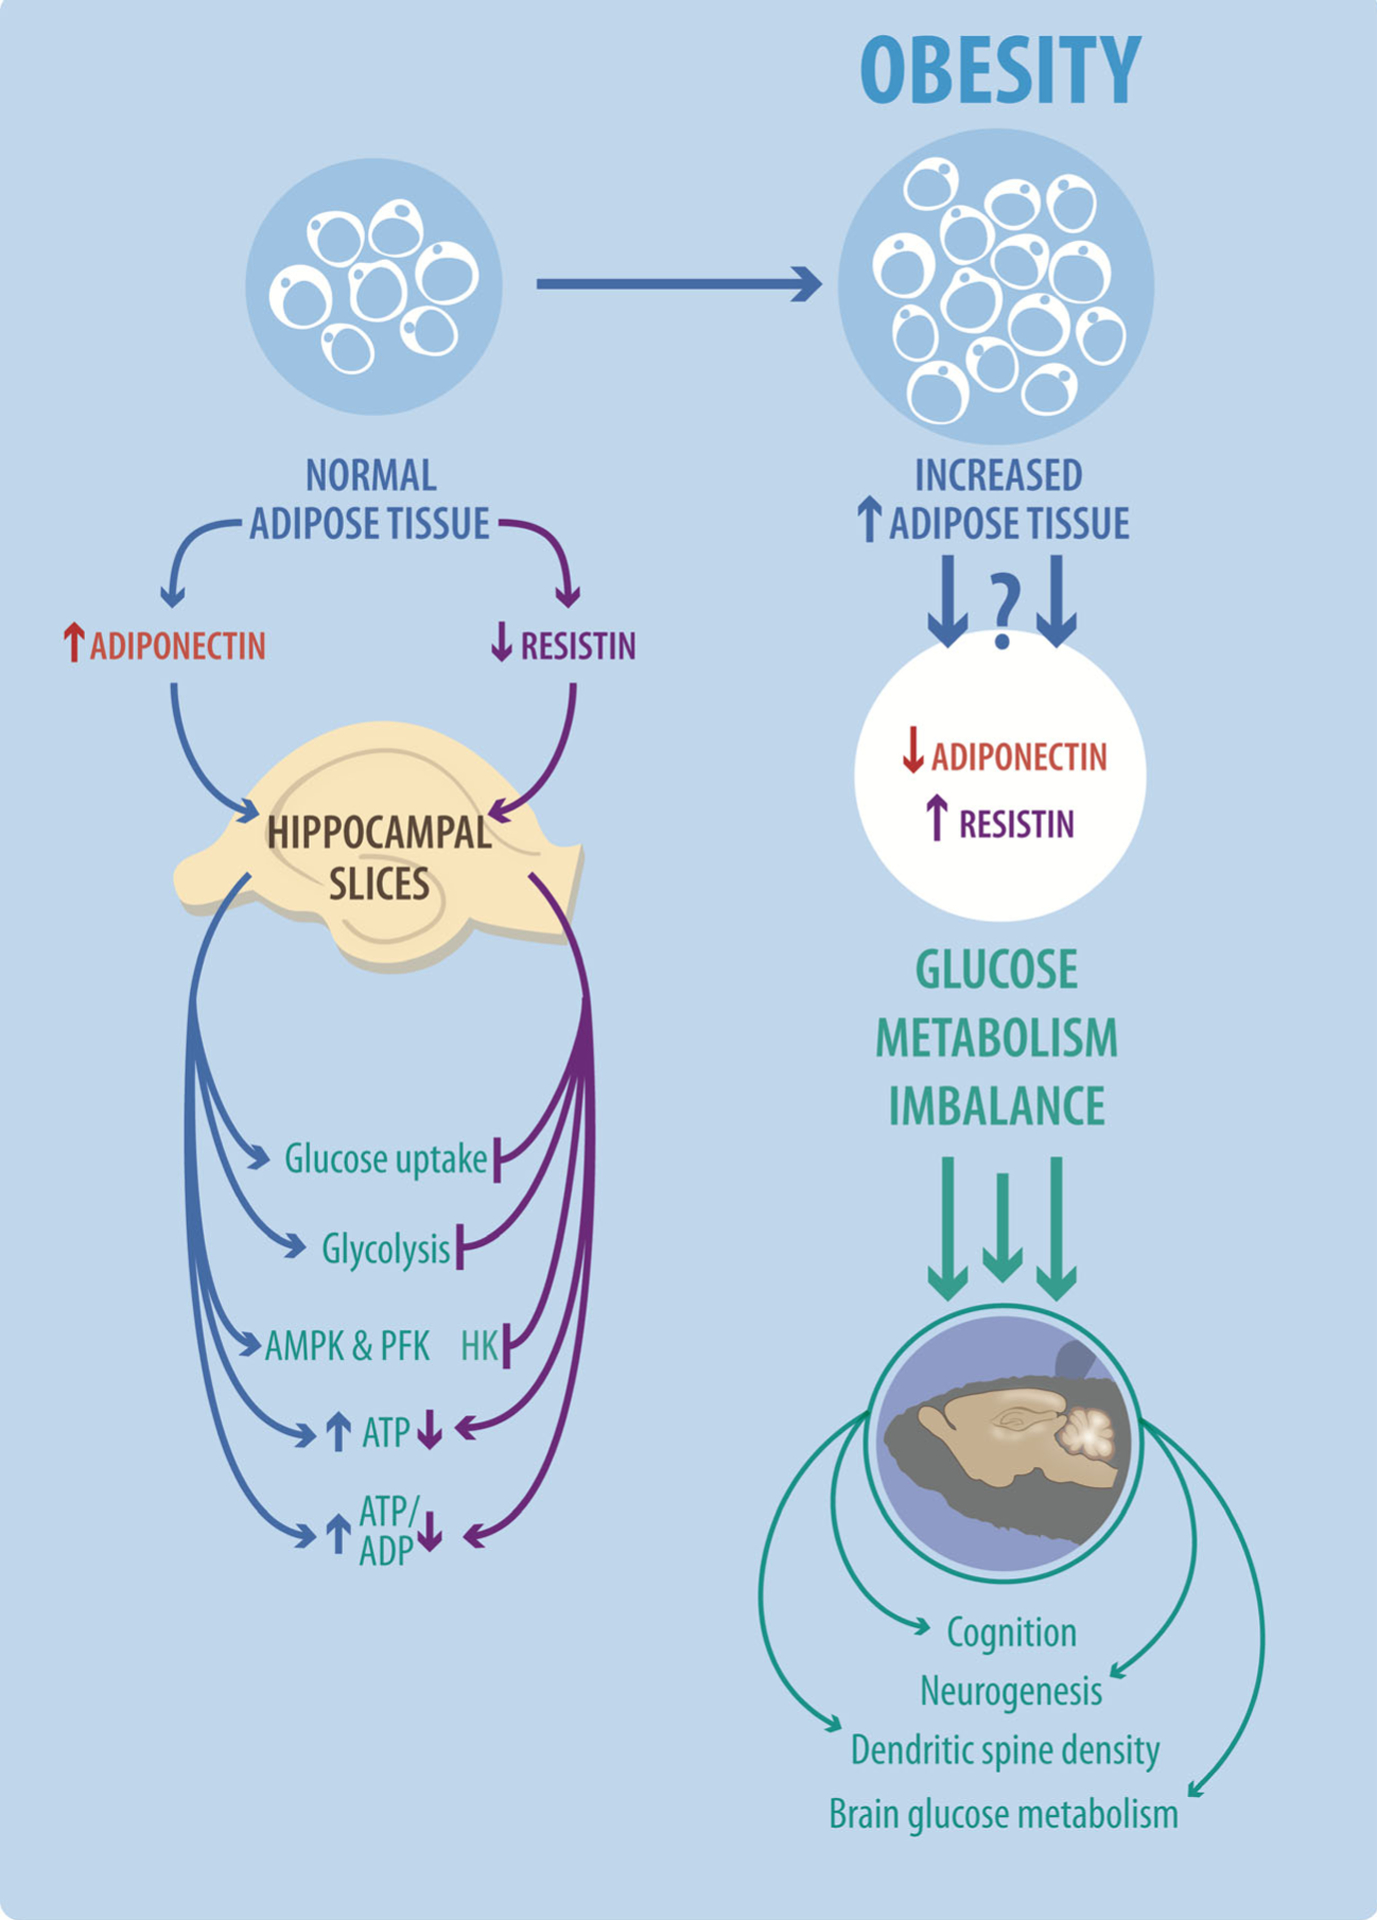
Representative model for the effects of adiponectin and resistin on glucose metabolism in neurons. Obesity increases the levels of adipose tissue, which triggers changes in the levels of several adipokines including an increase in the levels of resistin and a decrease in the levels of adiponectin in both serum and CSF. These changes could induce modifications in the general metabolic state of brain cells. We observed that adiponectin is able to stimulate glucose metabolism mainly through glycolysis with the generation of ATP and increasing the ATP/ADP ratio. These effects could be explained in part by the stimulation of the activity of PFK and AMPK by adiponectin. While resistin inhibits the uptake of glucose, glycolysis, and the levels of ATP, in this case, we did not observe an effect on PFK-1 and AMPK activities but detected an inhibition of HK activity
In contrast, we observed different effects when we treated the neurons with resistin. Resistin is typically detected at low levels in healthy humans with a normal BMI value. Described as a negative regulator of insulin signaling, resistin promotes a decrease in the metabolism of target cells [23, 62, 63]. Resistin levels are elevated in rodent models of obesity and diabetes, implicating dysregulation of resistin in these diseases [28]. Moreover, resistin inhibits insulin-stimulated glucose uptake in muscle cells [64, 65]. In wild-type mice, resistin infusion worsens glucose homeostasis and insulin sensitivity; conversely, antibody neutralization of resistin improved insulin action and lowered blood glucose in diet-induced obese mice [27, 28]. Resistin is thought to be a risk factor for dementia since it antagonizes insulin action and promotes obesity-associated inflammation [66]. When we stimulate neurons with a concentration of resistin typically found in the CSF of healthy, non-obese, individuals, we observed changes in glucose uptake and utilization. However, when the concentration of resistin was increased to levels described in obesity models, we observed an acute and rapid decrease in multiple metabolic parameters in cultured hippocampal neurons. Treatment with resistin induces a strong decrease in the affinity of the glucose transporter for glucose, without changes in the number of GLUT transporters in the membrane. Further, we did not observe changes in the Vmax value, arguing against fast translocation of new GLUTs into or out of the plasma membrane. The effect of resistin was independent of the presence of AKT and AMPK inhibitors, but co-incubation with an agonist of AMPK was able to normalize several parameters. The decrease we detected in the levels of ATP was not paralleled by changes in PPP activity. In contrast with adiponectin, treatment with resistin did not change the activity of either AMPK or PFK, but we observed a strong decrease in the activity of hexokinase, the first control point of glucose metabolism immediately after glucose enter cell. The effect observed in hippocampal neurons was similar to the result obtained from hippocampal slices. Yet, the mechanisms by which adiponectin and resistin regulate glucose metabolism are not clear, independent of the inhibition by product concentration (Fig. 5).
In this work, we described that two adipokines are able to modulate the glucose metabolism of neurons. However, in the results obtained from hippocampal slices, we can discard the role of glial cells. In the hippocampal slices, we could find several cells types, mainly neurons but also glial cells like astrocytes, microglia, and others [67]. Astrocytes are the most abundant type of cells in the CNS. They participate in maintaining normal brain function and are in constant communication with neurons, oligodendrocytes, and endothelial cells [68–70]. Astrocytes are critical in the regulation of the glucose metabolism, since several reports have described the role of these cells providing metabolic substrates for neuronal function; these functions could be altered during obesity, suggesting a possible role with adipokines [71, 72]. Until now, it has been described that astrocytes express the receptors for several adipokines but the specific effects of this molecules over the metabolic functions of astrocytes in normal or obesity condition are unknown [73]. The effects of adipokines over the metabolic function of astrocytes represent an interesting field that needs further studies.
Together, our data show that the levels of adiponectin are critical for brain function. The improvement of glucose metabolism is a described positive stimulus for several neuronal functions [31]. Recovery of glucose metabolism has been described as a positive stimulus against the progression of neurodegeneration in several pathologies such as AD [2, 74, 75]. In contrast, an increase in the levels of resistin significantly decreased glucose metabolism, a condition described in almost all neurodegenerative diseases [31]. Considering what has been described during obesity, understanding changes in the levels of adipokines could be critical for the development of new therapeutic approaches.
Funding Information
This work was supported by grants from the Basal Center of Excellence in Aging and Regeneration (CONICYT-AFB 170005) to N.C.I., FONDECYT (no. 1160724) to N.C.I., FONDECYT (no. 11160651) to P.C, and the National Institute of Health (DK084171) to G.W.W. We also thank the Sociedad Química y Minera de Chile (SQM) for the special grants “The role of K+ on Hypertension and Cognition” and “The role of Lithium in Human Health and Disease”.
Footnotes
Conflict of Interest The authors declare that they have no conflicts of interest.
References
- 1.Gustafson DR (2012) Adiposity and cognitive decline: Underlying mechanisms. J Alzheimers Dis 30:S97–S112. 10.3233/JAD-2012-120487 [DOI] [PubMed] [Google Scholar]
- 2.Rios JA, Cisternas P, Arrese M et al. (2014) Is Alzheimer’s disease related to metabolic syndrome? A Wnt signaling conundrum. Prog Neurobiol 121:125–146. 10.1016/j.pneurobio.2014.07.004 [DOI] [PubMed] [Google Scholar]
- 3.Cisternas P, Salazar P, Serrano FG, Montecinos-Oliva C, Arredondo SB, Varela-Nallar L, Barja S, Vio CP et al. (2015) Fructose consumption reduces hippocampal synaptic plasticity underlying cognitive performance. Biochim Biophys Acta Mol Basis Dis 1852:2379–2390. 10.1016/j.bbadis.2015.08.016 [DOI] [PMC free article] [PubMed] [Google Scholar]
- 4.Hruby A, Hu FB (2016) HHS public access. Pharmacoeconomics 33:673–689. 10.1007/s40273-014-0243-x.The [DOI] [PMC free article] [PubMed] [Google Scholar]
- 5.Apovian CM (2016) The obesity epidemic—understanding the disease and the treatment. N Engl J Med 374:177–179. 10.1056/NEJMe1514957 [DOI] [PubMed] [Google Scholar]
- 6.Twig G, Yaniv G, Levine H, Leiba A, Goldberger N, Derazne E, Ben-Ami Shor D, Tzur D et al. (2016) Body-mass index in 2.3 million adolescents and cardiovascular death in adulthood. N Engl J Med 374:2430–2440. 10.1056/NEJMoa1503840 [DOI] [PubMed] [Google Scholar]
- 7.Trayhurn P, Bing C, Wood IS (2006) The WALTHAM International Nutritional Sciences Symposia Adipose tissue and adipokines—energy regulation from the society1935–1939 [DOI] [PubMed]
- 8.Rosen ED, Spiegelman BM (2014) What we talk about when we talk about fat. Cell 156:20–44. 10.1016/j.cell.2013.12.012 [DOI] [PMC free article] [PubMed] [Google Scholar]
- 9.Gupta RK, Rosen ED, Spiegelman BM (2011) Identifying novel transcriptional components controlling energy metabolism. Cell Metab 14:739–745. 10.1016/j.cmet.2011.11.007 [DOI] [PMC free article] [PubMed] [Google Scholar]
- 10.Fasshauer M, Blüher M (2015) Adipokines in health and disease. Trends Pharmacol Sci 36:461–470. 10.1016/j.tips.2015.04.014 [DOI] [PubMed] [Google Scholar]
- 11.Kos K, Harte AL, Da Silva NF et al. (2007) Adiponectin and resistin in human cerebrospinal fluid and expression of adiponectin receptors in the human hypothalamus. J Clin Endocrinol Metab 92:1129–1136. 10.1210/jc.2006-1841 [DOI] [PubMed] [Google Scholar]
- 12.Kusminski CM, McTernan PG, Schraw T et al. (2007) Adiponectin complexes in human cerebrospinal fluid: distinct complex distribution from serum. Diabetologia 50:634–642. 10.1007/s00125-006-0577-9 [DOI] [PubMed] [Google Scholar]
- 13.Kiliaan AJ, Arnoldussen IAC, Gustafson DR (2014) Adipokines: a link between obesity and dementia? Lancet Neurol 13:913–923. 10.1016/S1474-4422(14)70085-7 [DOI] [PMC free article] [PubMed] [Google Scholar]
- 14.Bischof GN, Park DC (2015) Obesity and aging: consequences for cognition, brain structure, and brain function. Psychosom Med 77: 697–709. 10.1097/PSY.0000000000000212.Obesity [DOI] [PMC free article] [PubMed] [Google Scholar]
- 15.Ingelsson E, Risérus U, Berne C, Frystyk J, Flyvbjerg A, Axelsson T, Lundmark P, Zethelius B (2006) Adiponectin and risk of congestive heart failure. J Am Med Assoc 295:1772–1774 [DOI] [PubMed] [Google Scholar]
- 16.Yang Y, Hu W, Jiang S, Wang B, Li Y, Fan C, di S, Ma Z et al. (2015) The emerging role of adiponectin in cerebrovascular and neurodegenerative diseases. Biochim Biophys Acta 1852:1887–1894. 10.1016/j.bbadis.2015.06.019 [DOI] [PubMed] [Google Scholar]
- 17.Song J, Choi S, Kim BC (2017) Adiponectin regulates the polarization and function of microglia via ppar- γ signaling under amyloid β toxicity. Front Cell Neurosci 11:64 10.3389/fncel.2017.00064 [DOI] [PMC free article] [PubMed] [Google Scholar]
- 18.Ahima RS, Qi Y, Singhal NS, Jackson MB, Scherer PE (2006) Brain adipocytokine action and metabolic regulation. Diabetes 55:145–154. 10.2337/db06-S018 [DOI] [PubMed] [Google Scholar]
- 19.Chandran M, Phillips SA, Ciaraldi T, Henry RR (2003) Adiponectin: More than just another fat cell hormone? Diabetes Care 26:2442–2450 [DOI] [PubMed] [Google Scholar]
- 20.Sowers JR (2008) Endocrine functions of adipose tissue: focus on adiponectin. Clin Cornerstone 9:32–40. 10.1016/S1098-3597(08)60026-5 [DOI] [PubMed] [Google Scholar]
- 21.Yamauchi T, Kamon J, Waki H, Terauchi Y, Kubota N, Hara K, Mori Y, Ide T et al. (2001) The fat-derived hormone adiponectin reverses insulin resistance associated with both lipoatrophy and obesity. Nat Med 7:941–946. 10.1038/90984 [DOI] [PubMed] [Google Scholar]
- 22.Zhao L, Fu Z, Wu J, Aylor KW, Barrett EJ, Cao W, Liu Z (2015) Globular adiponectin ameliorates metabolic insulin resistance via AMPK-mediated restoration of microvascular insulin responses. J Physiol 593:4067–4079. 10.1113/JP270371 [DOI] [PMC free article] [PubMed] [Google Scholar]
- 23.Muse E, Lam T, Scherer P, Rossetti L (2007) Hypothalamic resistin induces hepatic insulin resistance. J Clin Invest 117:1670–1678. 10.1172/JCI30440DS1 [DOI] [PMC free article] [PubMed] [Google Scholar]
- 24.Steppan CM, Lazar MA (2004) The current biology of resistin. J Intern Med 255:439–447. 10.1111/j.1365-2796.2004.01306.x [DOI] [PubMed] [Google Scholar]
- 25.Rajala MW, Obici S, Scherer PE, Rossetti L (2003) Adipose-derived resistin and gut-derived resistin-like molecule? Selectively impair insulin action on glucose production. J Clin Invest 111:225–230. 10.1172/JCI200316521 [DOI] [PMC free article] [PubMed] [Google Scholar]
- 26.Steppan CM, Bailey ST, Bhat S et al. (2001) News/The hormone resistin links obesity to diabetes. Nature 409(6818):307–312 [DOI] [PubMed] [Google Scholar]
- 27.Steppan CM, Bailey ST, Bhat S, Brown EJ, Banerjee RR, Wright CM, Patel HR, Ahima RS et al. (2001) The hormone resistin links obesity to diabetes. Nature 409:307–312. 10.1038/35053000 [DOI] [PubMed] [Google Scholar]
- 28.Steppan CM, Brown EJ, Wright CM, Bhat S, Banerjee RR, Dai CY, Enders GH, Silberg DG et al. (2001) A family of tissue-specific resistin-like molecules. Proc Natl Acad Sci 98:502–506. 10.1073/pnas.98.2.502 [DOI] [PMC free article] [PubMed] [Google Scholar]
- 29.Attwell D, Laughlin SB (2001) An energy budget for signaling in the grey matter of the brain. J Cereb Blood Flow Metab 21:1133–1145. 10.1097/00004647-200110000-00001 [DOI] [PubMed] [Google Scholar]
- 30.Harris JJ, Jolivet R, Attwell D (2012) Synaptic energy use and supply. Neuron 75:762–777. 10.1016/j.neuron.2012.08.019 [DOI] [PubMed] [Google Scholar]
- 31.Cisternas P, Inestrosa NC (2017) Brain glucose metabolism: role of Wnt signaling in the metabolic impairment in Alzheimer’s disease. Neurosci Biobehav Rev 80:316–328. 10.1016/j.neubiorev.2017.06.004 [DOI] [PubMed] [Google Scholar]
- 32.Emmerzaal TL, Kiliaan AJ, Gustafson DR (2015) 2003–2013: a decade of body mass index, Alzheimer’s disease, and dementia. J Alzheimers Dis 43:739–755. 10.3233/JAD-141086 [DOI] [PubMed] [Google Scholar]
- 33.Arrazola MS, Varela-Nallar L, Colombres M et al. (2009) Calcium/calmodulin-dependent protein kinase type IV is a target gene of the Wnt/beta-catenin signaling pathway. J Cell Physiol 221:658–667. 10.1002/jcp.21902 [DOI] [PubMed] [Google Scholar]
- 34.Cerpa W, Farias GG, Godoy JA et al. (2010) Wnt-5a occludes Abeta oligomer-induced depression of glutamatergic transmission in hippocampal neurons. Mol Neurodegener 5:3 10.1186/1750-1326-5-3 [DOI] [PMC free article] [PubMed] [Google Scholar]
- 35.Cisternas P, Salazar P, Silva-Álvarez C, Barros LF, Inestrosa NC (2016) Activation of Wnt signaling in cortical neurons enhances glucose utilization through glycolysis. J Biol Chem 291:25950–25964. 10.1074/jbc.M116.735373 [DOI] [PMC free article] [PubMed] [Google Scholar]
- 36.Cisternas P, Silva-Alvarez C, Martínez F et al. (2014) The oxidized form of vitamin C, dehydroascorbic acid, regulates neuronal energy metabolism. J Neurochem 129:663–671. 10.1111/jnc.12663 [DOI] [PubMed] [Google Scholar]
- 37.Barros LF, Bittner CX, Loaiza A et al. (2009) Kinetic validation of 6-NBDG as a probe for the glucose transporter GLUT1 in astrocytes. J Neurochem 109(Suppl):94–100. 10.1111/j.1471-4159.2009.05885.x [DOI] [PubMed] [Google Scholar]
- 38.Herrero-Mendez A, Almeida A, Fernandez E et al. (2009) The bioenergetic and antioxidant status of neurons is controlled by continuous degradation of a key glycolytic enzyme by APC/C-Cdh1. Nat Cell Biol 11:747–752. 10.1038/ncb1881 [DOI] [PubMed] [Google Scholar]
- 39.Bolaños JP, Delgado-Esteban M, Herrero-Mendez A, Fernandez-Fernandez S, Almeida A (2008) Regulation of glycolysis and pentose-phosphate pathway by nitric oxide: Impact on neuronal survival. Biochim Biophys Acta Bioenerg 1777:789–793. 10.1016/j.bbabio.2008.04.011 [DOI] [PubMed] [Google Scholar]
- 40.Calkins MJ, Manczak M, Mao P, Shirendeb U, Reddy PH (2011) Impaired mitochondrial biogenesis, defective axonal transport of mitochondria, abnormal mitochondrial dynamics and synaptic degeneration in a mouse model of Alzheimer’s disease. Hum Mol Genet 20:4515–4529. 10.1093/hmg/ddr381 [DOI] [PMC free article] [PubMed] [Google Scholar]
- 41.Moreno-Navarrete JM, Ortega FJ, Rodríguez-Hermosa JI et al. (2011) OCT1 expression in adipocytes could contribute to increased metformin action in obese subjects. Diabetes 60:168–176. 10.2337/db10-0805 [DOI] [PMC free article] [PubMed] [Google Scholar]
- 42.Stow LR, Jacobs ME, Wingo CS, Cain BD (2016) Endothelin—1 gene regulation. FASEB J 25:16–28. 10.1096/fj.10 [DOI] [PMC free article] [PubMed] [Google Scholar]
- 43.Thurley K, Herbst C, Wesener F, Koller B, Wallach T, Maier B, Kramer A, Westermark PO (2017) Principles for circadian orchestration of metabolic pathways. Proc Natl Acad Sci 114:1572–1577. 10.1073/pnas.1613103114 [DOI] [PMC free article] [PubMed] [Google Scholar]
- 44.Varela-Nallar L, Parodi J, Farias GG, Inestrosa NC (2012) Wnt-5a is a synaptogenic factor with neuroprotective properties against Abeta toxicity. Neurodegener Dis 10:23–26. 10.1159/000333360000333360 [DOI] [PubMed] [Google Scholar]
- 45.Chen G, Chen KS, Knox J et al. (2000) A learning de ® cit related to age and b -amyloid plaques in a mouse model of Alzheimer’s disease. Nature 408:975–979 [DOI] [PubMed] [Google Scholar]
- 46.Anstey KJ, Cherbuin N, Budge M, Young J (2011) Body mass index in midlife and late-life as a risk factor for dementia: a meta-analysis of prospective studies. Obes Rev 12:e426–e437. 10.1111/j.1467-789X.2010.00825.x [DOI] [PubMed] [Google Scholar]
- 47.Jauch-Chara K, Oltmanns KM (2014) Obesity—a neuropsychological disease? Systematic review and neuropsychological model. Prog Neurobiol 114:4–101. 10.1016/j.pneurobio.2013.12.001 [DOI] [PubMed] [Google Scholar]
- 48.Whitmer RA, Gunderson EP, Quesenberry CP Jr et al. (2007) Body mass index in midlife and risk of Alzheimer disease and vascular dementia. Curr Alzheimer Res 4:103–109. 10.2174/156720507780362047 [DOI] [PubMed] [Google Scholar]
- 49.Xu WL, Atti AR, Gatz M, Pedersen NL, Johansson B, Fratiglioni L (2011) Midlife overweight and obesity increase late-life dementia risk: a population-based twin study. Neurology 76:1568–1574. 10.1212/WNL.0b013e3182190d09 [DOI] [PMC free article] [PubMed] [Google Scholar]
- 50.Ashrafian H, Harling L, Darzi A, Athanasiou T (2013) Neurodegenerative disease and obesity: what is the role of weight loss and bariatric interventions? Metab Brain Dis 28:341–353. 10.1007/s11011-013-9412-4 [DOI] [PubMed] [Google Scholar]
- 51.Dandona P, Aljada A, Chaudhuri A, Mohanty P, Garg R (2005) Metabolic syndrome: a comprehensive perspective based on interactions between obesity, diabetes, and inflammation. Circulation 111:1448–1454. 10.1161/01.CIR.0000158483.13093.9D [DOI] [PubMed] [Google Scholar]
- 52.Bhat NR (2010) Linking cardiometabolic disorders to sporadic Alzheimer’s disease: a perspective on potential mechanisms and mediators. J Neurochem 115:551–562. 10.1111/j.1471-4159.2010.06978.x [DOI] [PMC free article] [PubMed] [Google Scholar]
- 53.Mitchell AC, Leak RK, Zigmond MJ, Cameron JL, Mirnics K (2012) Gene transcripts associated with BMI in the motor cortex and caudate nucleus of calorie restricted rhesus monkeys. Genomics 99:144–151. 10.1016/j.ygeno.2011.12.006 [DOI] [PMC free article] [PubMed] [Google Scholar]
- 54.Huffman DM, Barzilai N (2009) Role of visceral adipose tissue in aging. Biochim Biophys Acta Gen Subj 1790:1117–1123. 10.1016/j.bbagen.2009.01.008 [DOI] [PMC free article] [PubMed] [Google Scholar]
- 55.Sutinen EM, Pirttilä T, Anderson G, Salminen A, Ojala JO (2012) Pro-inflammatory interleukin-18 increases Alzheimer’s disease-associated amyloid-β production in human neuron-like cells. J Neuroinflammation 9:1–14. 10.1186/1742-2094-9-199 [DOI] [PMC free article] [PubMed] [Google Scholar]
- 56.Gustafson DR (2010) Adiposity hormones and dementia. J Neurol Sci 299:30–34. 10.1016/j.jns.2010.08.036 [DOI] [PubMed] [Google Scholar]
- 57.Kubota N, Yano W, Kubota T, Yamauchi T, Itoh S, Kumagai H, Kozono H, Takamoto I et al. (2007) Adiponectin stimulates AMP-activated protein kinase in the hypothalamus and increases food intake. Cell Metab 6:55–68. 10.1016/j.cmet.2007.06.003 [DOI] [PubMed] [Google Scholar]
- 58.Thundyil J, Pavlovski D, Sobey CG, Arumugam TV (2012) Adiponectin receptor signalling in the brain. Br J Pharmacol 165: 313–327. 10.1111/j.1476-5381.2011.01560.x [DOI] [PMC free article] [PubMed] [Google Scholar]
- 59.Ng RCL, Cheng OY, Jian M, Kwan JSC, Ho PWL, Cheng KKY, Yeung PKK, Zhou LL et al. (2016) Chronic adiponectin deficiency leads to Alzheimer’s disease-like cognitive impairments and pathologies through AMPK inactivation and cerebral insulin resistance in aged mice. Mol Neurodegener 11:71 10.1186/s13024-016-0136-x [DOI] [PMC free article] [PubMed] [Google Scholar]
- 60.Ng RCL, Chan KH (2017) Potential neuroprotective effects of adiponectin in Alzheimer’s disease. Int J Mol Sci 18:1–13. 10.3390/ijms18030592 [DOI] [PMC free article] [PubMed] [Google Scholar]
- 61.Giordano V, Peluso G, Iannuccelli M, Benatti P, Nicolai R, Calvani M (2007) Systemic and brain metabolic dysfunction as a new paradigm for approaching Alzheimer’s dementia. Neurochem Res 32: 555–567 [DOI] [PubMed] [Google Scholar]
- 62.Benomar Y, Gertler A, De Lacy P et al. (2013) Central resistin overexposure induces insulin resistance through toll-like receptor 4. Diabetes 62:102–144. 10.2337/db12-0237 [DOI] [PMC free article] [PubMed] [Google Scholar]
- 63.Emanuelli B, Peraldi P, Filloux C, Sawka-Verhelle D, Hilton D, van Obberghen E (2000) SOCS-3 is an insulin-induced negative regulator of insulin signaling. J Biol Chem 275:15985–15991. 10.1074/jbc.275.21.15985 [DOI] [PubMed] [Google Scholar]
- 64.Fan H-Q, Gu N, Liu F et al. (2007) Prolonged exposure to resistin inhibits glucose uptake in rat skeletal muscles. Acta Pharmacol Sin 28:410–416. 10.1111/j.1745-7254.2007.00523.x [DOI] [PubMed] [Google Scholar]
- 65.Moon B, Kwan JJ-M, Duddy N, Sweeney G, Begum N (2003) Resistin inhibits glucose uptake in L6 cells independently of changes in insulin signaling and GLUT4 translocation. Am J Physiol Endocrinol Metab 285:E106–E115. 10.1152/ajpendo.00457.2002 [DOI] [PubMed] [Google Scholar]
- 66.Bednarska-Makaruk M, Graban A, Wiśniewska A, Łojkowska W, Bochyńska A, Gugała-Iwaniuk M, Sławińska K, Ługowska A et al. (2017) Association of adiponectin, leptin and resistin with inflammatory markers and obesity in dementia. Biogerontology 18:561–580. 10.1007/s10522-017-9701-0 [DOI] [PMC free article] [PubMed] [Google Scholar]
- 67.Zeisel A, Muñoz-Manchado AB, Codeluppi S et al. (2015) Brain structure. Cell types in the mouse cortex and hippocampus revealed by single-cell RNA-seq. Science 347:1138–1142. 10.1126/science.aaa1934 [DOI] [PubMed] [Google Scholar]
- 68.Argente-Arizón P, Guerra-Cantera S, Garcia-Segura LM et al. (2016) Glial cells and energy balance. J Mol Endocrinol. 10.1530/JME-16-0182 [DOI] [PubMed] [Google Scholar]
- 69.Liu B, Teschemacher AG, Kasparov S (2017) Neuroprotective potential of astroglia. J Neurosci Res 95:2126–2139 [DOI] [PubMed] [Google Scholar]
- 70.Magistretti PJ, Pellerin L (1999) Cellular mechanisms of brain energy metabolism and their relevance to functional brain imaging. Philos Trans R Soc Lond B Biol Sci 354(1387):1155–1163 [DOI] [PMC free article] [PubMed] [Google Scholar]
- 71.Magistretti PJ, Sorg O, Naichen Y, Pellerin L, de Rham S, Martin JL (1994) Regulation of astrocyte energy metabolism by neurotransmitters. Ren Physiol Biochem 17:168–171 [DOI] [PubMed] [Google Scholar]
- 72.Jolivet R, Allaman I, Pellerin L, Magistretti PJ, Weber B (2010) Comment on recent modeling studies of astrocyte-neuron metabolic interactions. J Cereb Blood Flow Metab 30:1982–1986. 10.1038/jcbfm.2010.132 [DOI] [PMC free article] [PubMed] [Google Scholar]
- 73.Martin-Jiménez CA, Gaitán-Vaca DM, Echeverria V et al. (2016) Relationship between obesity, Alzheimer’s disease, and Parkinson’s disease: an astrocentric view. Mol Neurobiol:1–20. 10.1007/s12035-016-0193-8 [DOI] [PubMed] [Google Scholar]
- 74.Reger MA, Watson GS, Green PS et al. (2008) Intranasal insulin improves cognition and modulates beta-amyloid in early AD. Neurology 70:440–448. 10.1212/01.WNL.0000265401.62434.36 [DOI] [PubMed] [Google Scholar]
- 75.Chapman CD, Frey WH, Craft S, Danielyan L, Hallschmid M, Schiöth HB, Benedict C (2013) Intranasal treatment of central nervous system dysfunction in humans. Pharm Res 30:2475–2484. 10.1007/s11095-012-0915-1 [DOI] [PMC free article] [PubMed] [Google Scholar]