

Abstract
The results obtained by using an existing model to estimate global solar radiation (GHI) in three different locations in Tunisia. These data are compared with GHI meteorological measurements and PV_Gis satellite imagery estimation. Some statistical indicators (R, R2, MPE, AMPE, MBE, AMBE and RMSE) have been used to measure the performance of the used model. Correlation coefficient for the different stations was close to 1.0. The meteorology and satellite determination coefficient (R2) were also near 1.0 except in the case of Nabeul station in which the meteorology measurements (R) were equals to 0.5848 because of the loss of data in this location due to meteorological conditions. This numerical model provides the best performance according to statistical results in different locations; therefore, this model can be used to estimate global solar radiation in Tunisia. The R square values are used as a statistical indicator to demonstrate that the model’s results are compatible with those of meteorology with a percentage of error less than 10%.
Subject terms: Energy science and technology, Mathematics and computing
Introduction
Knowledge of local solar radiation is essential for many applications. Despite the importance of solar radiation measurements, this information’s source is not available due to the high cost of the sensors and it needs of continuous maintenance and calibration requirements1–3. The limited coverage of radiation values dictates the need to develop models to estimate solar radiation based on other more readily available, data4–8. The aim of the appraisal is to specify and classify sum of sites in Tunisia9–12. This evaluation is important to have significant data on which the development model can be based to furnish a broad roadmap for coming project developed13–15. Generally, the solar data on-ground needs the use of meteorological stations for 10 years.
The main factors were considered in this approach such as water resources, economic, costs, and environmental considerations16–18.
Experiences and Investigations takes away for the last thirteen years have shown that it require at length eleven years of solar data to predict the values of the global solar radiation19–22. This signifies that it is infeasible to construct PV plants in few years because weather stations are not capable of provides data that cover 11 years23–25. Furthermore, that satellite imagery of radiation is not sufficient for the selection. A lot of PV plant installation methods were developed to solar assessment that help to create a numerical model26–29. This method provides the values for different locations using defined parameters like latitude, longitude, and other specific parameters30–32.
The objective of this study was to validate a model used in prediction monthly global solar radiation on a horizontal surface. This validation based on a comparison between measured data provided by the National Institute of Meteorology of Tunisia (NIM_ Tunisia) and the GHI estimates from satellite PV_Gis. several stations were selected: Bizerte in Northern of Tunisia, Nabeul in the northern east of Tunisia and Djerba in the southern of Tunisia. The results show that the established model can be favorably used to calculate the GHI for all the seasons of year and all days in any location.
The commonly used model yields good results using the main meteorological and physical parameters: the extraterrestrial radiation, the hour angle, the atmospheric optical distance, the elevation, and the latitude. In our model, a good congruence was verified at the three stations with an error percentage less than 10%. Moreover, while most estimation models of monthly global solar radiation use the sunshine ratio, the persistent challenge for them is that well-functioning methods to determine clear sky global irradiance are still unavailable. Therefore, we propose this model as an efficient approach to predict the global solar radiation all over Tunisia. Its efficiency rests in its capacity to provide accurate measurements at all stations because it can be calibrated to estimate the data in all Tunisian locations and yield good results close to those generated by meteorological stations and satellite imagery33–35.
The strength of this study lies in being the first in Tunisia to provide an approach of generating local solar radiation using a numerical model. Thus, its results make a great contribution to the literature, the applications that require solar radiation data and the applications used in solar energy production.
Materials and sources
Instrument of measurement of NIM of Tunisia
The pyranometer is a radiometer designed for measuring the GHI, provides experimental data. The received flux is converted to heat by the blackened surface. The variance of the temperature between the surface and the instrument is in proportion to the irradiance of the GHI. It can be detected by a “Thermopile” that consists of a number of thermocouple junctions, usually joined together in series36,37.
In this section of study, we use data for several stations Bizerte, Nabeul and Djerba. In this location kipp_Zonen pyranometer is used for different measurements.
Solar radiation estimates from PV_Gis satellite imagery
We present in this section the results of the prediction of the solar radiation from satellite imagery PV_GIS38. PVGIS provide an accurate solar radiation free database for Europe, Africa Mediterranean, and South-West Asia. It provides yearly average irradiation as well as the sum of the average sum of GHI per square meter received by the modules of the system in KWh/m2. Moreover, it must be highlighted that the uncertain of measurement in the spatial interpolation of ground station data in several locations is present. This is caused by the distance between different station and the local climatic conditions (Fig. 1).
Figure 1.

PVGIS satellite imagery’s interface.
Numerical simulation
To validate the result and to achieve closeness between the DNI provided by satellite imagery and meteorology, a numerical model is detailed to predict the global solar radiation.
Global solar radiation estimation
The basic solar radiation equations and the empirical relations are used in this section to give the GHI as a result. The very important equations are detailed in29,39. They determine the solar irradiance incident on a PV or solar panel array inclined with an angle and oriented with an angle for the south direction. Using the declination and the hour angle we can calculate the sun position:
| 1 |
where is an integer representing the number of the day , is the Solar time:
| 2 |
where A = 2(0.986n + 100) and B = 0.986n−2, where is the legal time, N is the time zone, is the seasonal correction, and L being the longitude.
The sun elevation angle , its azimuth angle and the sunlight duration satisfy the Eq. (3)
| 3 |
where present the latitude. The solar global irradiance incident on a photovoltaic array is composed of the direct irradiance and of the diffuse :
| 4 |
The solar direct irradiance is expressed by
| 5 |
where is the Direct irradiance,
| 6 |
with being the atmospheric optical distance.
where c = 1–0.1z and at the altitude and is the Linke turbidity factor. The diffuse irradiance can be given by:
| 7 |
with being the albedo, being the atmospherical diffuse irradiance on a horizontal surface, and being the global solar irradiance:
| 8 |
Results and discussion
Experimentations were carried out in three different positions in Tunisia.
Different results are validated with those given by the meteorological station and the satellite imagery.
A good congruence between the experiment, meteorology, and satellite imagery for the GHI is found (See Tables 1, 2 and 3).
Table 1.
GHI values of Bizerte station.
| Months | GHI (Kwh/m2) | |||
|---|---|---|---|---|
| Numerical model | Satellite | Meteorology | Number of measured days | |
| Jan | 69 | 72 | 68 | 31 |
| Feb | 76 | 88 | 74 | 28 |
| Mar | 126 | 149 | 119 | 29 |
| Apr | 182 | 173 | 179 | 28 |
| May | 220 | 212 | 215 | 31 |
| Jun | 248 | 235 | 240 | 30 |
| Jul | 239 | 247 | 239 | 30 |
| Aug | 214 | 216 | 208 | 31 |
| Sep | 126 | 160 | 137 | 27 |
| Oct | 98 | 125 | 88 | 26 |
| Nov | 79 | 79 | 77 | 30 |
| Dec | 69 | 65 | 71 | 31 |
Table 2.
GHI values of Nabeul station.
| Months | Global solar radiation (Kwh/m2) | |||
|---|---|---|---|---|
| Numerical model | Satellite | Meteorology | Number of measured days | |
| Jan | 80 | 82 | 79 | 28 |
| Feb | 96 | 98 | 82 | 27 |
| Mar | 158 | 161 | 130 | 29 |
| Apr | 182 | 182 | 193 | 30 |
| May | 220 | 223 | 211 | 30 |
| Jun | 228 | 239 | 193 | 30 |
| Jul | 231 | 250 | 121 | 16 |
| Aug | 221 | 221 | 39 | 6 |
| Sep | 160 | 161 | 155 | 29 |
| Oct | 130 | 132 | 101 | 28 |
| Nov | 89 | 90 | 82 | 28 |
| Dec | 75 | 75 | 31 | 13 |
Table 3.
GHI values of Djerba station.
| Months | Global solar radiation (Kwh/m2) | |||
|---|---|---|---|---|
| Numerical model | Satellite | Meteorology | Number of measured days | |
| Jan | 103 | 103 | 108 | 31 |
| Feb | 120 | 122 | 115 | 28 |
| Mar | 170 | 183 | 172 | 31 |
| Apr | 201 | 202 | 203 | 30 |
| May | 229 | 232 | 234 | 31 |
| Jun | 230 | 243 | 233 | 30 |
| Jul | 229 | 254 | 229 | 30 |
| Aug | 203 | 229 | 203 | 30 |
| Sep | 170 | 177 | 171 | 30 |
| Oct | 134 | 150 | 134 | 31 |
| Nov | 97 | 108 | 97 | 30 |
| Dec | 89 | 93 | 89 | 31 |
The congruence is verified also in Figs. 2 and 3, which show the calculated values of monthly measured GHI, meteorological and satellite of the different locations. They show the good results obtained by the GHI numerical model. It can be deducted that the maximum monthly average daily GHI 248.92 KWh/m2 was in Bizerte station in June. This explains the highest amount of bright sunshine attainment in summer.
Figure 2.

GHl for Bizerte using meteorology data measured, satellite estimation and numerical model’s result.
Figure 3.

GHI for Nabeul station using Meteorology data measured, satellite estimation and numerical model’s result.
Figure 3 represent the GHI for Nabeul station from January, 1 to December, 31 It shows that the numerical model gives a good estimation for the whole year only for July in which the measurement from meteorology station of Nabeul are taken during 16 days and August in which the measurements were taken over 6 days. This explains the role of numerical simulation to correct the messing data and to validate the unavailable data for any location in Tunisia from the year.
The evaluation of the performance
According to Fig. 4 we have in the same diagram curves that represent the measured values given by the NIM of Tunisia and the results estimated by the numerical model and the mean errors between the measured data and those calculated by the model. Error values range between 2 and 10%.
Figure 4.

Difference between estimated and measured GHI. Data registered at the station of Nabeul.
Principally, this incongruity is mostly due, first to the lack of data in case of impossibility for the meteorological pyranometer’s failure to provide the right measurement such as in Nabeul station. In July the measurement was received all over 16 days and in August they were taken in 6 days. Second, this is justified by the inaccuracy and errors in the mentioned data of radiation and the temperature degrees from the location.
The performance of the model I evaluated by comparing the calculated global solar radiation with the measured data and those estimated by the satellite imagery.
Several statistical tests were used to control the validation and the goodness of the regression models in terms of the coefficient of determination.
To check the relation between measured and estimated data, we generally use a statistical method by calculating the coefficient of determination , which can be expressed by the following equation:
| 9 |
where ,,, RMSE are the measured GHI ,the calculated GHI, the average of the measured GHI, and the root mean square error40,41.
The root mean square of , is the correlation coefficient (R) which is a linear correlation coefficient that returns a value of between − 1 and + 1 we can so deduce if a good linear relationship between measured and estimated data exist or not (case of R = 0).
To prove the agreement between the measured and calculated values, we can evaluate the percent error (PE) which is mentioned below. Thus the results of the PE calculations remain between threshold values that indicate the validity of the models. The (MPE) is obtained by the sum of the PE values and the number of observations. The absolute of the MPE value is designated as Mean Absolute Percent Error (MAPE).
| 10 |
| 11 |
| 12 |
In addition to these later equations, statistical errors are generally used to calculate the regression model, which are Mean Biased Error (MBE), Mean Absolute Biased Error (MABE) and Root Mean Square Error (RMSE) (see Table 4).
| 13 |
| 14 |
| 15 |
Table 4.
Statistical results of the monthly GHI for different stations.
| Station | PE | MAPE | MPE | MBE | MABE | RMSE | R2 | R | |
|---|---|---|---|---|---|---|---|---|---|
| Bizerte | Satellite | − 6,3434 | 5,6604 | 6,3434 | 5,9504 | 11,9339 | 15,6853 | 0,9562 | 0,9779 |
| Meteorology | 1,6337 | 10,2852 | − 1,6337 | − 2,5278 | 4,7520 | 5,9096 | 0,9940 | 0,9970 | |
| Nabeul | Satellite | − 1,9921 | 1,9921 | 1,9921 | 3,5667 | 3,5667 | 6,2826 | 0,9948 | 0,9974 |
| Meteorology | 22,1478 | 23,1826 | − 22,1478 | − 37,4917 | 39,3750 | 64,8224 | 0,3419 | 0,5848 | |
| Djerba | Satellite | 0,5848 | 5,9684 | 5,9684 | 9,9667 | 9,9667 | 13,0264 | 0,9813 | 0,9906 |
| Meteorology | − 0,5197 | 1,3158 | 0,5197 | 0,9667 | 2,0000 | 2,7638 | 0,9978 | 0,9989 |
Comparison between the measured and the estimated values of global solar radiation
Bizerte station
The correlation coefficient of the evaluated meteorology and satellite imagery are closer to 1.0. The highest correlation coefficient of the global solar radiation is obtained as 0.9970 with meteorology data, while for satellite imagery the value is obtained as 0.9779. It indicates that our model has good agreement with meteorology rather than satellite imagery. The lowest values of the statistical analysis are obtained as PE (1.6337) MPE (− 1.6337) MBE (− 2.5278) MABE (4.7520) RMSE (5.9096).
Nabeul station
The correlation coefficient of the meteorology and the satellite imagery data at Nabeul station is acquired as 0.5848 (the lowest) and 0.9974 (the highest) respectively. The lowest MAPE (1.9921), MPE (1.992), MBE (3.5667), MABE (3.5667), RMSE (6.2628) are obtained from satellite imagery while meteorology gives the highest value due to the loss of the measurement.
Djerba station
The lowest and highest values of correlation coefficient between calculated and measured global solar radiation at Djerba station are obtained from satellite imagery (0.9906) and for meteorology (0.9989). The optimal PE is obtained from meteorology (− 0.5197). The required ideal values of the MAPE, MPE, MBE, RMSE from meteorology such as 1.3158, 0.5197, 0.9667, 2.000, 2.7638, respectively.
Results from three chosen stations indicate that the model better agrees with meteorology data than satellite imagery. They are indicative for the performance of the model for estimating GHI in different locations in Tunisia.
The goodness of the estimation of GHI shown in Figs. 5, 6 and 7. These statistical results can explain the performance of the used model for estimation.
Figure 5.
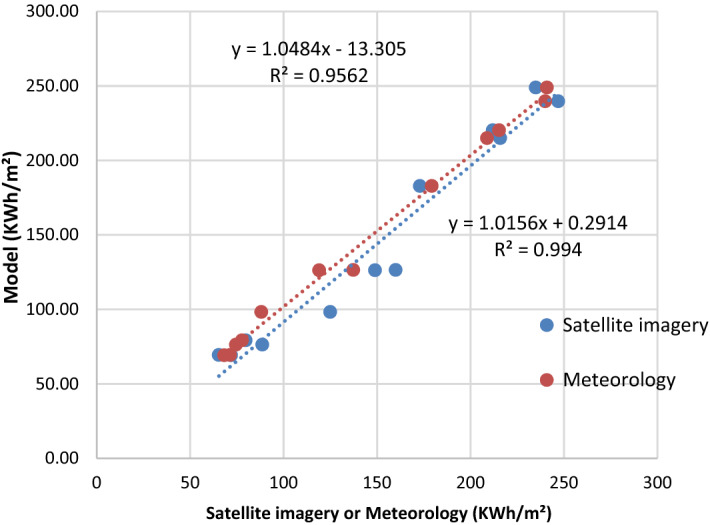
Comparison between measured and estimated GHI at the station of Bizerte.
Figure 6.
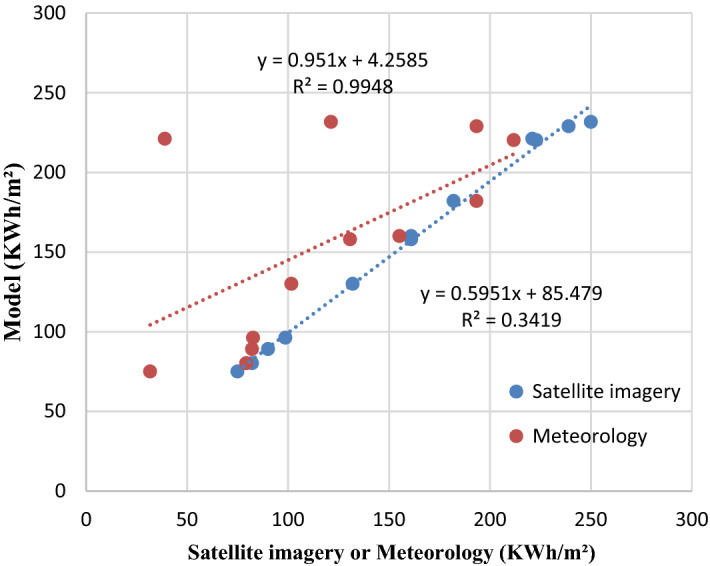
Comparison between measured and estimated GHI at the station of Nabeul.
Figure 7.
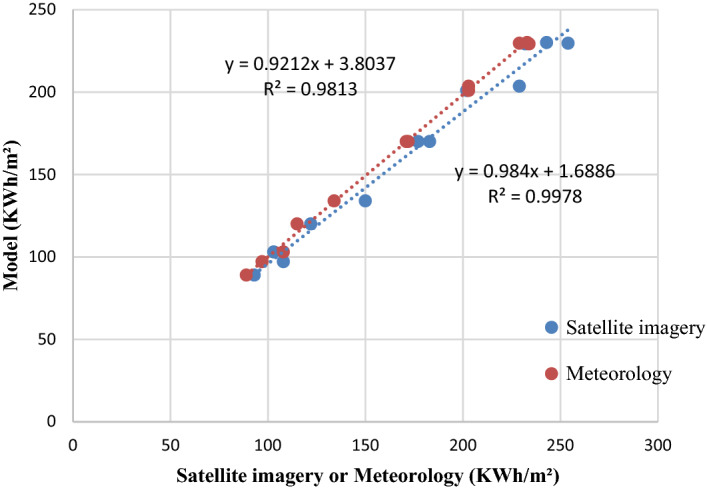
Comparison between measured and estimated GHI at the station of Djerba.
Conclusion
The global solar radiation measured by pyranometers must be corrected for the obscured part of the sky and for the technical problem due to the use of electronic sensors. The obtained results through simulation of numerical model give better estimation of global solar radiation.
We can deduce that with these conditions, errors for predicted GHI did not surpass 10%. For the used model is highly accurate for estimating global solar radiation at all Tunisian sites to help researcher to choose the right location to install more PV system efficient.
Acknowledgements
The authors would like to acknowledge, The National Institute of Meteorology of Tunisia for providing solar radiation data and experimental facilities. The European Commission Joint Research Centre (JRC) for providing authorization to use the PVGIS maps and related data.
Competing interests
The authors declare no competing interests.
Footnotes
Publisher's note
Springer Nature remains neutral with regard to jurisdictional claims in published maps and institutional affiliations.
References
- 1.Louche A, Notton G, Poggi P, Simonnot G. Correlations for direct normal and global horizontal irradiations on a French Mediterranean site. Sol. Energy. 1991;46(4):261–266. doi: 10.1016/0038-092X(91)90072-5. [DOI] [Google Scholar]
- 2.Srivastava SK, Sinoh OP, Pandy GN. Estimation of global solar radiation in Uttar Pradesh (India) and comparison of some existing correlations. Sol. Energy. 1991;51:27–29. doi: 10.1016/0038-092X(93)90038-P. [DOI] [Google Scholar]
- 3.Sen Z. Fuzzy algorithm for estimation of solar irradiation from sunshine duration. Sol. Energy. 1998;63(1):39–49. doi: 10.1016/S0038-092X(98)00043-7. [DOI] [Google Scholar]
- 4.Al-Lawati A, Dorvlo ASS, Jervase JA. Monthly average daily solar radiation and clearness index contour maps over Oman. Energy Convers. Manag. 2003;44:691–705. doi: 10.1016/S0196-8904(02)00080-8. [DOI] [Google Scholar]
- 5.Tovar J, Olmo FJ, Alados-Arboledas L. One-minute global irradiance probability density distributions conditioned to the optical air mass. Sol. Energy. 1998;62(6):387–393. doi: 10.1016/S0038-092X(98)00035-8. [DOI] [Google Scholar]
- 6.Boisvert JB, Hayhoe HN, Dubé PA. Improving the estimation of global solar radiation across Canada. Agric. For. Meteorol. 1990;52(3–4):275–286. doi: 10.1016/0168-1923(90)90086-L. [DOI] [Google Scholar]
- 7.Li M-F, Liu H-B, Guo P-T, Wu W. Estimation of daily solar radiation from routinely observed meteorological data in Chongqing, China. Energy Convers. Manag. 2010;51(12):2575–2579. doi: 10.1016/j.enconman.2010.05.021. [DOI] [Google Scholar]
- 8.Belkilani K, Othman AB, Besbes M. Assessment of global solar radiation to examine the best locations to install a PV system in Tunisia. Appl. Phys. A. 2018;124(2):122. doi: 10.1007/s00339-018-1551-3. [DOI] [Google Scholar]
- 9.Hussain M, Rahman L, Rahman MM. Techniques to obtain improved predictions of global radiation from sunshine duration. Renew. Energy. 1999;18(2):263–275. doi: 10.1016/S0960-1481(98)00772-1. [DOI] [Google Scholar]
- 10.Cartwright TJ. Modeling the world in a spreadsheet-environmental simulation on a microcomputer. London: The Johns Hopkins University Press; 1993. Here comes the Sun: Solar energy from a flat-plate collector; pp. 121–144. [Google Scholar]
- 11.Frank, V. Solar cell based pyranometers: evaluation of diffuse responsivity. Proceedings of the 1999 Annual Conference American Solar Energy Society, June 1999.
- 12.Srivastava SK, Singh OP, Pandey GN. Estimation of global solar radiation in Uttar Pradesh (India) and comparison of some existing correlations. Sol. Energy. 1993;51(1):27–29. doi: 10.1016/0038-092X(93)90038-P. [DOI] [Google Scholar]
- 13.Akinoǧlu BG, Ecevit A. Construction of a quadratic model using modified Ångstrom coefficients to estimate global solar radiation. Sol. Energy. 1990;45(2):85–92. doi: 10.1016/0038-092X(90)90032-8. [DOI] [Google Scholar]
- 14.Teramoto ÉT, da Silva e Cunha DC, dos Santos CM, Machado LP, Escobedo JF. Estimating daily global radiation from common meteorological variables in a humid subtropical environment. Nativa Pesquisas Agrárias e Ambientais. 2019;7(6):693–701. doi: 10.31413/nativa.v7i6.7948. [DOI] [Google Scholar]
- 15.Calcabrini A, Ziar H, Isabella O, Zeman M. A simplified skyline-based method for estimating the annual solar energy potential in urban environments. Nat. Energy. 2019;4(3):206–215. doi: 10.1038/s41560-018-0318-6. [DOI] [Google Scholar]
- 16.Chegaar M, Chibani A. Global solar radiation estimation in Algeria. Energy Convers. Manag. 2001;42(8):967–973. doi: 10.1016/S0196-8904(00)00105-9. [DOI] [Google Scholar]
- 17.Chegaar M, Chibani A. A simple method for computing global solar radiation. Rev. Energ. Ren: Chemss. 2000;2:111–115. [Google Scholar]
- 18.Iqbal M. An introduction to solar radiation. Amsterdam: Elsevier; 2012. [Google Scholar]
- 19.El-Sebaii AA, Trabea AA. Estimation of global solar radiation on horizontal surfaces over Egypt. Egypt. J. Solids. 2005;28(1):163–175. [Google Scholar]
- 20.Trabea AA, Shaltout MM. Correlation of global solar radiation with meteorological parameters over Egypt. Renew. Energy. 2000;21(2):297–308. doi: 10.1016/S0960-1481(99)00127-5. [DOI] [Google Scholar]
- 21.Geiger M, Diabaté L, Ménard L, Wald L. A web service for controlling the quality of measurements of global solar irradiation. Sol. Energy. 2002;73(6):475–480. doi: 10.1016/S0038-092X(02)00121-4. [DOI] [Google Scholar]
- 22.Belkilani K, Othman AB, Besbes M. Estimation and experimental evaluation of the shortfall of photovoltaic plants in Tunisia: Case study of the use of titled surfaces. Appl. Phys. A. 2018;124(2):179. doi: 10.1007/s00339-018-1581-x. [DOI] [Google Scholar]
- 23.Skartveit A, Olseth JA. Modelling slope irradiance at high latitudes. Sol. Energy. 1986;36(4):333–344. doi: 10.1016/0038-092X(86)90151-9. [DOI] [Google Scholar]
- 24.Reddy SJ. Empirical method for the estimation of net radiation intensity. Sol. Energy (United States). 1971 doi: 10.1016/0038-092X(71)90011-9. [DOI] [Google Scholar]
- 25.Fathallah MAB, Othman AB, Besbes M. Modeling a photovoltaic energy storage system based on super capacitor, simulation and evaluation of experimental performance. Appl. Phys. A. 2018;124(2):120. doi: 10.1007/s00339-018-1549-x. [DOI] [Google Scholar]
- 26.Steven MD, Unsworth MH. The angular distribution and interception of diffuse solar radiation below overcast skies. Q. J. R. Meteorolog. Soc. 1980;106:57–61. doi: 10.1002/qj.49710644705. [DOI] [Google Scholar]
- 27.Okoye CO, Taylan O, Baker DK. Solar energy potentials in strategically located cities in Nigeria: review, resource assessment and PV system design. Renew. Sustain. Energy Rev. 2016;55:550–566. doi: 10.1016/j.rser.2015.10.154. [DOI] [Google Scholar]
- 28.Behdashti A, Ebrahimpour M, Vahidi B, Omidipour V, Alizadeh A. Field experiments and technical evaluation of an optimized media evaporative cooler for gas turbine power augmentation. J. Appl. Res. Technol. 2012;10(3):458–471. doi: 10.22201/icat.16656423.2012.10.3.407. [DOI] [Google Scholar]
- 29.Trabea AA, Mosalam Shaltout MA. Correlation of global solar radiation with meteorological parameters over Egypt. Renew. Energy. 2000;21:297–308. doi: 10.1016/S0960-1481(99)00127-5. [DOI] [Google Scholar]
- 30.Cronin J, Anandarajah G, Dessens O. Climate change impacts on the energy system: A review of trends and gaps. Clim. Change. 2018;151(2):79–93. doi: 10.1007/s10584-018-2265-4. [DOI] [PMC free article] [PubMed] [Google Scholar]
- 31.Richard E, Okumura K, Abe K, Haga Y, Hayato Y, Ikeda M, Moriyama S. Measurements of the atmospheric neutrino flux by Super-Kamiokande: Energy spectra, geomagnetic effects, and solar modulation. Phys. Rev. D. 2016;94(5):052001. doi: 10.1103/PhysRevD.94.052001. [DOI] [Google Scholar]
- 32.Othman AB, Ouni A, Besbes M. Deep learning-based estimation of PV power plant potential under climate change: A case study of El Akarit, Tunisia. Energy Sustain. Soc. 2020;10(1):1–11. [Google Scholar]
- 33.Castro-Jiménez J, Sempéré R. Atmospheric particle-bound organophosphate ester flame retardants and plasticizers in a North African Mediterranean coastal city (Bizerte, Tunisia) Sci. Total Environ. 2018;642:383–393. doi: 10.1016/j.scitotenv.2018.06.010. [DOI] [PubMed] [Google Scholar]
- 34.Othman AB, Belkilani K, Besbes M. Global solar radiation on tilted surfaces in Tunisia: Measurement, estimation and gained energy assessments. Energy Rep. 2018;4:101–109. doi: 10.1016/j.egyr.2017.10.003. [DOI] [Google Scholar]
- 35.Molina A, Falvey M, Rondanelli R. A solar radiation database for Chile. Sci. Rep. 2017;7(1):1–11. doi: 10.1038/s41598-016-0028-x. [DOI] [PMC free article] [PubMed] [Google Scholar]
- 36.Paulescu Z. Schlett, Performance assessment of global solar irradiation models under Romanian climate. Renew. Energy. 2004;29:767–777. doi: 10.1016/j.renene.2003.09.011. [DOI] [Google Scholar]
- 37.Barron-Gafford GA, Minor RL, Allen NA, Cronin AD, Brooks AE, Pavao-Zuckerman MA. The photovoltaic heat island effect: Larger solar power plants increase local temperatures. Sci. Rep. 2016;6:35070. doi: 10.1038/srep35070. [DOI] [PMC free article] [PubMed] [Google Scholar]
- 38.Suri, M., Huld, T., Dunlop, E., Albuisson, M., & Wald, L. (2006, October). Online data and tools for estimation of solar electricity in Africa: the PVGIS approach.
- 39.Duffie JA, Bechman WA. Solar Engeneeriing of Thermal Processes. 3. Chichester: John Wiley and sons; 2006. [Google Scholar]
- 40.Duzen H, Aydin H. Sunshine based estimation of global solar radiation on horizontal surface at Lake Van region (Turkey) Energy Convers. Manag. 2012;58:35–46. doi: 10.1016/j.enconman.2011.11.028. [DOI] [Google Scholar]
- 41.Durusoy B, Ozden T, Akinoglu BG. Solar irradiation on the rear surface of bifacial solar modules: A modeling approach. Sci. Rep. 2020;10(1):1–10. doi: 10.1038/s41598-020-70235-3. [DOI] [PMC free article] [PubMed] [Google Scholar]