Abstract
Hydraulic fracturing is used to access oil and natural gas reserves. This process involves the high-pressure injection of fluid to fracture shale. Fracking fluid contains approximately 95% water, chemicals and 4.5% fracking sand. Workers may be exposed to fracking sand dust (FSD) during the manipulation of the sand, and negative health consequences could occur if FSD is inhaled. In the absence of any information about its potential toxicity, a comprehensive rat animal model study (see Fedan et al., 2020) was designed to investigate the bioactivities of several FSDs in comparison to MIN-U-SIL® 5, a respirable α-quartz reference dust used in previous animal models of silicosis, in several organ systems. The goal of this study was to assess the effects of inhalation of one FSD, i.e., FSD 8, on factors and tissues that affect cardiovascular function. Male rats were exposed to 10 or 30 mg/m3 FSD (6 h/d for 4 d) by whole body inhalation, with measurements made 1, 7 or 27 d post-exposure. One day following exposure to 10 mg/m3 FSD the sensitivity to phenylephrine-induced vasoconstriction in tail arteries in vitro was increased. FSD exposure at both doses resulted in decreases in heart rate (HR), HR variability, and blood pressure in vivo. FSD induced changes in hydrogen peroxide concentrations and transcript levels for pro-inflammatory factors in heart tissues. In kidney, expression of proteins indicative of injury and remodeling was reduced after FSD exposure. When analyzed using regression analysis, changes in proteins involved in repair and remodeling were correlated. Thus, it appears that inhalation of FSD does have some prolonged effects on cardiovascular, and, possibly, renal function. The findings also provide information regarding potential mechanisms that may lead to these changes, and biomarkers that could be examined to monitor physiological changes that could be indicative of impending cardiovascular dysfunction.
Keywords: Vasoconstriction, Vasodilation, Heart rate variability, Blood pressure, Renal injury, Oxidative stress
1. Introduction
This is the sixth in a series of tandem papers in which the potential toxicity of fracking sand dust (FSD) has been comprehensively investigated. The goal of this study is to focus on the effects of inhalation exposure to FSD, i.e., FSD 8, on the heart and cardiovascular and renal system of rats. The reader is directed to the first paper in the series (Fedan, 2020), which describes the overall approach to the investigation in the context of current knowledge about silica toxicity and research gaps. The other studies in this series have examined the effects of FSD 8 on the pulmonary and immune systems, brain and blood (Anderson et al., 2020; Russ et al., 2020; Olgun et al., 2020; Russ et al., 2020; Sager et al., 2020, 2020; Sriram et al., 2020). A summary of the results of these investigations can be found in Investigative Team (2020).
Hydraulic fracturing, or “fracking,” has been used to access oil and natural gas reserves since the 1940s. However, use of this method has increased appreciably over the last ten years with advances in drilling technologies. The fracking process involves using high-pressure fluid injection to fracture the shale. Fracking fluid contains large volumes of water (approximately 95% total volume) and chemicals, and fracking sand, which is approximately 4.5% of total fluid volume. During the fracking process, the sand pumped into the well bore fills the fissures that are created and facilitates gas flow during the collection of oil and gas later during the mining process (Esswein et al. 2012, 2013). Workers can be exposed to respirable dust from fracking sand during the manipulations leading to mixing the sand with the fracking fluid. Because these sands are composed primarily of crystalline silica, it is possible that workers exposed to the respirable dust from the sand may develop health-related conditions associated with silica inhalation, such as silicosis, lung cancer, cardiovascular problems and renal dysfunction (Pozzolini et al. 2016; Zelko et al. 2016; Sellamuthu et al. 2017), as has been seen in workers that have been exposed to silica dust in other industries, such as mining, tunnel excavation and sand blasting. Silica inhalation may also contribute to the development of autoimmune diseases. For example, inhalation of sand dust by veterans of the Gulf War did not result in silicosis, but many of these troops developed respiratory problems and asthma (Porter et al. 2015). Because the health effects of excessive exposure to sand dust from different locations appears to have different manifestations, it is important to characterize the effects of exposures to FSD 8.
The goal of these studies was to investigate the systemic effects and potential health consequences of inhaling airborne FSD 8 collected from a natural gas hydraulic fracturing work site in the U.S. This dust was generated during the mechanical processing of sand to formulate fracking fluid. These studies used rat model to determine whether FSD 8 inhalation may affect the heart and peripheral vascular function, and associated changes in cardiovascular and renal cellular biology (Porter et al. 2015). We specifically tested the hypothesis that inhalation of FSD 8 would result in an increase in the expression of inflammatory factors and reactive oxygen species (ROS) that would, in turn, alter central and peripheral cardiovascular responses to vasodilating and/or vasocon-stricting agents, and induce the expression of genes that may be involved in the development of subsequent health problems in organs involved in the regulation of cardiovascular function.
2. Methods
2.1. Animals
All studies were conducted in facilities accredited by AAALAC International, were approved by the Institutional Animal Care and Use Committee (approved ACUC protocol 13-JF-R-014, 14-JF-R-11, 16-JF-R-020) and were in compliance with the Public Health Service Policy on Humane Care and Use of Laboratory Animals and the NIH Guide for the Care and Use of Laboratory Animals. Male Sprague-Dawley rats ([H1a: (SD) CVF], approximate body weight of 200–275 g at arrival, were obtained from Hilltop Lab Animals, Inc. (Scottdale, PA). All animals were free of viral pathogens, parasites, mycoplasm, Helicobacter and cilia-associated respiratory bacillus. Animals were acclimated for 1 wk., housed in pairs in ventilated micro-isolator units supplied with HEPA-filtered laminar flow air (Thoren Caging Systems; Hazleton, PA), with 7090 Sani Chip and 7070C Diamond Dry combination (both from Harlan, now Envigo; Indianapolis, IN) for bedding, and provided tap water and 2918 irradiated Teklad Global 18% rodent diet (Harlan, now Envigo; Indianapolis, IN) ad libitum. Rats were housed under controlled light cycle (12 h light/12 h dark) and temperature (22–25 °C) conditions. Rats were housed in pairs except in studies in which animals were instrumented for telemetry studies.
2.2. Exposure system
Rats were exposed to FSD 8 or filtered air in an automated, whole-body inhalation system using a blocked design; 2 control and 2 FSD 8-treated rats were exposed simultaneously (animals were run in 4 blocks for a total of n = 8 for each group at each time point). A complete description of the exposure system is given in Fedan et al. (2020). Rats were exposed to 10 or 30 mg/m3 for 6 h/d for 4 d. After each exposure, the animals were returned to the colony room. FSD 8 is one of nine FSDs collected during domestic fracking operations (Fedan et al., 2020).
2.3. Procedures for microvessel, transcription and protein measurements
For the studies examining the effects of FSD 8 inhalation on microvessel function, gene transcription and protein concentrations, rats were injected with a fatal dose of pentobarbital (100–300 mg/kg, i.p.) and euthanized by exsanguination at 1, 7 or 27 d after the final exposure.
2.3.1. Microvessel reactivity to phenylephrine and acetylcholine
Tails were dissected from rats after exsanguination and placed in cold Dulbecco’s modified Eagle’s medium with glucose (Invitrogen/Gibco; Carlsbad, CA). The tail was dissected at the caudal vertebrate (C18) region and a segment of artery was collected from the C19–20 region shortly after euthanasia, mounted on glass pipettes in a microvessel chamber (Living System; Burlington, VT), and perfused with bi-carbonated HEPES buffer (130 mM NaCl, 4 mM KCl, 1.2 mM MgSO4, 1.8 mM CaCl2, 10 mM HEPES, 1.80 mM KH2PO4, 0.03 mM EDTA, 4 mm NaHCO3 plus 10% glucose added just prior to the experiment) warmed to 37 °C. Arteries were pressurized to 60 mmHg and allowed to equilibrate for approximately 1 h. Then, the chamber buffer was replaced with fresh HEPES buffer and vascular responsiveness to phenylephrine (PE; an α1-adrenoceptor agonist) and acetylcholine (ACh; a muscarinic agonist that acts on endothelial cells to induce nitric oxide release and induce re-dilation) was measured. To assess the effects of treatment on sensitivity to α1-adrenoreceptor-mediated vasoconstriction, PE was applied to the chamber so that changes in the concentration occurred in half-log increments (−10.0 to −5.0, log M), and the internal diameter of the artery was recorded after vessels stabilized; there were approximately 5 min between cumulative additions of PE. After assessing vasoconstriction, the chamber buffer was removed and replaced with fresh, oxygenated HEPES buffer. After rinsing, arterial diameter returned to levels that were near baseline. Because ventral tail arteries usually display little basal tone, endothelial-mediated re-dilation was assessed after arteries were pre-constricted with PE to approximately 50% of their baseline diameters. In pilot work, re-constricting arteries with PE did not affect subsequent responses to ACh. To assess its dilatory effects, ACh was added cumulatively in half-log increments (−10.0 to −5.0, log M) and changes in the internal diameter of the vessel were measured as described for PE.
2.3.2. Quantitative reverse transcriptase polymerase chain reaction (qRT-PCR)
qRT-PCR was performed to determine if exposure to FSD 8 resulted in changes in transcript levels in the heart and kidney using previously described methods (Krajnak et al. 2009). Heart tissue was examined to determine if there were effects of FSD 8 exposure that could affect the cardiovascular system. Kidney tissue was examined because changes in renal function affect blood pressure and vascular function. We specifically examined transcripts that were indicative of changes in the expression of inflammatory cytokines, apoptotic factors, and factors involved in vasomodulation, vascular remodeling and ionic status in the heart and kidney. The transcripts measured in the heart included interleukin-1β (IL-1β), factors involved in regulating apoptosis (BAX, BAD and BCl2), hypoxia induced factor 1α (HIF-1α) inducible and endothelial nitric oxide synthase (iNOS and eNOS, respectively) and tumor necrosis factor-α (TNF-α). Kidney transcripts examined included angiotensin converting enzyme (ACE), cyclic AMP response element binding protein (CREB), small chemokine platelet factor 4 (CXCL4), dopamine receptors 1, 2 and 5 (DRDA1, 2 and 5), fibronectin (FN1) and transforming growth factor-β (TGF-β). Ribosomal 18 s was used as a loading control. RNA was isolated from the tissue using RNAeasy lipid Miniprep kits (cat #74804; Qiagen, Valencia CA), and first strand cDNA was synthesized from 1 μg of total RNA using a Reverse Transcription System (Invitrogen). Melt curves were run for each transcript using each tissue. Samples that did not show a single defined melt peak in the 80 °C range were not included in the data set. To determine if the treatment resulted in a change in transcript levels, fold changes from the same day controls were calculated.
2.3.3. Nitrate/nitrite (NOx) and hydrogen peroxide (H2O2) assays
Heart and kidney tissue samples were collected and homogenized in 1 ml lysis buffer (10 mM Tris buffer pH 7.5, 1 mM EDTA, 1 mM EGTA, 150 mM NaCl, 1% Triton-X 100). Nox (Caymen Chemicals; Ann Arbor, MI) and H2O2™ assays (Cell Technology Inc.; Mountain View, CA) were performed following the manufacturers’ protocols. Protein was analyzed using the BCA assay (Pierce; Rockford, IL).
2.3.4. Protein analysis via plates
Heart and kidney tissues were homogenized in 0.1 M PBS with 0.2% Triton-X 100 and Complete ULTA protease inhibitor tablets (without EDTA; Roche; Indianapolis, IN), centrifuged at 190 ×g, and the supernatant was removed and frozen at −80 °C until used for the assays. The pellet was decanted and frozen at −80 °C until used for the BCA protein assay. Rat kidney and artery multiplex protein kits were purchased from EMD Millipore (Billerica, MA) and assays run according to the manufacturer’s instructions with the following modification: homogenates from kidney tissue were diluted 1:3 instead of 1:2 because of the high protein concentrations in the samples. Bioluminescence of the antibody labeled for each protein bound to the beads was measured using Luminex 200 (Luminex Corp; Austin TX) and concentrations were calculated using the standards provided by the supplier and X-ponent software (Luminex X-ponent, 3.1; Austin, TX). The proteins measured in the arteries were caveolin-1 (CAV1), connective tissue growth factor (CTGF), vascular endothelial growth factor (VEGF), monocyte chemoattractant protein-1 (MCP-1), tissue inhibitor of metalloproteinase-1 (TIMP-1), interleukin-6 (IL-6), TNF-α, the chemokine ligand 1-related proteins, Gro/KC/CINC-1, and tissue plasma activator inhibitor-1 (tPA-1). The kidney protein panel assessed the following proteins: calbindin (CAL), clusterin (CLUST), glutathione-S-transferase (GST)-α, interferon-γ inducible protein (IP)-10, kidney injury molecule (KIM-1), osteopontin (OPN), tissue-inhibitor of metalleoproteinase-1 (TIMP1), and vascular endothelial growth fact (VEGF).
2.4. Procedures for in vivo hemodynamic measurements
To obtain in vivo measurements of cardiac function and reactivity to drugs, at 1, 7 and 27 d after the FSD 8 exposure, rats (n = 6–8 air and 6–8 FSD 8 exposed/time point) were anesthetized with 3% isoflurane and 1 l/min of oxygen in an induction chamber and maintained at 1–2% isoflurane and 0.5 l/min of oxygen during surgery to instrument the animals. Cardiopulmonary responses [heart rate (HR); breathing rate and depth] and toe pinch spinal reflex were examined as intra-operative monitoring techniques. The concentration of isoflurane was adjusted to maintain the proper depth of anesthesia. A temperature-controlled heating pad was used to regulate normal body temperature, and temperature was monitored via an anal probe during the entire procedure. Before the surgery, surgical instruments and supplies were autoclaved, and the catheter was cold-sterilized using Cidex (Physician Sales and Services, Inc.; Jacksonville, FL) prepared according to the manufacturer’s instructions and flushed with sterile saline solution. The rat was placed in dorsal recumbent position, and the incision sites were clipped and the aseptically prepared with povidone-iodine, followed by 70% alcohol. Mikro-Tip® ultra-miniature PV loop catheters (SPR-901; Millar, Inc., Houston, TX) were inserted into the left ventricle through the carotid artery. The correct position of the catheter tip in the left ventricle was confirmed by the waveform of a pressure-volume loop visualized on a computer monitor. After stabilization for 20 min, signals were continuously recorded at a sampling rate of 1000 samples/s using a PV conductance system (MPVS-Ultra; Millar, Inc) connected to the PowerLab4/30 data acquisition system (AD Instruments; Colorado Springs, CO), and stored and displayed on a personal computer using the LabChart7 Software System (AD Instruments). Increasing doses of norepinephrine or dobutamine (Hospira, Inc.; Lake Forest, IL) were administrated through a catheter (polyurethane, 3 French size) that had been placed in the right jugular vein. Systolic, diastolic blood pressure and left ventricular function were measured. Parallel conductance volume was calculated by the software and used for the correction of the cardiac mass volume, and each rat was euthanized by exsanguination under deep anesthesia at the conclusion of the experiment.
2.5. Procedures for telemetry experiments
2.5.1. Surgical procedures for transmitter implantation
Real-time in vivo measurements of cardiac function and blood pressure were made in rats implanted with telemetry devices. Rats with implants were housed separately in a quiet environment and handled gently to avoid distress. Surgical instruments and supplies were autoclaved, and aseptic technique was used throughout the surgical procedure for placing implants. Anesthesia was induced and monitored as described in Section 2.4. The incision sites were clipped and aseptically prepared with povidone-iodine, followed by 70% alcohol. A mid-line abdominal incision was made, and the abdominal aorta was exposed by using sterile cotton swabs. The catheter of the telemetry transmitter (HD-S21; Data Sciences International; St. Paul, MN) was inserted in the abdominal aorta cranially. Tissue adhesive (Vetbond; 3 M Animal Care Products; St. Paul, MN) was used to secure the catheter and obtain hemostasis. The body of the telemetric device was positioned underneath the abdominal wall on the left lateral side of the incision and was secured in place by suturing it to the abdominal muscle using 4–0 non-absorbable sutures (Surgical Specialties Corporation; Wyomissing, PA). Two ECG leads were tunneled subcutaneously, the negative lead secured over the right pectoral muscle and the positive lead secured at the left caudal rib region approximately 2 cm to the left of the xyphoid process. Post-operative care was strictly followed according to the approved protocol: 5 mg/kg of meloxicam (Metcam; Boehringer Ingelheim Vetmedica, Inc.; St. Joseph, MO) was administered s.c. for pain relief once a day for 4 d. The general condition, body weight and food and water consumption of the rats were closely monitored. Rats had a period of three weeks convalescence before data acquisition and inhalation exposure.
2.5.2. Telemetry data acquisition and analysis
Blood pressure and ECG were recorded continuously for 24 h in unrestrained, conscious rats in the 1, 7 and 27 d post-exposure groups (n = 6–8 per air or FSD 8 exposure). HR was derived from the ECG signals offline. Blood pressure and HR data from each animal were exported (Dataquest ART analysis software; Data Sciences International; New Brighton, MN) to an Excel spreadsheet program. ECG data were collected using Ponemah software (v5.20). Frequency and changes in HR variability (HRV) over the period of collection were initially described using Dataquest ART analysis software. HRV was evaluated by analyzing beat-to-beat variations in RR intervals. For the time domain analysis, all parameters were averaged over the course of 12 h (6 am–6 pm). For the frequency domain analysis, 5-min segments (selected from each h over the course of the 12-h period) of the ECG tracing were chosen for analysis. Time series were resampled at 20 Hz and spectral power in the low frequency (LF; 0.25–1 Hz) and high frequency (HF; 1–3 Hz) ranges were calculated using the HRV analysis module of Ponemah software.
2.6. Reagents
Unless otherwise specified, all chemicals, drugs and reagents were obtained from Sigma-Aldrich (St. Louis, MO).
2.7. Statistical analyses
To determine if FSD 8 exposure affected responsiveness to PE or ACh, an effective concentration producing 50% of the maximum response (EC50) was calculated by curve fitting the concentration-response curves for each animal. The EC50s were then used to perform a 4 (treatment) × 3 (post-exposure day) ANOVA. These analyses were performed using GraphPad Prism 5.0 (La Jolla, CA). Additional analyses of microvessel data were also performed using 4 (treatment) × 3 (post-exposure day) × 8 (doses) repeated-measures ANOVAs. Data collected using RT-PCR, ROS and protein assays were analyzed using two-way ANOVAs. Post-hoc pairwise comparisons were performed using Fishers LSD. These analyses were performed using JMP (11.1.1; SAS Institute; Cary, NC). In addition, correlations between pairs of proteins in each tissue were calculated using multivariate analyses using Spearman’s rank correlation coefficients. Bivariate linear analyses were then performed to determine if treatment-induced changes in protein-protein associated variations were significant.
Changes in cardiac physiology parameters collected through telemetry, or in vivo PV-loop measurements, were analyzed using 2 (treatment) × 3 (post-exposure day) repeated measures ANOVAs. Subsequent pairwise comparisons were tested using Fisher’s least significance difference. All telemetry and PV loop data were analyzed using SAS software (Version 9.3). Differences were considered statistically significant at the level of P < 0.05. The values in the figures and table are expressed as the mean ± SEM.
3. Results
3.1. Microvessel reactivity to PE and ACh
There were no significant differences in the baseline internal diameters of ventral tail arteries from air for 10 mg/m3 FSD 8-treated animals (see Table 1). However, exposure to 10 mg/m3 FSD 8 resulted in an increased sensitivity of vasoconstriction responses to PE at the highest concentration of PE (10−6.5 M), 1 and 7 d after FSD 8 exposure (Fig. 1A and B). This difference was no longer apparent 27 d after exposure (Fig. 1C). After exposure to PE, all arteries were rinsed and the internal diameters returned to near baseline levels. Exposure to 10 mg/m3 FSD 8 did not affect ACh-induced re-dilation (Fig. 1D–F).
Table 1.
Baseline diameters of ventral tail arteries before treatment with phenylephrine.
| Air baseline diameter (for 10 mg/m3) | FSD 8 baseline diameter (for 10 mg/m3) | Air baseline diameter (30 mg/m3) | FSD 8 baseline diameter (30 mg/m3) | |
|---|---|---|---|---|
| mean ± sem μM | ||||
| Day 1 | 360.71 ± 24.18 | 362.57 ± 15.86 | 374.88 ± 11.03 | 357.63 ± 15.15 |
| Day 7 | 393.88 ± 8.43 | 393.63 ± 8.14 | 384.13 ± 10.29 | 402.13 ± 11.20 |
| Day 27 | 384.13 ± 7.98 | 391.00 ± 9.96 | 376.63 ± 11.78 | 396.13 ± 10.29 |
Fig. 1.
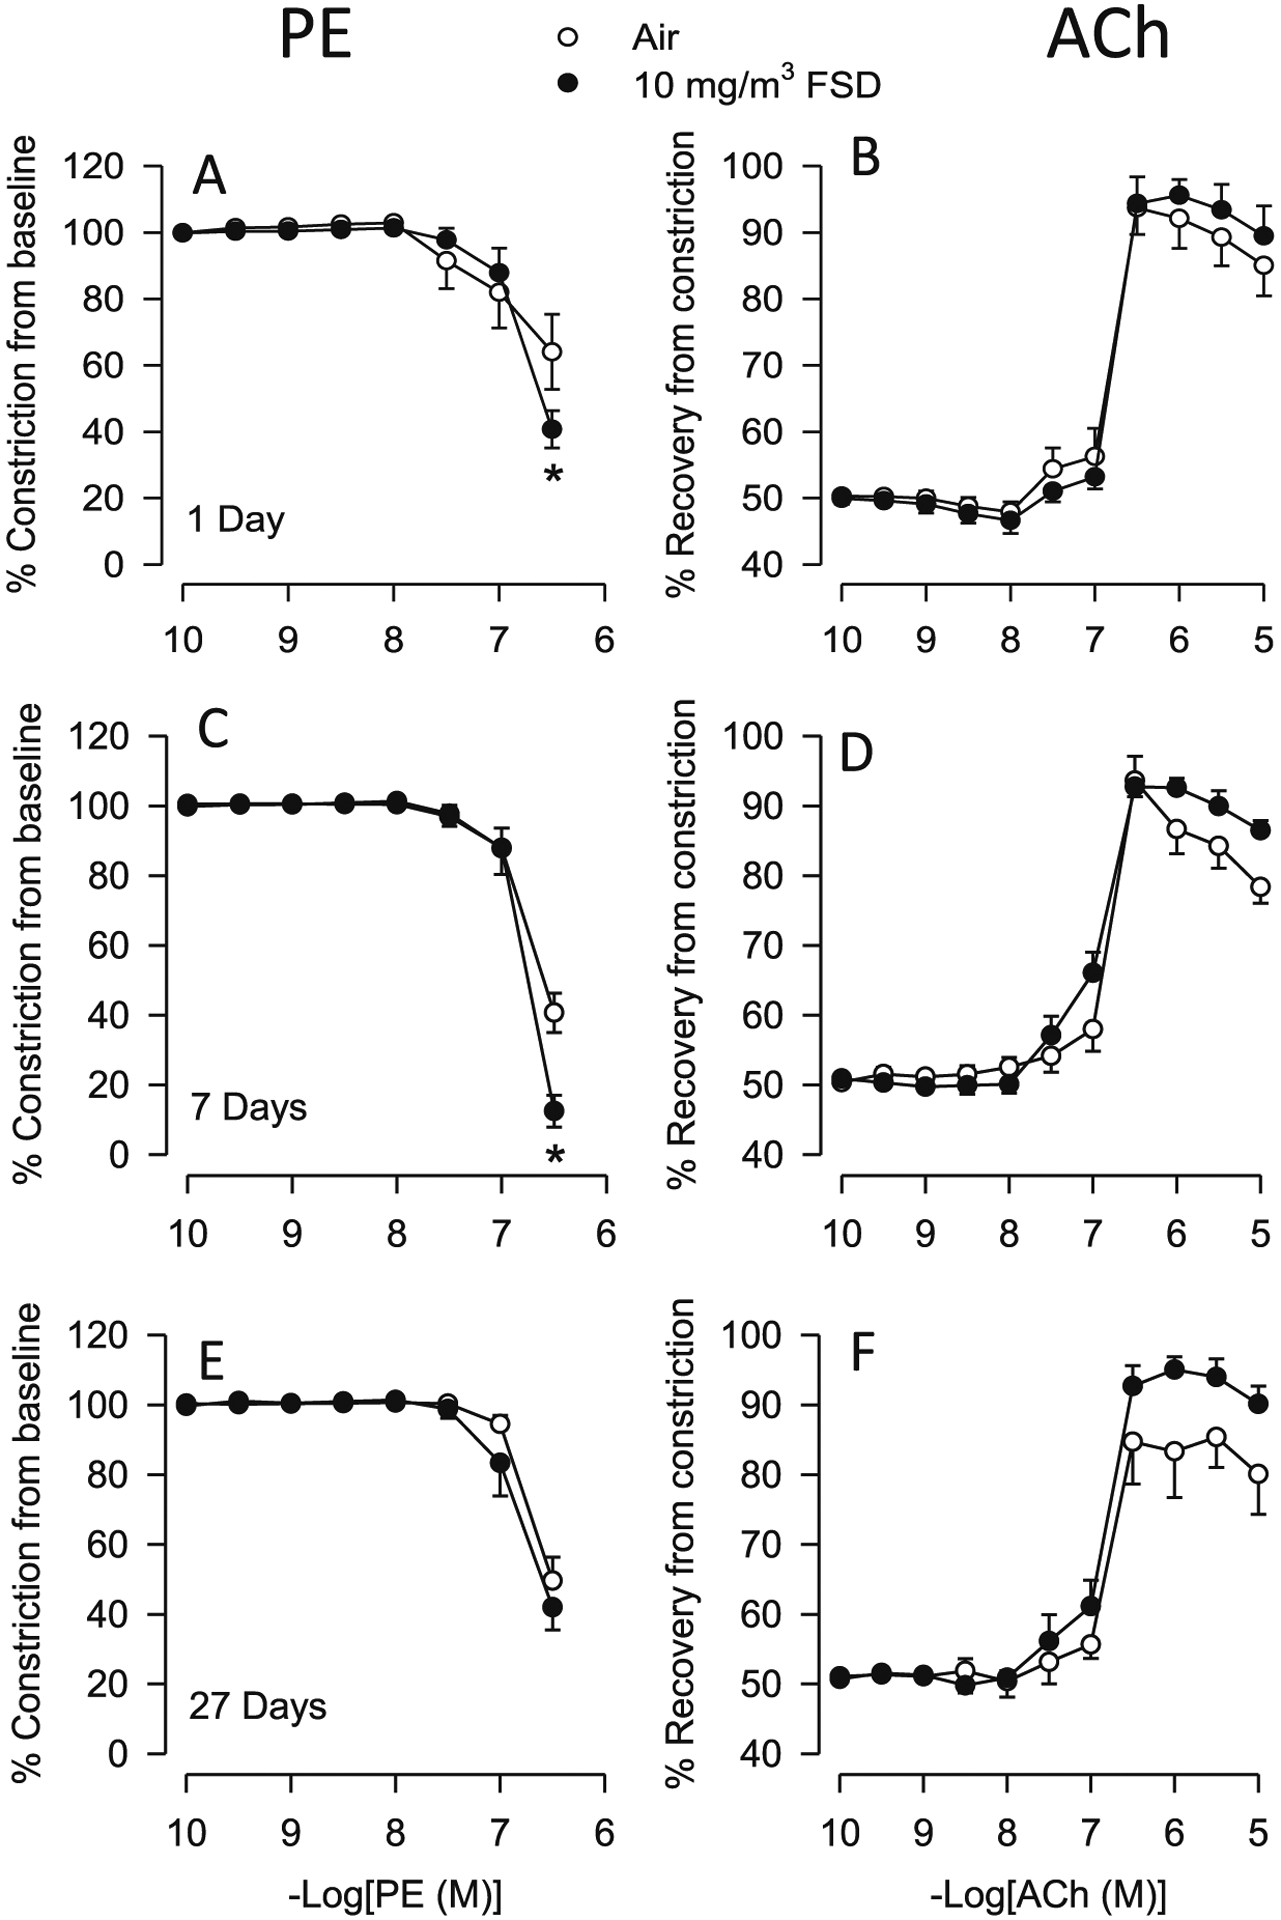
Vascular responses to phenylephrine (PE) and acetylcholine (ACh) in ventral tail arteries collected from rats exposed to filtered air or 10 mg/m3 frack sand dust (FSD) 8 (in all figures, FSD 8 is abbreviated as FSD; n = 7–8 animals/group and at each time point). On days 1 and 7, the constriction induced by PE (−6.5 dose, M) was greater in arteries from FSD 8-compared to air-exposed rats (A and B; *P < 0.05). On day 27 there was no difference in PE-induced vasoconstriction (C). ACh-induced re-dilation was not different between the air- and FSD 8-exposed groups on any post-exposure day (ACh: Figs. D–F represent days 1, 7 and 27 respectively).
Exposure to air of 30 mg/m3 FSD 8 did not significantly affect baseline internal diameters of the ventral tail artery (Table 1). Although responses to PE or ACh from rats exposed to 30 mg/m3 FSD 8 did not significantly differ from those of the air controls, the constriction induced by PE, particularly at the highest dose (10–6.5 M,) was greater than that induced in arteries from rats exposed to 10 mg/m3 FSD 8 at the 10−7 M concentration of PE (Fig. 2A–F). There also were no changes in the EC50 values for these agonists. Rats exposed to 10 mg/m3 FSD 8 produced an approximately 40% constriction, while those exposed to 30 mg/m3 FSD 8 developed an approximately 20% constriction, indicating that rats exposed to 10 mg/m3 FSD 8 were more sensitive to PE than those exposed to the 30 mg/m3 FSD 8 exposure.
Fig. 2.
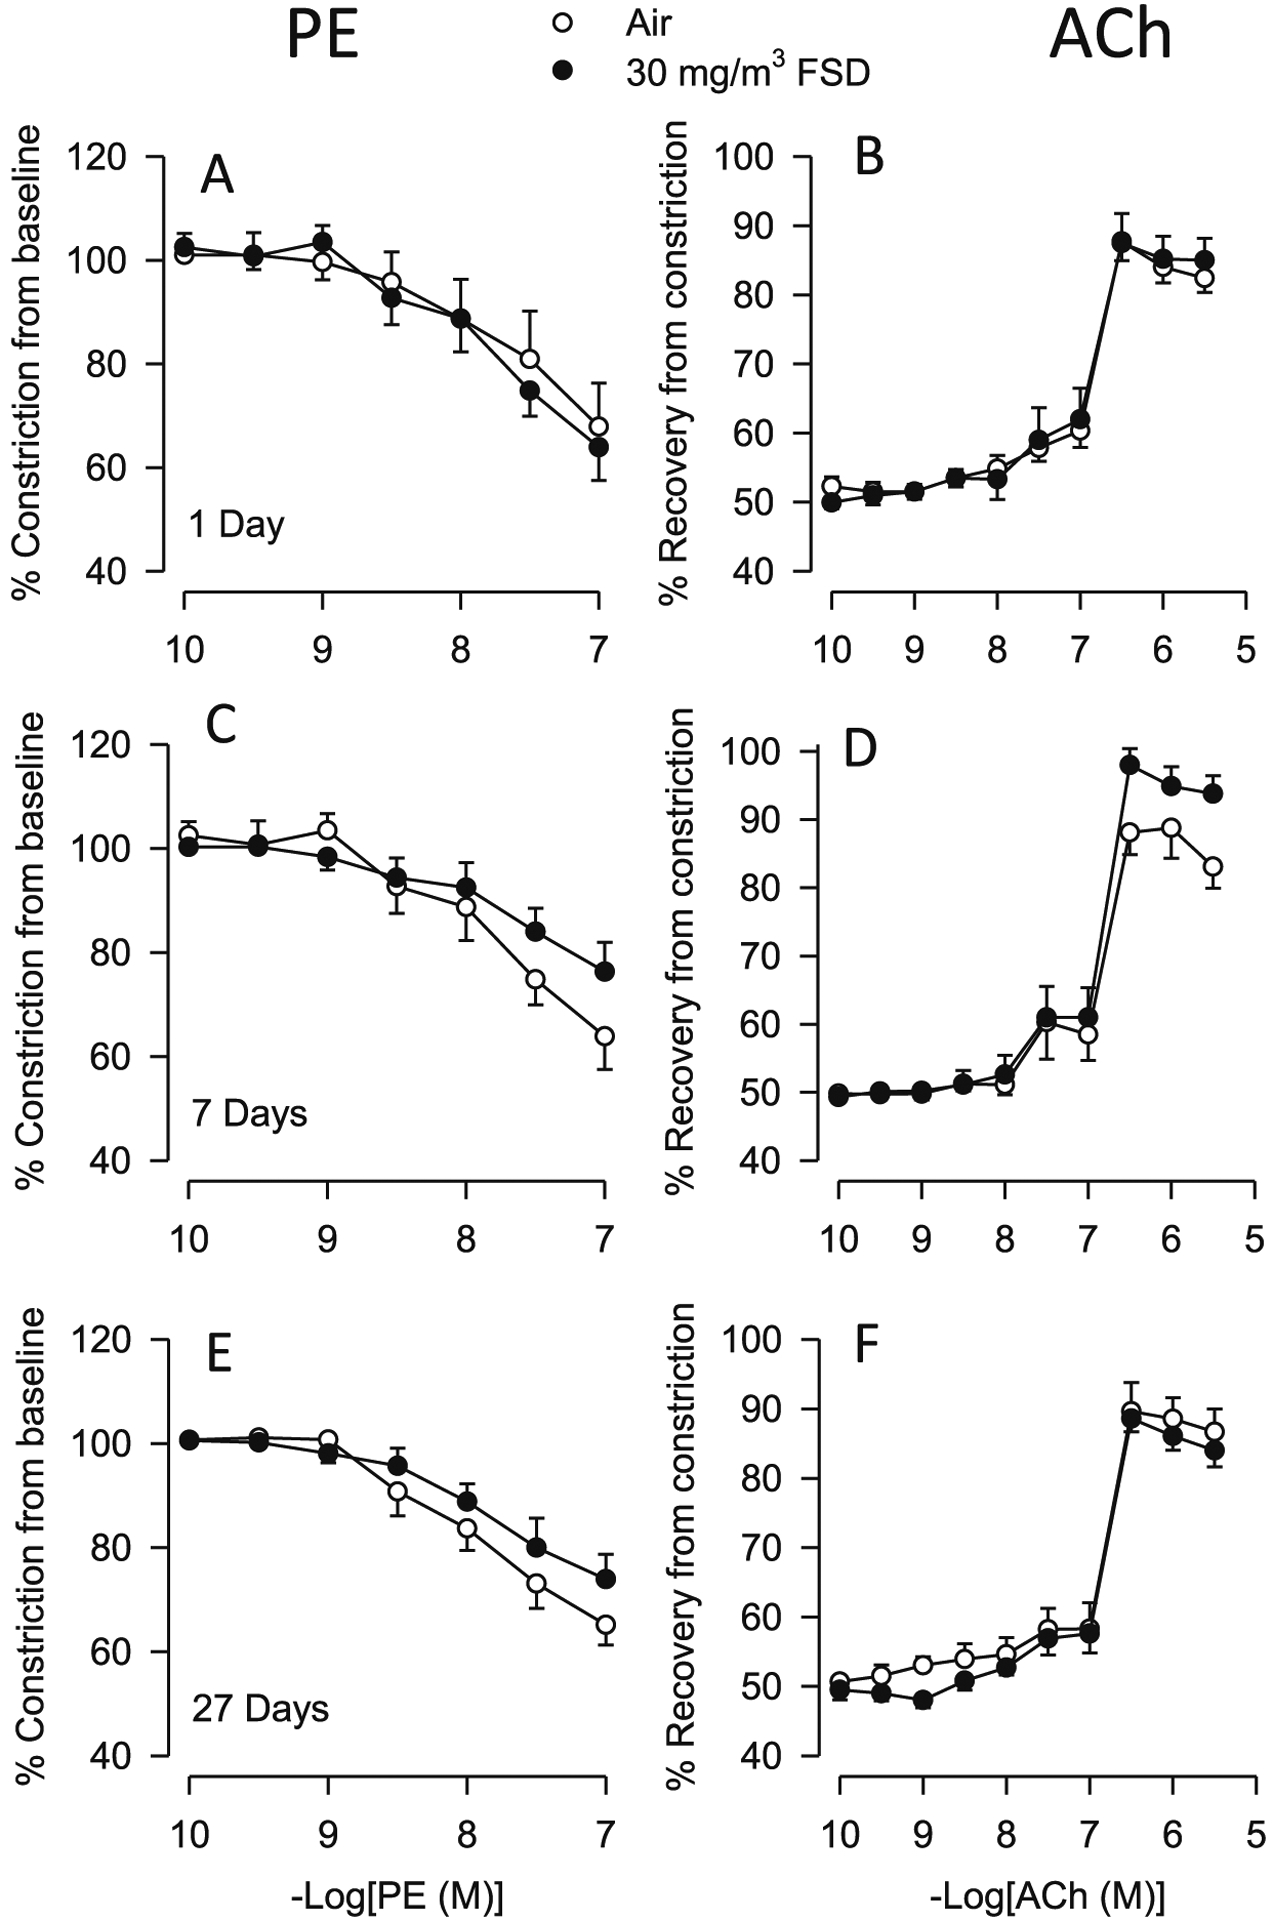
Vascular responses to phenylephrine (PE) and acetylcholine (ACh) in ventral tail arteries collected from rats exposed to air or 30 mg/m3 frack sand dust (FSD) 8 (n = 7–8 animals/group and at each time point. Neither PE-induced vasoconstriction nor ACh-induced re-dilation were affected by FSD 8 1, 7 or 27 d after the exposure (PE: panels A–C, respectively; ACh: panels D–F).
3.2. ROS (Nox and H2O2)
ROS were measured in the hearts and kidneys of rats used for microvessel studies. In the heart, Nox concentrations were not affected after exposure to 10 mg/m3 FSD 8 (Fig. 3A). However, H2O2 concentrations were decreased 7 and 27 d after exposure to 10 mg/m3 FSD 8 (Fig. 3B). After exposure to 30 mg/m3 FSD 8 or filtered air, H2O2 level was reduced in the heart (Fig. 3C). There were no significant differences between the two treatment groups at any time point after exposure to 30 mg/m3 FSD 8. Nox concentrations were not detectable.
Fig. 3.
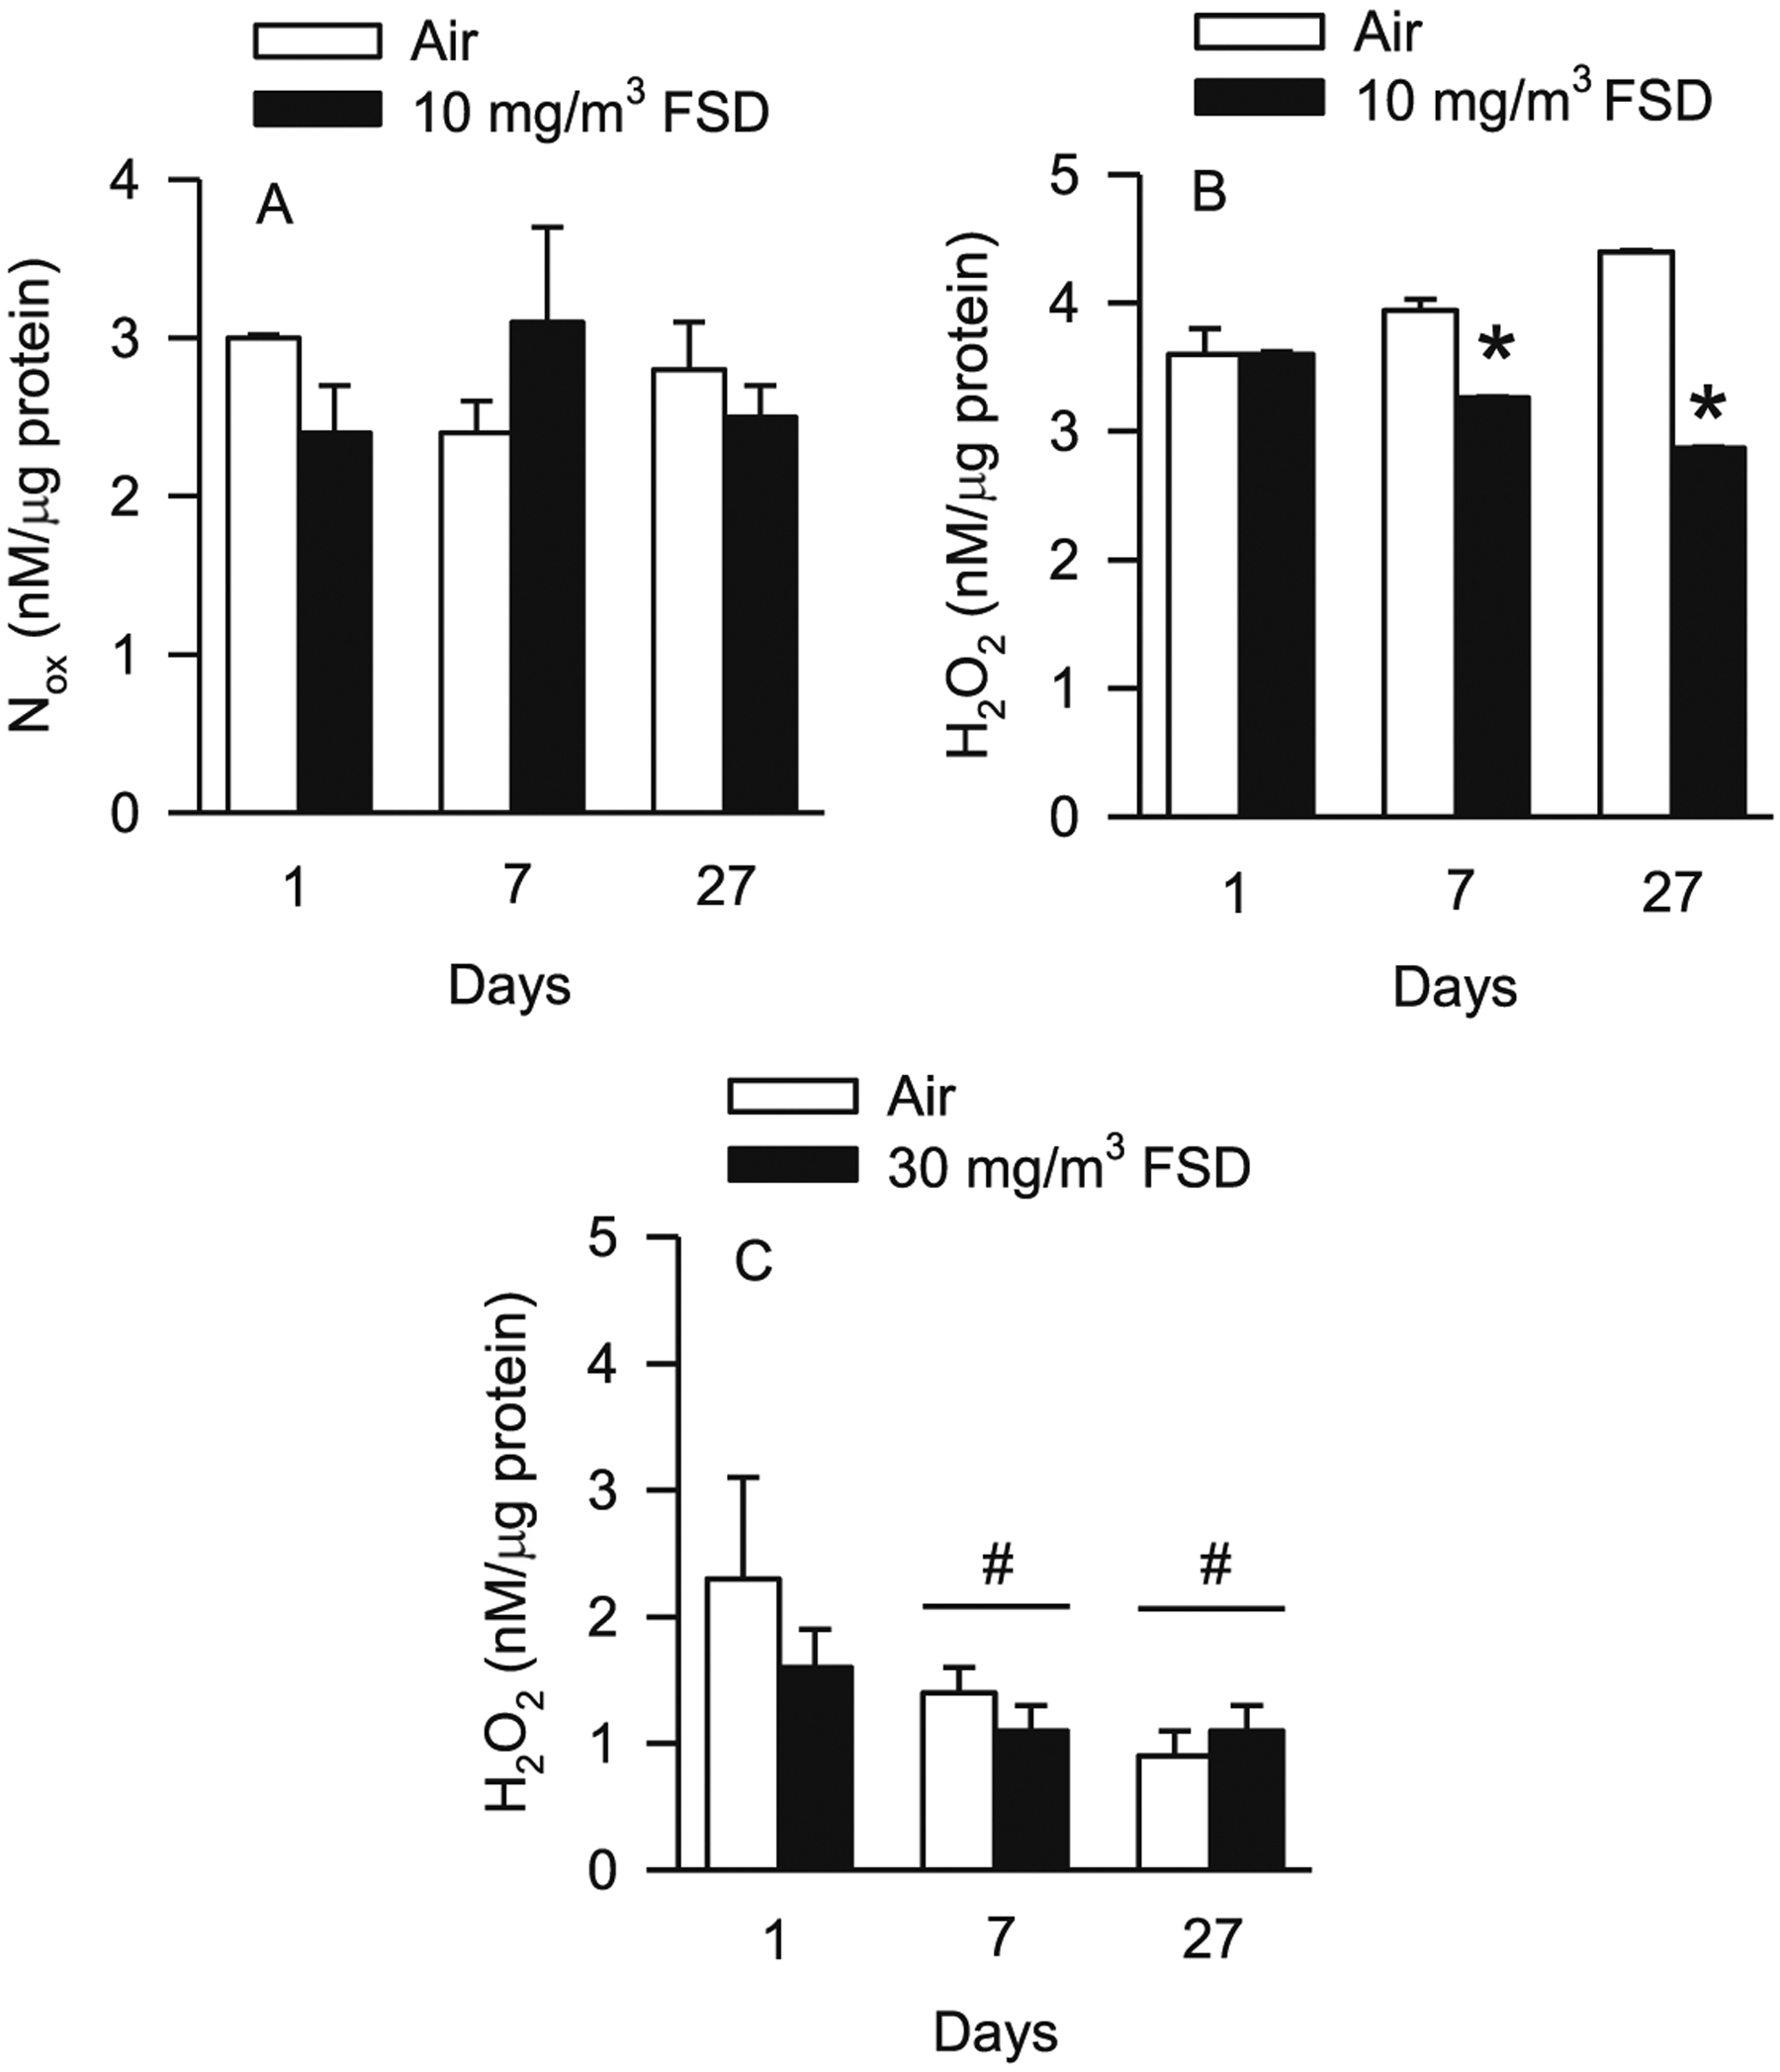
Nitrate/nitrite (Nox) and hydrogen peroxide (H2O2) concentrations in the hearts of rats exposed to air or frack sand dust (FSD) 8 (n = 8 animals/group and at each time point. Exposure to 10 mg/m3 FSD 8 did not affect Nox concentrations in the heart (A). However, H2O2 concentrations were reduced 7 and 27 d after exposure (B; *P < 0.05). There were no treatment-related differences in H2O2 concentrations with exposure to 30 mg/m3 FSD 8. However, H2O2 concentrations were reduced on days 7 and 27, in heart tissue from both air and FSD 8-treated rats (#P < 0.05). N ox concentrations were below the level of detection after exposure to the 30 mg/m3 FSD 8 in all animals.
Exposure to 10 mg/m3 FSD 8 did not affect Nox or H2O2 concentrations in the kidney (Fig. 4A and B). Nox concentrations were significantly lower in FSD 8-exposed compared to air-exposed rats 27 d after treatment with 30 mg/m3 FSD 8. Nox concentrations were also lower in the air-exposed rats on post-exposure days 7 and 27 (Fig. 4C). H2O2 concentrations were not changed in rats exposed to 30 mg/m3 FSD 8 (Fig. 4D). There were no differences in H2O2 concentrations in the kidneys after exposure to 30 mg/m3 FSD 8 (not shown).
Fig. 4.
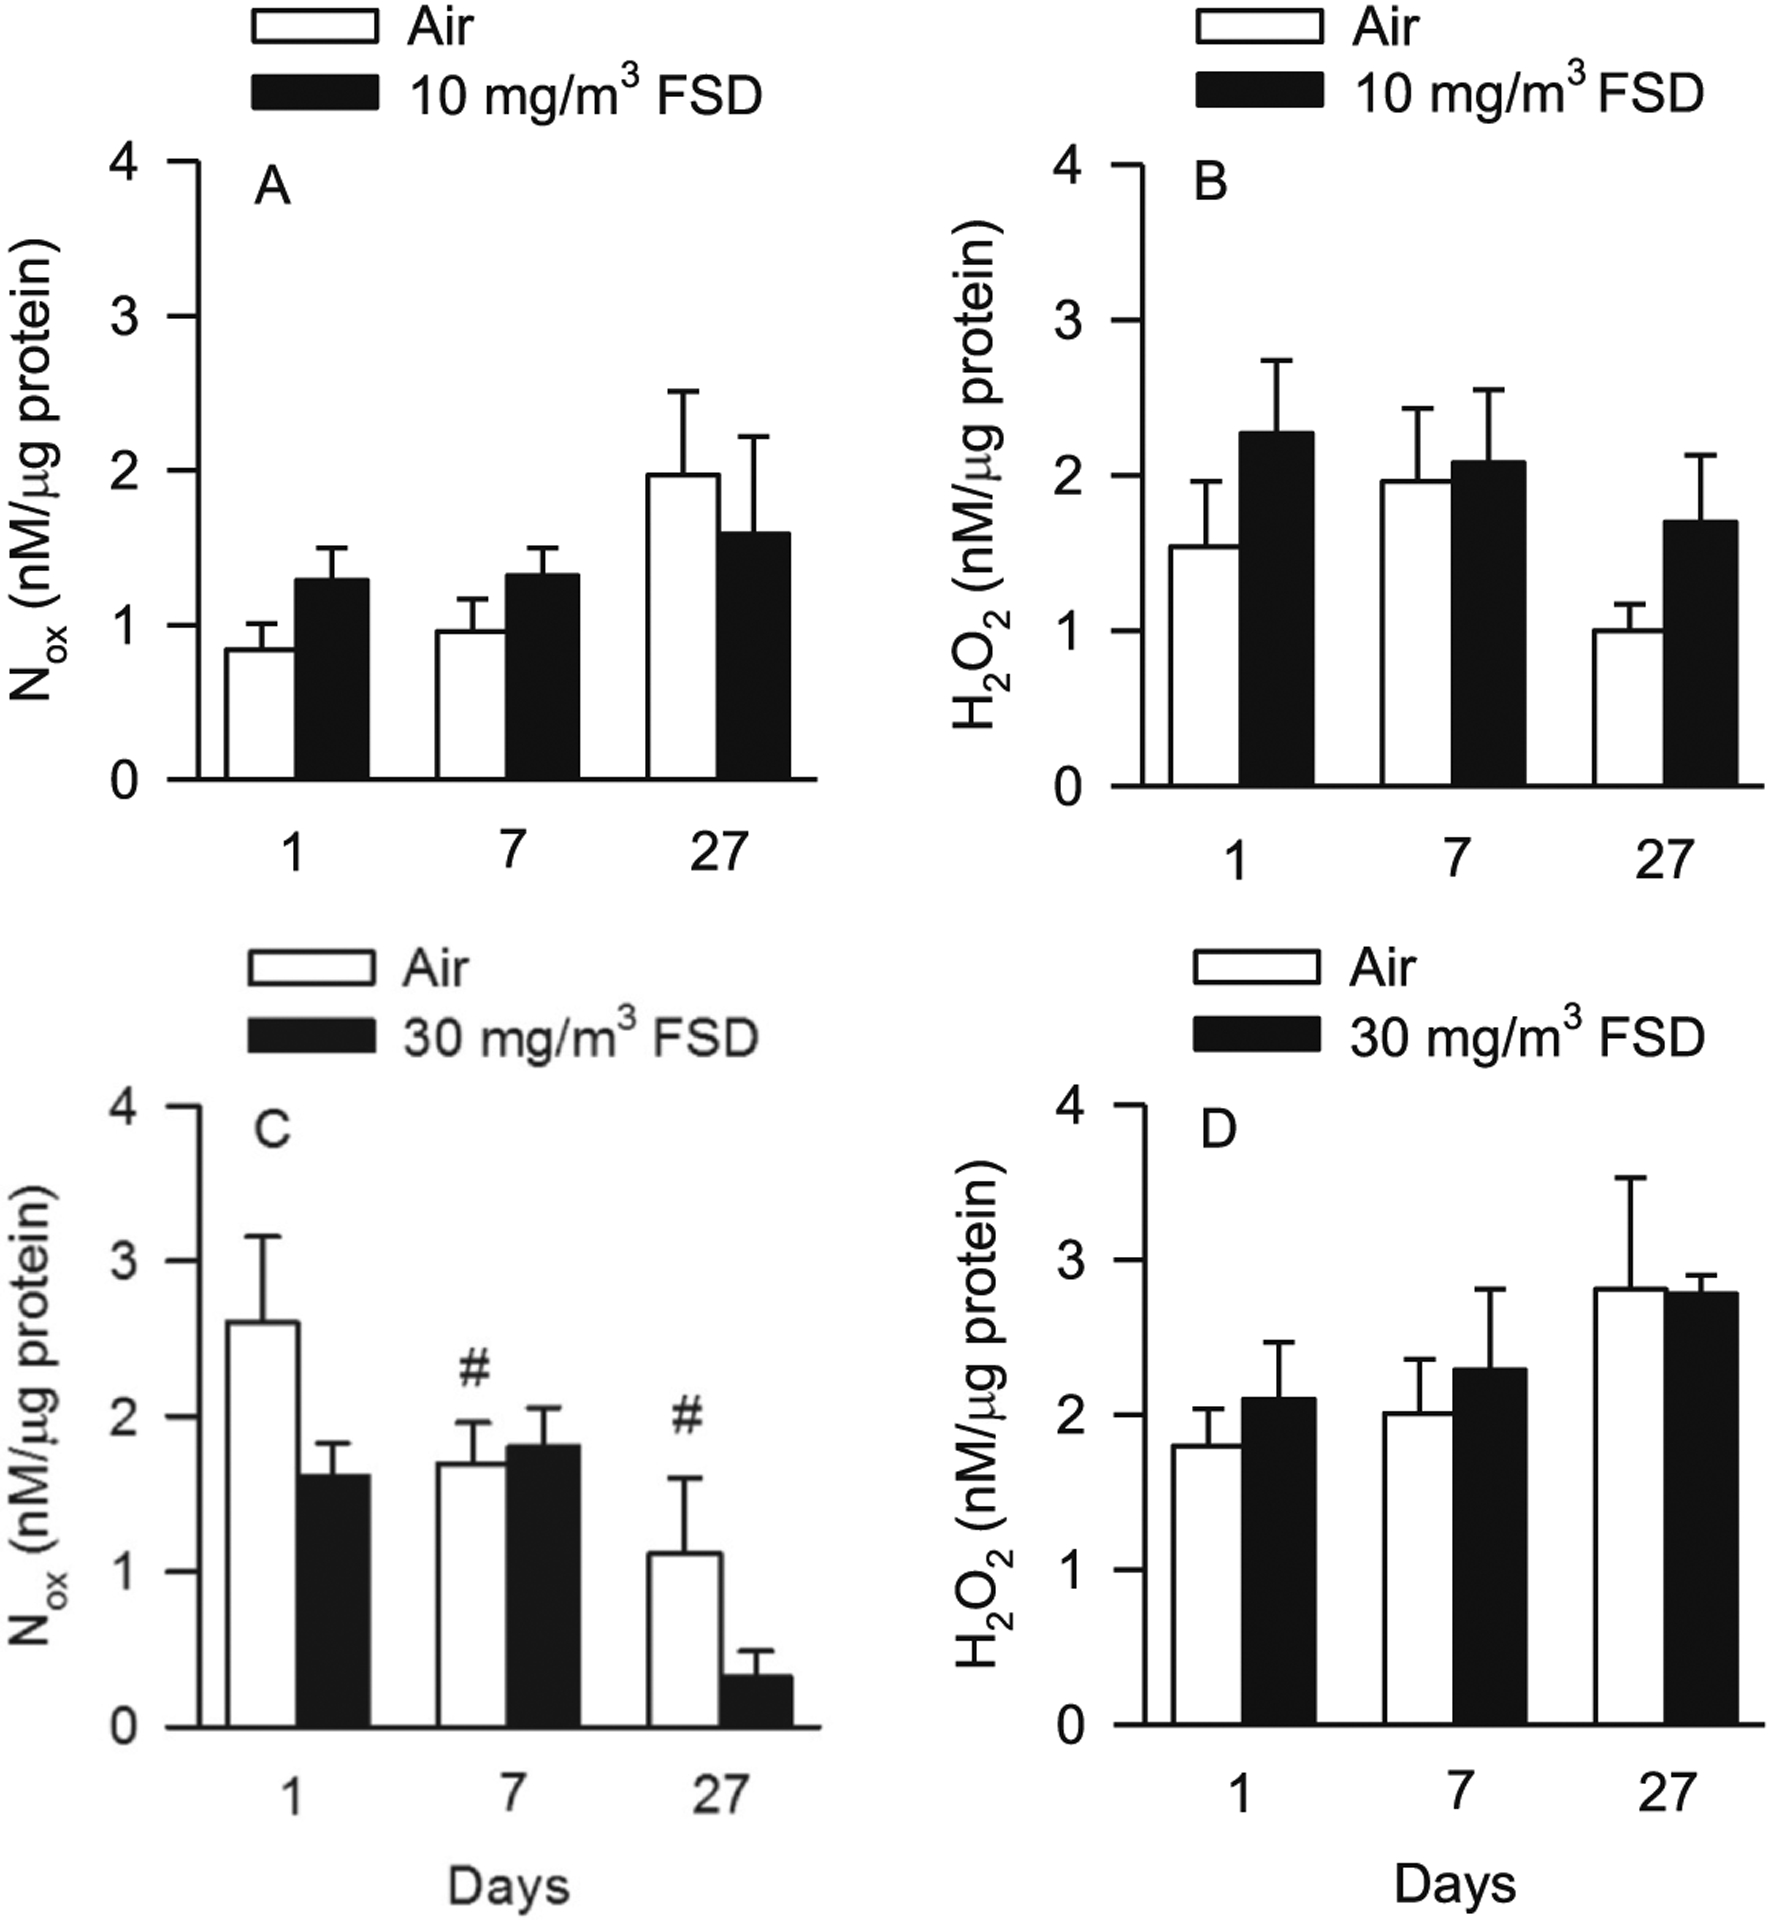
Nitrate/nitrite [Nox; A, 10 mg/m3 frack sand dust (FSD) 8, or C, 30 mg/m3 FSD 8] and hydrogen peroxide (H2O2;B, 10 mg/m3 FSD 8, or D, 30 mg/m3 FSD 8) levels in the kidneys of rats at 1, 7 or 27 d after exposure (n = 8 animals/group and at each time point). Exposure to 10 mg/m3 FSD 8 did not significantly affect Nox (A) or H2O2 (B) concentrations in the kidneys. However, Nox concentrations were decreased in FSD 8-exposed compared to air-exposed rats 27 d after exposure to the 30 mg/m3 FSD 8 (C). Nox concentrations also were lower on day 7 and 27 than on day 1 in air-exposed rats (C and D; #P < 0.05). FSD 8 exposure at 30 mg/m3 did not alter H2O2 concentrations in the kidney.
3.3. Cardiac function (telemetric and in vivo measurements)
Fig. 5 illustrates various measures of cardiac function collected by telemetry. RMSSD (a measure of beat to beat variability that is indicative of parasympathetic activity) appeared to increase 1 d after exposure in rats treated with both 10 and 30 mg/m3 FSD 8. However, these differences were not significant in air-treated vs. FSD 8-treated rats because of the variance between groups (Fig. 5A). To reduce some of the variance, and determine if there are specific components of HR that were affected by exposure to FSD 8, the low frequency (LF) and high frequency (HF) components of HR were analyzed separately. LF varied between the groups, but, because of the high variability, there were no significant differences (Fig. 5B). However, the HF component was increased significantly 1 d after exposure to 10 mg/m3 FSD 8, but not at any other time nor after exposure to 30 mg/m3 FSD 8 (Fig. 5C).
Fig. 5.
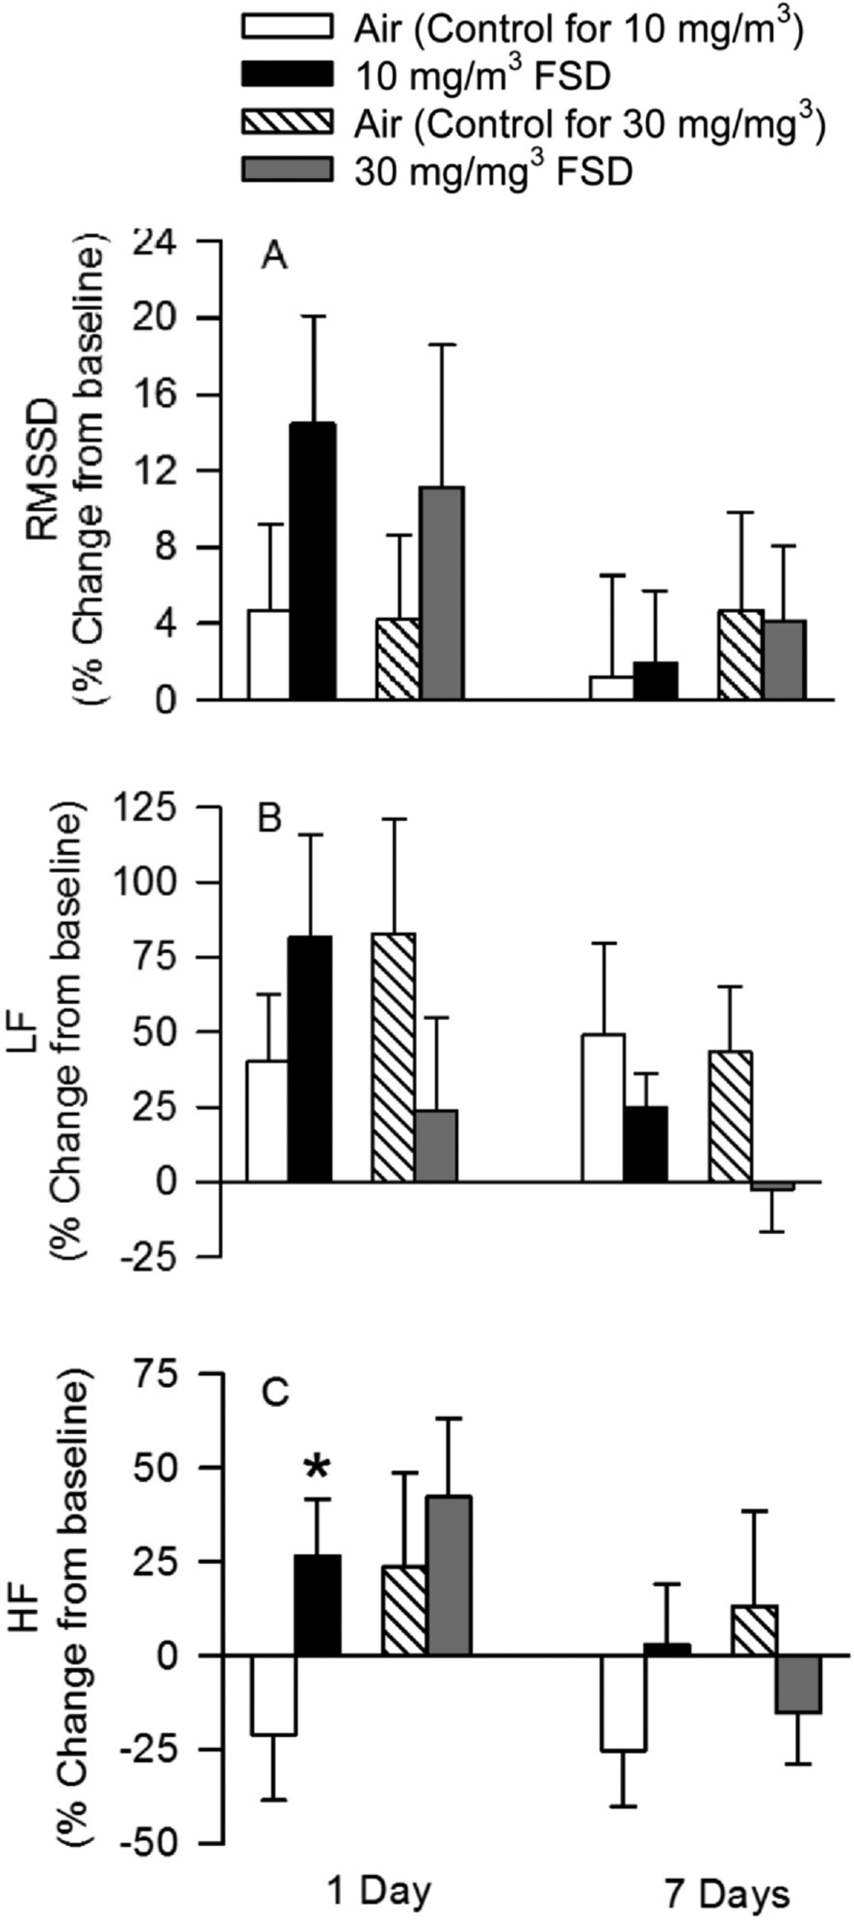
Estimates of heart rate (HR) variability recorded using telemetry in rats after exposure to air or frack sand dust (FSD) 8 (n = 6–8 rats/air or FSD8 exposure). Data are presented as the % change from baseline. Baseline data are measures that were collected prior to air or FSD 8 exposure. RMSSD (A; the R-R interval) was variable, but there were no significant effects of treatment or day after recovery on this measure. There were also no significant differences in the low frequency signal (B). However, a significant increase in the high frequency component of the EEG signal occurred one day after exposure (C) to 10 mg/m3 FSD 8.
The effects of FSD 8 inhalation on telemetric indices of blood pressure are presented in Fig. 6. There were no exposure-related changes in baseline (mean ± sem; air 116.92 ± 3.32 mmHg, FSD 8118.37 ± 2.01 mmHg) or norepinephrine-induce changes in systolic blood pressure (SBP; Fig. 6A). There also were no changes in baseline diastolic blood pressure (DBP; air 81.15 ± 3.62 mmHg, FSD 8 81.42 ± 3.03 mmHg). However, 7 d after exposure to 30 mg/m3 FSD 8 there was a significant increase in NE-induce DBP in FSD 8-exposed animals compared to filtered air-exposed rats (Fig. 6B). There were no significant differences in baseline (10 mg/m3: air 389.07 ± 16 BPM, FSD8 387.63 ± 14.43) 30 mg/m3 air: 30 mg/m3 air 363.66 ± 7.30, FSD8 373.56 ± 10.16) heart rate (HR) or in dobutamine (β1-adrenoreceptor agonist) -induced changes in HR air-exposed and FSD 8-exposed rats at 10 and 30 mg/m3 (Fig. 6C). However, 27 d after exposure, HR was reduced in both air-exposed and FSD 8-treated rats compared to animals assessed at 1 d post-exposure. At 27 d, the reduction in HR was greater in air and FSD 8 rats in the 30 mg/m3 group than the 10 mg/m3 group.
Fig. 6.
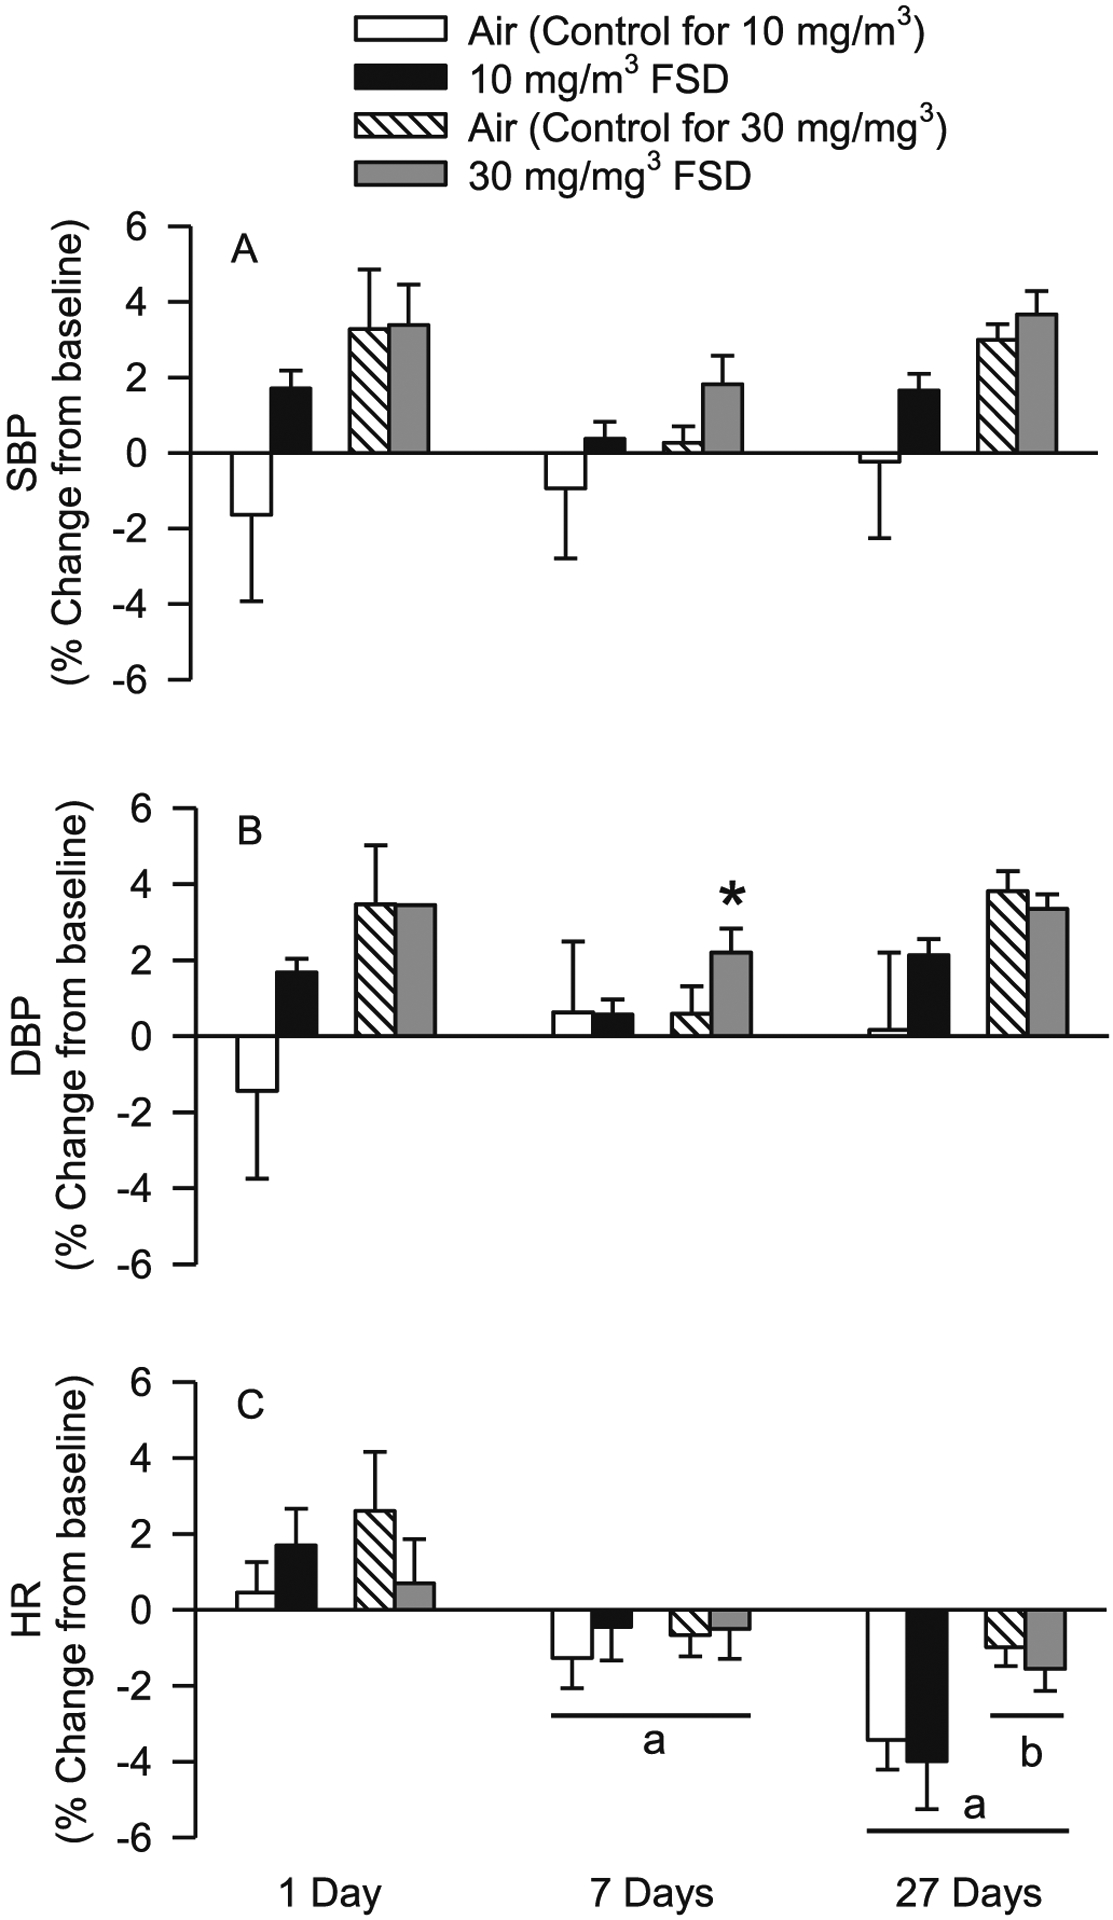
Effects of frack sand dust (FSD) 8 exposure on blood pressure and heart rate (HR). Data are presented as the % change from baseline (n = 6–8 air or FSD 8 rats per time point). Exposure to FSD 8 did not affect systolic blood pressure (SBP) on day 1 (A). Diastolic blood pressure (DBP) was not affected by exposure to FSD 8 on days 1 and 27 but was increased in animals treated with 30 mg/m3 FSD-8 (B). HR was lower on days 7 and 27 after exposure compared to 1 d after exposure, and HR was lower 27 days after exposure than 7 days after exposure (C). Twenty-seven d after exposure, both air controls and animals treated with 30 mg/m3 FSD 8 had lower HR values than animals in the 10 mg/m3 group (aless than day 1 values; bless than 10 m/mg3; *P < 0.05).
Hemodynamic parameters of cardiac function derived from P–V loop analysis following exposure to air or 10 mg/m3 FSD 8 are presented in Fig. 7A–I. There were no changes in baseline work/stroke (air 14,138 ± 796.15 mmHg*μl, FSD 814854.29 ± 417.58) cardiac output (air 51,547.14 μl/min ± 2718.66, FSD8 56,641.42 ± 2706.96; or stroke volume (air 135.97 μl ± 13.35, FSD8 146.37 ± 11.20). Dobutamine-induced increases in work/stroke, cardiac output and stroke volume responses were reduced 1 d after exposure to 10 mg/m3 FSD 8 (Fig. 7A–C). At 7 d after exposure, there were no FSD 8-induced differences in these measures of cardiac function (Fig. 7D–F). However, cardiovascular responses to dobutamine were similar 1 and 27 d after exposure to 10 mg/m3 FSD 8; responsiveness to dobutamine was reduced in all three measures of cardiac function (however, the reduced responsiveness in work/stroke was not significantly different in air-exposed and FSD 8-treated rats).
Fig. 7.
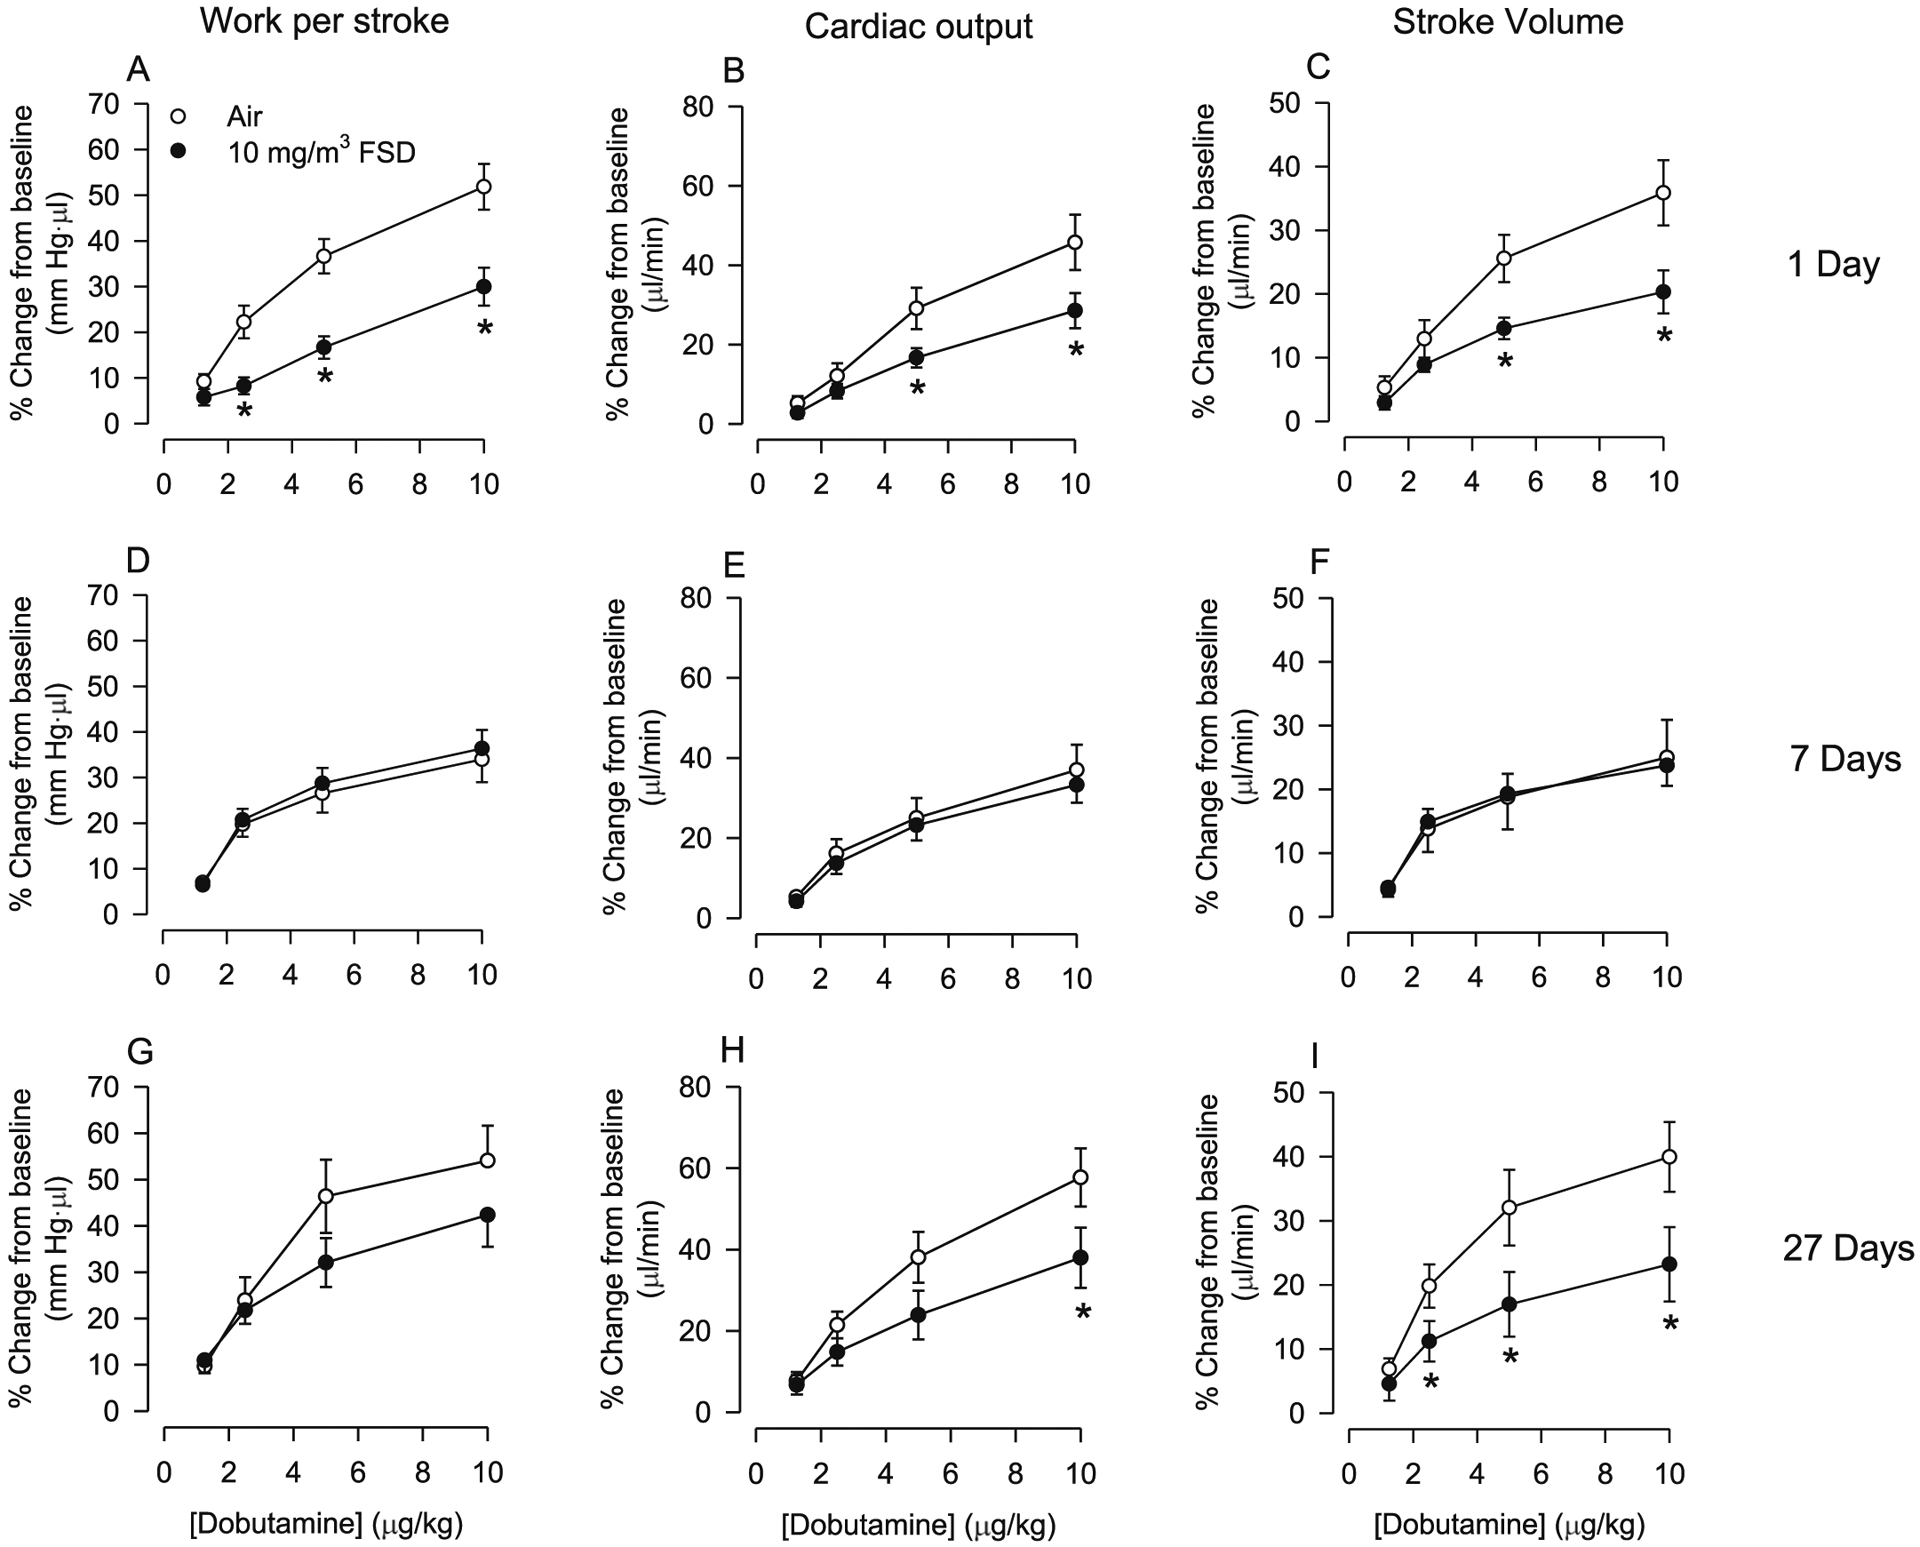
Effects of frack sand dust (FSD) 8 on cardiac work (A, D and G), cardiac output (B, E and H) and stroke volume (C, F and I) on responses to dobutamine in rats exposed to air or 10 mg/m3 FSD 8 (n = 6–8 air or FSD 8 rats per time point). One d after exposure to FSD 8, cardiac work, cardiac output and stroke volume responses to dobutamine were reduced (A–C). However, 7 d after exposure to FSD8 responsiveness to dobutamine returned to baseline levels (D–F). Twenty-seven d following exposure to FSD 8, cardiac output and stroke volume were again reduced in response to dobutamine (H and I). *P < 0.05.
After exposure to 30 mg/m3 FSD 8, there were no significant changes in baseline work/stroke (air 13,146 ± 1244.69 mmHg*μl, FSD 813392.5 ± 634.26), cardiac output (air 46,335 ± 3905.38 μl/min, FSD8 50,627.5 ± 2456.98) or stroke volume (air 135 μl ± 12.31 FSD 136.35 ± 7.26). Dobutamine-induced increases in work/stroke, cardiac output and stroke volume were smaller in FSD 8 than air control rats (Fig. 8A–C). Similar differences were still apparent 7 d following exposure (Fig. 8D–F); however, the only change observed was that work/stroke was significantly reduced in FSD 8-treated rats as compared to the air-breathing controls. By 27 d after the exposure, there were no differences in cardiac function responsiveness to dobutamine (Fig. 8G–I).
Fig. 8.
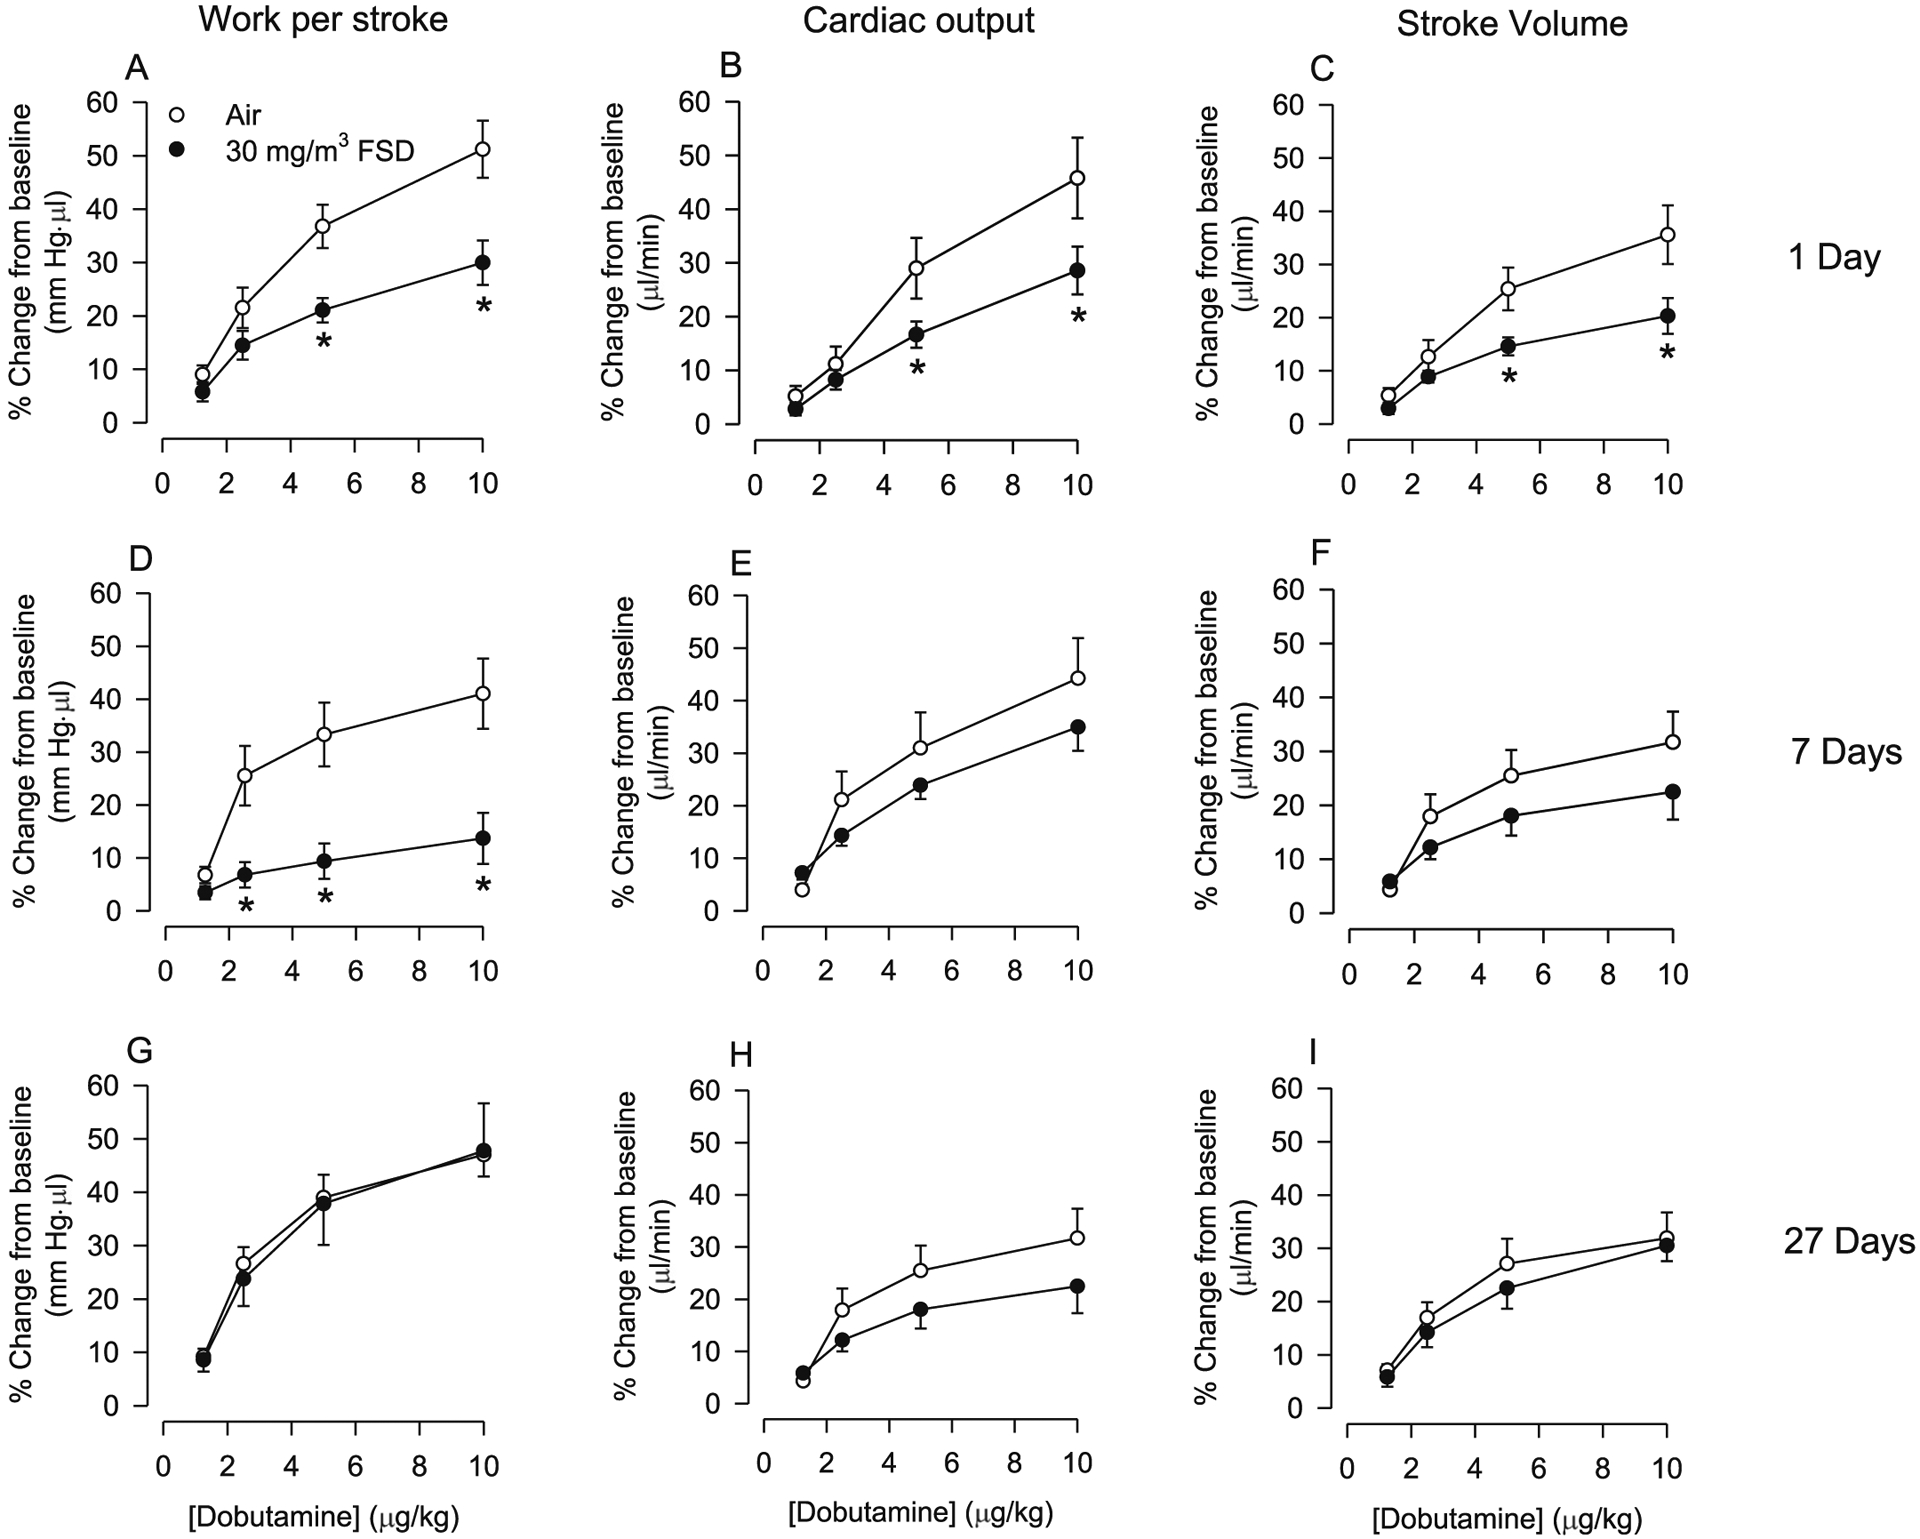
Effects of frack sand dust (FSD) 8 on cardiac work (A, D and G), cardiac output (B, E and H) and stroke volume (C, F and I) responses to dobutamine in rats exposed to air or 30 mg/m3 FSD 8 (n = 6–8 air or FSD 8 rats per time point). One d after exposure to FSD 8, responsiveness to dobutamine was reduced (A–C). Seven d after exposure to FSD 8, dobutamine-induced increases in cardiac work were lower in exposed than in air-treated rats. Twenty-seven d following exposure to FSD 8, cardiac output and stroke volume returned to control levels (G-I). *P < 0.05.
P–V loop analysis of the effects of 10 mg/m3 FSD 8 exposure on systolic and diastolic blood pressure (SBP and DBP, respectively) are presented in Fig. 9A–D. One d after exposure, NE-induced increases in SBP and DBP were smaller in rats exposed to 10 mg/m3 FSD 8 than in air-exposed animals (Fig. 9A–B). However, the changes in blood pressure induced by FSD 8 exposure were no longer apparent 7 and 27 d after exposure (Fig. 9C–F).
Fig. 9.
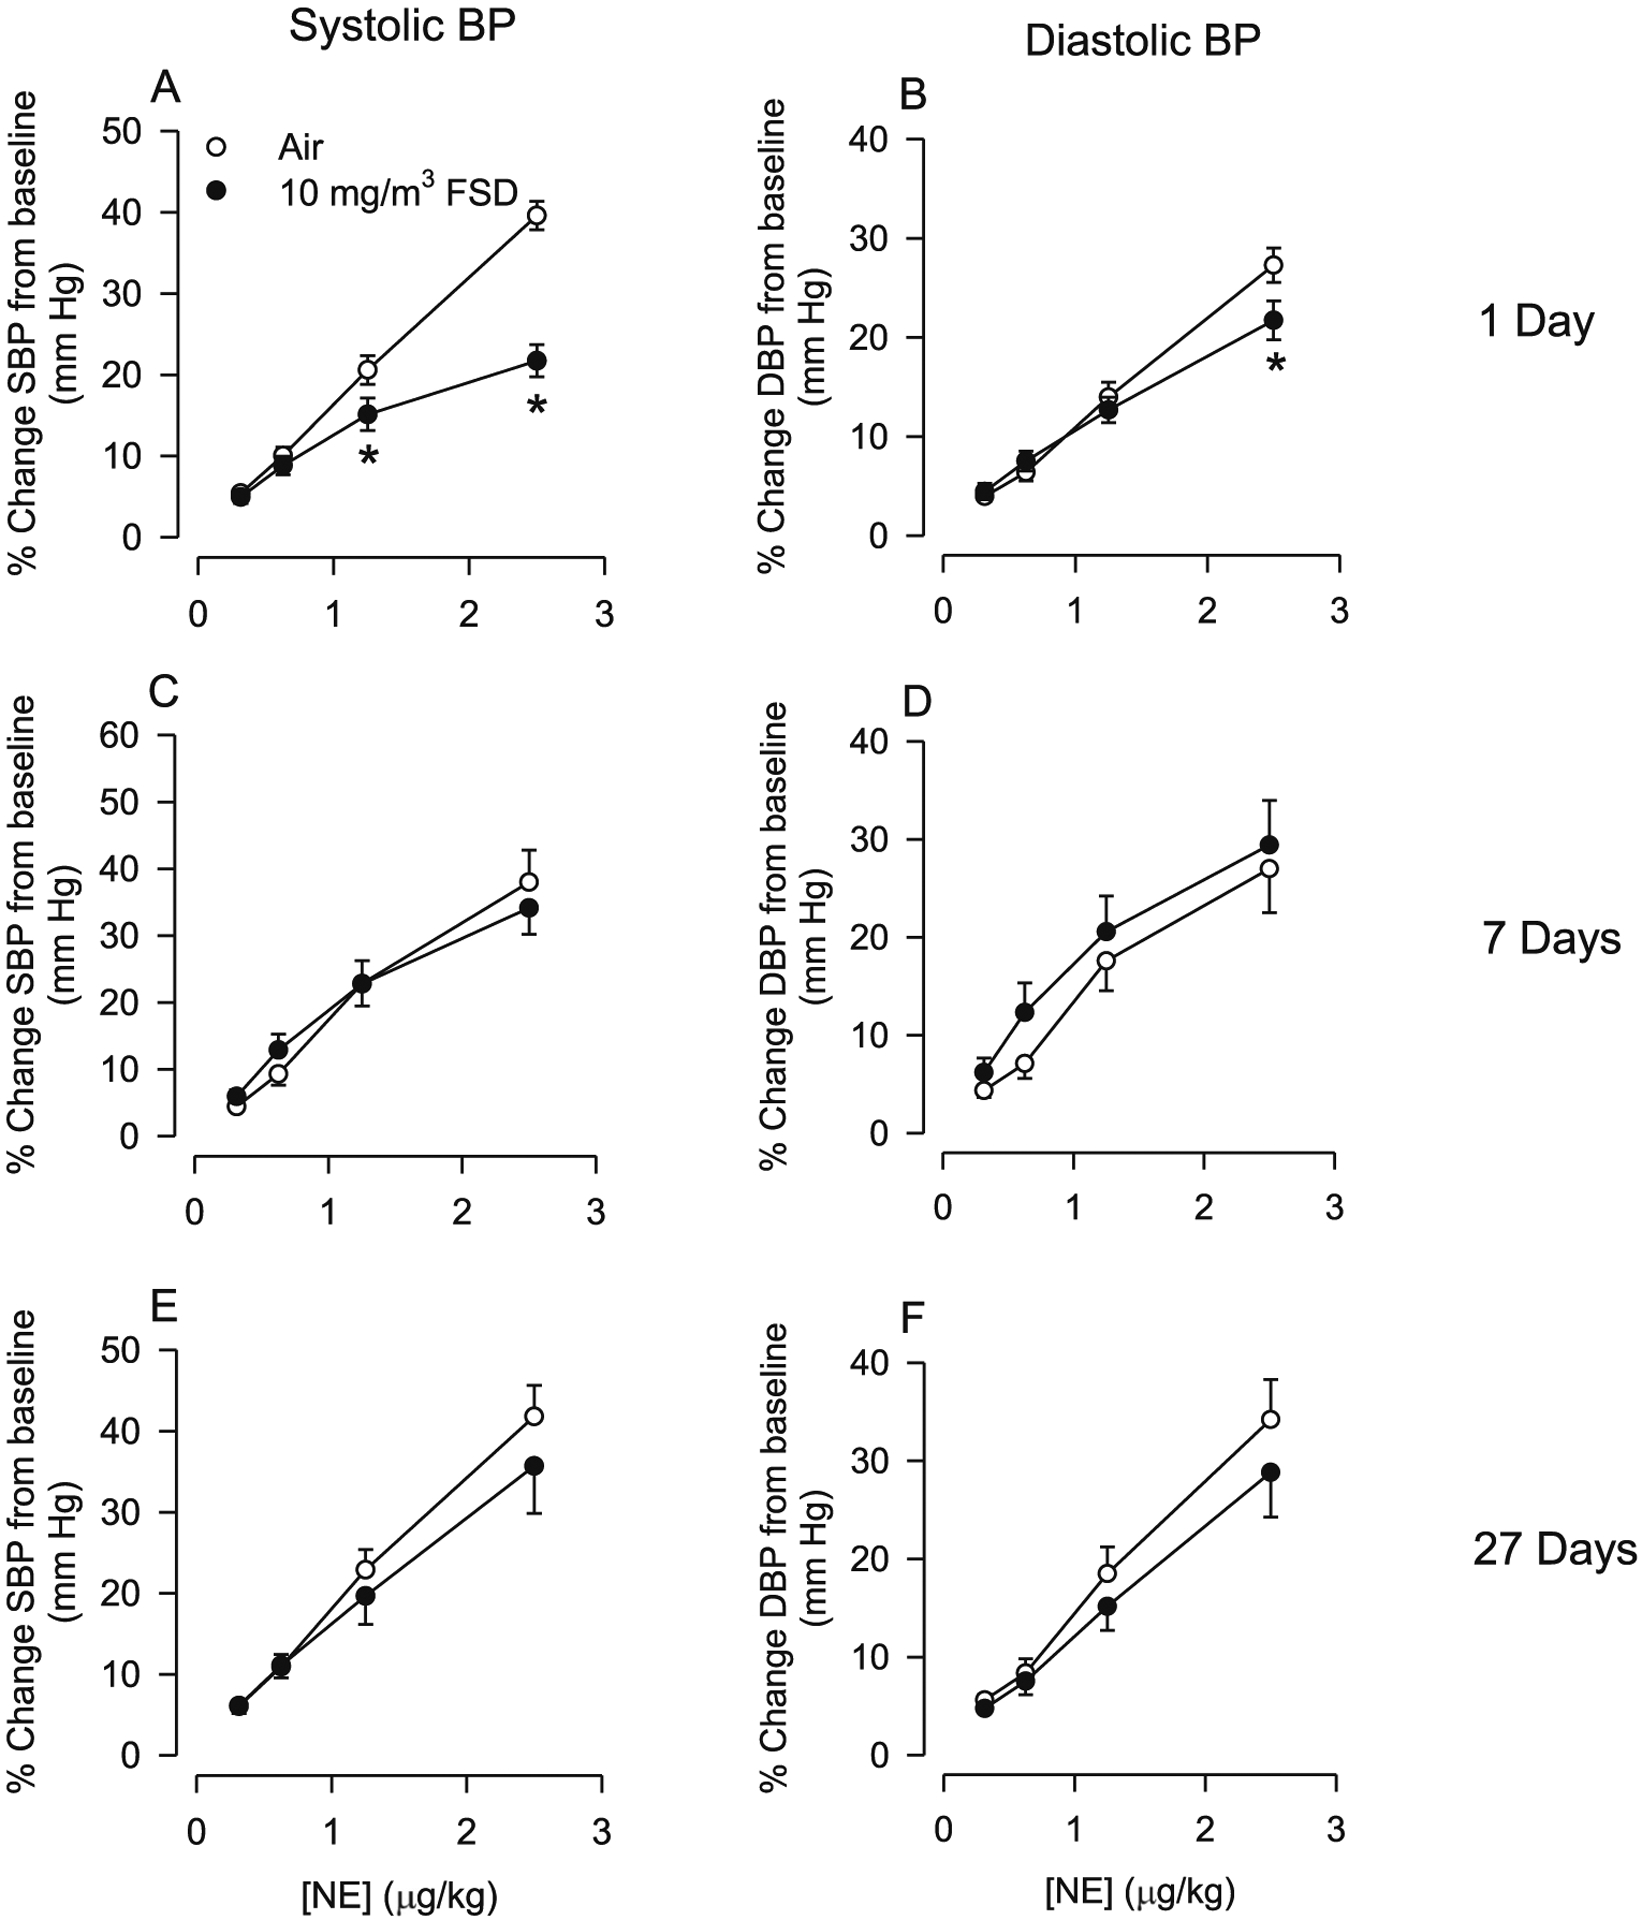
Changes in systolic blood pressure (SBP) and diastolic blood pressure (DBP) in response to norepinephrine (NE) in rats treated with 10 mg/m3 frack sand dust (FSD) 8 (n = 6–8 air or FSD 8 rats per time point). One day following FSD 8 exposure there was a reduction in NE-induced increases in SBP and DBP (A and B). By 7 and 27 d following FSD 8 exposure, SBP and DBP returned to control levels. *P < 0.05.
The effects of exposure to 30 mg/m3 FSD 8 on NE-induced changes in SBP and DBP are presented in Fig. 10 (A–F). One day following exposure, NE-induced increases in SBP and DBP were smaller in FSD 8-exposed than in air-exposed control rats (Fig. 10A and B). However, these differences in responsiveness were no longer apparent 7 or 27 d following exposure (Fig. 10C–F).
Fig. 10.
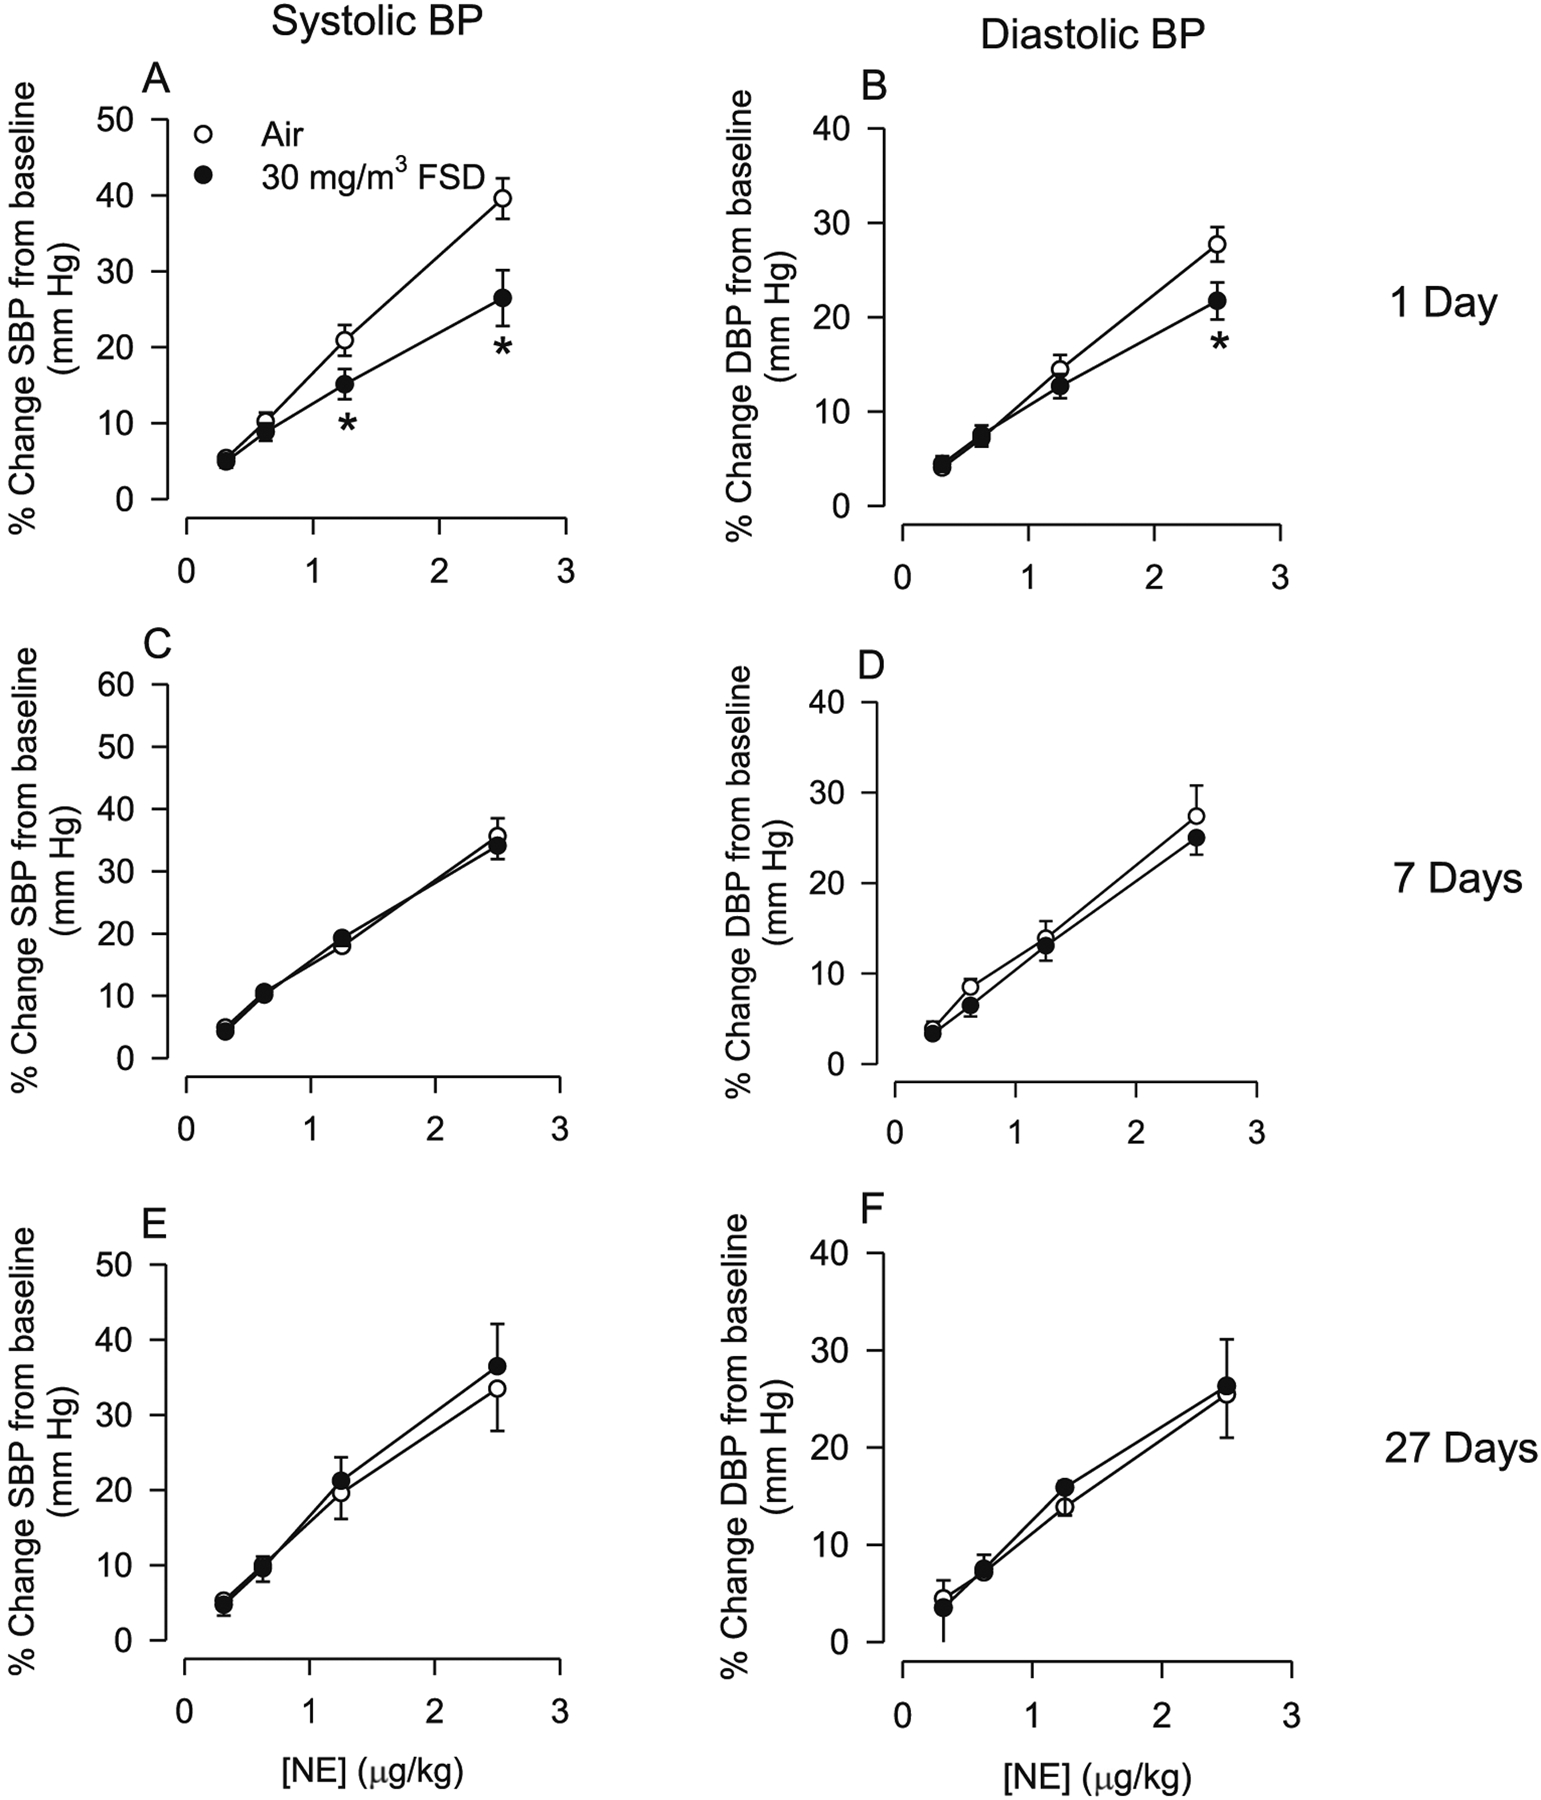
Changes in systolic blood pressure (SBP) and diastolic blood pressure (DBP) in response to norepinephrine (NE) in rats treated with 30 mg/m3 frack sand dust (FSD) 8 (n = 6–8 air or FSD 8 rats per time point). One day following FSD 8 exposure there was a reduction in NE-induced increases in SBP and DBP (A and B). By 7 and 27 d following FSD 8 exposure, SBP and DBP returned to control levels. *P < 0.05.
3.4. Transcript levels
qRT-PCR was used to measure changes in transcript levels of pro-inflammatory cytokines, remodeling factors, and factors induced by hypoxia. On day 1 after exposure to 10 mg/m3 FSD 8, there was an increase in IL-1β and IL-6 levels in the hearts. There were no changes in transcript levels on days 7 or 27 (Fig. 11A). There were no significant differences in gene expression in the heart after exposure to 30 mg/m3 FSD 8.
Fig. 11.
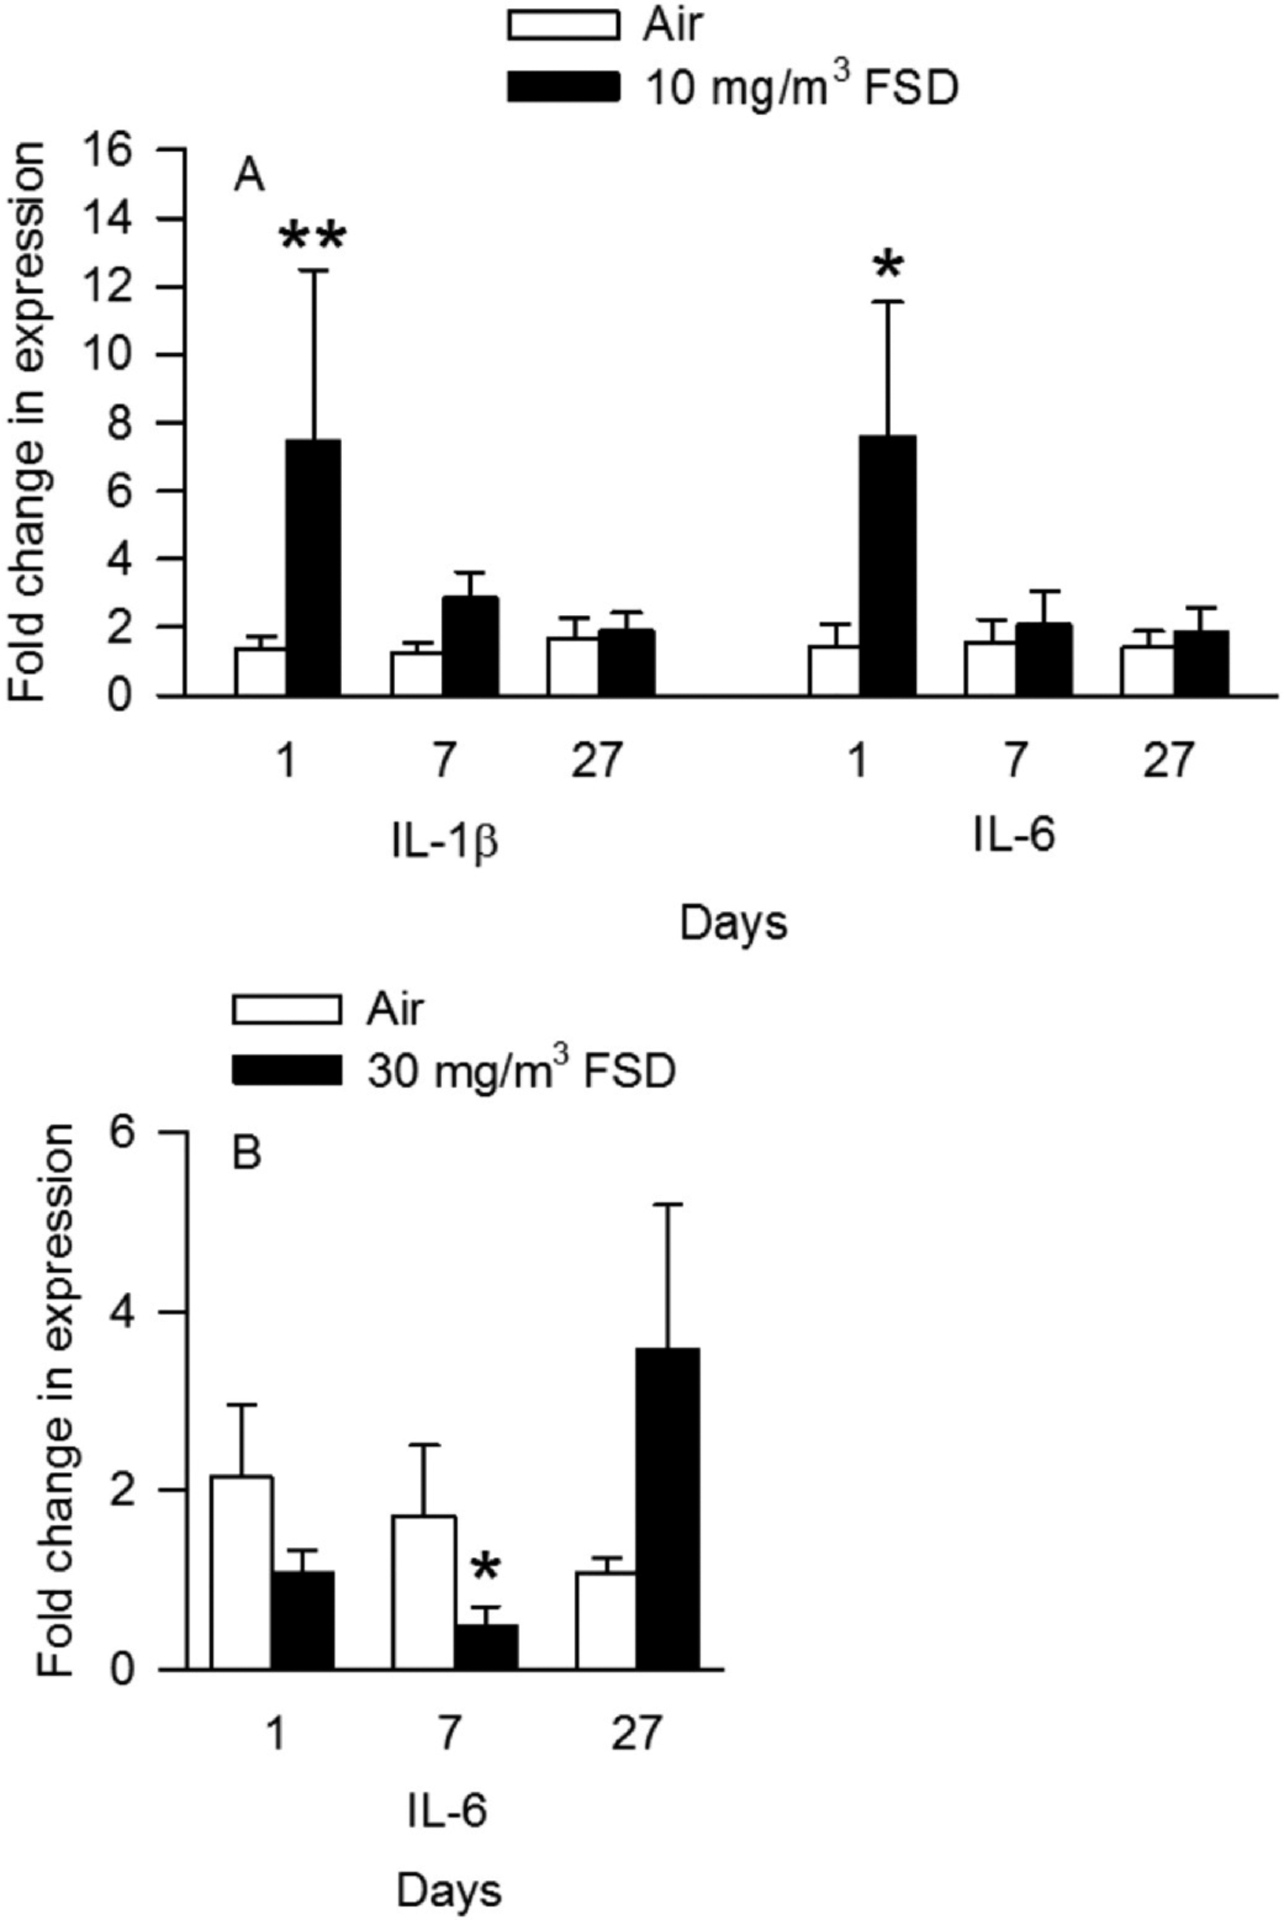
Effects of exposure to 10 and 30 mg/m3 frack sand dust (FSD) 8 on interleukin (IL) 1-β and IL-6 in the heart after 1, 7 or 27 d of exposure. (n = 8 animals/group and at each time point *P < 0.05).
3.5. Protein array analyses
These experiments were conducted only on animals that had been exposed to 30 mg/m3 FSD 8. Protein concentrations measured in the heart are presented in Table2. FSD 8 exposure did not significantly alter concentrations of measured proteins in the heart at any post-exposure time point. Protein concentrations in kidney tissue collected from rats exposed to filtered air or FSD 8 are shown in Table 2. Analyses of kidney protein concentrations revealed that there were reductions in OPN, IP10 and VEGF in the kidneys of rats exposed to 30 mg/m3 FSD 8 7 d after the exposure, and a reduction in GST 27 d after FSD 8 exposure (Table 3). Multi-variate analyses of proteins in the heart (Fig. 12A–C; 1, 7 and 27 d, respectively) and kidney (Fig. 13; 1, 7 and 27 d, respectively) uncovered several significant correlations between changes in protein levels measured on the arrays. Proteins that displayed significant changes in correlations were primarily markers of dysfunction and remodeling. The marked bars in the figure designate the correlations that were significant. The correlated proteins, and the potential significance of these correlations, are discussed below.
Table 2.
Effect of inhalation of 30 mg/m3 FSD 8 on protein concentrations in the heart.
| Protein | Air 1 d | FSD 8 1 d | Air 7 d | FSD 8 7 d | Air 27 d | FSD 8 27 d |
|---|---|---|---|---|---|---|
| μM/μg protein | ||||||
| CAV-1 | 12.4 ± 4.02 | 10.73 ± 2.16 | 11.43 ± 4.38 | 9.45 ± 2.80 | 6.81 ± 2.52 | 4.75 ± 2.15 |
| CTGF | 2.89 ± 1.00 | 5.66 ± 2.76 | 6.64 ± 3.24 | 2.71 ± 1.99 | 7.93 ± 4.56 | 11.58 ± 5.07 |
| IL-6 | 0.65 ± 0.24 | 0.94 ± 0.46 | 0.91 ± 0.42 | 0.39 ± 0.20 | 1.34 ± 0.71 | 2.65 ± 1.23 |
| MCP-1 | 0.08 ± 0.01 | 0.12 ± 0.01 | 0.1 ± 0.01 | 0.12 ± 0.02 | 0.17 ± 0.04 | 0.18 ± 0.24 |
| GRO/KC/CINC | 0.08 ± 0.01 | 0.09 ± 0.01 | 0.10 ± 0.01 | 0.09 ± 0.01 | 0.17 ± 0.57 | 0.18 ± 0.05 |
| TIMP-1 | 0.87 ± 0.18 | 1.01 ± 0.22 | 1.13 ± 0.32 | 1.05 ± 0.26 | 1.88 ± 0.57 | 2.08 ± 0.83 |
| tPAI | 0.20 ± 0.08 | 0.23 ± 0.08 | 0.19 ± 0.03 | 0.27 ± 0.11 | 0.29 ± 0.10 | 0.39 ± 0.11 |
| VEGF | 1.15 ± 0.19 | 1.41 ± 0.19 | 1.56 ± 0.14 | 1.65 ± 0.17 | 1.19 ± 0.10 | 1.20 ± 0.27 |
For each protein measured, the values from FSD 8-exposed rats were compared to those of the same-day controls.
There were no significant effects of FSD 8 exposure on the concentrations of these proteins in the heart.
Table 3.
Effect of inhalation of 30 mg/m3 FSD 8 on protein concentrations in the kidney.
| Protein | Air 1 d | FSD 8 1 d | Air 7 d | FSD 8 7 d | Air 27 d | FSD 8 27 d |
|---|---|---|---|---|---|---|
| μM/μg protein | ||||||
| Calbindin | 6.03 ± 2.23 | 4.97 ± 0.80 | 7.62 ± 3.61 | 4.98 ± 0.79 | N.D. | N.D. |
| Clusterin | 10.51 ± 2.23 | 7.65 ± 2.61 | 11.03 ± 2.99 | 5.41 ± 2.36 | N.D. | N.D. |
| GSTα | 3.61 ± 1.03 | 3.83 ± 2.19 | 5.07 ± 1.91 | 2.50 ± 0.98 | 8.59 ± 3.75* | 1.28 ± 0.60 |
| IP-10 | 4.23 ± 1.05 | 8.83 ± 2.75 | 9.88 ± 2.49* | 4.08 ± 1.02 | 10.97 ± 3.09 | 6.54 ± 0.63 |
| KIM-1 | 10.54 ± 2.73 | 12.23 ± 5.11 | 13.18 ± 4.85 | 5.37 ± 1.19 | 14.01 ± 5.73 | 5.24 ± 1.64 |
| OPN | 6.48 ± 1.62 | 6.54 ± 1.39 | 11.34 ± 2.79* | 2.23 ± 0.59 | 9.05 ± 1.69 | 7.68 ± 1.68 |
| TIMP-1 | 9.89 ± 5.36 | 13.96 ± 9.24 | 18.64 ± 9.22 | 7.77 ± 3.70 | 103.70 ± 35.83 | 101.42 ± 41.40 |
| VEGF | 7.66 ± 2.33 | 11.96 ± 3.93 | 11.86 ± 2.82* | 5.77 ± 1.58 | 16.63 ± 3.86 | 9.06 ± 1.81 |
FSD 8 vs. air-breathing controls,
P ≤ 0.05. N.D., not determined.
Fig. 12.
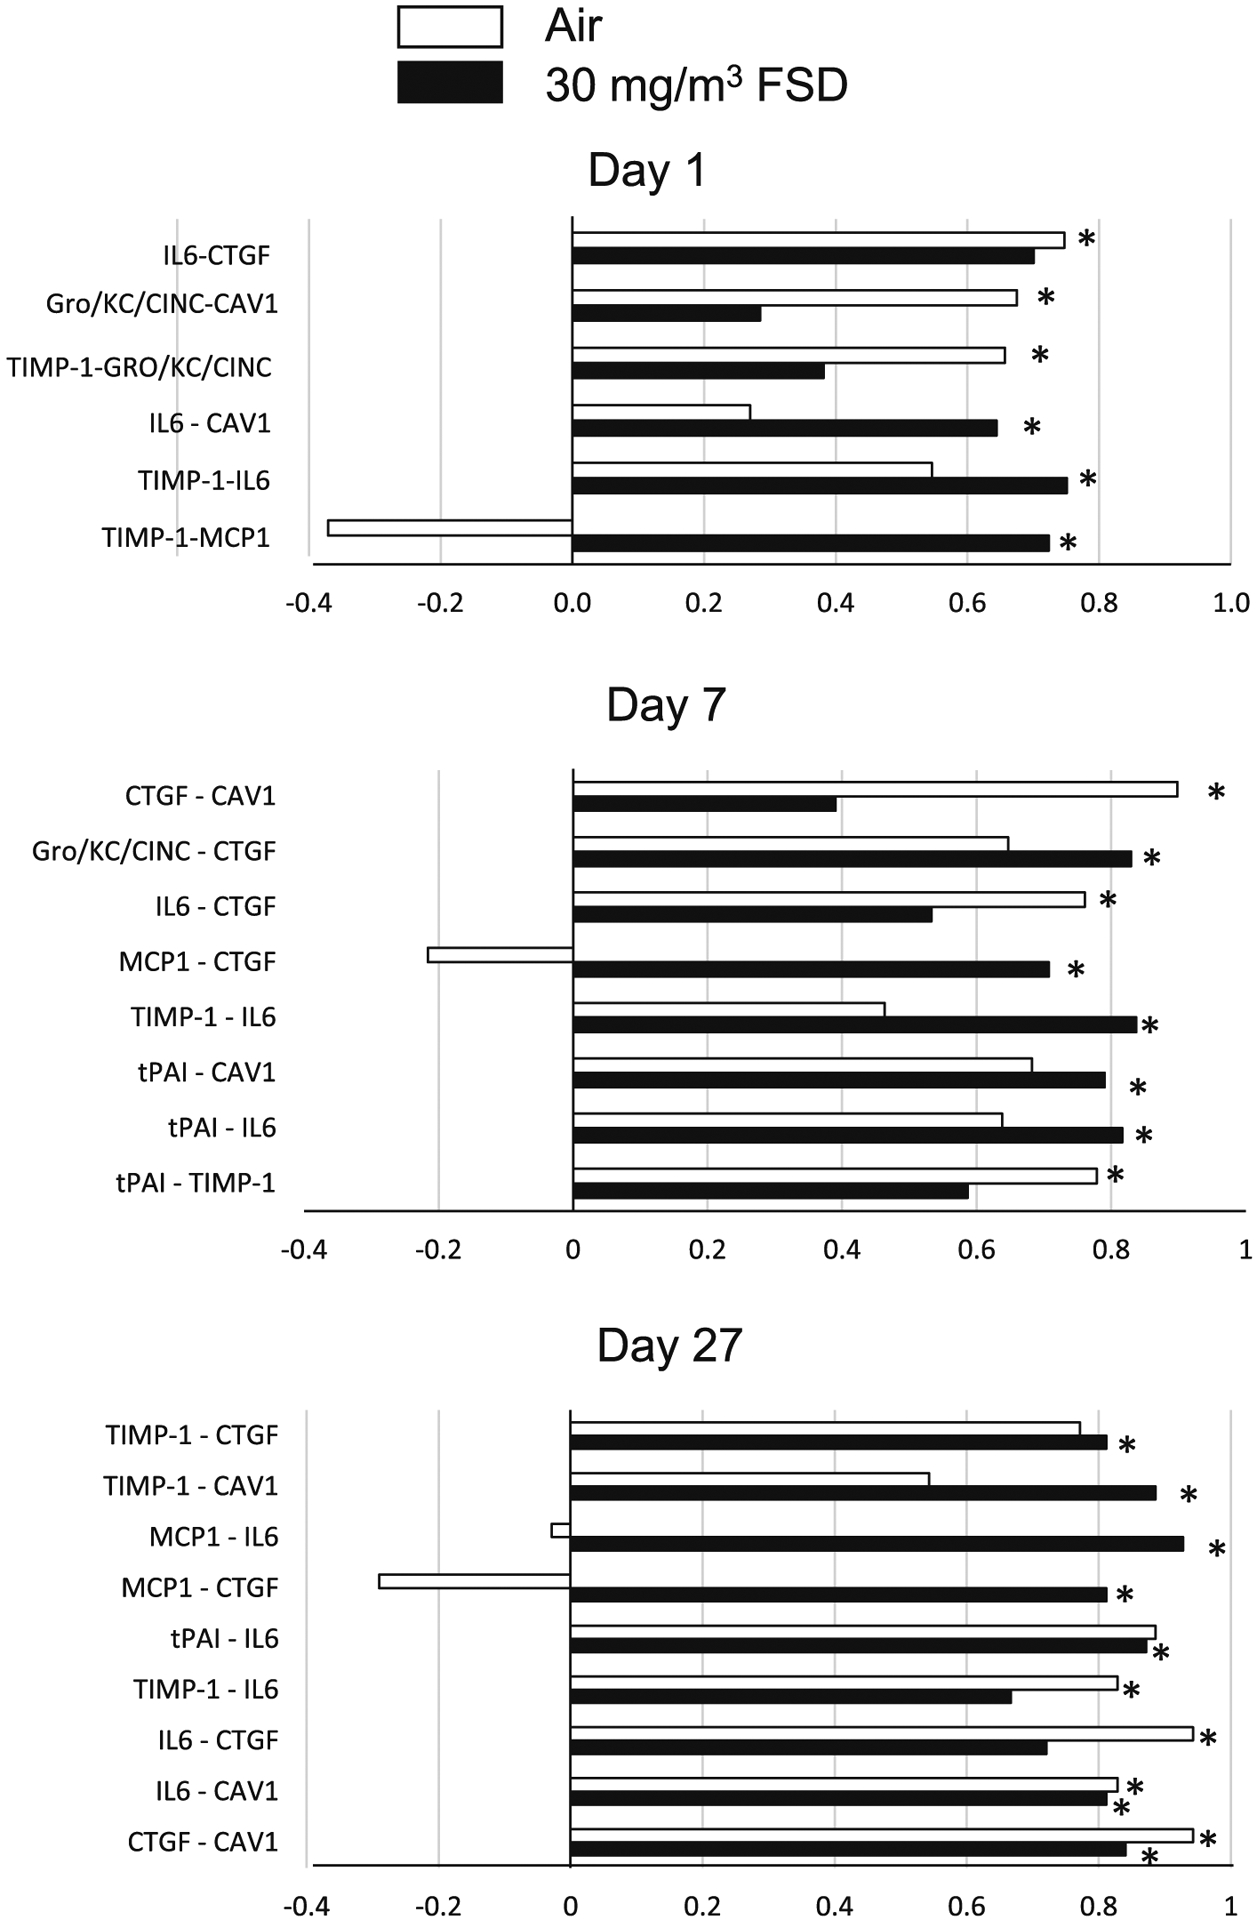
Correlations between various proteins measured in the heart of rats exposed to frack sand dust (FSD) 8. The white bars represent correlations between proteins in air-exposed rats and the black bars represent correlations between proteins in the FSD 8-exposed rats (n = 8 animals/group and at each time point). Abbreviations: connective tissue growth factor (CTFG), Gro/KC/CINC (cytokine-induced neutrophil chemoattractant protein), caveolin-1 (CAV-1), tissue inhibitor of matrix-metalloproteinase (TIMP-1), monocyte chemoattractant protein (MCP-1), tissue plasminogen activating inhibitor (tPAI). *P < 0.05.
Fig. 13.
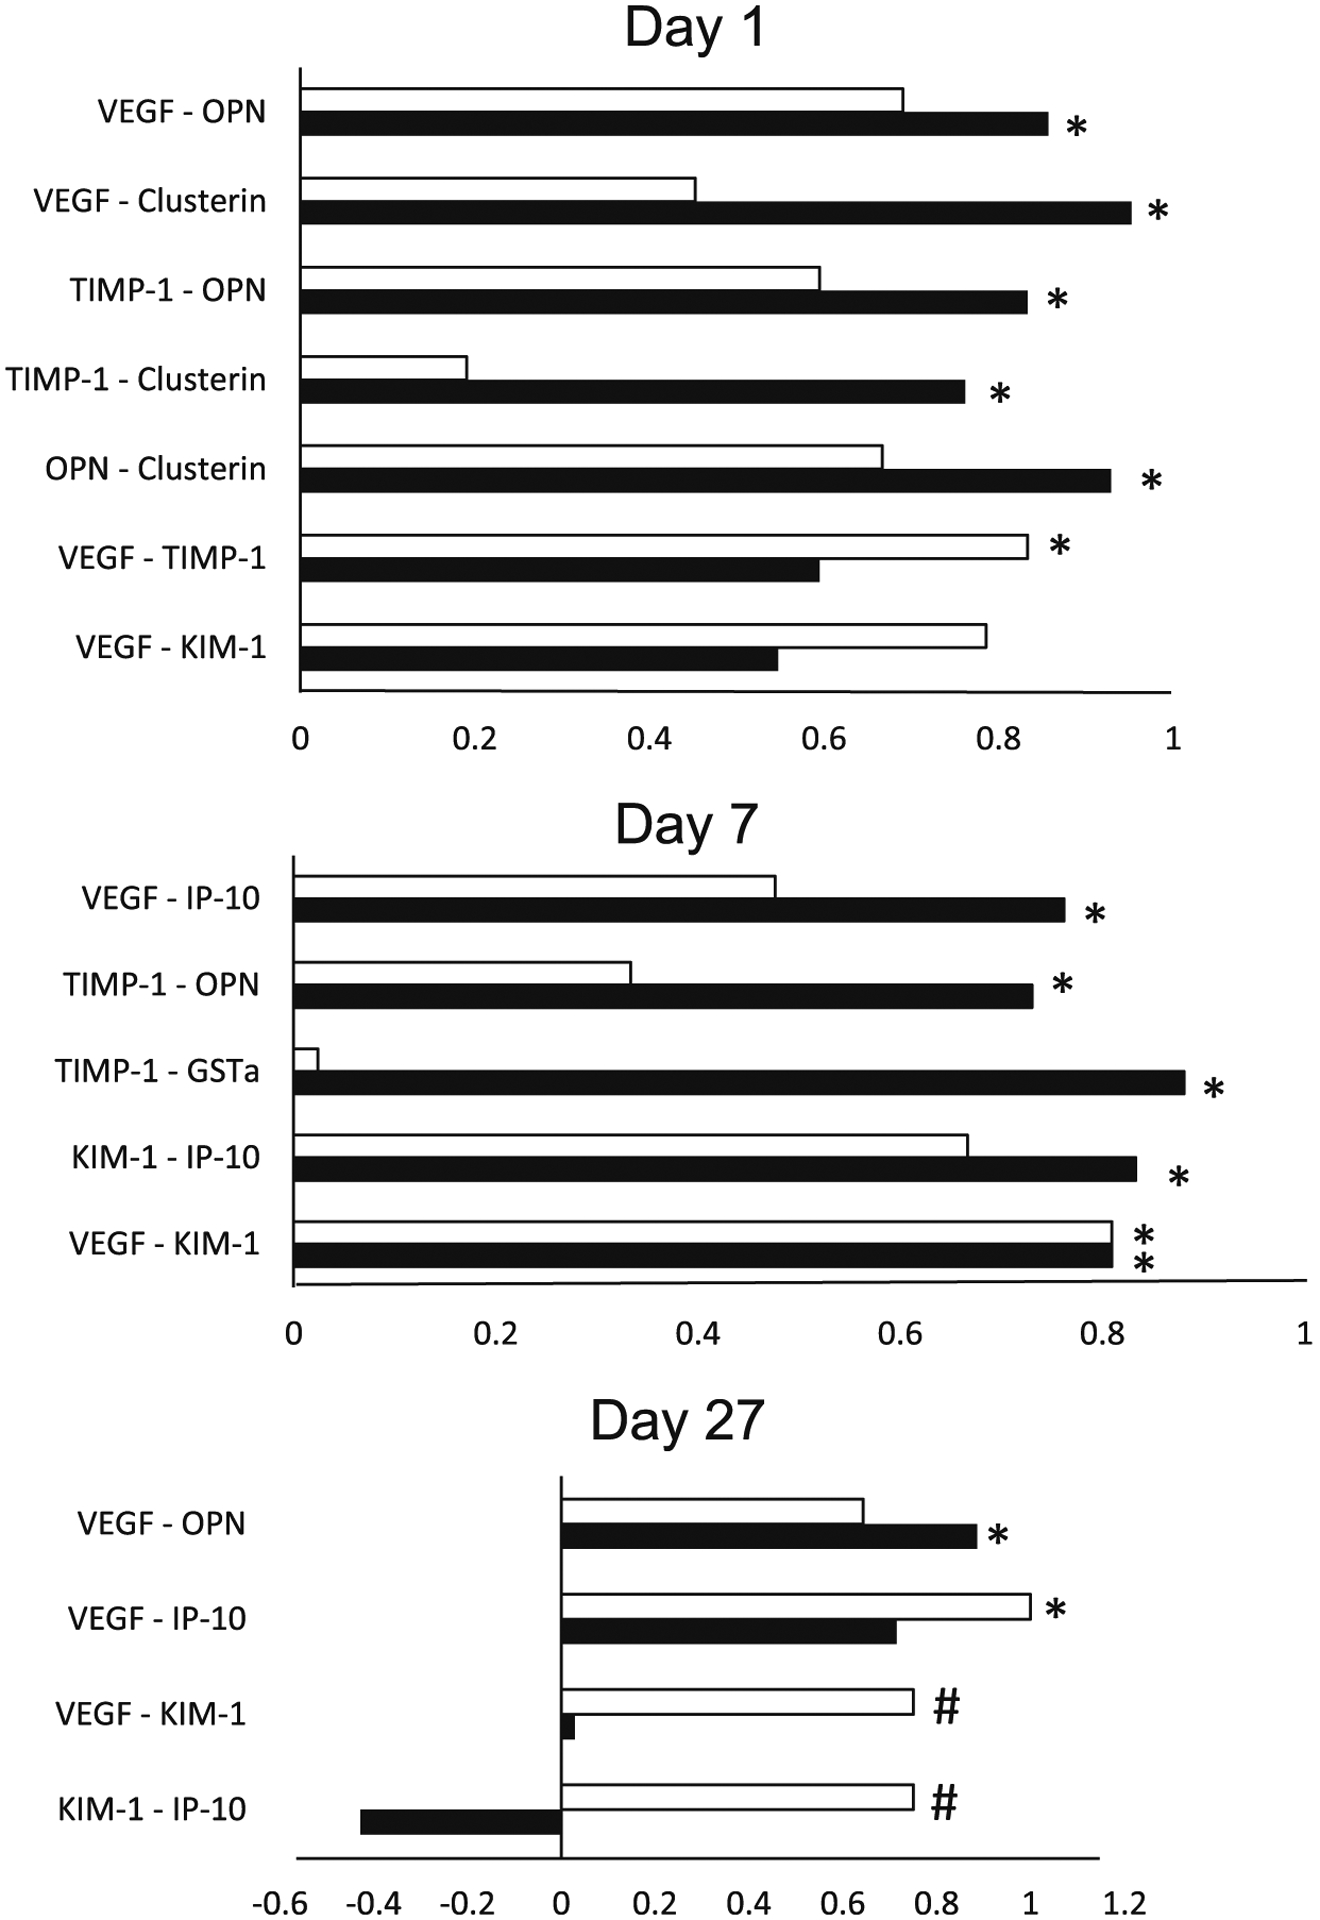
Correlations between various proteins measured in the kidneys of rats exposed to frack sand dust (FSD) 8. The white bars represent correlations between proteins in air exposed rats and the black bars represent correlations between proteins in the FSD 8-exposed rats. Abbreviations: vascular endothelial growth factor (VEGF), osteopontin gene (OPN), kidney injury molecule-1 (KIM-1), glutathione-S-transferase (GST)-α, IFN-γ-induced 10 (IP-10).
4. Discussion
The goal of the studies presented in this report was to examine the effects of FSD 8 inhalation on peripheral vascular and cardiac function. Changes in physiological estimates of peripheral vascular function, blood pressure and cardiac function suggest that the inhalation of FSD 8 results in acute changes in peripheral vascular responses to vasocon-stricting agents, and more prolonged changes in responsiveness to factors that potentially affect HR, HR variability, blood pressure, inflammation and oxidative stress.
Inhalation of FSD 8 at the doses and post-exposure time points studied had small effects on peripheral vascular function. The 10 mg/m3 FSD 8 exposure did induce an increased sensitivity of vasoconstriction responses to PE 1 and 7 d following the exposure but did not alter ACh-induced re-dilation. This increase in responsiveness occurred only at the highest doses of PE, suggesting that the effects of FSD 8 exposure on peripheral tail artery function were minimal. The effects of 10 mg/m3 FSD 8 were more pronounced in terms of NE-induced changes in blood pressure (Fig. 9). One day following FSD 8 exposure, there was a significant reduction in NE-induced increases in SBP and DBP. These findings are the opposite of what was seen with the microvessel preparation. This may be because PE, an α1-adrenoreceptor agonist, was used to induce constriction, whereas in the blood pressure studies (using the P–V-loop method), NE was used. NE activates α1-adrenoreceptors as well as other adrenoreceptors. It is possible that the predominant effect of FSD 8 exposure on peripheral arteries may not have been through an α1-adrenoreceptor-mediated mechanism, but, instead, through other adrenoceptors (e.g., α2 or β-adrenoreceptors), and this may have made the vascular smooth muscle less sensitive to the effects of PE (Philipp et al. 2002). The telemetry data did not reveal any significant effects of exposure to FSD 8 on blood pressure on day 1 following the exposure. During the time immediately following an exposure, changes in resting or basal measures of cardiovascular function often do not occur. However, if the system is challenged (e.g., exposure to a constricting or dilating agent, or exposure to an external stimulus that alters cardiovascular function), changes in responsiveness can often be detected (Krajnak et al. 2012, 2014). Thus, the telemetry results are not inconsistent with the P–V-loop and microvessel results because the measures were made under different physiological conditions. The effects of exposure to 10 mg/m3 FSD 8 were no longer apparent 7 and 27 d post-exposure.
Exposure to 10 mg/m3 FSD 8 resulted in a reduced responsiveness to dobutamine, a β1-adrenoreceptor agonist (Fig. 7). These results are consistent with the blood pressure results, suggesting that there is an acute effect of FSD 8 inhalation on cardiac and peripheral vascular function. By 7 d after the exposure, there were no effects of FSD 8 on cardiac function. However, at 27 d following exposure there were some effects on both cardiac output and stroke volume. No other measures of cardiac function were changed significantly at 27 d following exposure. Therefore, although the responsiveness to dobutamine was reduced at 27 d, it is not clear if this was due to the exposure, or just a spurious result. There were no significant differences in HR when measured by telemetry. As with the peripheral vascular data, changes in function were no longer apparent 7 d following FSD 8 exposure. The telemetry data did not identify any significant changes in HR after exposure to FSD 8. However, when individual beats were analyzed, there was a non-significant increase in RMSSD, which was primarily associated with a significant increase in the high frequency component of the signal (Fig. 5). This effect was no longer apparent at 7 and 27 d following the exposure, suggesting that FSD 8 inhalation did not induce long-term effects on beat-to-beat variability. HR was lower at 7 and 27 d following exposure than at 1 d in both air- and FSD 8-exposed rats. These reductions in HR may have been due to maturation of the rats.
Although arteries appeared to be less sensitive to PE after exposure to 30 mg/m3 FSD 8, there were no significant differences between the air- and FSD 8-exposed groups. These data are consistent with the PV-loop results obtained for NE-induced changes in blood pressure. On day 1 following exposure to 30 mg/m3 FSD 8, the ability of NE to increase blood pressure was reduced. Previous studies have demonstrated that inhalation of agents that lead to pulmonary inflammation also induce changes in peripheral vascular responses and increase the levels of markers of inflammation and oxidative stress in the peripheral vascular and cardiac tissues (Krajnak et al. 2011; Roberts et al. 2013). Other studies (Sager et al., 2020, 2020) found that inhalation of either 10 or 30 mg/m3 FSD 8 had very little effect on markers of pulmonary inflammation, and, in fact, the response to inhalation of the 10 mg/m3 dose was more pronounced that the response to the 30 mg/m3 exposure. Therefore, it is not necessarily surprising that there were few effects of FSD 8 exposure on cardiovascular function. Others have shown that the cardio/peripheral vascular system may be more responsive to the inhalation of toxic substances, and manifest effects even when pulmonary inflammation is minimal (Nurkiewicz et al. 2011; Knuckles et al. 2012; Hubbs et al. 2013). Exposure to nanoparticles and silica often induces an increase in the expression of inflammatory factors and reactive oxygen species, and this increase can have negative effects on cardiovascular function (Porter et al. 2015; Zelko et al. 2016; Sellamuthu et al. 2017). However, there was only a minimal increase in the expression of pro-inflammatory cytokines (IL-1β and IL-6) 1 d after exposure to 10 mg/m3. There were reductions in H2O2 concentrations in the heart on days 7 and 28. However these changes occurred in both the air- and FSD 8-exposed rats, suggesting that it may have been the result of maturation of the animals rather than the result of the exposure.
Examination of changes in SBP and DBP measured using the PV-loop method revealed that with exposure to both 10 and 30 mg/m3 FSD 8, there was reduced pressor responsiveness to NE on day 1 after the exposure, but these changes were not maintained (see Figs. 9 and 10). These results are the opposite of what was observed using the microvessel technique. These differences may have been due to two factors: first, PE acts on α1-adrenoreceptors. Although this receptor plays a major role in inducing vasoconstriction in most vascular beds, additional receptors also play a role (McGrath 2015; Michel and Balligand, 2017). It is possible that there was an increased sensitivity to PE at the level of the α1-adrenoreceptors, but when other adrenoceptors were acted upon by NE, they may have reduced vascular responsiveness, limiting the increases in SBP and DBP. Second, in the PV-loop studies, NE is administered in vivo and can act locally and at other tissues to regulate blood pressure. It is possible there was a reduced responsiveness to NE. Figs. 7 and 8 indicate that cardiac measures in response to dobutamine stimulation were reduced in FSD 8-exposed rats. If the cardiac tissue responded in a similar manner to NE, and there was a reduction in stroke volume and cardiac output, this may have led to the observed reductions in blood pressure.
Cardiovascular measures collected using telemetry did not reveal the robust changes recorded using the PV-loop method. There was an increase in RMSSD (a measure of beat to beat variability) in rats exposed to 10 and 30 mg/m3 FSD 8 on day 1 following the exposure. These changes were not statistically significant because of variability and were not associated with changes in blood pressure in the same animals. The increase in RMSSD in the 10 mg/m3 group was associated with an increase in the HF component of HR. Changes in the high frequency component may be indicative of an imbalance or change between sympathetic and parasympathetic neural input to the heart (Kan et al. 2014; Zheng et al. 2016). Disruption of autonomic input has been shown to be an early indicator of long-term cardiovascular dysfunction (Cauley et al. 2015; Hering et al. 2015; Zheng et al. 2016; Shutt et al. 2017).
Proteins measured in the heart using the vascular array were not significantly affected by exposure to 30 mg/m3 FSD 8 (Table 1). However, when relative changes in individual proteins were correlated with changes in other proteins, significant correlations were found in both air- and FSD 8-exposed rats. Correlations between proteins in air-exposed rats are most likely the result of changes due to normal cardiac function and growth and maturation over the days of the experiment. In FSD 8-exposed rats, some of the correlations between proteins were the same as those seen in air-exposed rats. However, there were other significant correlations between proteins that may have been indicative of injury. For example, on day 1, there were significant correlations between IL-6, CAV1, TIMP-1 and MCP1 in FSD 8-exposed rats. On days 7 and 27 there were correlations between changes in CTGF, Gro, IL6, MCP1, TIMP1 and tPAI. These proteins are involved in regulating vascular oxidative stress and vascular remodeling. The correlations between these proteins are consistent with other studies showing that inhalation of toxins results in changes in vascular proteins that affect cardiovascular and physiological functions that are known to play a role in vascular remodeling and cellular changes in the cardiovascular system (Park et al. 2014).
Exposure to 30 mg/m3 resulted in significant reductions in IP-10, OPN and VEGF in the kidneys 7 d after exposure and in GSTα 27 d after exposure (Table 2). These proteins are usually increased in response to injury, and are indicative of inflammation, oxidative stress, and may play a role in remodeling. Therefore, it was surprising that there was a reduction in these proteins in FSD 8-exposed rats. The reduction in VEGF suggests that exposure to FSD 8 may have induced a reduction in blood flow to the kidneys. The changes in these proteins may be a delayed response to the reduction in blood pressure and HR that occurred immediately following the exposure.
When correlations between relative changes in all proteins were assessed, the majority of the proteins that were correlated with other proteins were those that are involved in mediating oxidative stress responses and vascular remodeling (Fuernau et al. 2015; Panduru et al., 2015). However, if concentrations of these proteins were to continue to increase, or the increases were maintained, such changes may lead to fibrosis in renal tissue. Changes in the KIM-1 protein were correlated to changes in several other proteins in both air- and FSD 8-exposed animals. In humans, this protein has been measured in the urine and the blood and increases in KIM-1 have been found in conjunction with kidney dysfunction caused by cardiac failure or type II diabetes (Nielsen et al. 2012; Fuernau et al. 2015). In the current study, KIM-1 was detectable in kidneys of both air-exposed and FSD 8-treated rats. Although there appeared to be a reduction in KIM-1 protein concentrations in the kidney 7 and 27 d after exposure, these differences were not significant. Changes in KIM-1 protein concentrations were correlated with changes in IP-10 and VEGF, which are involved in vascular remodeling. The correlations between changes in these proteins was significant in both air- and FSD 8-exposed rats. Because KIM-1 has also been implicated in guiding mesenchymal stem cell migration (Park et al. 2014), it is possible that the associated changes in the expression of these proteins may be the result of normal development and growth of the kidney in FSD 8-treated rats on the first day after exposure. There were also correlations between clusterin-OPN, clusterin-TIMP-1 and clusterin-VEGF. Clusterin and OPN are increased during inflammation and are involved in regulating inflammatory responses, specifically by altering binding of immune cells to the cellular membrane of tissue (Ferreira et al. 2009). Thus, the positive correlations between these proteins in the kidney are most likely the result of a response to a systemic inflammation that occurred as a result of exposure to FSD 8 that, in turn, affected electrolyte balance and water excretion and retention. These changes may have contributed to the change in blood pressure that occurred at this time. Seven d after exposure, there was a significant correlation between changes in VEGF and KIM-1. These findings are consistent with the findings from 1 d post-exposure rats and suggest that the correlation between these two proteins may be involved in normal kidney function and development due to growth. There were significant correlations between changes in VEGF-IP-10 and VEGF-KIM-1 in FSD 8-treated rats. There were also positive correlations between TIMP-1-OPN, TIMP-1-GSTα, and KIM-1-IP-10. Although the correlations with KIM-1 are likely involved in regulating normal kidney function and growth in exposed rats, the correlations with the other proteins are indicative of inflammation, and the correlation with GSTα suggests that inflammation was associated with an increase in oxidative stress. These findings, as those from day 1, suggest that exposure to FSD 8 induces inflammatory responses in the kidney. On day 27, rats exposed to air displayed significant positive correlations between VEGF-IP-10, VEGF-KIM-1 and KIM-1-IP-10. Similar to 1 and 7 d post-exposure results, these findings were most likely the result of growth and maintenance of normal kidney function in these animals. Interestingly, there was a negative (but not significant) correlation between KIM-1 and IP-10 in FSD 8-treated rats. The association between these two proteins suggests that there may be a progression towards kidney injury in rats exposed to FSD 8, because, as mentioned above, reductions in KIM-1 protein are a marker of kidney injury.
The overall results of these studies demonstrate that there are subtle effects of exposure to FSD 8 on the cardiovascular system. The changes that were induced by exposure to FSD 8, particularly at the 30 mg/m3 dose, result in changes in peripheral vascular, renal and heart function. The findings of this study are consistent with other studies demonstrating that inhalation of respiratory irritants or toxins results in inflammation which, in turn, has been shown to have effects on cardiovascular function in animal models (Knuckles et al. 2012; Hubbs et al. 2013; Mercer et al. 2013). These effects may be the result of the direct effects of frack dust (or particles) on cardiac, renal or pulmonary tissue (Hubbs et al. 2013; Mercer et al. 2013) or due to inflammation of pulmonary tissue which then spreads to other tissues to induce inflammation and oxidative stress in peripheral tissues (Knuckles et al. 2012). The observed changes in protein levels in the kidney and heart suggest that, with additional exposures, these tissues may develop fibrosis. This is consistent with the changes that have been reported for humans exposed to respirable silica (Pozzolini et al. 2016; Zelko et al. 2016; Sellamuthu et al. 2017).
Acknowledgements
Funding was provided by the National Institute for Occupational Safety and Health, Project Number 7927ZLDC.
Footnotes
Publisher's Disclaimer: Disclaimer
The findings and conclusions in this report are those of the authors and do not necessarily represent the views of the National Institute for Occupational Safety and Health. Mention of brand name does not constitute product endorsement.
Declaration of Competing Interest
The authors declare that they have no conflicts of interest in relation to this publication.
References
- Anderson SE, Shane H, Long C, Marrocco A, Lukomska E, Roberts JR, Marshall N, Fedan JS, 2020. Biological effects of inhaled hydraulic fracturing sand dust. VIII. Immunotoxicity. Toxicol. Appl. Pharmacol (Manuscript submitted to this journal as a tandem paper to accompany this manuscript.). [DOI] [PMC free article] [PubMed] [Google Scholar]
- Cauley E, Wang X, Dyavanapalli J, Sun K, Garrott K, Kuzmiak-Glancy S, Kay MW, Mendelowitz D, 2015. Neurotransmission to parasympathetic cardiac vagal neurons in the brain stem is altered with left ventricular hypertrophy-induced heart failure. Am. J. Physiol. Heart Circ. Physiol 309, H1281–H1287. [DOI] [PMC free article] [PubMed] [Google Scholar]
- Esswein E, Kiefer M, Snawder J, Breitenstein M, 2012. Worker exposure to crystalline silica during hydraulic fracturing. In: NIOSH/CDC. NIOSH Science Blog. http://blogs.cdc.gov/niosh-science-blog/2012/05/23/silica-fracking. [DOI] [PubMed] [Google Scholar]
- Esswein EJ, Breitenstein M, Snawder J, Kiefer M, Sieber WK, 2013. Occupational exposures to respirable crystalline silica during hydraulic fracturing. J. Occup. Environ. Hyg 10, 347–356. [DOI] [PubMed] [Google Scholar]
- Fedan JS, 2020. Biological effects of inhaled hydraulic fracturing sand dust. I. Scope of the investigation. Toxicol. Appl. Pharmacol (Manuscript submitted to this journal as a tandem paper to accompany this manuscript.). [DOI] [PMC free article] [PubMed] [Google Scholar]
- Fedan JS, Roberts JR, Barger M, Snawder JE, Schwegler-Berry D, Friend S, Leonard SS, Thompson JA, Jackson MC, Dozier AK, Coyle J, Kashon ML, Park J−H, McKinney W, 2020. Biological effects of inhaled hydraulic fracturing sand dust. II. Inhalation exposure system, particle characterization, and effects following intratracheal instillation. Toxicol. Appl. Pharmacol (Manuscript submitted to this journal as a tandem paper to accompany this manuscript.). [DOI] [PMC free article] [PubMed] [Google Scholar]
- Ferreira VP, Herbert AP, Cortes C, McKee KA, Blaum BS, Esswein ST, Uhrin D, Barlow PN, Pangburn MK, Kavanagh D, 2009. The binding of factor H to a complex of physiological polyanions and C3b on cells is impaired in atypical hemolytic uremic syndrome. J. Immunol 182, 7009–7018. [DOI] [PMC free article] [PubMed] [Google Scholar]
- Fuernau G, Poenisch C, Eitel I, Denks D, de Waha S, Poss J, Heine GH, Desch S, Schuler G, Adams V, Werdan K, Zeymer U, Thiele H, 2015. Prognostic impact of established and novel renal function biomarkers in myocardial infarction with cardiogenic shock: a biomarker substudy of the IABP-SHOCK II-trial. Int. J. Cardiol 191, 159–166. [DOI] [PubMed] [Google Scholar]
- Hering D, Lachowska K, Schlaich M, 2015. Role of the sympathetic nervous system in stress-mediated cardiovascular disease. Curr. Hypertens. Rep 17, 80. [DOI] [PubMed] [Google Scholar]
- Hubbs AF, Sargent LM, Porter DW, Sager TM, Chen BT, Frazer DG, Castranova V, Sriram K, Nurkiewicz TR, Reynolds SH, Battelli LA, Schwegler-Berry D, McKinney W, Fluharty KL, Mercer RR, 2013. Nanotechnology: toxicologic pathology. Toxicol. Pathol 41, 395–409. [DOI] [PMC free article] [PubMed] [Google Scholar]
- Kan H, Wu Z, Lin YC, Chen TH, Cumpston JL, Kashon ML, Leonard S, Munson AE, Castranova V, 2014. The role of nodose ganglia in the regulation of cardiovascular function following pulmonary exposure to ultrafine titanium dioxide. Nanotoxicology 8, 447–454. [DOI] [PMC free article] [PubMed] [Google Scholar]
- Knuckles TL, Yi J, Frazer DG, Leonard HD, Chen BT, Castranova V, Nurkiewicz TR, 2012. Nanoparticle inhalation alters systemic arteriolar vasoreactivity through sympathetic and cyclooxygenase-mediated pathways. Nanotoxicology 6, 724–735. [DOI] [PMC free article] [PubMed] [Google Scholar]
- Krajnak K, Waugh S, Johnson C, Miller R, Kiedrowski M, 2009. Vibration disrupts vascular function in a model of metabolic syndrome. Ind. Health 47, 533–542. [DOI] [PubMed] [Google Scholar]
- Krajnak K, Kan H, Waugh S, Miller GR, Johnson C, Roberts JR, Goldsmith WT, Jackson M, McKinney W, Frazer D, Kashon ML, Castranova V, 2011. Acute effects of COREXIT EC9500A on cardiovascular functions in rats. J Toxicol. Environ. Health A 74, 1397–1404. [DOI] [PubMed] [Google Scholar]
- Krajnak K, Riley DA, Wu J, McDowell T, Welcome DE, Xu XS, Dong RG, 2012. Frequency-dependent effects of vibration on physiological systems: experiments with animals and other human surrogates. Ind. Health 50, 343–353. [DOI] [PMC free article] [PubMed] [Google Scholar]
- Krajnak K, Waugh S, Miller GR, Johnson C, 2014. Recovery of vascular function after exposure to a single bout of segmental vibration. J Toxicol. Environ. Health A 77, 1061–1069. [DOI] [PMC free article] [PubMed] [Google Scholar]
- Sriram K, Lin GX, Jefferson AM, McKinney W, Jackson MC, Cumpston A, Cumpston JL, Cumpston JB, Leonard HD, Kashon ML, Fedan JS, 2020. Biological effects of inhaled hydraulic fracturing sand dust. VII. Neuroinflammation and altered synaptic protein expression. Toxicol. Appl. Pharmacol (Manuscript submitted to this journal as a tandem paper to accompany this manuscript.). [DOI] [PMC free article] [PubMed] [Google Scholar]
- McGrath JC, 2015. Localization of α-adrenoceptors. Brit. J. Pharmacol 172, 1179–1194. [DOI] [PMC free article] [PubMed] [Google Scholar]
- Mercer RR, Scabilloni JF, Hubbs AF, Wang L, Battelli LA, McKinney W, Castranova V, Porter DW, 2013. Extrapulmonary transport of MWCNT following inhalation exposure. Part. Fibre Toxicol 10, 38. [DOI] [PMC free article] [PubMed] [Google Scholar]
- Michel LY, Balligand JL, 2017. New and emerging therapies and targets: β−3 agonists. Handb. Exp. Pharmacol 243, 205–223. [DOI] [PubMed] [Google Scholar]
- Nielsen SE, Reinhard H, Zdunek D, Hess G, Gutierrez OM, Wolf M, Parving HH, Jacobsen PK, Rossing P, 2012. Tubular markers are associated with decline in kidney function in proteinuric type 2 diabetic patients. Diabetes Res. Clin. Pract 97, 71–76. [DOI] [PubMed] [Google Scholar]
- Nurkiewicz TR, Porter DW, Hubbs AF, Stone S, Moseley AM, Cumpston JL, Goodwill AG, Frisbee SJ, Perrotta PL, Brock RW, Frisbee JC, Boegehold MA, Frazer DG, Chen BT, Castranova V, Committee HHR, 2011. Pulmonary particulate matter and systemic microvascular dysfunction. Res. Rep. Health Eff. Inst 164, 3–48. [PubMed] [Google Scholar]
- Olgun NS, Morris AM, Stefaniak AB, Bowers LN, Knepp AK, Duling MG, Mercer RR, Kashon ML, Fedan JS, Leonard SS, 2020. Biological effects of inhaled hydraulic fracturing sand dust. III. Evaluation of the cytotoxicity and pro-inflammatory responses caused in murine macrophage cells. Toxicol. Appl. Pharmacol (Manuscript submitted to this journal as a tandem paper to accompany this manuscript.). [DOI] [PMC free article] [PubMed] [Google Scholar]
- Panduru NM, Sandholm N, Forsblom C, Saraheimo M, Dahlstrom EH, Thorn LM, Gordin D, Tolonen N, Waden J, Harjutsalo V, Bierhaus A, Humpert PM, Groop PH, FinnDiane Study G, 2015. Kidney injury molecule-1 and the loss of kidney function in diabetic nephropathy: a likely causal link in patients with type 1 diabetes. Diabetes Care 38, 1130–1137. [DOI] [PubMed] [Google Scholar]
- Park KM, Nam HS, Teotia PK, Hussein KH, Hong SH, Yun JI, Woo HM, 2014. Kidney injury molecule-1 is involved in the chemotactic migration of mesenchymal stem cells. In Vitro Cell. Dev. Biol. Anim 50, 648–655. [DOI] [PubMed] [Google Scholar]
- Philipp M, Brede M, Hein L, 2002. Physiological significance of α2-adrenrgic receptor subtype diversity: one receptor is not enough. Am. J. Physiol. Reg. Integr. Comp. Physiol 283, R287–R295. [DOI] [PubMed] [Google Scholar]
- Porter KL, Green FH, Harley RA, Vallyathan V, Castranova V, Waldron NR, Leonard SS, Nelson DE, Lewis JA, Jackson DA, 2015. Evaluation of the pulmonary toxicity of ambient particulate matter from camp victory, Iraq. J Toxicol. Environ. Health A 78, 1385–1408. [DOI] [PMC free article] [PubMed] [Google Scholar]
- Pozzolini M, Vergani L, Ragazzoni M, Delpiano L, Grasselli E, Voci A, Giovine M, Scarfi S, 2016. Different reactivity of primary fibroblasts and endothelial cells towards crystalline silica: a surface radical matter. Toxicology 361–362, 12–23. [DOI] [PubMed] [Google Scholar]
- Roberts JR, McKinney W, Kan H, Krajnak K, Frazer DG, Thomas TA, Waugh S, Kenyon A, MacCuspie RI, Hackley VA, Castranova V, 2013. Pulmonary and cardiovascular responses of rats to inhalation of silver nanoparticles. J Toxicol. Environ. Health A 76, 651–668. [DOI] [PubMed] [Google Scholar]
- Russ KA, Thompson JA, Reynolds JS, Mercer RR, Porter DW, McKinney W, Dey RD, Barger M, Cumpston J, Batchelor TP, Kashon ML, Kodali V, Sriram K, Fedan JS, 2020. Biological effects of inhaled hydraulic fracturing sand dust. IV. Pulmonary effects. Toxicol. Appl. Pharmacol (Manuscript submitted to this journal as a tandem paper to accompany this manuscript.). [DOI] [PMC free article] [PubMed] [Google Scholar]
- Sager TM, Roberts JR, Umbright CM, Barger M, Kashon ML, Fedan JS, Joseph P, 2020. Biological effects of inhaled hydraulic fracturing sand dust. V. Pulmonary inflammatory, cytotoxic and oxidant effects. Toxicol. Appl. Pharmacol (Manuscript submitted to this journal as a tandem paper to accompany this manuscript.). [DOI] [PMC free article] [PubMed] [Google Scholar]
- Sellamuthu R, Umbright C, Roberts JR, Young SH, Richardson D, McKinney W, Chen BT, Li S, Kashon M, Joseph P, 2017. Molecular mechanisms of pulmonary response progression in crystalline silica exposed rats. Inhal. Toxicol 29, 53–64. [DOI] [PubMed] [Google Scholar]
- Shutt RH, Kauri LM, Weichenthal S, Kumarathasan P, Vincent R, Thomson EM, Liu L, Mahmud M, Cakmak S, Dales R, 2017. Exposure to air pollution near a steel plant is associated with reduced HR variability: a randomised crossover study. Environ. Health 16, 4. [DOI] [PMC free article] [PubMed] [Google Scholar]
- Investigative Team, 2020. Biological effects of inhaled hydraulic fracturing sand dust. IX. Summary and significance. Toxicol. Appl. Pharmacol (Manuscript submitted to this journal as a tandem paper to accompany this manuscript.). [DOI] [PMC free article] [PubMed] [Google Scholar]
- Zelko IN, Zhu J, Ritzenthaler JD, Roman J, 2016. Pulmonary hypertension and vascular remodeling in mice exposed to crystalline silica. Respir. Res 17, 160. [DOI] [PMC free article] [PubMed] [Google Scholar]
- Zheng W, McKinney W, Kashon M, Salmen R, Castranova V, Kan H, 2016. The influence of inhaled multi-walled carbon nanotubes on the autonomic nervous system. Part. Fibre Toxicol 13, 8. [DOI] [PMC free article] [PubMed] [Google Scholar]


