

Abstract
Neuronal hyperexcitability has emerged as a potential biomarker of late-onset early-stage Alzheimer’s disease (LEAD). We hypothesize that the aging-related posterior cortical hyperexcitability anticipates the loss of excitability with the emergence of impairment in LEAD. To test this hypothesis, we compared the behavioral and neurophysiological responses of young and older (ON) normal adults, and LEAD patients during a visuospatial attentional control task. ONs show frontal cortical signal incoherence and posterior cortical hyper-responsiveness with preserved attentional control. LEADs lose the posterior hyper-responsiveness and fail in the attentional task. Our findings suggest that signal incoherence and cortical hyper-responsiveness in aging may contribute to the development of functional impairment in LEAD.
Keywords: aging, Alzheimer’s, excitability, ERPs, vision
Introduction
Visual deficits are common in Alzheimer’s disease (AD) (Fujimori et al. 1997; Rizzo et al. 2000) and disabling in many patients (Benson et al. 1988; Tetewsky et al. 1999; Mendez et al. 2002) due to ambulatory and vehicular navigational impairment (O'Brien et al. 2001; Kavcic et al. 2003). The integration of frontal and posterior contributions to visual behavior (Critchley 1953; Lynch et al. 1977) is seen in animal neurophysiology (Moore et al. 2004) (Cosman et al. 2015) and human neuroimaging (Kincade et al. 2005; Migliaccio et al. 2012). Such studies suggest that visual impairments in LEAD may reflect fronto-posterior functional disconnection (Hof et al. 1990; Brier et al. 2014).
Cognitive event-related potentials (ERPs) (Chapman 1964; Sutton et al. 1965) link frontal and posterior activity to function and functional impairment, providing a window into the neural mechanisms of processing deficits in LEAD. Visual ERPs include waveforms that reveal the dynamics of reciprocal sensory–cognitive interactions related to signal integration (Woodman et al. 1999): The N200 reflects posterior cortical visual processing (Naatanen et al. 1982). During an attentional task, the N200 is followed by a smaller, more posterior contralateral waveform (N2PC) that reflects the allocation of visual attention (Luck et al. 1994). The N200 and N2PC complex is then followed by a P300 that is related to the neural implementation of the behavioral task (Polich 2007). The P300 is often seen to contain frontal P3a and parietal P3b subcomponents (Bledowski et al. 2004; Tsolaki et al. 2017).
Single neuron studies in awake monkeys show that the radial motion in optic flow is processed in dorsal posterior cortex where it is under attentional control (Page and Duffy 2003; Dubin and Duffy 2009) when the observer is focusing on self-movement heading perception (Page and Duffy 2008), typically to guide steering behavior (Jacob and Duffy 2015). Parallel human ERP studies show response latency delays in aging and response amplitude reductions in LEAD (Monacelli et al. 2003; Fernandez et al. 2013), the latter linked to impaired optic flow heading perception (Fernandez et al. 2007; Fernandez and Duffy 2012).
We previously used a well-established attentional control paradigm (Posner 1980; Fig. 1A) to assess the effects of aging and LEAD on the spatial attentional control (Klein 2000) of the cortical visual motion processing of optic flow. Those studies showed the loss the attentional control of optic flow responses in LEADs (Lockwood et al. 2018). Here, we explore links between higher order attributes of ERPs and behavioral changes in aging and LEAD. We find ERP evidence of incoherent hyper-responsiveness in aging that may lead to nonresponsiveness and behavioral impairment in LEAD.
Figure 1 .
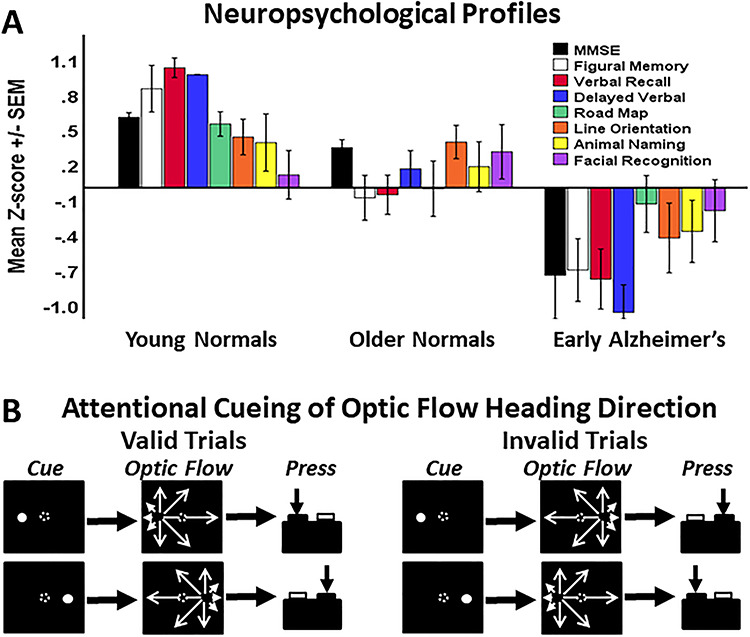
Neuropsychological profiles of participant groups and the optic flow attentional cueing paradigm. (A) Z-transformed average test scores from the three participant groups and eight neuropsychological tests. Significant group difference was seen for all tests except facial recognition. (B) The attentional cueing paradigm began with the presentation of a centered fixation target. When stable visual fixation was established for 1 s, a full-screen random dot motion was added, followed 200 ms later by a briefly flashed left or right side attentional cue. After either a 300 or 600 ms SOA, the random dot motion was replaced by optic flow with a left or right side FOE. This created validly cued trials in which the cue and FOE occurred at the same location, and invalidly trials in which the cue and the FOE were on opposite sides of the screen. Participants were asked to press the one of two buttons corresponding to the side of the FOE.
Materials and Methods
Participant Groups
All participants were recruited from the University of Rochester programs. Young normal (YN) adults were from the undergraduate student body, older normal (ON) adults were patients’ friends or relatives. LEADs were patients from the Memory Care Program at the University of Rochester Medical Center. Informed consent was obtained prior to enrollment. All procedures were approved by the University of Rochester, Research Subjects Review Board.
All participants had normal visual acuity (better eye Snellen acuity of at least 20/40) and contrast sensitivity (five spatial frequencies, 0.5–18 cycles/degree, VisTech Consultants, Inc.) in the normal range. All LEADs were diagnosed within 2 years of these studies. LEAD patients met criteria for early stage (Mini-Mental State Examination, MMSE > 21), late-onset (age > 65 years), probable AD and demonstrated impairments including memory disorders, with aphasia, agnosia, apraxia, inattention, disorganization, or executive dysfunction affecting their daily activities (McKhann et al. 2001; Reiman and Manske 2011).
Participant group differences were identified across age and neuropsychological test scores using a two-way multivariate analysis of variance (MANOVA; P < 0.05) across groups and tests, followed by the specification of the sources of group differences using Tukey’s test for Honestly Significant Differences (THSDs; P < 0.05). YNs were significantly younger (n = 18, age [mean ± SEM] = 23.1 ± 1.2) than the ONs (n = 19, age = 71.2 ± 1.4) and LEADs (n = 18, age = 73.3 ± 1.6). Neuropsychological testing was consistent with group membership: MMSE for multidomain function (Folstein et al. 1975) (YN = 29.7 ± 0.2, ON = 29.0 ± 0.2, LEAD = 24.8 ± 0.9; P < 0.001, THSDs: YN = ON > LEAD). The WMS-Revised (WMS-R) (Wechsler 1987) verbal paired associates, immediate recall (YN = 22.1 ± 0.4, ON = 15.8 ± 1.0, LEAD = 11.4 ± 1.2; P < 0.001, THSDs: YN > ON > LEAD) and delayed recall (YN = 8.0 ± 0.0, ON = 6.3 ± 0.3, LEAD = 3.8 ± 0.5; P < 0.001, THSDs: YN > ON > LEAD). Animal naming fluency (YN = 22.2 ± 1.4, ON = 20.8 ± 1.4, LEAD = 16.7 ± 1.5; P = 0.032, THSDs: YN > LEAD). Line orientation judgment (YN = 26.8 ± 0.7, ON = 26.6 ± 0.7, LEAD = 20.9 ± 1.4; P < 0.001, THSDs: YN = ON > LEAD) (Benton et al. 1983). Money Road Map testing of spatial orientation by route tracing (Money 1976) (YN = 31.0 ± 0.4, ON = 28.8 ± 0.9, LEAD = 27.4 ± 1.0; P = 0.033, THSDs: YN > LEAD). The WMS-R figural memory (YN = 8.4 ± 0.4, ON = 6.4 ± 0.4, LEAD = 5.3 ± 0.4; P < 0.001, THSDs: YN > ON = LEAD) and face memory (YN = 46.5 ± 0.9, ON = 47.5 ± 1.1, LEAD = 44.6 ± 1.3; ANOVA nonsignificant). Average scores highlight the group differences and its variation across the domains tested (Fig. 1A).
Spatial Cueing Paradigm
Participants sat facing a 60° × 40° rear-projection tangent screen having a 10° centered fixation target with eye position monitored by infrared oculography (IOG, Applied Science Labs, Inc.). After 1 ± 0.2 s, a full-field random motion pattern of 1000 four-pixel dots was presented. After 200 ms, a cue spot (2° 16 dot cluster) was added for 100 ms, randomly positioned 22.5° to the left or right on the horizontal meridian. Random dot motion continued for a randomly selected 300 or 600 ms after which the moving dots converted into an outward radial optic flow field with a randomly selected left or right (22.5°) focus of expansion (FOE). The interval between cue and optic flow onset produced a stimulus onset asynchrony (SOA) of either 400 or 700 ms (Fig. 1B).
The optic flow stimuli were composed of dots moving in a radial pattern. Each dot’s speed was a sin2 function of its angular distance from the FOE. Dot density was maintained in all frames using a random replacement algorithm. Random motion resumed for up to 2 s until the participant pressed a left or right side button to indicate their perceived side of the FOE. In 75% of trials, the flashed pre-cues were valid (i.e., on the same side as the subsequent optic flow’s FOE); in 25%, they were invalid (i.e., on the opposite side). All participants completed a practice session of ~50 trials. IOG was used to monitor the centered fixation that was maintained throughout all trials.
Neurophysiological Analyses
Electroencephalography (EEG) was recorded using a 32-channel system (Compumedics) with sampling at 500 Hz and 32-bit resolution. Electrodes were aligned to the international 10–20 system, with 13 additional electrodes in proportionately sized electrode caps and impedances <5 kΩ. Continuous data records were imported into MATLAB with low- (100 Hz) and high-pass (0.1 Hz) filtering. Independent components (ICs) were derived in EEGLAB to remove cardiac, muscular, and ocular artifacts.
Neurophysiological analyses were based on trials yielding correct push-button responses. Data from each recording session were divided into 1 s epochs beginning 100 ms before optic flow onset. Average responses were computed for participant groups and task conditions. N200 ERPs were identified as the first major negative deflection peaking 150–200 ms after optic flow onset. N2VI ERPs were identified as a difference between validly and invalidly cued responses in the interval between the N200 and P300. P300 ERPs were identified as the positive deflection peaking between 300 and 500 ms after optic flow onset. We measured latencies and amplitudes of the N200 and P300 in each participant for each of the eight task conditions.
Time-frequency analyses were done over a 700 ms period (−100 to 600 ms) and frequencies from 4 to 40 Hz. Response spectra of event-related spectral perturbation (ERSP) and intertrial phase coherence (ITC) were derived in EEGLAB from sinusoidal wavelets calculated with increasing wavelet cycle/Hz across times and frequencies (Makeig et al. 2004). ERSP measured power changes in mean log power, relative to the 100 ms period before stimulus onset. ITC (a.k.a., phase-locking) measures the phase consistency at each time/frequency point across trials on a scale from 0 to 1, where 1 represents identical phase coherence across trials. Spectral analyses focused on time windows reflecting the timing of the N200 and P300 waveforms in each participant group and stimulus/task condition (Makeig 2002; Makeig et al. 2002; Roach and Mathalon 2008).
Independent Component Analysis
We used independent component analysis (ICA) to identify signals imbedded in the continuous neurophysiological data record from all participant groups and paradigm conditions (Groppe et al. 2009). ICA enabled the filtering-out of signals contaminating the neurophysiological record, such as extraneous electrical sources (e.g., power lines) and extraneous physiological sources (e.g., heart, eyes, and muscles). Thereafter, we used ICA to identify independent neural sources in the filtered, continuous neurophysiological data record.
ICA relies on conditioning the data record and identifying putatively IC waveforms. This algorithm begins with principal components analysis and then quantifies component independence by their non-Gaussianity measured as kurtosis and differential entropy. ICA produces the same number of ICs as the original number of EEG leads. Each IC is back-projected on to the cranial recording montage to show the strength of each IC across electrodes on the head.
We use the descending order of the relative contributions of each IC to present the components’ cranial topologies, and their ERPs to illustrate their link to the onset of the task-related optic flow stimuli. The topology is an attribute of each component and is the same for all groups and conditions. ERPs differed across groups and conditions and are presented for each. Each component was processed for its ITC phase spectra and ERSP power spectra as described above for the original data signals. We rejected components from non-neural signals (e.g., blinks, eye movement, and cranial musculature) and combined those reflecting the same neural sources.
Statistical Analysis
The neuropsychological test scores were Z-transformed for each test across the three participant groups. We used MANOVA (P < 0.05) with comparisons between the three participant groups and the experimental conditions using follow-up THSDs (P < 0.05) in SPSS, v25 (IBM). This approach was applied to the behavioral, neuropsychological, and both the recorded neurophysiological signals, ICs, and response spectra.
Results
Attentional ERPs
All participant groups perform well in the attentional task with the exception of a subset of five LEADs who show a lower percentage of correct trials and were excluded (xEADs) from further analysis (correct trials: YN = 97%, ON = 95%, LEAD = 81%, xEAD = 61%, Fig. 2A). Response times (RTs) increase across participant groups (F2, 439 = 157.44, P < 0.001. THSDs: YN < ON < LEAD) with longer RTs after invalid pre-cues (F1, 439 = 16.48, P < 0.001), especially in short SOA trials (F1, 439 = 10.89, P = 0.001) without group-by-SOA interactions (Fig. 2B). This yields a validity effect (VE) calculated by subtracting participant mean RTs from validly cued trials from mean RTs from invalidly cued trials. Substantial VE is evident in YNs and ONs but not seen in LEADs, (F2, 109 = 8.86, P < 0.001, THSDs: YN = ON > LEAD) without SOA or interaction effects (Fig. 2C). Thus, aging and LEAD are associated with successively slower RTs, but only the LEADs lose the attentional cueing VE of faster push-button responses after validly cued trials than after invalidly cued trials.
Figure 2 .
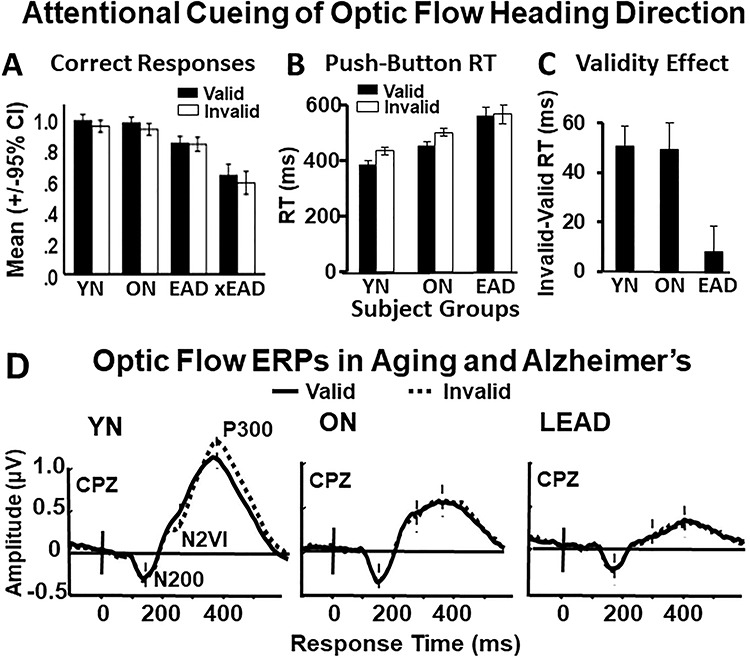
Behavioral and neurophysiological responses across groups. (A) Percent correct-side responses (ordinate, mean ± 95% CI) by participant group and stimulus condition (abscissa). The xEAD group represents five LEAD subjects omitted from later analysis due to their inability to complete the task. (B) Button press RTs (ordinate: RT, median ± SEM) by participant group and stimulus condition (abscissa) shows slowing in ONs and LEADs. (C) Validity effect (ordinate: VE, valid minus invalid RTs) by participant group. VE is all but lost in LEADs. (D) ERP traces from CPz for valid and invalid trials show N200s are largest in ONs, and both N2VIs and P300s are largest in YNs. Solid vertical lines marks optic flow onset, dashed vertical lines indicate peak latency for each waveform for each group as labeled for YNs on the left.
The optic flow heading discrimination task evokes three successive ERP waveforms that are most distinct at the central parietal zenith (CPz) electrode: N200s are linked to optic flow onset, N2VIs are linked to cue invalidity associated attentional shifts, and P300s are linked to attention and decision making (Fig. 2D). These waveforms show group effects on peak amplitudes (Wilks’ lambda, F1185, 6 = 0.551, P < 0.001): the N200s are largest in ONs (F2 = 13.01, P < 0.001; THSD: YN < ON > LEAD), whereas the N2VIs (F2 = 30.71, P < 0.001; THSD: YN > ON > LEAD) and the P300s (F2 = 204.73, P < 0.001; THSD: YN > ON > LEAD) are largest in YNs and successively smaller in ONs and LEADs.
Neural Response Spectra
We used neural response spectra to identify power and synchrony changes (see Methods, Neurophysiological Analysis) in aging and LEAD and plotted as time relative to stimulus onset versus response frequency with power or synchrony shown by a response color scale. Neural response power was measured relative to stimulus onset (event-related) change in RT-frequency composition (spectral perturbation) (ERSP) of the N200 and P300 responses of each participant group (Fig. 3, left).
Figure 3 .
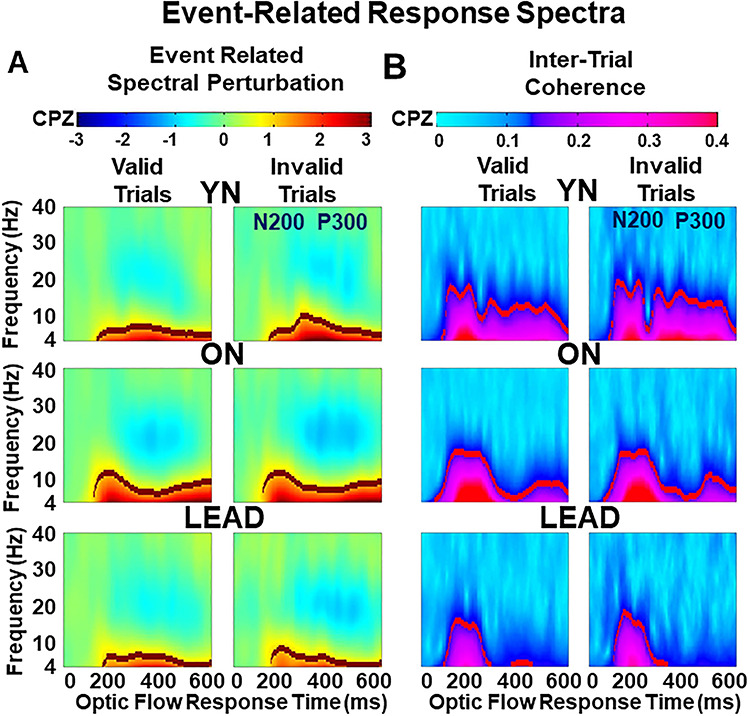
Event-related response spectra by group at CPz with response outline indicating the averaging epochs used for statistical comparisons. (A) ERSP spectrograms reflect power output across trials. Each plot shows the response period (abscissa) by response frequency (ordinate) for valid (left) and invalid (right) trials, averaged for each participant group. The black lines demarcate the high signal cut-off that defines the averaging area for each group and condition. YNs show sustained low frequency power throughout the N200, N2VI, and P300 periods of valid and invalid trials. ONs show increased N200 power. LEADs show significant power loss across all periods. High frequency power suppression is evident in the P300 period, especially in older groups’ invalid trials. (B) ITC spectrograms reflect response synchrony across trials. Each plot shows response period (abscissa) by response frequency (ordinate) for valid (left) and invalid (right) trials, averaged for each participant group. The red lines demarcate the high signal cut-off that defines the averaging area for each group and condition. YNs show strong coherence during the N200 and P300 periods. ONs show more prominent N200 coherence and a decrease in P300 coherence. LEADs show the further loss of coherence across time periods.
ERSP group differences (multivariate λ = 0.26, F10, 180 = 17.21, P < 0.001) were attributable to increased N200 ERSP in ONs that is lost in LEADs (F2 = 11.94, P < 0.001, THSDs: YN < ON > LEAD). In contrast, P300 ERSP power is decreased in both ONs and LEADs (F2 = 5.27, P = 0.007, THSDs: YN > ON > LEAD). In addition, high frequency event-related power decrements (ERDs) are seen in the P300 period with group effects (P < 0.001, THSDs: YN < ON > LEAD), VEs (P < 0.001), and interaction effects (P < 0.001).
Response synchrony was measured as intertrial (across trials of a specific condition in an individual participant) evoked response coherence (ITC) across the same response epochs and participant groups (Fig. 3, right). Group differences (multivariate λ = 0.75, F4, 186 = 7.22, P < 0.001) are attributable to decreased N200 ITC in LEADs (F2 = 5.31, P = 0.007, THSDs: ON > LEAD), and successively decreased P300 ITC in ONs and LEADs (F2 = 7.93, P = 0.001, THSDs: YN > ON = LEAD).
The localization of these responses also differs across groups (Fig. 4). YNs show clear N200 power, but N200 power is broader and stronger in ONs, and is weakest in LEADs (Fig. 4A, left). P300 power successively declines from YNs, to ONs, to LEADs (Fig. 4A, right). ITC also shows posterior N200 coherence changes across groups, with ITC increasing from YNs to ONs and being reduced in LEADs (Fig. 4B, left). In contrast, P300 coherence follows the group changes in P300 power distribution with successive declines of P300 ITC from YNs, to ONs, to LEADs (Fig. 4B, right).
Figure 4 .
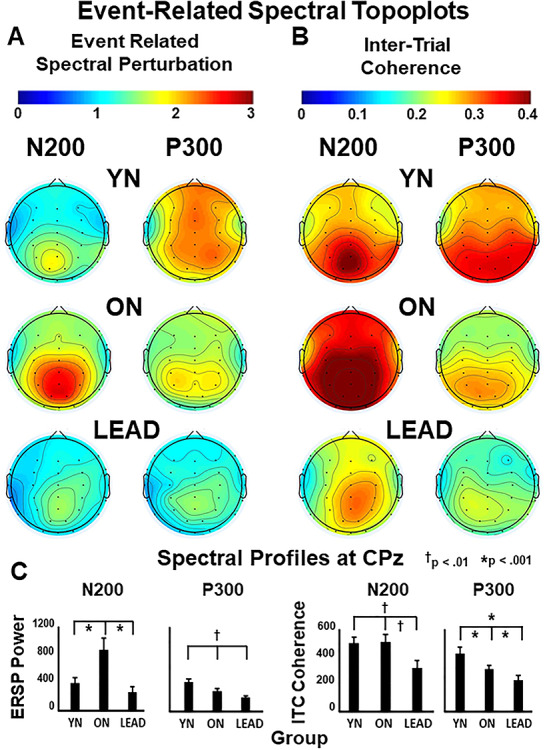
Cranial topologies of the response spectra shown for each participant group across all electrodes as measured at the time of their N200 and P300 peaks, bar graphs show signal magnitude (mean ± SEM) across participant groups and response waveforms. (A) N200 ERSP power increases posteriorly in ONs and decreases in LEADs. P300 ERSP power decreases frontoparietally in ONs and decreases further in LEADs. (B) N200 ITC coherence increases posteriorly in ONs and decreases posteriorly in LEADs. P300 ITC coherence decreases across all electrodes in ONs and decreases further in LEAD. (C) Bar graphs of ERSP (left) and ITC (right) for N200 and P300 epochs as recorded at CPz with indicators of significant group differences by P values.
Independent Components
We tested whether these findings were specific to the CPz peak response site or also seen across recording sites by using ICA to identify neural sources contributing to these responses (see Methods, Independent Components). ICA yields 30 ICs from 30 recording electrodes, here ordered by their relative contribution to total signal independence. In this case, the first 10 ICs account for 81.8% of the total signal independence (Supplementary Material, Fig. S1).
The top 10 ICs defined five sources, three from individual components (frontal IC 2, parietal IC 5, and occipital IC 3) and two from combining symmetrical pairs of components (lateral parietal ICs 4 and 7, and temporal ICs 8 and 10). The remaining three ICs from the top 10 were not included because they reflect blinks (IC 1) or eye movements (ICs 6 and 9). The other ICs are omitted as they either come from single electrodes, had ERPs that appear unrelated to the stimulus cycle, or account for little independence.
Each IC reflects contributions from each electrode, and the relative magnitude of those contributions yield the cranial topography of each IC (Fig. 5B). ONs show the largest N200 ERSPs (multivariate λ = 0.35, F10, 186 = 12.89, P < 0.001) at parietal IC 5 and occipital IC 3 (ps < 0.001, THSD: YN < ON > LEAD) and the largest P300 ERSPs (multivariate λ = 0.24, F10, 186 = 19.45, P < 0.001) at parietal IC 5, occipital IC 3, and lateral parietal ICs 4,7 (ps < 0.001, THSD: YN < ON > LEAD). P300 ERSPs also show high frequency power decrements in ONs and LEADs at parietal IC 5 (P = 0.001, YN > ON > LEAD), and in all groups at lateral parietal ICs 4,7 (P = 0.146). In contrast, ONs and LEADs lose frontal IC2 N200 and P300 power (ps = 0.001, YN > ON > LEAD). Thus, ONs show power increases at parieto-occipital sites with decreases at the frontal site.
Figure 5 .
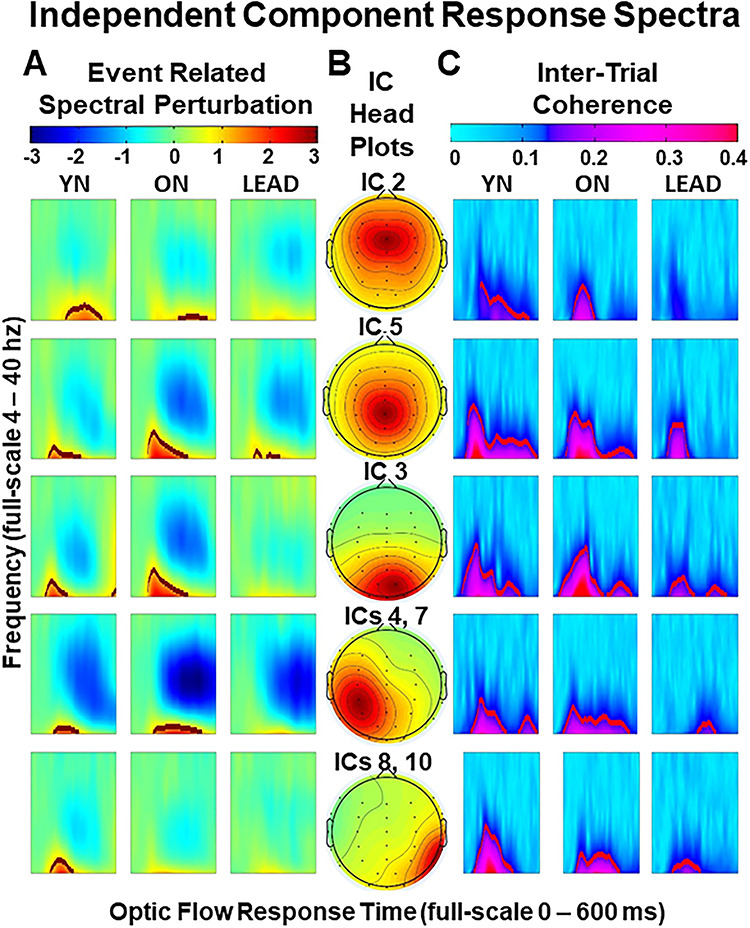
Event-related response spectra of the five ICs. (A) ERSP of valid trials across components and groups show posterior N200 increases (ICs 5 and 3) and P300 decreases in posterior aging (ICs 3, 5, and 4, 7). (B) Topoplots show the distribution of electrode contributions to the ICs. The bottom two components are averaged from pairs that reflect symmetrical ICs across the midline. (C) ITC of valid trials across components and groups show declines in aging and LEAD across posterior sites (ICs 5, 3, and 8, 10) and an isolated decline in LEADs at lateral parietal sites (ICs 4, 7). In sum, aging increases N200 power and coherence at parieto-occipital sources and decreases P300 coherence at frontal, as well as posterior, sources. LEADs show wide decreases in N200 and P300 power and coherence.
LEADs show robust decreases in N200 ITC coherence (multivariate λ = 0.29, F10, 186 = 15.96, P < 0.001) across posterior sites (IC 3, IC 5 and ICs 4,7, ps < 0.001, IC 2, P = 0.002, THSD: YN = ON > LEAD), with aging and AD effects at temporal IC 8,10 (P < 0.001, THSD: YN > ON > LEAD) (Fig. 5C). P300 ITCs also show aging and AD effects (multivariate λ = 0.22, F10, 186 = 20.99, P < 0.001) in midline frontal IC 2, parietal IC 5 (ps < 0.001, YN > ON > LEAD), and occipital IC 3 (P < 0.001, YN > LEAD), with an isolated AD effect only at lateral parietal ICs 4,7 (P < 0.001, YN = ON > LEAD). Thus, LEADs lose N200 coherence, while ONs and LEADs lose N200 and P300 coherence at both frontal and parietal sites.
Discussion
Alzheimer’s Is Not Severe Aging
Cueing primes spatial attention (Posner 1980; Klein 2000) with valid cues speeding responses to the cued heading direction in optic flow and invalid cues slowing responses to other headings (Fig. 2). ERPs are comparably altered by cueing: invalid cues leave optic flow N200s unchanged, which are followed by N2VIs that showing shifting hemispheric lateralization to the side contralateral to the attended side with larger task-related P300s. These effects link frontal spatial attentional and parietal spatial visual activation (Lockwood et al. 2018).
Spectral analyses show that ONs have stronger and more coherent parieto-occipital N200s, but weaker and less coherent fronto-parietal P300s. In contrast, LEADs have both weaker and less coherent N200s and P300s. This suggests a fundamental distinction between the effects of aging and Alzheimer’s: aging slows behavioral responses with temporally scattered, incoherent task-related P300s, but hyper-responsive visual N200s. LEAD disrupts attentional VEs and reduces both the strength and coherence of the optic flow N200s and P300s (Fig. 3). These effects are robust despite the inherent inhomogeneity of both our unimpaired ON group and our early stage LEAD group. Our findings might have been further refined by genetic and cerebrospinal fluid biomarker subgroup classification that is not available in this dataset (Molinuevo et al. 2018).
Our earlier findings were derived from studies of optic flow ERPs recorded during simple heading discrimination tasks. Those studies showed that aging increases N200 latency, and LEAD decreases N200 amplitude (Fernandez et al. 2013; Monacelli et al. 2003). We took these effects to be consistent with aging-related declines in optic flow heading acuity (Warren et al. 1989), heading discrimination (O'Brien et al. 2001), and steering (Berard et al. 2009) and successively poorer real-world navigation in aging and LEAD (Kavcic et al. 2006).
Our current combination of optic flow stimulus heading discrimination, spatial attentional cueing, and the spectral analyses of ERPs reveals more textured links among behavior, ERPs, aging, and LEAD: first, aging increases N200 coherence and power while decreasing P300 coherence and power, with the net effect of delaying push-button responses while maintaining attentional cue VEs. In contrast, LEAD decreases N200 coherence and power with the failure of attentional cue VEs (Fig. 4).
Signals, Sources, and Senescence
Optic flow N200s and spatial attentional P300s show distinct cortical sources identified by the ICA of the ERPs (Fig. 1). Ten ICs accounted for >82% of the signal, seven of which identified five sources with central frontal, parietal, and occipital sites and symmetrical lateral parietal and lateral temporal sites. IC spectra show increased parieto-occipital N200 and P300 power and coherence in ONs, but decreased frontal P300 power. In LEADs, N200 and P300 power and coherence are decreased across all sources, creating response profiles that distinguish aging from LEAD.
The disruption of top-down fronto-parietal control in aging (Greenwood 2000; Tisserand and Jolles 2003) is linked to functional decline (Rabbitt et al. 2007; Sullivan et al. 2010). Those effects may be the harbinger of progression to fronto-parietal disconnection leading to the overt functional impairment of AD (Morrison et al. 1991; Leuchter et al. 1994). Aging reduces frontal myelin sheath thickness as seen in magnetic resonance and diffusion tensor imaging measures of water mobility (Pfefferbaum et al. 2000; Bartzokis et al. 2004; Pfefferbaum et al. 2005) including fiber bundles linked to optic flow processing impairments (Kavcic et al. 2008). This dismyelination reflects the combined impact of aging-related increases in myelin degeneration and decreases in myelin regeneration (Sim et al. 2002; Shen et al. 2008).
Aging-related dismyelination (Bastin et al. 2010; Hasan et al. 2010) reduces central conduction velocities (Waxman 1977; McDougall et al. 2018) and increases the temporal dispersion of transmitted volleys (Peters 2002; Sullivan et al. 2010; Kim et al. 2013). That temporal dispersion may overwhelm axonal adaptive plasticity (Fields 2015; Etxeberria et al. 2016) and disrupt fronto-parietal signal coherence as seen in the current findings (Fig. 5C). Those effects may be amplified by age-related shrinking of neuronal dendritic fields (Duffy and Teyler 1978; Duffy and Rakic 1983) that reduce the half-life of neuronal integration (Gulledge et al. 2005). Dismyelinative temporal dispersion and dendritic atrophy may combine to require more sustained, synaptic volleys to support postsynaptic integrate-and-fire mechanisms (Spruston 2008; Xiumin 2014), delaying behavioral responses, as in aging.
In addition, the loss of top-down signal coherence may exceed the temporal integrative capacity of posterior cortical recipient neurons (Burzynska et al. 2011). The reduction of top-down control may undermine frontal cortical tuning of posterior neuronal optic flow stimulus selectivity (Chorghay et al. 2018). This could increase the proportion of the posterior neuronal population that is activated by a given optic flow stimulus, increasing response power (Fig. 5A).
Linking Aging and Alzheimer’s: What Is All the Excitement About?
Aging has contrasting effects on posterior stimulus-related N200s and frontal task-related P300s: power and coherence increase in N200s and decrease in P300s. If bottom-up processing (Bisley and Goldberg 2003; Cabeza et al. 2012) creates the N200-P300 complex, stronger N200s in aging should yield stronger P300s. Thus, P300 decrements in aging may reflect a disruption of posterior-frontal transmission from the same superior longitudinal fascicular dismyelination that disrupts fronto-posterior transmission in aging (Bressler et al. 2008; Gazzaley et al. 2008; Li and Zhao 2015).
Top-down signals shape posterior cortical stimulus selectivity (Sato et al. 2013) to support task-related focusing of processing (Patel and Sathian 2000) that declines in aging (Schmolesky et al. 2000; Yang et al. 2009; Liang et al. 2010). This can explain the contrasting effects of aging on the N200 and P300: (1) Dismyelination leads to the loss of the top-down, task-related tuning of posterior cortical stimulus selectivity. (2) The loss of top-down tuning leaves more posterior cortical neurons responding to more stimuli. (3) The increase in neuronal activity may be seen as N200 hyper-responsiveness, as in our studies (Fig. 5).
Our finding N200 hyper-responsiveness in aging may mark the transition to the hyper-excitability of early AD (Busche and Konnerth 2015; Stargardt et al. 2015). Hyper-excitability may drive increasing synaptic amyloid production (Palop et al. 2007) and create a positive feedback “vicious cycle” of increasing activity and increasing amyloid (Yamamoto et al. 2015; Zott et al. 2019). Our finding P300 response incoherence in aging is consistent with dissynchronous neural activity accelerating the development of AD pathology in transgenic AD mice (Cirrito et al. 2005; Bero et al. 2011).
Hyperexcitability may promote amyloid accumulation, oligomerization (Walsh and Selkoe 2007; Arendt 2009; Ding et al. 2019), and plaque formation at the transition to early AD (Price and Morris 1999; Jagust 2009; Fjell et al. 2014). Those changes may promote (Jin and Selkoe 2015) the development of p-tau mediated synaptic dysfunction (Hoover et al. 2010), hypo-responsiveness (Busche et al. 2019), and neuron loss (Giannakopoulos et al. 2003) with tangle formation (Buerger et al. 2006).
We consider that top-down disconnection in aging may degrade P300 coherence, undermine response selectivity, and promote N200 hyperexcitability. Posterior cortical hyperexcitability may undergo polysynaptic propagation through cortico-cortical and cortico-subcortical projections to mesial temporal and subcortical structures (Seltzer and Pandya 1976; Blatt and Rosene 1998; Rockland and Van 1999; Rolls 2000) to promote AD pathology (Van and Hyman 1990; Braak and Braak 1991). Hence, aging-related frontal cortical signal incoherence may trigger posterior cortical hyperexcitability, possibly compensating for signal incoherence, but potentially promoting LEAD.
Acknowlegdements
We gratefully acknowledge the contributions of Drs Roberto Fernandez and Anthony Monacelli to data collection and of Drs William Page and David Sulon to the manuscript. Teresa Steffenella contributed to participant screening. Mr William Vaughn contributed to stimulus and paradigm development.
Funding
This work was supported in part by NEI R01-EY022062, NEI P30-EY01319, R01-NIA AG17596, ONR N000141110525, and UofR CTSI RR024135.
Supplementary Material
References
- Arendt T. 2009. Synaptic degeneration in Alzheimer's disease. Acta Neuropathologica. 118:167–179. [DOI] [PubMed] [Google Scholar]
- Bartzokis G, Sultzer D, Lu PH, Nuechterlein KH, Mintz J, Cummings JL. 2004. Heterogeneous age-related breakdown of white matter structural integrity: implications for cortical "disconnection" in aging and Alzheimer's disease. Neurobiol Aging. 25:843–851. [DOI] [PubMed] [Google Scholar]
- Bastin ME, Munoz Maniega S, Ferguson KJ, Brown LJ, Wardlaw JM, MacLullich AM, Clayden JD. 2010. Quantifying the effects of normal ageing on white matter structure using unsupervised tract shape modelling. NeuroImage. 51:1–10. [DOI] [PMC free article] [PubMed] [Google Scholar]
- Benson DF, Davis RJ, Snyder BD. 1988. Posterior cortical atrophy. Arch Neurol. 45:789–793. [DOI] [PubMed] [Google Scholar]
- Benton A, Hamsher K, Varney NR, Spreen O. 1983. Contributions to neuropsychological assessment: a clinical manual. New York: Oxford University Press. [Google Scholar]
- Berard JR, Fung J, McFadyen BJ, Lamontagne A. 2009. Aging affects the ability to use optic flow in the control of heading during locomotion. Exp Brain Res. 194:183–190. [DOI] [PubMed] [Google Scholar]
- Bero AW, Yan P, Roh JH, Cirrito JR, Stewart FR, Raichle ME, Lee JM, Holtzman DM. 2011. Neuronal activity regulates the regional vulnerability to amyloid-beta deposition. Nat Neurosci. 14:750–756. [DOI] [PMC free article] [PubMed] [Google Scholar]
- Bisley JW, Goldberg ME. 2003. Neuronal activity in the lateral intraparietal area and spatial attention.[see comment]. Science. 299:81–86. [DOI] [PubMed] [Google Scholar]
- Blatt GJ, Rosene DL. 1998. Organization of direct hippocampal efferent projections to the cerebral cortex of the rhesus monkey: projections from CA1, prosubiculum, and subiculum to the temporal lobe. J Comp Neurol. 392:92–114. [DOI] [PubMed] [Google Scholar]
- Bledowski C, Prvulovic D, Hoechstetter K, Scherg M, Wibral M, Goebel R, Linden DE. 2004. Localizing P300 generators in visual target and distractor processing: a combined event-related potential and functional magnetic resonance imaging study. J Neurosci. 24:9353–9360. [DOI] [PMC free article] [PubMed] [Google Scholar]
- Braak H, Braak E. 1991. Neuropathological staging of alzheimer-related changes. Acta Neuropathologica. 82:239–259. [DOI] [PubMed] [Google Scholar]
- Bressler SL, Tang W, Sylvester CM, Shulman GL, Corbetta M. 2008. Top-down control of human visual cortex by frontal and parietal cortex in anticipatory visual spatial attention. J Neurosci. 28:10056–10061. [DOI] [PMC free article] [PubMed] [Google Scholar]
- Brier MR, Thomas JB, Fagan AM, Hassenstab J, Holtzman DM, Benzinger TL, Morris JC, Ances BM. 2014. Functional connectivity and graph theory in preclinical Alzheimer's disease. Neurobiol Aging. 35:757–768. [DOI] [PMC free article] [PubMed] [Google Scholar]
- Buerger K, Ewers M, Pirttila T, Zinkowski R, Alafuzoff I, Teipel SJ, DeBernardis J, Kerkman D, McCulloch C, Soininen H et al. 2006. CSF phosphorylated tau protein correlates with neocortical neurofibrillary pathology in Alzheimer's disease. Brain. 129:3035–3041. [DOI] [PubMed] [Google Scholar]
- Burzynska AZ, Nagel IE, Preuschhof C, Li SC, Lindenberger U, Backman L, Heekeren HR. 2011. Microstructure of frontoparietal connections predicts cortical responsivity and working memory performance. Cereb Cortex. 21:2261–2271. [DOI] [PubMed] [Google Scholar]
- Busche MA, Konnerth A. 2015. Neuronal hyperactivity—a key defect in Alzheimer's disease? Bioessays. 37:624–632. [DOI] [PubMed] [Google Scholar]
- Busche MA, Wegmann S, Dujardin S, Commins C, Schiantarelli J, Klickstein N, Kamath TV, Carlson GA, Nelken I, Hyman BT. 2019. Tau impairs neural circuits, dominating amyloid-β effects, in Alzheimer models in vivo. Nat Neurosci. 22:57–64. [DOI] [PMC free article] [PubMed] [Google Scholar]
- Cabeza R, Ciaramelli E, Moscovitch M. 2012. Cognitive contributions of the ventral parietal cortex: an integrative theoretical account. Trends Cog Sci. 16:338–352. [DOI] [PMC free article] [PubMed] [Google Scholar]
- Chapman RM. 1964. Electroencephalographic data: baseline crossings. Science. 146:671. [DOI] [PubMed] [Google Scholar]
- Chorghay Z, Karadottir RT, Ruthazer ES. 2018. White matter plasticity keeps the brain in tune: axons conduct while glia wrap. Front Cell Neurosci. 12:428. [DOI] [PMC free article] [PubMed] [Google Scholar]
- Cirrito JR, Yamada KA, Finn MB, Sloviter RS, Bales KR, May PC, Schoepp DD, Paul SM, Mennerick S, Holtzman DM. 2005. Synaptic activity regulates interstitial fluid amyloid-beta levels in vivo. Neuron. 48:913–922. [DOI] [PubMed] [Google Scholar]
- Cosman JD, Arita JT, Ianni JD, Woodman GF. 2015. Electrophysiological measurement of information flow during visual search. Psychophysiology. 53:535–543. [DOI] [PMC free article] [PubMed] [Google Scholar]
- Critchley M. 1953. The parietal lobes. New York: Hafner Publishing. [Google Scholar]
- Ding Y, Zhao J, Zhang X, Wang S, Viola KL, Chow FE, Zhang Y, Lippa C, Klein WL, Gong Y. 2019. Amyloid beta oligomers target to extracellular and intracellular neuronal synaptic proteins in Alzheimer's disease. Front Neurol. 10:1140. [DOI] [PMC free article] [PubMed] [Google Scholar]
- Dubin MJ, Duffy CJ. 2009. Neuronal encoding of the distance traversed by covert shifts of spatial attention. Neuroreport. 20:49–55. [DOI] [PMC free article] [PubMed] [Google Scholar]
- Duffy CJ, Rakic P. 1983. Differentiation of granule cell dendrites in the dentate gyrus of the rhesus monkey: a quantitative Golgi study. J Comp Neurol. 214:224–237. [DOI] [PubMed] [Google Scholar]
- Duffy CJ, Teyler TJ. 1978. Development of habituation in the dentate gyrus of rat: physiology and anatomy. Brain Res Bull. 3:305–310. [DOI] [PubMed] [Google Scholar]
- Etxeberria A, Hokanson KC, Dao DQ, Mayoral SR, Mei F, Redmond SA, Ullian EM, Chan JR. 2016. Dynamic modulation of myelination in response to visual stimuli alters optic nerve conduction velocity. J Neurosci. 36:6937–6948. [DOI] [PMC free article] [PubMed] [Google Scholar]
- Fernandez R, Duffy CJ. 2012. Early Alzheimer's disease blocks responses to accelerating self-movement. Neurobiol Aging. 33:2551–2560. [DOI] [PMC free article] [PubMed] [Google Scholar]
- Fernandez R, Kavcic V, Duffy CJ. 2007. Neurophysiologic analyses of low- and high-level visual processing in Alzheimer disease. Neurology. 68:2066–2076. [DOI] [PubMed] [Google Scholar]
- Fernandez R, Monacelli A, Duffy CJ. 2013. Visual motion event related potentials distinguish aging and Alzheimer's disease. JAD. 36:177–183. [DOI] [PMC free article] [PubMed] [Google Scholar]
- Fields RD. 2015. A new mechanism of nervous system plasticity: activity-dependent myelination. Nat Rev Neurosci. 16:756–767. [DOI] [PMC free article] [PubMed] [Google Scholar]
- Fjell AM, McEvoy L, Holland D, Dale AM, Walhovd KB, Alzheimer's Disease Neuroimaging I. 2014. What is normal in normal aging? Effects of aging, amyloid and Alzheimer's disease on the cerebral cortex and the hippocampus. Prog Neurobiol. 117:20–40. [DOI] [PMC free article] [PubMed] [Google Scholar]
- Folstein MF, Folstein SE, McHugh PR. 1975. “Mini-mental state”: a practical method for grading the cognitive state of patients for the clinician. J Psychiatr Res. 12:189–198. [DOI] [PubMed] [Google Scholar]
- Fujimori M, Imamura T, Yamashita H, Hirono N, Mori E. 1997. The disturbances of object vision and spatial vision in Alzheimer's disease. Dement Geriatr Cogn Disord. 8:228–231. [DOI] [PubMed] [Google Scholar]
- Gazzaley A, Clapp W, Kelley J, McEvoy K, Knight RT, D'Esposito M. 2008. Age-related top-down suppression deficit in the early stages of cortical visual memory processing. Proc Natl Acad Sci U S A. 105:13122–13126. [DOI] [PMC free article] [PubMed] [Google Scholar]
- Giannakopoulos P, Herrmann FR, Bussiere T, Bouras C, Kovari E, Perl DP, Morrison JH, Gold G, Hof PR. 2003. Tangle and neuron numbers, but not amyloid load, predict cognitive status in Alzheimer's disease. Neurology. 60:1495–1500. [DOI] [PubMed] [Google Scholar]
- Greenwood PM. 2000. The frontal aging hypothesis evaluated. J Int Neuropsychol Soc. 6:705–726. [DOI] [PubMed] [Google Scholar]
- Groppe DM, Makeig S, Kutas M. 2009. Identifying reliable independent components via split-half comparisons. NeuroImage. 45:1199–1211. [DOI] [PMC free article] [PubMed] [Google Scholar]
- Gulledge AT, Kampa BM, Stuart GJ. 2005. Synaptic integration in dendritic trees. J Neurobiol. 64:75–90. [DOI] [PubMed] [Google Scholar]
- Hasan KM, Kamali A, Abid H, Kramer LA, Fletcher JM, Ewing-Cobbs L. 2010. Quantification of the spatiotemporal microstructural organization of the human brain association, projection and commissural pathways across the lifespan using diffusion tensor tractography. Brain Struct Funct. 214:361–373. [DOI] [PMC free article] [PubMed] [Google Scholar]
- Hof PR, Bouras C, Constantinidis J, Morrison JH. 1990. Selective disconnection of specific visual association pathways in cases of Alzheimer's disease presenting with Balint's syndrome. J Neuropathol Exp Neurol. 49:168–184. [DOI] [PubMed] [Google Scholar]
- Hoover BR, Reed MN, Su J, Penrod RD, Kotilinek LA, Grant MK, Pitstick R, Carlson GA, Lanier LM, Yuan LL et al. 2010. Tau mislocalization to dendritic spines mediates synaptic dysfunction independently of neurodegeneration. Neuron. 68:1067–1081. [DOI] [PMC free article] [PubMed] [Google Scholar]
- Jacob MS, Duffy CJ. 2015. Steering Transforms the Cortical Representation of Self-Movement from Direction to Destination. The Journal of neuroscience: the official journal of the Society for Neuroscience. 35:16055–16063. [DOI] [PMC free article] [PubMed] [Google Scholar]
- Jagust W. 2009. Mapping brain beta-amyloid. Curr Opin Neurol. 22:356–361. [DOI] [PMC free article] [PubMed] [Google Scholar]
- Jin M, Selkoe DJ. 2015. Systematic analysis of time-dependent neural effects of soluble amyloid beta oligomers in culture and in vivo: prevention by scyllo-inositol. Neurobiol Dis. 82:152–163. [DOI] [PMC free article] [PubMed] [Google Scholar]
- Kavcic V, Duffy CJ. 2003. Attentional dynamics and visual perception: mechanisms of spatial disorientation in Alzheimer's disease. Brain. 126:1173–1181. [DOI] [PubMed] [Google Scholar]
- Kavcic V, Fernandez R, Logan DJ, Duffy CJ. 2006. Neurophysiological and perceptual correlates of navigational impairment in Alzheimer's disease. Brain. 129:736–746. [DOI] [PubMed] [Google Scholar]
- Kavcic V, Ni H, Zhu T, Zhong J, Duffy CJ. 2008. White matter integrity linked to functional impairments in aging and early Alzheimer's disease. Alzheimer Dement. 4:381–389. [DOI] [PMC free article] [PubMed] [Google Scholar]
- Kim JH, Renden R, von Gersdorff H. 2013. Dysmyelination of auditory afferent axons increases the jitter of action potential timing during high-frequency firing. J Neurosci. 33:9402–9407. [DOI] [PMC free article] [PubMed] [Google Scholar]
- Kincade JM, Abrams RA, Astafiev SV, Shulman GL, Corbetta M. 2005. An event-related functional magnetic resonance imaging study of voluntary and stimulus-driven orienting of attention. J Neurosci. 25:4593–4604. [DOI] [PMC free article] [PubMed] [Google Scholar]
- Klein RM. 2000. Inhibition of return. Trends Cogn Sci. 4:138–147. [DOI] [PubMed] [Google Scholar]
- Leuchter AF, Dunkin JJ, Lufkin RB, Anzai Y, Cook IA, Newton TF. 1994. Effect of white matter disease on functional connections in the aging brain. J Neurol Neurosurg Psychiatr. 57:1347–1354. [DOI] [PMC free article] [PubMed] [Google Scholar]
- Li L, Zhao D. 2015. Age-related inter-region EEG coupling changes during the control of bottom-up and top-down attention. Front Aging Neurosci. 7:223. [DOI] [PMC free article] [PubMed] [Google Scholar]
- Liang Z, Yang Y, Li G, Zhang J, Wang Y, Zhou Y, Leventhal AG. 2010. Aging affects the direction selectivity of MT cells in rhesus monkeys. Neurobiol Aging. 31:863–873. [DOI] [PubMed] [Google Scholar]
- Lockwood CT, Vaughn W, Duffy CJ. 2018. Attentional ERPs distinguish aging and early Alzheimer's dementia. Neurobiol Aging. 70:51–58. [DOI] [PubMed] [Google Scholar]
- Luck SJ, Hillyard SA. 1994. Electrophysiological correlates of feature analysis during visual search. Psychophysiology. 31:291–308. [DOI] [PubMed] [Google Scholar]
- Lynch JC, Mountcastle VB, Talbot WH, Yin TC. 1977. Parietal lobe mechanisms for directed visual attention. J Neurophysiol. 40:362–389. [DOI] [PubMed] [Google Scholar]
- Makeig S. 2002. Response: event-related brain dynamics—unifying brain electrophysiology. Trends Neurosci. 25:390. [DOI] [PubMed] [Google Scholar]
- Makeig S, Delorme A, Westerfield M, Jung TP, Townsend J, Courchesne E, Sejnowski TJ. 2004. Electroencephalographic brain dynamics following manually responded visual targets. PLoS Biol. 2:0747–0762. [DOI] [PMC free article] [PubMed] [Google Scholar]
- Makeig S, Westerfield M, Jung TP, Enghoff S, Townsend J, Courchesne E, Sejnowski TJ. 2002. Dynamic brain sources of visual evoked responses. Science. 295:690–694. [DOI] [PubMed] [Google Scholar]
- McDougall S, Vargas Riad W, Silva-Gotay A, Tavares ER, Harpalani D, Li G-L, Richardson HN. 2018. Myelination of Axons Corresponds with Faster Transmission Speed in the Prefrontal Cortex of Developing Male Rats. eNeuro. 5:ENEURO.0203-18.2018. doi:10.1523/ENEURO.0203-18.2018. [DOI] [PMC free article] [PubMed] [Google Scholar]
- McKhann GM, Albert MS, Grossman M, Miller B, Dickson D, Trojanowski JQ, Disease WGoFDaPs . 2001. Clinical and pathological diagnosis of frontotemporal dementia: report of the work group on frontotemporal dementia and Pick's disease. Arch Neurol. 58:1803–1809. [DOI] [PubMed] [Google Scholar]
- Mendez MF, Ghajarania M, Perryman KM. 2002. Posterior cortical atrophy: clinical characteristics and differences compared to Alzheimer's disease. Dement Geriatr Cogn Disord. 14:33–40. [DOI] [PubMed] [Google Scholar]
- Migliaccio R, Agosta F, Scola E, Magnani G, Cappa SF, Pagani E, Canu E, Comi G, Falini A, Gorno-Tempini ML et al. 2012. Ventral and dorsal visual streams in posterior cortical atrophy: a DT MRI study. Neurobiol Aging. 33:2572–2584. [DOI] [PMC free article] [PubMed] [Google Scholar]
- Molinuevo JL, Ayton S, Batrla R, Bednar MM, Bittner T, Cummings J, Fagan AM, Hampel H, Mielke MM, Mikulskis A et al. 2018. Current state of Alzheimer's fluid biomarkers. Acta Neuropathologica. 136:821–853. [DOI] [PMC free article] [PubMed] [Google Scholar]
- Monacelli AM, Cushman LA, Kavcic V, Duffy CJ. 2003. Spatial disorientation in Alzheimer's disease: the remembrance of things passed. Neurology. 61:1491–1497. [DOI] [PubMed] [Google Scholar]
- Money J. 1976. A standardized road map test of direction sense. San Rafael (CA): Academic Therapy Publications. [Google Scholar]
- Moore T, Fallah M. 2004. Microstimulation of the frontal eye field and its effects on covert spatial attention. J Neurophysiol. 91:152–162. [DOI] [PubMed] [Google Scholar]
- Morrison JH, Hof PR, Bouras C. 1991. An anatomic substrate for visual disconnection in Alzheimer's disease. Ann N Y Acad Sci. 640:36–43. [DOI] [PubMed] [Google Scholar]
- Naatanen R, Simpson M, Loveless NE. 1982. Stimulus deviance and evoked potentials. Biol Psychol. 14:53–98. [DOI] [PubMed] [Google Scholar]
- O'Brien HL, Tetewsky SJ, Avery LM, Cushman LA, Makous W, Duffy CJ. 2001. Visual mechanisms of spatial disorientation in Alzheimer's disease. Cereb Cortex. 11:1083–1092. [DOI] [PubMed] [Google Scholar]
- Page WK, Duffy CJ. 2003. Heading representation in MST: sensory interactions and population encoding. J Neurophysiol. 89:1994–2013. [DOI] [PubMed] [Google Scholar]
- Page WK, Duffy CJ. 2008. Cortical neuronal responses to optic flow are shaped by visual strategies for steering. Cereb Cortex. 18:727–739. [DOI] [PubMed] [Google Scholar]
- Palop JJ, Chin J, Roberson ED, Wang J, Thwin MT, Bien-Ly N, Yoo J, Ho KO, Yu GQ, Kreitzer A et al. 2007. Aberrant excitatory neuronal activity and compensatory remodeling of inhibitory hippocampal circuits in mouse models of Alzheimer's disease. Neuron. 55:697–711. [DOI] [PMC free article] [PubMed] [Google Scholar]
- Patel GA, Sathian K. 2000. Visual search: bottom-up or top-down? Front Biosci. 5:D169–D193. [DOI] [PubMed] [Google Scholar]
- Peters A. 2002. The effects of normal aging on myelin and nerve fibers: a review. J Neurocytol. 31:581–593. [DOI] [PubMed] [Google Scholar]
- Pfefferbaum A, Adalsteinsson E, Sullivan EV. 2005. Frontal circuitry degradation marks healthy adult aging: evidence from diffusion tensor imaging. Neuroimage. 26:891–899. [DOI] [PubMed] [Google Scholar]
- Pfefferbaum A, Sullivan EV, Hedehus M, Lim KO, Adalsteinsson E, Moseley M. 2000. Age-related decline in brain white matter anisotropy measured with spatially corrected echo-planar diffusion tensor imaging. Magn Reson Med. 44:259–268. [DOI] [PubMed] [Google Scholar]
- Polich J. 2007. Updating P300: an integrative theory of P3a and P3b. Clin Neurophysiol. 118:2128–2148. [DOI] [PMC free article] [PubMed] [Google Scholar]
- Posner MI. 1980. Orienting of attention. Q J Exp Psychol. 32:3–25. [DOI] [PubMed] [Google Scholar]
- Price JL, Morris JC. 1999. Tangles and plaques in nondemented aging and "preclinical" Alzheimer's disease. Ann Neurol. 45:358–368. [DOI] [PubMed] [Google Scholar]
- Rabbitt P, Scott M, Lunn M, Thacker N, Lowe C, Pendleton N, Horan M, Jackson A. 2007. White matter lesions account for all age-related declines in speed but not in intelligence. Neuropsychology. 21:363–370. [DOI] [PubMed] [Google Scholar]
- Reiman MP, Manske RC. 2011. The assessment of function: how is it measured? A clinical perspective. J Man Manip Ther. 19:91–99. [DOI] [PMC free article] [PubMed] [Google Scholar]
- Rizzo M, Anderson SW, Dawson J, Nawrot M. 2000. Vision and cognition in Alzheimer's disease. Neuropsychologia. 38:1157–1169. [DOI] [PubMed] [Google Scholar]
- Roach BJ, Mathalon DH. 2008. Event-related EEG time-frequency analysis: an overview of measures and an analysis of early gamma band phase locking in schizophrenia. Schizophr Bull. 34:907–926. [DOI] [PMC free article] [PubMed] [Google Scholar]
- Rockland KS, Van H. 1999. Some temporal and parietal cortical connections converge in CA1 of the primate hippocampus. Cereb Cortex. 9:232–237. [DOI] [PubMed] [Google Scholar]
- Rolls ET. 2000. Hippocampo-cortical and cortico-cortical backprojections. Hippocampus. 10:380–388. [DOI] [PubMed] [Google Scholar]
- Sato N, Page WK, Duffy CJ. 2013. Task contingencies and perceptual strategies shape behavioral effects on neuronal response profiles. J Neurophysiol. 109:546–556. [DOI] [PMC free article] [PubMed] [Google Scholar]
- Schmolesky MT, Wang Y, Pu M, Leventhal AG. 2000. Degradation of stimulus selectivity of visual cortical cells in senescent rhesus monkeys. Nat Neurosci. 3:384–390. [DOI] [PubMed] [Google Scholar]
- Seltzer B, Pandya DN. 1976. Some cortical projections to the parahippocampal area in the rhesus monkey. Exp Neurol. 50:146–160. [DOI] [PubMed] [Google Scholar]
- Shen S, Sandoval J, Swiss VA, Li J, Dupree J, Franklin RJ, Casaccia-Bonnefil P. 2008. Age-dependent epigenetic control of differentiation inhibitors is critical for remyelination efficiency. Nat Neurosci. 11:1024–1034. [DOI] [PMC free article] [PubMed] [Google Scholar]
- Sim FJ, Zhao C, Penderis J, Franklin RJ. 2002. The age-related decrease in CNS remyelination efficiency is attributable to an impairment of both oligodendrocyte progenitor recruitment and differentiation. J Neurosci. 22:2451–2459. [DOI] [PMC free article] [PubMed] [Google Scholar]
- Spruston N. 2008. Pyramidal neurons: dendritic structure and synaptic integration. Nat Rev Neurosci. 9:206–221. [DOI] [PubMed] [Google Scholar]
- Stargardt A, Swaab DF, Bossers K. 2015. Storm before the quiet: neuronal hyperactivity and Abeta in the presymptomatic stages of Alzheimer's disease. Neurobiol Aging. 36:1–11. [DOI] [PubMed] [Google Scholar]
- Sullivan EV, Rohlfing T, Pfefferbaum A. 2010. Quantitative fiber tracking of lateral and interhemispheric white matter systems in normal aging: relations to timed performance. Neurobiology of aging. 31:464–481. [DOI] [PMC free article] [PubMed] [Google Scholar]
- Sutton S, Braren M, Zubin J, John ER. 1965. Evoked-potential correlates of stimulus uncertainty. Science. 150:1187–1188. [DOI] [PubMed] [Google Scholar]
- Tetewsky SJ, Duffy CJ. 1999. Visual loss and getting lost in Alzheimer's disease. Neurology. 52:958–965. [DOI] [PubMed] [Google Scholar]
- Tisserand DJ, Jolles J. 2003. On the involvement of prefrontal networks in cognitive ageing. Cortex. 39:1107–1128. [DOI] [PubMed] [Google Scholar]
- Tsolaki AC, Kosmidou V, Kompatsiaris IY, Papadaniil C, Hadjileontiadis L, Adam A, Tsolaki M. 2017. Brain source localization of MMN and P300 ERPs in mild cognitive impairment and Alzheimer's disease: a high-density EEG approach. Neurobiol Aging. 55:190–201. [DOI] [PubMed] [Google Scholar]
- Van H, Hyman BT. 1990. Hippocampal formation: anatomy and the patterns of pathology in Alzheimer's disease. Prog Brain Res. 83:445–457. [DOI] [PubMed] [Google Scholar]
- Walsh DM, Selkoe DJ. 2007. A beta oligomers—a decade of discovery. J Neurochem. 101:1172–1184. [DOI] [PubMed] [Google Scholar]
- Warren WH, Blackwell AW, Morris MW. 1989. Age differences in perceiving the direction of self-motion from optical flow. J Gerontol. 44:P147–P153. [DOI] [PubMed] [Google Scholar]
- Waxman SG. 1977. Conduction in myelinated, unmyelinated, and demyelinated fibers. Arch Neurol. 34:585–589. [DOI] [PubMed] [Google Scholar]
- Wechsler D. 1987. Wechsler memory scale, revised manual. San Antonio (TX): The Psychological Corp. [Google Scholar]
- Woodman GF, Luck SJ. 1999. Electrophysiological measurement of rapid shifts of attention during visual search. Nature. 400:867–869. [DOI] [PubMed] [Google Scholar]
- Xiumin L. 2014. Signal integration on the dendrites of a pyramidal neuron model. Cogn Neurodynamics. 8:81–85. [DOI] [PMC free article] [PubMed] [Google Scholar]
- Yamamoto K, Tanei ZI, Hashimoto T, Wakabayashi T, Okuno H, Naka Y, Yizhar O, Fenno LE, Fukayama M, Bito H et al. 2015. Chronic optogenetic activation augments abeta pathology in a mouse model of Alzheimer disease. Cell Rep. 11:859–865. [DOI] [PubMed] [Google Scholar]
- Yang Y, Zhang J, Liang Z, Li G, Wang Y, Ma Y, Zhou Y, Leventhal AG. 2009. Aging affects the neural representation of speed in macaque area MT. Cereb Cortex. 19:1957–1967. [DOI] [PMC free article] [PubMed] [Google Scholar]
- Zott B, Simon MM, Hong W, Unger F, Chen-Engerer HJ, Frosch MP, Sakmann B, Walsh DM, Konnerth A. 2019. A vicious cycle of beta amyloid-dependent neuronal hyperactivation. Science. 365:559–565. [DOI] [PMC free article] [PubMed] [Google Scholar]
Associated Data
This section collects any data citations, data availability statements, or supplementary materials included in this article.