Abstract
Renal sympathetic denervation, a potentially revolutionary interventional treatment for hypertension, faces an existential problem due to the inability to confirm successful ablation of the targeted renal sympathetic nerves. Based on the observation that renal sympathetic nerve activity exerts rhythmic, baroreflex-driven, and vasoconstrictive control of the renal vasculature, we developed a novel technique for identifying rhythmic sympathetic vascular control using a time-varying, two-component Windkessel model of the renal circulation. This technology was tested in two different animal models of renal denervation; ten rabbits underwent chronic, surgical renal denervation, and nine pigs underwent acute, functional renal denervation via intrathecal administration of ropivacaine. Both methods of renal denervation reduced negative admittance gain, negative phase shift renal vascular control at known sympathetic vasomotor frequencies, consistent with a reduction in vasoconstrictive, baroreflex-driven renal sympathetic vasomotion. Classic measures like mean renal blood flow and mean renal vascular resistance were not significantly affected in either model of renal denervation. Renal sympathetic vasomotion monitoring could provide intraprocedural feedback for interventionists performing renal denervation and serve more broadly as a platform technology for the evaluation and treatment of diseases affecting the sympathetic nervous system.
Keywords: Sympathetic Nervous System, Renal Circulation, Autonomic Denervation, Autonomic Nerve Block, Wavelet Signal Processing, Digital Signal Processing, Vascular Resistance
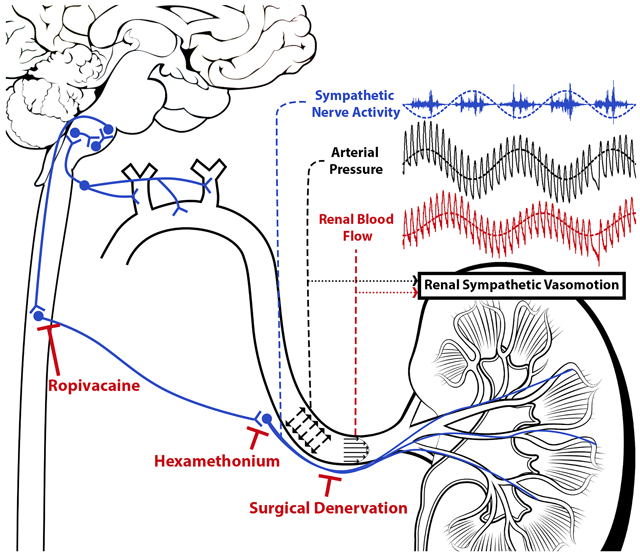
Graphical Abstract
Introduction
The sympathetic nervous system controls diverse aspects of body homeostasis and plays a maladaptive role in hypertension1, heart failure2, and chronic kidney disease3. Despite the importance of the sympathetic nervous system in health and disease, clinicians lack widely accessible measures of regional sympathetic outflow. The inability to clinically assess this master regulator negatively affects therapies targeting the sympathetic nervous system, acute monitoring of at-risk patients, and patient care for diseases involving the sympathetic nervous system.
Nowhere is this more evident than for renal denervation, a promising antihypertensive intervention that languished for years after a pivotal clinical trial failed to show that renal denervation decreases blood pressure relative to a sham procedure4. While many explanations for this efficacy failure were advanced, convincing post-hoc analysis of the trial indicated that the patients simply were not denervated5,6, a fact that was obscured to interventionists by the inability to assess the sympatholytic effect of these devices. With subsequent advances in device design and more sophisticated clinical trial design, renal denervation has been proven effective7, but a clinically implementable way to validate the removal of the renal sympathetic nerves remains elusive.
Renal sympathetic outflow controls renin release, sodium reabsorption, and renal vascular tone8. Renal sympathetic vascular control represents an appealing endpoint for the assessment of sympathetic outflow for numerous reasons, including the availability of existing clinical technologies to measure blood flow in real time and the potential generalizability of such a technique to other vascular beds. Renal vascular control, however, is particularly complex, with the autoregulatory mechanisms of tubuloglomerular feedback and the myogenic response exerting tight control over renal vascular resistance9. For this reason, simple static measures like mean renal blood flow and renal vascular resistance do not reliably reflect sympathetic tone, and more sensitive, dynamic measures of sympathetic vascular control are needed.
In this study, we identify a baroreflex-driven rhythm in direct renal sympathetic nerve recordings from conscious rabbits, which corresponds to known key sympathetic vasomotor frequencies in rabbits, pigs, and humans. Then, we lay out a novel method for characterizing active rhythmic vascular modulation with clear physiological implications by leveraging the physical relationship between arterial pressure and renal blood flow. We test this method in both a chronic, surgical renal denervation rabbit model and an acute, functional renal denervation model in swine. We hypothesized that baroreflex-driven rhythmic renal sympathetic nerve activity would give rise to rhythmic, baroreflex-driven, vasoconstrictive renovascular modulation, termed renal sympathetic vasomotion.
Methods
All methods are further detailed in the Online Supplement.
Data and Materials Availability
The data and source code from this study are available from the corresponding author upon reasonable request.
Rabbit Experiments
Experiments were carried out on adult male New Zealand White rabbits. Both rabbit and pig experiments were reviewed and approved by our Institutional Animal Care and Use Committee and carried out in accordance with the NIH Guide for the Care and Use of Laboratory Animals.
Five rabbits were instrumented with arterial pressure (AP) telemeters and renal sympathetic nerve activity (RSNA) electrodes under general anesthesia. After a one-week recovery period and acclimation to a procedure room, AP and RSNA were recorded. Another ten rabbits were instrumented with AP telemeters and bilateral renal blood flow (RBF) probes and underwent unilateral surgical renal denervation under general anesthesia. After a two-week recovery period and acclimation to a procedure room, AP and bilateral RBF were recorded. At the end of data collection, the nasopharyngeal reflex was elicited to validate unilateral denervation. In a separate experiment, the ganglionic blocker hexamethonium was administered to eliminate global autonomic sympathetic outflow.
Swine Experiments
Experiments were carried out on nine male domestic swine. Each pig was induced with tiletamine and zolazepam and intubated. Intrathecal access at the caudal levels of the thoracic spine was obtained after dissection to the interspinous ligament, and an intrathecal catheter was advanced to the T10/T11 interspace under fluoroscopic guidance. The pig was maintained on a constant infusion of ketamine-midazolam for the remainder of the experiment. Femoral venous and arterial access were obtained, and heparin was administered for thromboprophylaxis. A pressure-flow velocity catheter was advanced to the renal artery, renal arterial pressure-flow velocity data were acquired. Functional renal denervation was then performed by administering an intrathecal bolus of ropivacaine, blocking both afferent and efferent neural transmission around the level of the bolus and resulting in renal sympatholysis given the location of preganglionic renal sympathetic neurons at the T10-T11 level of the spinal cord10,11. After waiting fifteen minutes for the intrathecal ropivacaine to reach peak effect, renal arterial pressure-flow velocity data were again acquired for analysis.
Data Analysis
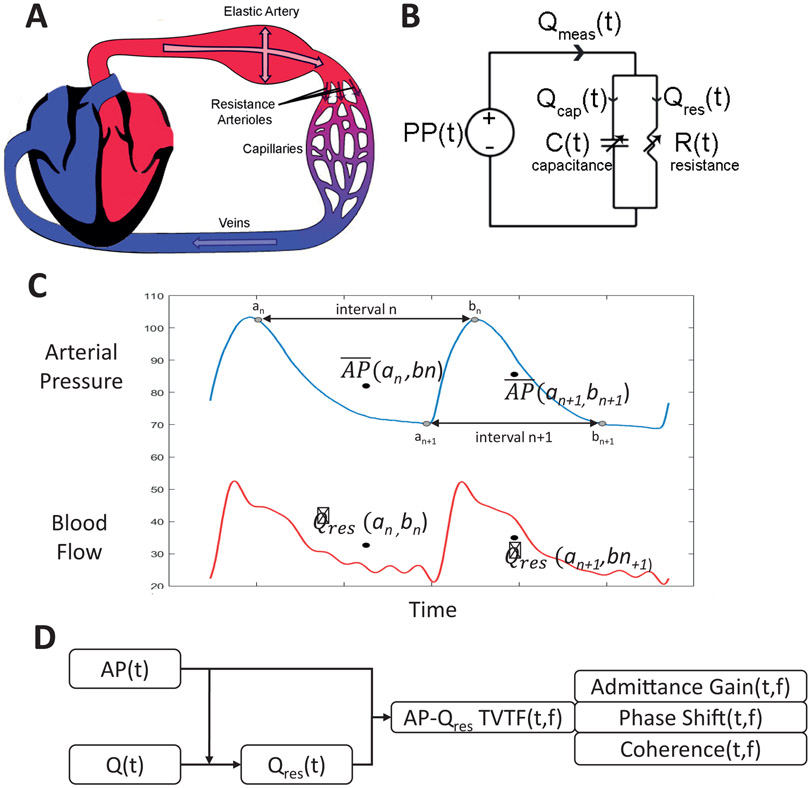
The relationship between AP and RSNA was analyzed using autospectral and cross-spectral wavelet analysis over a wide physiological frequency range (0.03 to 2.5 Hz) in order to identify potentially important sympathetic vasomotor frequencies in rabbits. In brief, AP-RSNA wavelet coherence and AP-RSNA wavelet phase shift were calculated across each five-minute recording, and group data was visualized by creating occurrence histograms across time using 20 bins of equal size across the ranges [0, 1] and [-π, π] for coherence and phase shift, respectively (illustrated graphically in Figure S1). The novel vasomotion analysis method is introduced alongside Figure 2 and further detailed in the Online Supplement.
Fig. 2.
Novel analysis method used to demonstrate renal sympathetic vasomotion. (A) Anatomic model showing pulsatile blood flow from the heart through an elastic artery and resistive arterioles. (B) Lumped circuit abstraction of anatomic model. (C) Interval detection method used to extract the resistive blood flow time series (Qres) from the raw blood flow time series using the arterial pressure signal. (D) High-level overview of data analysis process by which arterial pressure and blood flow signals are converted into the three components of the pressure-resistive flow time-varying transfer function: admittance gain, phase shift, and coherence.
Statistical Analysis
Tabular data are displayed as mean ± the standard error of the mean. Statistical testing of simple measures was conducted with two-tailed, paired t-tests and, where appropriate, RM-ANOVA with α = 0.05. Group occurrence histograms are displayed as mean data for each group with t-statistics computed for each independent variable pair (e.g., frequency-admittance gain bin) in order to convey directionality, magnitude, and consistency of differences but not statistical significance per se. These t-statistics were calculated using a two-tailed, paired t-test. Due to the high dimensionality of the occurrence data, statistical testing was performed with non-parametric cluster mass-based testing, which allows for a priori significance testing of non-independent, multidimensional data while addressing the inherent multiple comparisons problem12. This is illustrated in Figure S2 and detailed further in the Online Supplement.
Results
Rhythmic Renal Sympathetic Nerve Activity
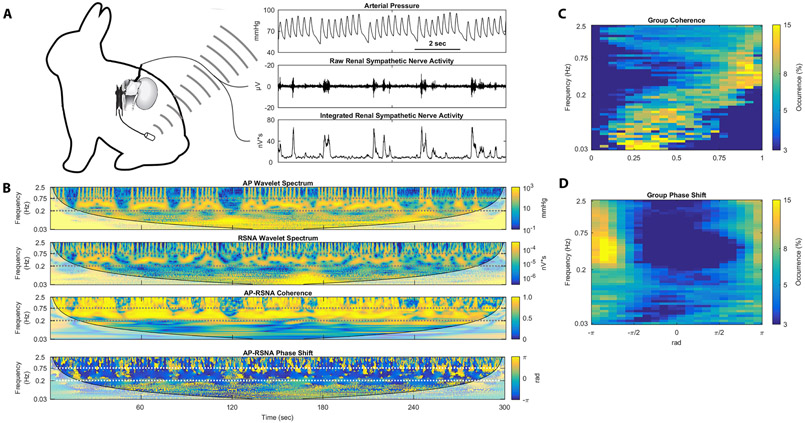
Rabbits were instrumented with RSNA electrodes and AP telemeters to identify sympathetic rhythms likely to give rise to renal sympathetic vasomotion (Figure 1A). Short representative tracings of AP and RSNA show rhythms occurring approximately every 2 seconds in both signals as well as the baroreflex control of RSNA, with low diastolic pressures followed by large bursts of RSNA. Five-minute sections of artifact-free AP and RSNA data underwent wavelet transformation to examine the rhythmic nature of AP and RSNA as well as cross-spectral analysis (Figure 1B). This cross-spectral analysis reveals high coherence between AP and RSNA from 0.2 to 0.75 Hz. The cross-spectral phase shift demonstrates a negative phase shift at this 0.2-0.75 Hz frequency range, meaning that oscillations in RSNA follow oscillations in AP, which is consistent with baroreflex-driven control of RSNA. Group data from all five rabbits is shown as occurrence histograms in Figure 1C and 1D. The coherence occurrence histogram shows that the AP-RSNA coherence is consistently highest in the 0.2-0.75 Hz frequency range, indicating that this is the frequency range with the strongest AP-RSNA relationship (Figure 1C). The phase shift occurrence histogram also shows negative phase shift behavior between 0.2-0.75 Hz, indicating baroreflex control of RSNA in this frequency range (Figure 1D). Baseline hemodynamics for these rabbits are shown in Table S1. Taken together, these data demonstrate strong, baroreflex-driven control of RSNA at the 0.2-0.75 Hz frequency range in rabbits likely to give rise to renal sympathetic vasomotion.
Fig. 1.
Rhythmic RSNA in conscious rabbits show frequency-dependent, baroreflex-driven coupling to arterial pressure rhythms. (A) Rabbits were chronically instrumented with arterial pressure telemeters and renal sympathetic nerve electrodes. (B) Arterial pressure wavelet spectrum, RSNA wavelet spectrum, AP-RSNA coherence, and AP-RSNA phase shift from one representative rabbit demonstrate AP-RSNA coupling between 0.2 and 0.75 Hz with consistently negative phase shift. (C) Group coherence occurrence histograms and (D) group phase shift occurrence histograms show high AP-RSNA coherence and negative AP-RSNA phase shift behavior across all five rabbits between 0.2 and 0.75 Hz.
Novel Method for Vasomotion Assessment
Previous attempts to investigate sympathetic control of the renal vasculature have relied on methods that assumed a rigid renal artery and a time-invariant pressure-flow relationship, failing to account for the reality of pulsatile flow measured in the elastic renal artery that in turn perfuses a circulation whose strong autoregulatory mechanisms dynamically control the relationship between renal AP and flow. We developed a novel method of assessing time-varying, rhythmic modulation of vascular resistance that accounts for the elastic nature of the artery in which flow is measured, and we then applied this method to study renal sympathetic vasomotion.
Pulsatile blood flow measured in an elastic artery can either travel into the capacitive artery or downstream across the arteriolar resistance (Figure 2A) and therefore arterial blood flow measurements depend on both arterial capacitance and arteriolar resistance. The renal circulation can then be modeled as a two-element Windkessel with time-varying resistance and capacitance, the electrical circuit abstraction of which is shown in Figure 2B. As renal sympathetic adrenergic innervation is concentrated most densely on the renal arterioles13, this novel method focuses on control of renal vascular resistance. Thus, the resistive component of arterial blood flow was isolated by using the AP waveform to identify short intervals over which the mean arterial blood flow equaled the resistive flow (Figure 2C, see proof in Online Supplement). Pressure, resistive flow, and resistance enjoy a simple, linear physical relationship. Thus, linear time-varying transfer function analysis of AP and resistive flow reveals modulation of vascular resistance as a function of time and frequency (Figure 2D). This is a powerful lens to view vascular control as the components of the time-varying pressure-resistive flow transfer function each have a clear physiological interpretation. Admittance gain, the transfer function gain normalized by vascular conductance, provides an index of the active buffering of AP oscillations by vascular resistance modulation. Phase shift provides information about timing of oscillations in AP and blood flow, with negative phase shift indicating AP oscillations leading vascular resistance modulation, zero phase shift indicating pressure-flow synchrony, and positive phase shift indicating blood flow oscillations leading resistance modulation. As a corollary, phase shift also implies causality, with negative phase shift consistent with baroreflex control of vascular resistance, zero phase shift consistent with passive Poiseuille flow, and positive phase shift consistent with autoregulatory control of vascular resistance. Coherence quantifies how closely resistive renal blood flow follows arterial pressure and is thereby inversely related to the amount of active resistance modulation at a given frequency over a particular time interval.
Thus, this assessment of vasomotion allows for a physiological interpretation of the vascular control of the circulation undergoing pressure-flow monitoring in real-time. Moreover, certain physiological vascular control mechanisms operate primarily at certain frequencies, and thus frequency-guided vasomotion analysis allows one to focus on vascular controllers of interest with greater sensitivity and specificity.
Renal Sympathetic Vasomotion in Surgically Denervated Conscious Rabbits
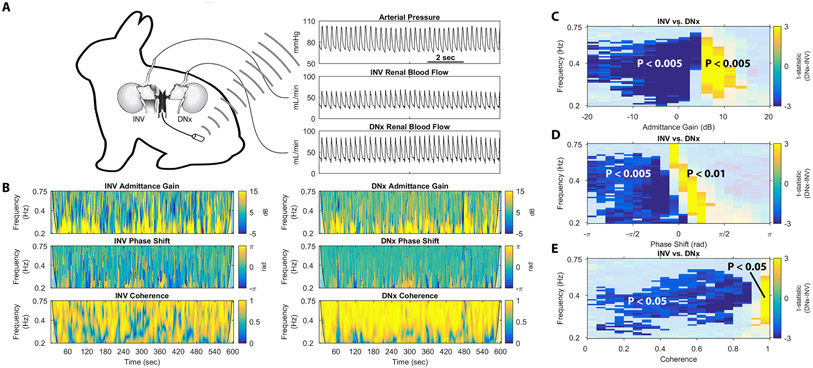
In order to assess renal sympathetic vasomotion, rabbits underwent unilateral renal denervation and were instrumented with an AP telemeter and bilateral RBF probes (Figure 3A), allowing for simultaneous assessment of two kidneys exposed to the same systemic milieu and perfusion pressure and differing solely by their sympathetic innervation. The novel vasomotion analysis method outlined above was used to calculate the relationship between AP and RBF of the innervated (INV) and surgically denervated (DNx) kidney at the 0.2-0.75 Hz frequency band previously found to contain a strong baroreflex-driven RSNA rhythm in rabbits (Figure 1B). The admittance gain plots for the INV and DNx kidneys of one rabbit show a high prevalence of low admittance gain behavior in the INV kidney that is absent in the DNx kidney, consistent with the elimination of a vasoconstrictive control mechanism by surgical renal denervation. Phase shift for the INV and DNx kidney of this rabbit reveals negative phase shift behavior in the INV kidney which is replaced by zero phase shift behavior in the DNx kidney, consistent with the replacement of a baroreflex-mediated control mechanism by passive laminar flow after surgical renal denervation. Coherence for the INV and DNx kidneys shows more low-coherence behavior in the INV kidney, consistent with a greater amount of active vascular control in the INV kidney than the DNx kidney at this important sympathetic frequency range.
Fig. 3.
Renal vasomotion analysis reveals significant differences in unilaterally denervated, bilaterally instrumented conscious rabbits. (A) Conscious, unilaterally denervated rabbit instrumented with an abdominal aortic pressure telemeter, a renal blood flow probe on the innervated (INV) kidney, and a renal blood flow probe on the surgically denervated (DNx) kidney. (B) Representative tracings of admittance gain for an INV kidney, admittance gain for a DNx kidney, phase shift for an INV kidney, phase shift for a DNx kidney, coherence for an INV kidney, and coherence for a DNx kidney from one rabbit are displayed. Non-parametric cluster mass-based statistical analysis demonstrated significant differences in the (C) admittance gain, (D) phase shift, and (E) coherence behavior for all 10 rabbits.
The results of non-parametric cluster mass-based statistical testing of group data for admittance gain behavior is shown in Figure 3C. As in the representative recording, negative admittance gain behavior is more prevalent in INV kidneys, manifesting as negative t-statistics in this region of the difference statistic map in Figure 3C, where DNx kidneys demonstrate more high admittance gain behavior, manifesting as positive t-statistics in this region. Significance testing revealed both a statistically significant low admittance gain cluster that was more prevalent in INV kidneys and a statistically significant passive admittance gain cluster that was more prevalent in DNx kidneys. This is consistent with the elimination of an active vasoconstrictive control mechanism and its replacement by passive transduction of AP in this sympathetic frequency range.
Statistical analysis of group data for phase shift is shown in Figure 3D. Negative phase shift behavior is significantly more prevalent in INV kidneys; in DNx kidneys, pressure-flow synchrony is significantly more common. This is consistent with the replacement of a baroreflex-driven vascular control mechanism with passive pressure-flow transduction.
Statistical analysis of group data for coherence is shown in Figure 3E. Low coherence behavior is more common in INV kidneys than DNx kidneys. Statistical testing revealed an expansive, significant cluster of low coherence behavior that was more common in INV kidneys, and a spatially concentrated, high-coherence cluster more common in DNx kidneys. As coherence is inversely related to active vascular control, this difference is consistent with the elimination of an active vascular control mechanism by renal denervation.
Baseline hemodynamics for these rabbits are shown in Table S2; note that there is no difference in mean renal blood flow between INV and DNx kidneys. Wavelet autospectral parameters did not differ between INV and DNx kidneys (Figure S3). Further vasomotion data can be found in Figure S4. The completeness of surgical renal denervation was functionally confirmed by evoking renal sympathetic vasoconstriction via the nasopharyngeal reflex (Figure S5).
Effect of Ganglionic Blockade on Sympathetic Vasomotion in Rabbits
We hypothesized that the observed vasomotion differences between INV and DNx kidneys arose due to the baroreflex-driven, rhythmic RSNA explored in Figure 1 and thus ganglionic blockade with hexamethonium would eliminate these differences by blocking autonomic outflow. To test this hypothesis, rabbits were administered an intravenous bolus dose of hexamethonium known to eliminate RSNA while AP and bilateral RBF were monitored14.
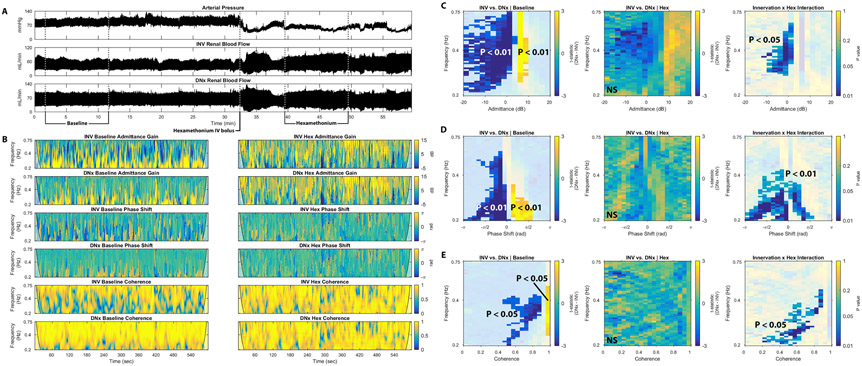
Figure 4A shows representative tracings of AP and bilateral RBF for one rabbit treated with hexamethonium.
Fig. 4.
Ganglionic blockade eliminates differences between INV and DNx kidneys in unilaterally denervated rabbits. (A) Tracings of arterial pressure, renal blood flow to the INV kidney, and renal blood flow to the DNx kidney before (Baseline) and after hexamethonium (Hex) administration show the hemodynamic effects of hexamethonium administration in one representative rabbit. (B) Representative tracings of admittance gain of the INV kidney before hexamethonium, admittance gain of the DNx kidney after hexamethonium, admittance gain of the DNx kidney before hexamethonium, admittance gain of the DNx kidney after hexamethonium, phase shift of the INV kidney before hexamethonium, phase shift of the INV kidney after hexamethonium, phase shift of the DNx kidney before hexamethonium, phase shift of the INV kidney after hexamethonium, coherence of the INV kidney before hexamethonium, coherence of the INV kidney after hexamethonium, coherence of the DNx kidney before hexamethonium, and coherence of the INV kidney after hexamethonium from this rabbit are displayed. (C) Statistical testing of admittance gain behavior from all nine rabbits shows significant INV-DNx differences in the baseline state that are eliminated after hexamethonium treatment and a significant interaction between innervation and ganglionic blockade. (D) Statistical testing of phase shift behavior from all rabbits shows significant INV-DNx differences in the baseline state that are eliminated after hexamethonium treatment and a significant interaction between innervation and ganglionic blockade. (E) Statistical testing of coherence behavior from all rabbits shows significant INV-DNx differences in the baseline state that are eliminated after hexamethonium treatment and a significant interaction between innervation and ganglionic blockade.
Figure 4B demonstrates the effect of ganglionic blockade on the three components of the time-varying pressure-resistive flow transfer function of each kidney in this representative rabbit. As in Figure 3, the INV kidney exhibits more negative admittance gain behavior than the DNx kidney in the baseline state. This difference is eliminated after administration of hexamethonium, resulting in nearly identical admittance gain plots between the INV and DNx kidneys. Mirroring Figure 3, the INV kidney shows more negative phase shift vasomotion while the DNx kidney shows pressure-flow synchrony. Ganglionic blockade abrogates this difference, resulting in strikingly similar phase shift plots for the INV and DNx kidney after hexamethonium administration. Where the DNx kidney is characterized by passive high-coherence behavior in the baseline state, the INV kidney exhibits low-coherence behavior consistent with active vasomotion. This difference is again eliminated by blocking autonomic ganglionic transmission. Note that movement artifacts are characterized by aberrant vasomotion, independent of innervation or ganglionic blockade.
Group data (n = 9) for the hexamethonium experiments are shown in Figure 4C-E, with Figure 4C focusing on admittance gain. In the baseline state, INV kidneys exhibit significantly more negative admittance gain behavior while DNx kidneys exhibit more positive admittance gain behavior; the differences between INV and DNx kidneys are eliminated by hexamethonium. Significance testing identified a statistically significant interaction between innervation and ganglionic blockade at this low admittance gain region, indicative that the effect of hexamethonium on admittance gain depends on renal innervation.
Figure 4D shows the group data for phase shift. Prior to hexamethonium, negative phase shift behavior is significantly more prevalent in INV kidneys while passive, pressure-flow synchrony is significantly more prevalent in DNx kidneys. Again, these differences were eliminated by ganglionic blockade. Significance testing again identified a statistically significant interaction between innervation status and ganglionic blockade at these areas of baseline difference in phase shift between INV and DNx kidneys, indicating that the effect of hexamethonium on phase shift depends on renal innervation.
The coherence group data shows a similar phenomenon (Figure 4E). In the setting of normal ganglionic transmission, low coherence behavior is significantly more prevalent in INV kidneys and high coherence is more prevalent in DNx kidneys, and this difference is eliminated after administration of hexamethonium. Figure 4X shows a statistically significant interaction between innervation status and hexamethonium.
In summary, administration of hexamethonium eliminates the difference between INV and DNx kidneys, consistent with the hypothesis that the RSNA rhythms observed in Figure 1 drive the observed differences in vasomotion between INV and DNx kidneys.
Group hemodynamics are shown in Figure S6, which demonstrates that hexamethonium significantly reduces AP and raises heart rate but does not significantly affect mean renal blood flow. Additional autospectral and cross-spectral data are shown in Figures S7-9; note that wavelet analysis shows that hexamethonium treatment decreases the spectral energy of the AP and bilateral RBF signals and that hexamethonium greatly impacts the time-varying transfer function of both INV and DNx kidneys.
Renal Sympathetic Vasomotion in Anesthetized Swine Undergoing Acute Functional Denervation
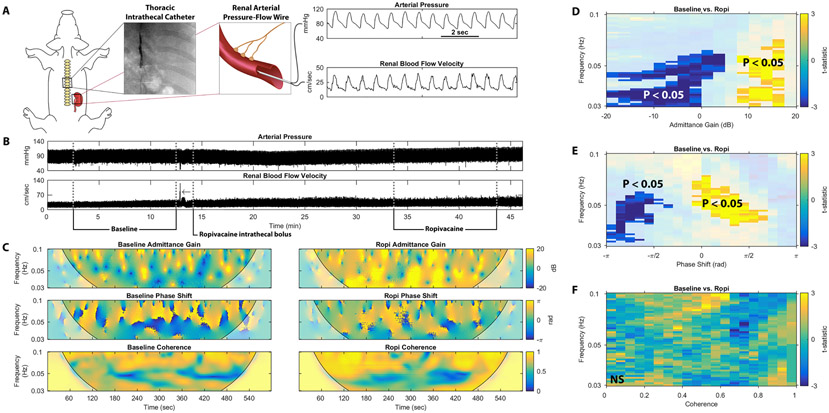
While the results of these rabbit studies establish a theoretical basis for renal sympathetic vasomotion, this technique needed to be validated with clinical technology in a more translational model. Thus, we tested this novel method in a swine model of acute renal denervation. Anesthetized swine were instrumented with an intrathecal catheter at the T10/T11 level (Videos S1-2) and an intravascular pressure-flow velocity wire was advanced to the renal artery (Video S3). While recording renal AP and blood flow velocity (RBFV), functional renal denervation was achieved by injection of an intrathecal bolus of ropivacaine, blocking preganglionic renal sympathetic nerve traffic (Figure 5A).
Fig. 5.
Renal vasomotion analysis reveals significant differences in anesthetized pigs undergoing functional renal sympathetic denervation. (A) Anesthetized pigs underwent placement of a thoracic intrathecal catheter and renal arterial pressure-flow wire. (B) Arterial pressure and renal blood flow velocity from one representative pig experiment are shown before (Baseline) and after a bolus of intrathecal ropivacaine (Ropi), which blocks renal sympathetic outflow. (C) Representative tracings of admittance gain in the baseline and post-ropivacaine states, phase shift in the baseline and post-ropivacaine states, and coherence in the baseline and post-ropivacaine states are shown for this representative pig. Non-parametric cluster mass-based statistical analysis shows significant differences in the (D) admittance gain and (E) phase shift but not (F) coherence behavior for all 9 swine.
The vasomotion analysis method was focused on the sympathetic range of 0.03-0.10 Hz in swine15. Of note, this frequency range is more analogous to that of man (0.04-0.15 Hz) and presents a clinically relevant challenge as it overlaps with the operating frequencies of renal autoregulatory mechanisms (0.02-0.25 Hz).
Figure 5B shows representative tracings of pulsatile AP and RBFV over the course of a single experiment. Time-varying pressure-resistive flow transfer function analysis from this representative pig study is shown in Figure 5C. Admittance gain plots for this experiment reveal a higher prevalence of low admittance gain behavior in the baseline state compared to the post-ropivacaine (Ropi) state, consistent with the elimination of active vasoconstriction by functional renal denervation. Phase shift plots for this experiment also reveal a reduction in negative phase shift behavior after administration of ropivacaine, indicating a reduction in baroreflex-driven renal vascular modulation. The negative phase shift behavior is replaced by positive phase shift behavior, consistent with active autoregulatory vascular control. Coherence is not obviously affected by ropivacaine administration in this representative experiment, indicating persistent active vasomotion in this frequency range despite renal sympatholysis.
Figure 5D-F show occurrence group data for all nine pigs. As in the representative experiment, low admittance gain behavior is more prevalent in the baseline state and high admittance gain behavior is more prevalent after renal sympatholysis (Figure 5D). Again, this is consistent with the abrogation of a vasoconstrictive controller operating at this known sympathetic vasomotor frequency.
Phase shift group data in Figure 5E shows that negative phase shift behavior is significantly more prevalent prior to administration of intrathecal ropivacaine and, after ropivacaine, positive phase shift behavior is significantly more prevalent. This is indicative of the replacement of baroreflex-driven vascular control by autoregulatory control.
Figure 5F shows group data for coherence for the swine study. Unlike surgical renal denervation in rabbits, functional renal denervation in swine does not significantly affect coherence, a marker of the amount of active renovascular control.
Baseline hemodynamics for swine are shown in Table S3, intrathecal ropivacaine did not significantly affect AP, heart rate, or RBFV. Autospectral data are shown in Figure S10; note that AP spectral power in this sympathetic frequency range is reduced after intrathecal ropivacaine administration, consistent with effective sympatholysis. Additional renal vasomotion data are found in Figure S11.
Renal Denervation Decreases Quantifiable Renal Sympathetic Vasomotion
The above multidimensional renal vasomotion data, while identifying a renal sympathetic vascular control signature in both rabbits and swine, are not readily interpretable for intraprocedural decision-making. To address this, renal sympathetic vasomotion was quantified as the cumulative occurrence of vasoconstrictive, baroreflex-mediated renal vasomotion arising at sympathetic vasomotor frequencies. Renal sympathetic vasomotion was significantly decreased in the surgically denervated kidney of all ten rabbits (Figure 6A). Intrathecal ropivacaine also significantly decreased quantifiable renal sympathetic vasomotion in swine (Figure 6B). Thus, this simplistic, a priori quantification method reflects changes in renal sympathetic outflow in two distinct preclinical models of renal denervation and could potentially be generalized for intraprocedural clinical use.
Fig. 6.
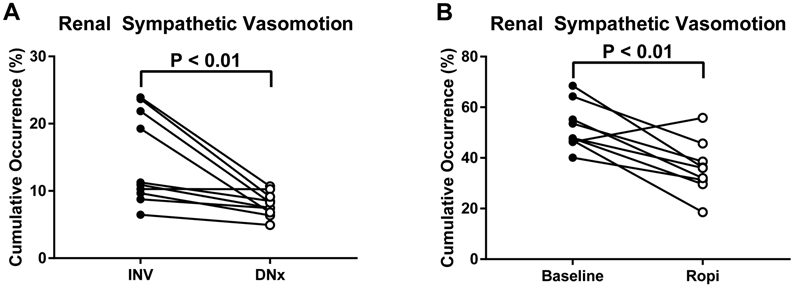
Quantification of renal sympathetic vasomotion. (A) Unilateral surgical renal denervation decreases the cumulative occurrence of negative admittance gain, negative phase shift behavior at sympathetic vasomotor frequencies in rabbits. (B) Functional renal denervation in swine decreases the cumulative occurrence of negative admittance gain, negative phase shift behavior at sympathetic vasomotor frequencies in swine.
Discussion
While, in general, the results from the rabbit and swine models of renal denervation are largely corroborative, a few key differences merit further discussion. The autoregulatory control mechanisms of the kidney operate between 0.02-0.25 Hz in all species in which they have been studied9; conversely, the sympathetic rhythms that give rise to Mayer waves occur at species-specific frequencies. In rabbits, the 0.2-0.75 Hz RSNA rhythm that we identified operates in a distinct frequency range with little overlap of that of the autoregulatory mechanisms. Conversely, in pigs and humans, the sympathetic rhythms operate entirely in the frequency range of the autoregulatory controllers. Thus, while renal denervation in both rabbits and swine reduced the amount of negative phase shift behavior, consistent with a reduction in baroreflex control, in rabbits this behavior was replaced by pressure-flow synchrony, consistent with a passive pressure-flow relationship, while in pigs it was replaced by positive phase shift behavior, consistent with active autoregulatory control. Similarly, coherence, which is inversely related to the amount of active vascular control, was increased by renal denervation in rabbits but not pigs. This reflects the fact that active autoregulatory vasomotion continues in pigs at the frequency of interest; whereas in rabbits there is no other vascular control mechanism that operates in this 0.2-0.75 Hz frequency range.
The most immediate potential implications of this technology pertain to the field of therapeutic renal denervation where interventionists have no way of validating the success of a procedure. Renal sympathetic vasomotion monitoring could be performed clinically using the same approach employed for swine with real-time assessment of renal sympathetic vasomotion used to provide intraprocedural feedback for clinicians. Measurement of renal arterial pressure-flow might be performed to measure baseline renal sympathetic vasomotion and then again after catheter-based renal denervation to verify effective denervation or, if the drop in renal sympathetic vasomotion were unsatisfactory, prompt an additional ablation. Such feedback could improve the efficacy, safety, and usability of this antihypertensive therapy. Moreover, as renal sympathetic vasomotion can be characterized non-invasively (e.g., using transabdominal Doppler to measure renal blood flow velocity and a volume-clamp device to measure AP), this technology could also be used to identify potential therapy responders prior to the procedure and to monitor for reinnervation after a successful procedure.
Beyond this, our approach has applications to other processes involving the sympathetic nervous system. As the sympathetic nervous system is the endogenous hemodynamic monitoring system and first-responder, the ability to detect acute subclinical activation of the sympathetic nervous system may improve our ability to identify patients at risk for hemodynamic compromise and to intervene earlier. A more clinically viable method may also help improve the diagnosis, treatment, and understanding of chronic diseases like dysautonomia, chronic heart failure, hypertension, and chronic kidney disease. Similarly, this method provides a powerful lens for assessing active vascular control of any origin. This approach could be used to characterize autoregulatory control on a patient-by-patient basis and to create technologies designed to optimize the perfusion pressure of vital organs.
This method makes two assumptions: (1) that perfusion pressure can adequately be approximated by arterial pressure and (2) the renal pressure-flow relationship can acceptably be described by a time-varying, two-component Windkessel lumped model. This is a significant advancement over previous analysis of the renal circulation that assumed a time-invariant (i.e. constant) pressure-flow relationship, which is incompatible with the known importance of renal autoregulation, and did not account for the elastic nature of the renal artery. This may explain why previous studies investigating the importance of sympathetic control of the renal vasculature have arrived at such heterogenous conclusions16-19. That said, all vascular trees are known to exhibit viscoelastic and inductive properties that are absent in our model. The renal circulation specifically is even more complex, boasting a dual series arteriolar network with filtration function.
Our study has several limitations. For example, we are unable to quantify the density of the intrathecal ropivacaine blockade, but we are certain that it is not as complete as the surgical denervation procedure. As early studies in humans indicate that full renal denervation was never achieved with the early endovascular radiofrequency ablation devices20, this may render the study more clinically relevant. Additionally, we did not simultaneously measure RBF and RSNA in the same kidney, which would have been a very elegant, albeit technically challenging, model to further characterize renal sympathetic vasomotion. Furthermore, this study was performed in healthy animals and leaves unaddressed the added complexity of pathophysiology of human cardiovascular disease and its potential impact on renovascular control.
In order to be translated to the clinic, similar preclinical studies in which renal denervation is performed with minimally invasive, state-of-the-art clinical devices and compared against a gold-standard surgical denervation would provide important insights while avoiding the circular logic of validating a new diagnostic technology with an unverifiable intervention. Moreover, acquisition of renal arterial pressure and flow velocity signals in patients undergoing renal denervation procedures should be designed to further address issues about feasibility and safety in human hypertensive subjects.
Perspectives
In this manuscript, we identified a baroreflex-mediated RSNA rhythm that we hypothesized would give rise to rhythmic modulation of the renal vasculature, termed renal sympathetic vasomotion. We developed a novel method for characterizing rhythmic vascular modulation using measurements of simultaneous arterial blood pressure and renal blood flow, and we tested it in three different models of renal denervation. First, we tested the technique in conscious rabbits that underwent unilateral surgical renal denervation and instrumentation with bilateral renal blood flow probes. In these rabbits, INV kidneys exhibited more negative admittance, negative phase shift, and low coherence behavior compared to their DNx counterparts, consistent with the presence of vasoconstrictive, baroreflex-mediated, active vasomotion caused by rhythmic RSNA. Next, ganglionic blockade with hexamethonium was used to acutely eliminate global sympathetic nerve activity, and this also eliminated the differences between INV and DNx kidneys, further corroborating the hypothesis that this vasomotion was the result of rhythmic RSNA. Finally, this novel method was tested in anesthetized pigs that underwent acute functional renal sympathetic denervation with thoracic intrathecal ropivacaine while renal artery pressure and flow velocity were monitored with a clinically approved intravascular catheter. Again, functional renal denervation reduced the amount of negative admittance gain and negative phase shift behavior, consistent with the abrogation of a vasoconstrictive, baroreflex-mediated renovascular control mechanism. Additionally, quantifying renal sympathetic vasomotion as the amount of vasoconstrictive, baroreflex-mediated renal vasomotion reflected expected differences in renal sympathetic outflow both in surgically denervated rabbits and functionally denervated pigs. In summary, this novel method for assessing vasomotion demonstrates active baroreflex-mediated, vasoconstrictive control of the renal circulation by the sympathetic nervous system (Graphical Abstract).
Supplementary Material
Novelty and Significance.
What is New?
We developed a novel technique called sympathetic vasomotion, a marker of sympathetic control of the renal vasculature that could be used as a clinical endpoint for evaluating effective renal denervation.
What is relevant?
Renal denervation is a paradigm-shifting antihypertensive intervention that has struggled to gain traction due to the inability to validate procedural success; sympathetic vasomotion could address this problem.
Summary
We introduced sympathetic vasomotion and demonstrated its validity both in a highly controlled rabbit model and a clinically relevant swine model of renal denervation. This technique could provide intraprocedural feedback for interventionists performing therapeutic renal denervation.
Acknowledgments:
The authors would like to thank John Lof, Elizabeth Stolze, Gretchen Fry, and Tara Rudebush for their technical assistance.
Sources of Funding: Supported by NIH P01 HL62222, NIH F30 HL118974, and a Nebraska Research Initiative Proof-of-Concept Grant.
Footnotes
Disclosures: PRP has received honoraria and travel expenses from Medtronic plc. PRP, IHZ, YSC, HW, and AMS have received a grant from Medtonic plc for further experiments based on this work. PRP, IHZ, YSC, HW, and AMS have submitted a relevant provisional patent application (Docket #18060P, Serial#PCT/US19/19110), and PRP, IHZ, and AMS have submitted a patent application (Docket#16041PCT, Serial #PCT/US17/23557) related to this work.
References
- 1.Esler M, Jennings G, Lambert G. Noradrenaline Release and the Pathophysiology of Primary Human Hypertension. Am J Hypertens. 1989;2:140S–146S. [DOI] [PubMed] [Google Scholar]
- 2.Zucker IH. Novel Mechanisms of Sympathetic Regulation in Chronic Heart Failure. Hypertension. 2006;48:1005–1011. [DOI] [PubMed] [Google Scholar]
- 3.Converse RL, Jacobsen TN, Toto RD, Jost CM, Cosentino F, Fouad-Tarazi F, Victor RG. Sympathetic overactivity in patients with chronic renal failure. N Engl J Med. 1992;327:1912–8. [DOI] [PubMed] [Google Scholar]
- 4.Bhatt DL, Kandzari DE, O’Neill WW, D’Agostino R, Flack JM, Katzen BT, Leon MB, Liu M, Mauri L, Negoita M, Cohen SA, Oparil S, Rocha-Singh K, Townsend RR, Bakris GL. A controlled trial of renal denervation for resistant hypertension. N Engl J Med. 2014;370:1393–401. [DOI] [PubMed] [Google Scholar]
- 5.Kandzari DE, Bhatt DL, Brar S, Devireddy CM, Esler M, Fahy M, Flack JM, Katzen BT, Lea J, Lee DP, Leon MB, Ma A, Massaro J, Mauri L, Oparil S, O’Neill WW, Patel MR, Rocha-Singh K, Sobotka PA, Svetkey L, Townsend RR, Bakris GL. Predictors of blood pressure response in the SYMPLICITY HTN-3 trial. Eur Heart J. 2015;36:219–27. [DOI] [PMC free article] [PubMed] [Google Scholar]
- 6.Esler M Illusions of truths in the Symplicity HTN-3 trial: generic design strengths but neuroscience failings. J Am Soc Hypertens. 2014;8:593–8. [DOI] [PubMed] [Google Scholar]
- 7.Böhm M, Kario K, Kandzari DE, Mahfoud F, Weber MA, Schmieder RE, Tsioufis K, Pocock S, Konstantinidis D, Choi JW, East C, Lee DP, Ma A, Ewen S, Cohen DL, Wilensky R, Devireddy CM, Lea J, Schmid A, Weil J, Agdirlioglu T, Reedus D, Jefferson BK, Reyes D, D’Souza R, Sharp ASP, Sharif F, Fahy M, DeBruin V, Cohen SA, Brar S, Townsend RR, SPYRAL HTN-OFF MED Pivotal Investigators. Efficacy of catheter-based renal denervation in the absence of antihypertensive medications (SPYRAL HTN-OFF MED Pivotal): a multicentre, randomised, sham-controlled trial. Lancet (London, England) [Internet]. 2020. [cited 2020 Jun 7];395:1444–1451. [DOI] [PubMed] [Google Scholar]
- 8.DiBona GF, Kopp UC. Neural control of renal function. Physiol Rev. 1997;77:75–197. [DOI] [PubMed] [Google Scholar]
- 9.Carlström M, Wilcox CS, Arendshorst WJ. Renal Autoregulation in Health and Disease. Physiol Rev. 2015;95:405–511. [DOI] [PMC free article] [PubMed] [Google Scholar]
- 10.Boratyński Z, Krakowska I. Sources of the Autonomic and Afferent Fibres of the Kidneys in Sheep. Bull Vet Inst Pulawy. 2005;49:141–145. [Google Scholar]
- 11.Schramm LP, Strack AM, Platt KB, Loewy AD. Peripheral and central pathways regulating the kidney: a study using pseudorabies virus. Brain Res. 1993;616:251–62. [DOI] [PubMed] [Google Scholar]
- 12.Maris E, Oostenveld R. Nonparametric statistical testing of EEG- and MEG-data. J Neurosci Methods. 2007;164:177–90. [DOI] [PubMed] [Google Scholar]
- 13.Barajas L, Wang P. Localization of tritiated norepinephrine in the renal arteriolar nerves. Anat Rec. 1979;195:525–534. [DOI] [PubMed] [Google Scholar]
- 14.Pellegrino PR, Schiller AM, Haack KKV, Zucker IH. Central Angiotensin-II Increases Blood Pressure and Sympathetic Outflow via Rho Kinase Activation in Conscious Rabbits. Hypertension. 2016;68:1271–1280. [DOI] [PMC free article] [PubMed] [Google Scholar]
- 15.von Borell E, Langbein J, Després G, Hansen S, Leterrier C, Marchant-Forde J, Marchant-Forde R, Minero M, Mohr E, Prunier A, Valance D, Veissier I. Heart rate variability as a measure of autonomic regulation of cardiac activity for assessing stress and welfare in farm animals — A review. Physiol Behav. 2007;92:293–316. [DOI] [PubMed] [Google Scholar]
- 16.Just A, Wittmann U, Ehmke H, Kirchheim HR. Autoregulation of renal blood flow in the conscious dog and the contribution of the tubuloglomerular feedback. J Physiol. 1998;506 (Pt 1):275–90. [DOI] [PMC free article] [PubMed] [Google Scholar]
- 17.Schiller AM, Pellegrino PR, Zucker IH. Renal nerves dynamically regulate renal blood flow in conscious, healthy rabbits. Am J Physiol Regul Integr Comp Physiol. 2016;310:R156–66. [DOI] [PMC free article] [PubMed] [Google Scholar]
- 18.Abu-Amarah I, Ajikobi DO, Bachelard H, Cupples WA, Salevsky FC. Responses of mesenteric and renal blood flow dynamics to acute denervation in anesthetized rats. Am J Physiol. 1998;275:R1543–52. [DOI] [PubMed] [Google Scholar]
- 19.DiBona GF, Sawin LL. Effect of renal denervation on dynamic autoregulation of renal blood flow. Am J Physiol Renal Physiol. 2004;286:F1209–18. [DOI] [PubMed] [Google Scholar]
- 20.Krum H, Schlaich M, Whitbourn R, Sobotka PA, Sadowski J, Bartus K, Kapelak B, Walton A, Sievert H, Thambar S, Abraham WT, Esler M. Catheter-based renal sympathetic denervation for resistant hypertension: a multicentre safety and proof-of-principle cohort study. Lancet. 2009;373:1275–1281. [DOI] [PubMed] [Google Scholar]
Associated Data
This section collects any data citations, data availability statements, or supplementary materials included in this article.


