

Shaped microparticles with tailored surface chemistry template monodisperse drops compatible with molecular and cellular assays.
Abstract
The ability to create uniform subnanoliter compartments using microfluidic control has enabled new approaches for analysis of single cells and molecules. However, specialized instruments or expertise has been required, slowing the adoption of these cutting-edge applications. Here, we show that three dimensional–structured microparticles with sculpted surface chemistries template uniformly sized aqueous drops when simply mixed with two immiscible fluid phases. In contrast to traditional emulsions, particle-templated drops of a controlled volume occupy a minimum in the interfacial energy of the system, such that a stable monodisperse state results with simple and reproducible formation conditions. We describe techniques to manufacture microscale drop-carrier particles and show that emulsions created with these particles prevent molecular exchange, concentrating reactions within the drops, laying a foundation for sensitive compartmentalized molecular and cell-based assays with minimal instrumentation.
INTRODUCTION
The ability to break up a fluid volume into many uniformly sized compartments that do not cross-talk underlies a number of applications in life science research and diagnostics. Microfluidic technologies have been used to create uniform isolated volumes in microscale wells (1–4), valved chambers (5, 6), or through the generation of monodisperse drops from co-flowing streams of water and oil (7–11). Breaking up a sample volume into smaller uniform compartments enables the concentration of single entities (e.g., cells or molecules) in a subset of these compartments while minimizing background, leading to increased sensitivity and reduced reaction time. Leveraging these capabilities, microfluidic compartmentalization approaches have led to numerous advances in counting individual nucleic acids and proteins [i.e., enabling digital polymerase chain reaction (PCR) and digital enzyme-linked immunosorbent assay (ELISA)] (12–16) and analyzing individual cells based on their secretions or molecular components. The association of a solid phase with each compartment also enables surface-based reactions and barcoding, which has led to transformative applications in single-cell analysis and chemical synthesis (14, 15, 17–19), but can be limited by random encapsulation processes (19).
Although providing substantial value, the need for considerable microfluidic expertise or new chips and costly commercial instruments to perform compartmentalization and measurement has slowed the adoption of these technologies. In a laboratory setting, expertise in microfabrication and clean room infrastructure is necessary to manufacture microfluidic chips; moreover, skills in operation of microfluidic devices and development of custom optical or electronic readers are needed even if one has microfluidic chips available. Alternatively, a potential user can acquire commercial instruments that are customized for each particular application (e.g., digital PCR, single-cell RNA sequencing, and digital ELISA), often with multiple instruments needed to first break up the fluid sample into small volumes, and then analyze those volumes.
A fundamental challenge has been that a collection of droplets in an immiscible fluid is only metastable, requiring energy to create them and surface effects to help stabilize the interface between the two immiscible phases (20–23). Precise control of flow rate/pressure with complex instrumentation is needed to stably generate uniform drop volumes, and specialized surfactants are needed to stabilize this out-of-equilibrium state. Coalescence of drops leads to thermodynamic equilibrium, resulting in nonuniform drop sizes that can change with temperature or time. Instead of addressing this challenge by controlling the fluid dynamics of breakup or kinetics of re-coalescence, we focus on engineering the interfacial energy of a drop as a function of volume. We probe how changes to the functional form of this volume-energy landscape could result in the robust creation of uniform drop sizes, thermodynamically promoting drop breakup above a critical volume.
By modulating the volume-energy landscape of a growing drop using microscale particles, we describe a mechanism to create uniform nanoliter-scale aqueous compartments with simple mixing and centrifugation steps. Drops are captured by three-dimensional (3D) structured microscale particles—drop-carrier particles (DCPs)—comprising materials with tailored interfacial tensions: an inner hydrophilic layer and an outer hydrophobic layer (Fig. 1 and fig. S1). We generate uniform drops by mixing, pipetting, or agitating a system with DCPs, aqueous, and immiscible phases. One drop is associated with each particle, an assembly we refer to as a dropicle, which differs from conventional emulsions that are stabilized by amphiphile surfactants or Pickering emulsions that are stabilized by a multitude of nanoparticles (24, 25). We show how pairs of C-shaped DCPs that moved apart in space split volumes unevenly above a critical volume, with one DCP associated with a preferred volume. Multiple such pairwise interactions can give rise to a strong mode in the distribution of volumes across a set of interacting and splitting dropicles. We provide a framework for understanding and controlling this behavior in terms of engineering the volume-energy curve (V-E curve) for a DCP. We also demonstrate an approach to manufacture DCPs at the microscale, overcoming challenges with patterning materials with different wetting properties into a 3D-shaped microstructure. Once DCPs are manufactured, tens of thousands of dropicles can be formed simultaneously in parallel by simply pipetting for 30 s, which corresponds to kilohertz drop production rates. Last, we show that drops generated using this approach are compatible with enzymatic and cell-based bioassays. Leveraging the biocompatibility, we demonstrate a proof-of-concept assay measuring secretion of matrix metalloproteases (MMPs) from single cells and further show that the assay can detect MMP secretion inhibitors.
Fig. 1. Simultaneous formation of monodisperse dropicles by batch mixing and centrifugation operations.
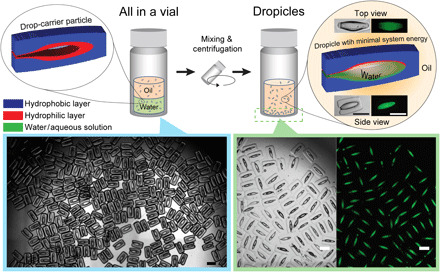
DCPs are manufactured with poly(ethylene glycol) (PEG) and poly(propylene glycol) (PPG) as the hydrophilic and hydrophobic layers, respectively. A collection of DCPs is shown suspended in ethanol on the left. Dropicles with aqueous solution containing fluorescent dye in a toluene continuous phase are shown in the bottom of a vial on the right with brightfield and fluorescence channels. Dropicles are generated in the filled configuration, ivmin described in Fig. 2A, with minimal system energy. Insets in the right show a single dropicle in brightfield and fluorescein isothiocyanate (FITC) channels. Scale bars, 500 μm.
A main advantage of our approach is the ability for vendors to centrally manufacture DCPs that can be distributed to end users without expertise in microfluidics and liquid handling. These users can then perform assays using monodisperse nanoliter-scale drops through simple shaking and agitation using widely available laboratory equipment. A number of emerging approaches to fabricate shaped microparticles could also be applied to functionalize DCPs (26, 27) and scale their size to be compatible with analysis by flow cytometers (28, 29). We expect that a number of assays previously demonstrated using lab-on-a-chip infrastructure could be implemented in this “lab-on-a-particle” format in the future, providing greater access to the deployment of powerful biological assays.
RESULTS
Theory of dropicle formation
In a two-phase system, the interfacial energy increases linearly with surface area; for an isolated sphere of volume (V = 4πr3/3), the energy scales as 4πr2 ~ V(2/3) (Fig. 2A), a concave function of volume. For spherical drop emulsions, there is no local minimum in drop size, and coalescence of adjacent drops is favored due to the overall decrease in surface area. If the volume versus interfacial energy (V-E) relationship is instead convex, it is energetically favorable for a drop to split into equal volumes. This process of splitting will continue ad infinitum, again leading to no local minimum in drop size. However, if a V-E curve transitions from convex to concave, a drop splitting into two daughter drops is expected to break evenly for smaller volumes and break asymmetrically for larger volumes, with one holding a preferred volume close to the inflection point in the V-E curve, and the other containing the remaining volume (fig. S2). For an overall fluid volume exceeding the number of drops multiplied by the preferred drop volume for each drop, this process of asymmetric splitting is expected to accumulate drops with the preferred volume.
Fig. 2. Physics of dropicle generation.
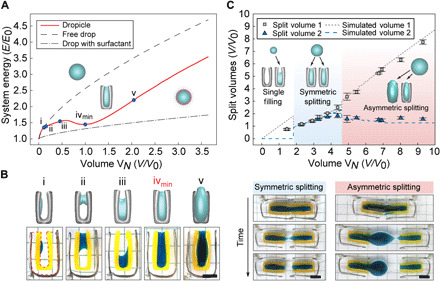
(A) Simulated volume-energy (V-E) curves showing that free drops and surfactant-stabilized drops in an immiscible solution have monotonically increasing energies with V2/3, resulting in a thermodynamic driving force for coalescence. DCPs (solid red line), however, have a V-E curve with a local minimum when the DCP is substantially filled with fluid (iv). Other configurations of filling are shown along the curve (i to v). The energy and volume corresponding to the local minimum are defined as E0 and V0, respectively. (B) Aqueous volumes (blue dye) form different minimal surface shapes when interacting with centimeter-sized DCPs depending on filling volume. The numerical model predictions for (i) to (v) according to (A) and the experimental morphologies of spherical cap, bridge (catenoid), partial filling, and complete filling are shown on the top and bottom, respectively. Scale bar, 1 cm. (C) On the basis of the V-E curve in (A), splitting of a drop between two DCPs is theoretically expected to depend on the overall fluid volume (dashed lines), with three regimes of splitting behavior expected. Experimental results (symbols) for centimeter-sized DCPs agree with predictions such that splitting is symmetric within a range of volumes from 2 to 4, while one daughter droplet is maintained at a preferred split volume above a critical total volume, VN > ~4. Time-lapse images are shown for representative experiments in the symmetric and asymmetric splitting regimes. Scale bar, 1 cm. Photo credit: Alexis Joo, UCLA.
We hypothesize that such a convex-concave functional form is achievable using microstructures at the length scale commensurate with the desired drop size. Practically, an initial concave region of the V-E curve is expected for small volumes as a small drop behaves as a spherical cap on a surface until it achieves dimensions commensurate with the confining microstructure. This “spreading” phase at low volume, in which increasing volume is accompanied by a decreasing rate of increase in surface energy (concave energy), sets the stage for an “inflationary” phase (convex energy) wherein interfacial energy increases more rapidly with increasing volume as the drop fills the microstructure dimensions. Last, at larger volumes, the V-E curve returns to a concave form consistent with the behavior of a free drop. These conditions are not met with simple topologies such as drops interacting with planes or parallel plates (fig. S3A), indicating that additional confining surfaces are required, with a trade-off that increasing confinement inhibits drop loading.
Physical implementation
DCPs interacting with a wetting fluid create unique energy minima in the V-E relationship, leading to thermodynamic stabilization of drops of specified volumes (Fig. 2). Balancing the need for confined wetting surfaces while also enabling entry of fluid, we design DCPs as C-shaped particles consisting of an inner hydrophilic region and an outer hydrophobic layer (Fig. 1). The stable dropicle configuration is simulated using a volume-constrained minimal surface algorithm for the two solid and two fluid phases (16). The method is an Merriman-Bence-Osher (MBO) scheme with auction dynamics for the volume constraint (see Materials and Methods). Our numerical model indicates an initial spreading phase as a low volume of the dispersed fluid forms a single spherical cap (Fig. 2A, location i). A reduced slope in the V-E curve corresponds to the formation of a bridging catenoid (Fig. 2A, locations ii and iii). At intermediate volumes, the drop interacts with more than two surfaces, and a local maximum is observed (Fig. 2A, locations iii and iv). Once the interior volume is filled, we observe an inflationary phase in which energy increases with volume at an enhanced rate (Fig. 2A, between locations iv and v). At even larger volumes, the behavior approaches the asymptotic condition of a spherical drop (Fig. 2A), returning to a concave V-E relation. Therefore, DCPs interacting with a fluid volume yield V-E curves, satisfying sufficient criteria to split asymmetrically and would accumulate preferred volumes based on our theory (Fig. 2B). We also simulate V-E curves for additional C-shaped DCP structures with the same width but decreasing length and aspect ratio. The V-E curves for these structures all follow a similar general shape; however, the drop volume at which there is a change in concavity scales with the overall length of the DCP (fig. S3B). These results suggest that the DCP geometry can be tuned to yield a preferred dropicle size.
The model also provides information on the contact angles that support stable drops for this DCP design. In general, the dispersed phase should wet the internal region of the DCP (θin < 90), and the external region should not be more wetting than the internal region (θout > θin). Outside of this regime, complex nonfilling configurations were observed in our simulations. Additional considerations for practical design of DCPs are also necessary (see Materials and Methods).
Experimental observation of asymmetric splitting
We experimentally observe splitting behavior for a volume spanning two centimeter–scale DCPs that are slowly separated. The system is large enough to precisely control the position of neighboring particles while small enough so that capillary effects dominate the mechanics (Fig. 2, B and C, movies S1 and S2, and fig. S4). We adjusted the density of the fluids and separation speed of DCPs to maintain a Bond number and Reynolds number << 1. For example, we used poly(propylene glycol) (PPG) as a continuous phase to match the density between the aqueous and oil phases. At different aqueous volumes in a single DCP, we experimentally observe transitions in drop morphology matching the theoretical transitions from a spherical cap to bridging catenoid on the narrowest approach of the C-shape, followed by filling of the inner cup of the C, and, lastly, wetting of the entire inner surface and filling of the interior volume (Fig. 2B). For the splitting of drops spanning two DCPs, we observed two main regimes that notably matched theoretical predictions based on the V-E curves (Fig. 2C). Instead of splitting evenly for all volumes, we found that there was one regime where daughter volumes were partitioned evenly (total volumes, VN, of ~2 to 4 V0, where V0 is the volume at the local minimum of energy), but above a critical total volume of ~4 V0, one of the daughter volumes is at a fixed preferred volume, independent of the total volume. For example, for total volumes > 4 V0, the smaller daughter drop maintained a quite uniform preferred volume of 1.59 ± 0.14 V0. Notably, the volume with energy minimum at V0 falls close to the inflection point volume of 2.09, where we see a change in curvature from convex to concave in the V-E relation for a DCP. This analysis can be extended to multiple DCPs holding a range of different fluid volumes that are merging and splitting as they are mixed. Given the asymmetric splitting behavior, this system is expected to lead to accumulation of DCPs holding the preferred volume while one DCP holds any remaining volume.
Optical transient liquid molding enables manufacture of microscale DCPs
We manufacture DCPs at two orders of magnitude smaller length scale (~100 μm), addressing the challenges of manufacturing particles (i) comprising two materials with differing interfacial energies, viscosity, and density in complex shapes at the microscale and (ii) scaling the manufacture to automatically produce a sufficient number of uniform particles for large-scale experiments. We manufacture DCPs using an optofluidic technique we developed called optical transient liquid molding (OTLM) (27), in which we co-flow separate prepolymer solutions of poly(ethylene glycol) diacrylate (PEGDA) and poly(propylene glycol) diacrylate (PPGDA), shape the streams to the desired cross-sectional morphology in a microchannel flow, and then photocrosslink this configuration. The particle shape is sculpted along one direction using inertial fluid effects and in an orthogonal direction using photolithographic processes (see Materials and Methods and Fig. 3A) (30, 31). The cross-sectional structure can be controlled by tuning the ratio of volumetric flow rates of prepolymer solutions and the sequence of pillars along the channel length, which deform the prepolymer streams in a controlled manner. We previously developed open source software, FlowSculpt (32) and uFlow (33), to rapidly simulate and design the cross-sectional pattern of a co-flow quantitatively and apply it to simulate the locations of the PPGDA and PEGDA streams here (Fig. 3B).
Fig. 3. Manufacturing of microscale DCPs with uniform dimensions.
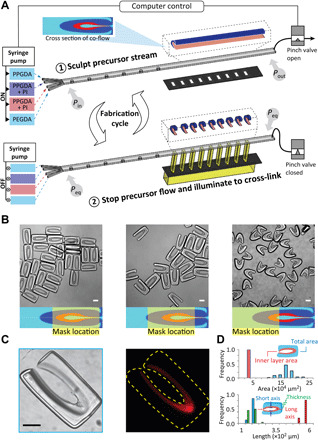
(A) Polymer precursors of PEGDA and PPGDA are co-flowed with and without PI. The co-flowing streams are shaped using inertial flow sculpting to create a concentric C-shaped structure in the cross section of the flow with PEGDA internal to PPGDA. A pinch valve is then closed to stop the flow leading to pressure at the inlet (Pin) and outlet (Pout) to equalize to an equilibrium pressure, Peq. The sculpted stream is exposed to UV light through a mask to polymerize the PEGDA and PPGDA regions mixed with PI. The valve is opened, and polymerized particles are collected before the cycle is repeated. (B) Images of three types of DCPs manufactured by shifting the patterned UV mask along a direction perpendicular to the precursor flow. A cross section of the precursor flow is shown on the bottom, calculated from numerical simulations. Enclosed DCPs, shown on the left, are used for most of the studies in this work. (C) Brightfield and fluorescent images of a DCP after incubation with resorufin, a red fluorescent molecule which partitions into the inner PEG layer. (D) DCP dimensions are reported for a batch of 90 particles, showing the uniformity of the manufacturing process. Scale bars, 100 μm.
We successfully manufacture microparticles comprising two separate materials with different miscibility properties and substantial differences in viscosity. When two precursor fluids are used in OTLM, the precursors should be miscible with each other to avoid the effects of finite interfacial tension at the interface of the co-flow, which would act against the deformation generated by flow inertia. Here, we leveraged the ability to make PEGDA and PPGDA miscible with each other when suspended in ethanol. Moreover, to eliminate the asymmetry created by the density difference between the co-flowing streams, which can lead to differential settling over a finite flow stopping time (34), PEGDA and PPGDA are diluted to 60 and 90% (v/v), respectively, with ethanol so the density of all liquids is matched at 0.987 g/ml. The viscosity of the PPGDA solution (38.9 mPa·s) is approximately five times the viscosity of the PEGDA solution (7.0 mPa·s); however, this difference does not lead to notable changes in the flow shape. We tune the concentration of the photoinitiator (PI) in the two precursors so that the speed of the photocrosslinking is uniform between the two materials in the final cured particles. The concentration of PI is 1.3 and 2.6% in diluted PEGDA and PPGDA, respectively. These conditions lead to successful polymerization of both precursors as contiguous particles (Figs. 1 and 3B), where a difference in optical contrast between the two material components of the particles is easily observable. We confirm the presence of the inner PEG layer by incubating with the fluorescent dye, resorufin, which selectively partitions into PEG compared to PPG (Fig. 3C) (35).
We manufacture DCPs with different shapes in large batches using parallel exposure through a mask aligned along the downstream channel length (Fig. 3A). By shifting the position of the ultraviolet (UV) illumination through the mask location, different shaped DCPs are formed (Fig. 3B). All three types of DCPs have an internal PEG region but differ in the degree of encapsulation of this region by the outer PPG layer. Although all particle types can contain stable aqueous droplets, we focus on DCPs with the highest level of encapsulation (i.e., enclosed DCPs) for most experiments reported herein. Because each exposure yields >30 DCPs using the arrayed mask, we can achieve large batch sizes and throughput of manufacture through multiple cycles of flow shaping, stopping, and UV exposure (where a complete cycle required ~7 s). The process leads to uniform structures of DCPs across the length of the exposed channel (Fig. 3D). The cost to produce 15,000 DCPs with our current OTLM setup is estimated to be ~$45, which can be theoretically reduced to ~$4 by extending the length of the downstream channel to ~24 cm (30).
Particle-shape uniformity
We measure the dimensions of a population of DCPs to assess the reproducibility of the manufacturing process (Fig. 3D). Our theory suggests that the cavity size and wettability of the inner layer of a DCP govern the volume of a dropicle that forms. The internal PEG layer surrounding the cavity had an area of 20,000 ± 1400 μm2, and the short and long axes of the void space encapsulated by the inner PEG layer are 95 ± 9 and 451 ± 13 μm. Overall, the dimensions are uniform within 6.57%—a metric that helps define the minimum expected uniformity of the dropicle dimensions.
Generation of dropicles
The protocol for producing dropicles from DCPs requires no specialized equipment (see Materials and Methods). We demonstrate successful dropicle formation using a number of continuous phases that are immiscible with water, including poly(dimethylsiloxane-co-diphenylsiloxane) (PSDS), PPG, decanol, and toluene. Fluorinated oils, commonly used for generating microfluidic emulsions, are not used because it results in aggregation of DCPs, presumably because the interfacial tension between the fluorinated continuous phase and PPG is not sufficiently small. By modifying the outer hydrophobic layer to contain fluorine groups, compatibility with fluorinated oils may be possible in the future. For low-viscosity continuous phases like toluene and decanol, we disperse DCPs in the continuous phase first, since interactions with a small volume of aqueous sample are readily achievable through rapid mixing. For high-viscosity continuous phases like PSDS, DCPs are first mixed with the aqueous sample to ensure that there is enough interaction between the particles and the aqueous phase before mixing. We found that dropicle generation is largely insensitive to the process of mixing, e.g., pipetting or centrifugation, and the initial dispersion of DCPs in an aqueous or continuous phase. PSDS is chosen as an oil phase for biological proof-of-concept experiments described herein because we found that there was modest transfer of water into this continuous phase over days (47 and 17% loss in area and fluorescent intensity, respectively, within 2 days), suggesting compatibility with the time scale of enzymatic reactions (hours) or maintenance of cells (days).
Monodispersity
Microscale dropicles formed in PSDS and toluene have a preferred drop volume as suggested by theory and centimeter-scale experiments (Fig. 4A). The microstructure of the surrounding particles not only templates the drops in the emulsion [supporting a nominal diameter (ND) of ~200 μm] but also sustains their shape over a long period of time, resisting the usual coarsening process found in standard spherical drop emulsions. Once created, dropicles in toluene maintained the same mean volume for at least 3 days as long as the dispersed phase was prevented from evaporating (fig. S5), while dropicles formed in PSDS had a slow decay in volume over a 3-day period (fig. S6). The drop ND is affected by the total volume of the aqueous phase in the experiment. For volumes less than a saturation value, ~20-fold of the entire void volume of the particles, a high percentage of the population is only partially filled with the aqueous phase (Fig. 4B). Once filled, a strong mode in the distribution of ND is observed at ~200 μm, in agreement with theoretical predictions that asymmetric splitting occurs above a critical total volume for interacting DCPs, leading to a preferred volume accumulating in daughter drops (Fig. 2C).
Fig. 4. Formation of uniform dropicles.
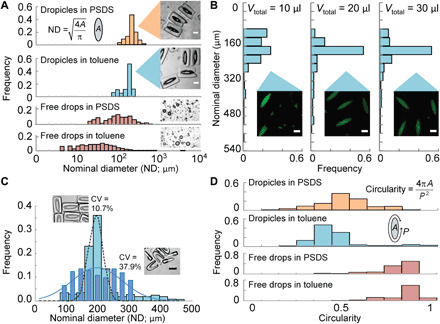
(A) Histograms of drop ND for dropicles formed in PSDS and toluene. Histograms of free drops in PSDS and toluene stabilized by 0.5% Pluronic surfactant show a much wider distribution in ND (>100% CV). (B) Effect of aqueous volume on dropicle formation. When the volume of the aqueous phase is too low, it affects the distribution of NDs among dropicles. The distribution in ND appears to saturate with a mode at 200 μm once the aqueous fluid reaches 20 μl (~20-fold of the total holding volume of the particles). (C) Histograms of ND for enclosed particles and open particles. Increased uniformity is observed for enclosed particles. (D) Histograms of a shape metric, i.e., circularity, for dropicles and free drops, showing that dropicles also are stabilized with a unique nonspherical morphology defined by the engineered template. Scale bars, 100 μm.
DCP shape was shown to affect monodispersity (Fig. 4C). Enclosed particles (opening size of 60 μm, which is 6% of the circumference of the interior cavity) had a tighter distribution, CV ~ 11%, and a well-defined mode in droplet ND. However, shorter aspect ratio particles with a wider opening (85 μm, blue diamonds, N = 185) have almost fourfold higher variation in size (CV ~ 38%). We observe that two or more particles with the larger opening can stably assemble around a single droplet (Fig. 4C, inset), leading to more variation in drop sizes. Thus, a smaller opening is desirable for monodispersity of dropicles.
Monomorphology
The distribution in the circularity of dropicles formed in toluene and PSDS is shown in Fig. 4D, showing a sharp contrast between a standard emulsion and our engineered system. In agreement with our centimeter-scale experiments, the shape of dropicles minimizes the interfacial energy of the system and is influenced by the DCP cavity shape, whereas surfactant-stabilized drops adopt spherical shapes to minimize energy.
Dropicles prevent cross-talk
The ability to easily create monodisperse drops supported by a solid phase opens up many new opportunities for molecular and cellular assays. One fundamental requirement for these assays is the ability to isolate compartments within the system to minimize molecular cross-talk. For conventional surfactant-stabilized droplets, surfactants can potentially enhance transportation of target molecules between phases depending on the properties of surfactants and target molecules (36). This contrasts with the dropicle system, in which the aqueous droplet is stabilized by only a solid phase without surfactants or with reduced quantity of surfactants, potentially minimizing cross-talk. DCPs also inhibit transfer of dye when agitating dropicles. After mixing dropicles containing separate dye solutions (0.6 and 70 kDa in size), in a toluene continuous phase, we observe the same respective populations of drops without notable exchange of the dye (Fig. 5A and fig. S7). Less than 9.6.% transfer of the 0.6-kDa dye was observed on average, while 7.4% transfer of the larger 70-kDa dye was observed after 4 min of dynamic agitation by pipetting. This minimal cross-talk following mixing may result from the outer hydrophobic layer of the DCP yielding a physical barrier along with the thermodynamic stability of the supported drops.
Fig. 5. Molecular isolation and enzymatic reactions in dropicles.
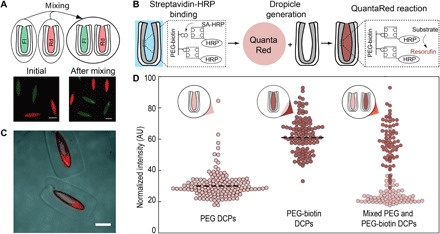
(A) Images taken after introduction and before agitation (left) and after agitation (right) of two groups of dropicles loaded with either biotin-4-fluorescein (Fl; 0.6 kDa, green) or rhodamine B isothiocyanate dextran (Rd; 70 kDa, red) in toluene continuous phase. The dyes do not transfer between dropicles following loading. (B) Schematic of the HRP-catalyzed reaction of QuantaRed reagent in which resorufin accumulates within the dropicle. SA-HRP, streptavidin linked to HRP. (C) Fluorescence images showing the generation of resorufin in dropicles. Fluorescence intensity in the PEG layer increases substantially with the presence of HRP and is higher than in the surrounding aqueous solution in the dropicle. (D) Particles manufactured with and without biotin show selective affinity for streptavidin-HRP and differential generation of resorufin fluorescence. Mixed particles show similar intensity levels to particles in separate wells, indicating minimal cross-talk of generated fluorescent product in a PSDS continuous phase. The dashed lines show the mean for particles with and without affinity to streptavidin. Scale bars, 200 μm. AU, arbitrary units.
Enzymatic assays in dropicles
Leveraging the ability to prevent cross-talk between compartments, we demonstrate a solid-phase enzymatic reaction in which the fluorescent products of the reaction accumulate in dropicles formed in an enzyme-compatible PSDS continuous phase. We modify the inner PEG layer of the DCPs with biotin (see Materials and Methods), incubate with streptavidin-labeled horseradish peroxidase (HRP), wash away unbound enzyme, and generate dropicles with aqueous QuantaRed reagent (see Materials and Methods). After generation of dropicles, we incubate the system for various times to generate fluorescent resorufin product. HRP catalyzes the formation of resorufin, which accumulates in a dose-dependent fashion within the dropicle yielding an easily observed fluorescent signal within a 30-min time period (Fig. 5, B and C). Dropicles in which resorufin is enzymatically generated did not cross-talk with neighboring dropicles without reactions. We mix DCPs manufactured with and without biotin with 1 nM streptavidin-HRP and perform the QuantaRed assay as described above. After 24 hours of incubation, we can easily distinguish the mean intensity levels in the dropicles with affinity to streptavidin-HRP and those without (Fig. 5D). Notably, the signal for the enzymatic turnover to resorufin shows similar intensity levels in these same particles incubated in separate wells, suggesting that transport of product through the oil phase did not contribute to signal intensity (Fig. 5D). Moreover, the resorufin produced also accumulates in the inner PEG layer, yielding a higher fluorescent intensity in this layer, indicating the capability to concentrate signal in this region for future assays. For future applications, non-partitioning dyes can be chosen as the reporter in the assay, e.g., fluorescein. This proof of concept suggests that dropicles formed from PPG/PEG-layered DCPs can be formed within continuous phases that are enzyme compatible and prevent cross-talk, two key elements necessary for enzymatically amplified bioassays.
To summarize, dropicles can form uniform drops and remain stable while modulating the transport of reporter dyes. Dropicles with a PSDS continuous phase preserve >80% of a small-molecule dye after 2 days under static conditions and >90% of 0.6 and 70 kDa dyes after minutes of dynamic agitation. Notably, there is negligible cross-talk over days for resorufin. Exchange under static conditions is likely due to partitioning into the oil phase while in dynamic conditions is likely driven by transient interactions/collisions between dropicles. This is supported by the fact that exchange occurs at almost equal rates for both 0.6 and 70 kDa dyes. Notably, these behaviors contrast with conventional droplets surrounded by fluorinated oil and formed with surfactant under static conditions. In these conditions, transport of fluorescein occurs over days, resorufin over hours, and rhodamine over minutes (37).
Single-cell secretion assays in dropicles
We also demonstrate the compatibility of dropicles formed in PSDS with a single-cell secretion assay, demonstrating maintenance of cell function and viability. We first load LNCaP prostate cancer cells into media along with a fluorogenic substrate sensitive to a broad spectrum of MMPs, proteases involved in cancer cell invasion and immune evasion (38). This solution is mixed with DCPs, excess fluid removed, and then PSDS is added to form dropicles. Loading leads to a distribution of the number of cells occupying each dropicle, generally following Poisson statistics (Fig. 6A). A live/dead assay characterizing enzymatic activity and membrane permeability indicates that cells remain viable for at least 4.5 hours, the maximum time period evaluated (Fig. 6B). Viability tracks with similar measurements for cells in the same buffer solution but not exposed to PSDS or maintained within dropicles. Cells also secrete active MMPs that cleave the fluorogenic substrate, leading to an accumulated fluorescence signal which correlates with the number of cells encapsulated within each dropicle (R2 = 0.72; Fig. 6C). Dropicles containing single cells secrete MMPs at levels that lead to a distinguishable fluorescence signal compared to dropicles without any encapsulated cells (Fig. 6D), P < 0.001 after a 4-hour incubation. Signal is distinguishable by at least 40 min following incubation (P < 0.05), likely due to the accumulation of signal within the small dropicle volume without leakage (fig. S9). The intensity of dropicles increases with time at a rate that depends on the number of encapsulated cells (Fig. 6E). Heterogeneity in the signal among dropicles containing the same number of cells likely corresponds to the heterogeneity of MMP secretion for single cells (38). We also show that signal is significantly suppressed in response to coincubation of LNCaP cells with a cocktail of two secretion inhibitors, i.e., brefeldin A and monensin, indicating that the assay measures active secretions from encapsulated cells (Fig. 6F). The effect of the inhibitor is apparent within 40 min of incubation (P < 0.05), suggesting the potential for rapid drug screening with single-cell precision.
Fig. 6. Cell secretion assay in dropicles.
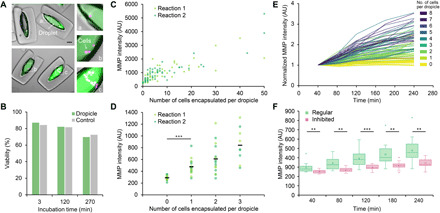
(A) Overlay images of dropicles with no cells or various numbers of LNCaP cells (magenta) encapsulated. MMP signal (green) is higher with more encapsulated cells. Scale bar, 100 μm. (B) Viability of LNCaP encapsulated in dropicles versus the control group loaded in a well plate is plotted over 4.5 hours of incubation. The viability tests were conducted under the same conditions as the MMP assay, i.e., with cells in RPMI 1640 media and at room temperature. (C) Fluorescence intensity of MMP-cleavable fluorogenic substrate in dropicles as a function of the number of cells encapsulated per dropicle after 4 hours of incubation. Two reactions are performed using different batches of particles (reactions 1 and 2). Note that cell counts are estimated when the cell number exceeds 20 due to cell clustering. (D) Fluorescence intensity due to MMP activity for dropicles with 0 to 4 cells after 4 hours of incubation in dropicles. Black bars represent the mean intensity across the two reactions. ***P < 0.001 using two-tailed Student’s t test. (E) Fluorescence intensity due to MMP activity as a function of incubation time in dropicles, i.e., at 40, 80, 120, 180, and 240 min, respectively. For each dropicle, the intensity at each time point was normalized to the signal at 40 min. Colormap from lighter to darker corresponds to an increase in the number of cells (i.e., 0 to 8) encapsulated per dropicle. (F) Single-cell secretion assay in dropicles with or without inhibitor assayed at 40, 80, 120, 180, and 240 min (n = 15 to 16). The fluorescence signal due to MMP activity of the inhibited group is significantly lower and increases more slowly over time. **P < 0.05 and ***P < 0.001 using two-tailed Student’s t test.
DISCUSSION
There is substantial potential, across a range of fields, for the use of thermodynamically stabilized microdroplets associated with solid compartments. The ability for each compartment to be chemically modified with affinity ligands, nucleic acids, or sensing molecules is a key feature for future controlled biological reactions and barcoding. DCPs can also be manufactured with photodegradable components to release reagents or recover the aqueous contents of dropicles (39). Because each microdroplet is associated with a chemically defined compartment and the compartment can be sized to hold only a single particle (fig. S8) or cell, limitations of Poisson loading of cells and beads in standard emulsions can be overcome (19). Such systems enable single-molecule analysis and synthesis (19, 18, 30) or a way to barcode molecules for single-cell analysis (14, 15). The digitized solid structure provides a general substrate to store information from reactions that can then be read using cost-effective large footprint fluorescence readers (40, 41) or large particle flow cytometers (29). The solid phase of DCPs can also impart new physical properties into monodisperse emulsions—such as modifications in shape, buoyancy, stiffness, magnetic properties (27), or stimuli responsiveness (42)—enabling new opportunities for lab-on-a-particle technologies.
MATERIALS AND METHODS
Auction dynamic simulations
Droplet encapsulation simulation preparation
We start with a triangulated mesh defining the hydrophobic and hydrophilic surfaces of the DCP. This is mapped to a 3D Cartesian grid in which we classify the Cartesian grids into one of four categories: hydrophobic, hydrophilic, droplet, or oil domain. To achieve this, we apply the improved parity algorithm developed for an Eulerian solvent excluded surface (43). For a given point x, we draw a half-line emanating from x and count how often it crosses the triangles. The number of crosses determines the phase in which x is located in.
Droplet encapsulation simulation
In the microscale particle droplet system, the dominant interaction comes from the surface tension between different phases. By ignoring the other forces, we solve for a minimum surface energy configuration using the auction dynamics algorithm (44) on the Cartesian grid. Auction dynamics generates a discrete timestep approximation of volume-preserving mean curvature motion of the interfacial boundaries between phases, preserving the volumes of all the phases. As a result, configurations that are stationary under the flow are surface energy minimizers. We iterate the algorithm from an initially spherical droplet on top of the DCP and follow its evolution until it remains stationary under the auction dynamics.
Droplet encapsulation system after processing
We compute the contact area of each pair of phases to further compute the surface energies of the energy minimization configuration. To systematically address this issue, we first smooth the initial nonsmooth sharp interface by running a few steps of Laplacian smoothing. Then, we apply the marching cubes algorithm (45) to extract the level set from the smeared interface. Last, we triangulate the extracted level set by using the Computational Geometry Algorithms Library (CGAL) software and compute its contact area straightforwardly.
Design considerations for DCPs
There are additional considerations for practical design of DCPs that are not accounted for in the model explained in the “Theory of dropicle formation” section. For example, particles should be largely closed such that multiparticle-supported drops (46) are energetically unfavorable and monodispersity is preserved (Fig. 4C). In addition, our model assumes that interfacial energies will dominate the behavior of the system, which is valid when factors such as buoyancy remain small. The Bond number, Bo = ∆ρgd2/∆σ, for our experimental system is ~4 × 10⁻⁴, reinforcing this assumption. Here, ∆ρ is the density difference between the disperse and continuous phases, g is the acceleration due to gravity, d is the width of the interior void of the DCP, and ∆σ is the difference between the interfacial tension of the disperse phase and continuous phase with the interfacial tension between the disperse phase and hydrophilic internal material. In our centimeter-scale system, we also matched densities to achieve a Bo < 0.1. The interfacial tension of the outer hydrophobic material with the continuous phase should also be small compared to thermal energy to prevent aggregation of particles due to favorable particle-particle contacts on their outer surfaces.
Microfluidic channel design
We designed the DCPs using custom software built in the lab and open to the public, called uFlow (33). uFlow enables rapid computation of a 3D particle shape formed from the intersection of an extrusion of the flow stream cross-sectional shape and an extrusion of an orthogonal 2D optical mask shape. Real-time design of the particle shape is possible since the advection maps associated with the inertial flow around a presimulated library of pillars are stored, and the flow deformation from a pillar sequence is rapidly computed without fluid dynamic simulations. We discovered that six micropillars adjacent to the channel wall can generate a cross-sectional flow pattern with concentric layers with only a small opening on one side, which is suitable for DCPs when patterned with a rectangular optical mask (see inset of “cross section of co-flow” in Fig. 3).
Microfluidic chip fabrication
We fabricate microfluidic chips using soft lithography. The chips contain sequences of pillars designed to create the cross-sectional flow pattern with concentric layers of the precursor materials. The microchannel also contains a long downstream region after the pillars to expose a linear array of patterns to increase fabrication throughput. The silicon mold for replicating poly(dimethylsiloxane) (PDMS) channels is 300 μm in thickness and thus required a specialized process. We spin a first layer of SU-8 2100 (MicroChem Corp.) to a thickness of 200 μm onto a wafer, recover thermal stress, and spin a second layer of SU-8 with 100 μm in thickness. Then, we follow standard protocols for photolithography to develop the mold. We cure PDMS (Sylgard 184, Dow Corning) on top of the mold to replicate the microchannel, peel the PDMS device off the wafer, punch holes for inlets and an outlet, and bond it to a glass slide coated with a thin layer of PDMS using air plasma. The thin PDMS layer matches the surface properties across all walls of the microchannel. The PDMS precursor is spun on the slide at 1000 rpm for 30 s and cured in an oven overnight.
Polymer precursors
PEGDA (Mw ≈ 575; 437441, Sigma-Aldrich) and PPGDA (Mw ≈ 800; 455024, Sigma-Aldrich) are chosen to be the polymer precursors for the hydrophilic and hydrophobic layers of the DCPs, respectively. These materials satisfy interfacial tension conditions of importance and are compatible with the OTLM process. The PI (2-hydroxy-2-methylpropiophenone, Darocur 1173, 405655, Sigma-Aldrich) is introduced with the two precursors.
Optical transient liquid molding
We use OTLM, comprising a flow-shaping step followed by a UV exposure step, to manufacture DCPs (27). First, we pump a co-flow of polymer precursors into a microchannel with a designed sequence of micropillars at a Reynolds number of 5 to 40. Fluid inertia of the flow around the micropillars leads to an irreversible deformation of an initial rectangular co-flow pattern to a complex cross-sectional pattern. A sequence of micropillars with various sizes and lateral positions can be used to design a wide diversity of cross-sectional patterns, including concave, convex, diamond, stretched bars, etc. (47). Once a pattern is developed downstream of the microchannel containing the micropillars, we rapidly stop the flow and equalize pressure in the channel by simultaneously stopping the upstream pump and occluding the outlet tubing downstream with a pinch valve. Within 1 s, we illuminate the sculpted precursor stream with a patterned UV light for 500 ms to photocrosslink the precursor stream and solidify multiple 3D-shaped particles. The patterned UV light is created by coupling collimated UV light to a chrome mask with an array of transparent rectangles (140 μm by 600 μm). Following photocrosslinking, the downstream pinch valve is reopened, and the pump is restarted to flush cured particles into a container outside of the microchannel and to redevelop the precursor flow stream for the next UV illumination cycle. This manufacturing cycle is automated using LabVIEW to fabricate large batches of particles. We also confirm the reproducibility of particle shape across a population of the particles (28). After fabrication, all particles are collected in a 50-ml centrifuge tube and rinsed with a volume of ethanol more than 1000 times the sample volume to eliminate the effect of noncross-linked reagents. The particles were stored in ethanol for later usage.
Protocol for dropicle generation
Protocol for dropicle generation: PSDS
Two approaches are used to generate dropicles using PSDS as a continuous phase. In the first approach, we disperse DCPs in an aqueous sample with 0.5% (w/v) Pluronic F-127, which is used to avoid aggregation. We suspend ~300 DCPs in 1 ml of aqueous solution and let them settle in a glass vial and remove the supernatant without DCPs until the aqueous volume is reduced to ~<50 μl. We inject 1 ml of PSDS into the vial and pipette the solution with DCPs, PSDS, and the aqueous phase one to two times. The DCPs, which are denser than other random satellite drops, are left to settle in the vial for about 30 min. If needed, the supernatant of PSDS is exchanged to remove satellite drops without particles. In the second approach, used to track enzymatic turnover of a fluorogenic substrate in the same particles over time, the particles adhere to the bottom of a well plate for fluid transfer and compartmentalization operations. Specifically, particles suspended in ethanol are transferred to a well plate with a hydrophobic surface (catalog number: 351143, Corning), and the medium is exchanged after three washes with phosphate-buffered saline (PBS) with 0.5% (w/v) Pluronic. To characterize the stability of the volume of dropicles over time, food coloring dye (catalog number: S05189, Thermo Fisher Scientific) dissolved in PBS (300 μl) is used to visualize the stability of the volume of dropicles over time. Within seconds, the aqueous solution is fully dispersed around and inside the particle cavity, and excess liquid is removed while an aqueous phase remains trapped within particle cavities. Last, 500 μl of PSDS is added on top of the particles to complete the compartmentalization of the aqueous phase.
Protocol for dropicle generation: Toluene
To reduce the numbers of particle-free satellite drops and adhesion between particles and the glass container, we use a mix of toluene with 10 to 15% ethanol. Our protocol to create dropicles in toluene differs from PSDS as follows: (i) We disperse ~300 DCPs (initially in ethanol) in 1 ml of the toluene/ethanol mix; (ii) we inject a small volume of aqueous solution, typically ~20 μl (~17 times of the total void volume of particles); (iii) we then pipette the solutions vigorously in a 20-ml scintillation glass vial (VWR International) with a hydrophobic coating, which is introduced by incubation with Rain-X (ITW Global Brands) for 2 days; (iv) following mixing, we centrifuge down the solution in the vial at 2000 rpm for 5 min at 25°C and; (v) lastly, pipette away any large visible satellite drops. We cover the vial with parafilm for long-term storage. Moreover, we also confirm that the dropicles can be generated without ethanol using a similar procedure as used for a PSDS continuous phase.
Imaging and image processing
We image dropicles and free drops using fluorescence microscopy to evaluate the formation and uniformity in drop size. For clear visualization, biotin-4-fluorescein (100 μg/ml; catalog number: 50849911, Thermo Fisher Scientific) is added to the PBS. We use a custom Python code to analyze the images of the dropicles and free drops. For dropicles, the code detects the fluorescent regions representing drops and filters out regions with size larger than twice or smaller than 0.375 times the nominal size of the particle (corresponding to satellite drops not associated with particles). We measure size/circularity/total intensity for targets and export an image after filtering, comparing it to the brightfield image for confirmation. For the study of long-term stability, we also filter using circularity to ensure that only dropicles are investigated while ignoring spherical satellite drops.
Method of reaction inside of dropicles
We incorporate additional steps in the protocols for DCP manufacture and dropicle generation to perform reactions in dropicles: biotinylation of the inner PEG layer and molecular binding in dropicles. In the fabrication step, we use a mix of PEGDA, ethanol, biotin-PEG-acrylate (catalog number: PG2-ARBN-5k, Nanocs) in dimethyl sulfoxide as the precursor polymer for the inner layer to enable grafting of biotin within the PEG layer during photocrosslinking. After fabrication, we rinse the particles and store them in ethanol. Before use, particles are dispersed in PBS with 0.5% (w/v) Pluronic and then incubated with a bulk solution of 1 nM streptavidin-conjugated HRP (catalog number: N100, Thermo Fisher Scientific). After binding of the streptavidin-HRP and multiple rinsing steps, we reduce the aqueous volume to ~<50 μl. We mixed 10-acetyl-3,7-dihydroxyphenoxazine (ADHP) concentrate, enhancer solution, and stable peroxide solution at a ratio of 1:50:50 to make 500 μl of QuantaRed solution. We perform reactions within dropicles using two approaches. In the first approach, immediately after the mixing step, we inject the QuantaRed solution into the vial, gently agitated for 5 s, inject PSDS, and then pipette the solution up and down to generate dropicles in a glass vial, which took <2 min. The brightfield and fluorescence images of dropicles are taken after 30 min of incubation. In the second approach, particles suspended in ethanol are added to a 12-well plate (catalog number: 351143, Corning). Once particles settle in the well, excess ethanol is removed, followed by three washes with PBS with 0.5% (w/v) Pluronic. Then, 300 μl of streptavidin-HRP solution at desired concentrations is added and incubated for a given time period, followed by three additional washes. Next, 500 μl of the QuantaRed solution, as described in the first approach, is added to the well to wet the particles, with excess removed immediately. Last, 500 μl of PSDS is added to form isolated dropicles. Next, fluorescence and brightfield images of the dropicles in oil are obtained at desired time points using a fluorescence microscope.
Cell assays in dropicles
Cell preparation
The LNCaP cell line was purchased from the American Type Culture Collection. Cells were cultured in RPMI 1640 medium (11875119, Gibco, Life Technologies) supplemented with 10% (v/v) fetal bovine serum (FBS; 16000044, Gibco, Life Technologies) and 1% penicillin-streptomycin (15140122, Gibco, Life Technologies). Cell culture was maintained in a humidified incubator at 37°C with 5% CO2 environment. After reaching 70 to 80% confluency, cells were harvested by treating with 0.05% trypsin-EDTA (25300054, Gibco, Life Technologies) for 3 min at 37°C. Then, cells were pelleted by centrifuging for 3 min at 1200 rpm and resuspended into a solution of choice for further use.
MMP secretion assay
Harvested cells were first stained with 10 μM cell tracker (C34565, Invitrogen) for 30 min at 37°C and then washed and resuspended in RPMI 1640. Cell solution was mixed with MMP substrate (13510, AAT Bioquest) to constitute a 150-μl mixture with 2 × 10⁴ cells and a final MMP substrate concentration of 1% in RPMI 1640. The mixture was immediately added to a 24-well plate where particles are already seeded and washed following the same protocol as described in the previous section. The well plate was centrifuged at 500 rpm for 1 min, then excess solution was removed, and PSDS was added to form dropicles. For MMP inhibition assays, a flask of 70 to 80% confluent LNCaP cells was treated with 1× protein transport inhibitor cocktail (00498003, eBioscience, Invitrogen), which contains 10 μM brefeldin A and 2 μM monensin, for 1.5 hours at 37°C with 5% CO2. Then, cells were harvested and stained with cell tracker following the same protocol as described above. The 150-μl solution mixture was constituted with 1% MMP substrate, 1× protein transport inhibitor cocktail, and 2 × 10⁴ treated cells in RPMI 1640. Subsequent steps of cell seeding, centrifugation, and droplet formation followed the same protocols as the regular MMP secretion group. We monitored the kinetic readings of dropicles formed with both nontreated and treated cells at room temperature for up to 4 hours.
Viability assay
Harvested cells were stained with 2 μM calcein acetoxymethyl ester (C3099, Invitrogen) and 3 μM propidium iodide (P3566, Invitrogen) for 30 min at 37°C with 5% CO2 in RPMI 1640. Then, a 150-μl mixture with 2 × 10⁴ cells was seeded into the 24-well plate containing washed particles. Dropicles were formed following the same protocol as described above. For the control group, the same cell mixture in RPMI 1640 was added to the well plate directly. The fluorescent signals of both groups were monitored at room temperature for up to 4.5 hours. Note that cells are not kept in culture conditions during the viability test, i.e., 37°C with 5% CO2 in culture 1640 supplemented with 10% FBS, but instead used the testing conditions that were the same as that of the MMP secretion assay.
Imaging and image processing
Imaging for all cell experiments was conducted using a Nikon Ti-E fluorescence microscope. For MMP secretion experiments, the MMP signal was imaged under fluorescence excitation using the fluorescein isothiocyanate (FITC) filter set with an exposure time of 400 ms, and the cell tracker signal was imaged with the Cy5 filter set with an exposure time of 200 ms. For viability experiments, the calcein AM signal was imaged using the FITC filter set with an exposure time of 400 ms; the propidium iodide signal was imaged with the tetramethyl rhodamine isothiocyanate filter set with an exposure time of 400 ms. Brightfield images were obtained for both MMP secretion and viability experiments for the same field of view as fluorescence images. ImageJ was used to analyze the images, where fluorescent regions were detected, and regions of interest were defined for each dropicle. The average intensity of the area was extracted to represent the signal of each dropicle. The circular satellite drops were excluded from analysis using parameters such as circularity and area.
Supplementary Material
Acknowledgments
Funding: We acknowledge support from the NIH Grant #R21GM126414 and the Simons Foundation Math+X Investigator Award #510776. Author contributions: D.D.C. conceived the overall concept of DCPs and dropicles. C.-Y.W. further developed the initial idea, conceived and implemented the fabrication approach to create DCPs, designed protocols to form dropicles, performed experiments, and analyzed data. J.D. and C.-Y.W. performed microgel encapsulation experiments. M.O. developed protocols for dropicle formation and conducted enzymatic amplification and cell and cross-talk experiments. A.J. and J.d.R. conducted scaled-up experiments and analysis. B.W., M.J., and A.L.B. developed the numerical model and performed modeling of minimal energy configurations. K.H. and A.L.B. developed the analytical framework. All authors contributed to analyzing and interpreting data to formulate the theoretical framework. D.D.C. wrote the manuscript. C.-Y.W. designed and prepared initial figures. J.D. and D.D.C. contributed additional figures and modifications. All authors contributed to writing and editing the manuscript and additional design of the figures. A.L.B. and D.D.C. supervised the project. Competing interests: D.D., C.-Y.W., and M.O. are inventors on a pending patent application related to this work filed by The Regents of the University of California (NO. US20190381497, Filed 23 August 2019). D.D., A.B., B.W., J.D., and K.H. are inventors on a pending patent application related to this work filed by The Regents of the University of California (NO. PCT/US2020/031522, Filed May 5 2020). The authors declare no other competing interests. Data and materials availability: All data needed to evaluate the conclusions in the paper are present in the paper and/or the Supplementary Materials. Additional data related to this paper may be requested from the authors. Reprints and permissions information is available at https://sciencemag.org/help/reprints-and-permissions.
SUPPLEMENTARY MATERIALS
Supplementary material for this article is available at http://advances.sciencemag.org/cgi/content/full/6/45/eabb9023/DC1
REFERENCES AND NOTES
- 1.Yeh E.-C., Fu C.-C., Hu L., Thakur R., Feng J., Lee L. P., Self-powered integrated microfluidic point-of-care low-cost enabling (SIMPLE) chip. Sci. Adv. 3, e1501645 (2017). [DOI] [PMC free article] [PubMed] [Google Scholar]
- 2.Ogunniyi A. O., Story C. M., Papa E., Guillen E., Love J. C., Screening individual hybridomas by microengraving to discover monoclonal antibodies. Nat. Protoc. 4, 767–782 (2009). [DOI] [PMC free article] [PubMed] [Google Scholar]
- 3.Rondelez Y., Tresset G., Tabata K. V., Arata H., Fujita H., Takeuchi S., Noji H., Microfabricated arrays of femtoliter chambers allow single molecule enzymology. Nat. Biotechnol. 23, 361–365 (2005). [DOI] [PubMed] [Google Scholar]
- 4.Shen F., Du W., Kreutz J. E., Fok A., Ismagilov R. F., Digital PCR on a SlipChip. Lab Chip 10, 2666–2672 (2010). [DOI] [PMC free article] [PubMed] [Google Scholar]
- 5.Lee C.-C., Snyder T. M., Quake S. R., A microfluidic oligonucleotide synthesizer. Nucleic Acids Res. 38, 2514–2521 (2010). [DOI] [PMC free article] [PubMed] [Google Scholar]
- 6.Ottesen E. A., Hong J. W., Quake S. R., Leadbetter J. R., Microfluidic digital PCR enables multigene analysis of individual environmental bacteria. Science 314, 1464–1467 (2006). [DOI] [PubMed] [Google Scholar]
- 7.Wang B. L., Ghaderi A., Zhou H., Agresti J., Weitz D. A., Fink G. R., Stephanopoulos G., Microfluidic high-throughput culturing of single cells for selection based on extracellular metabolite production or consumption. Nat. Biotechnol. 32, 473–478 (2014). [DOI] [PMC free article] [PubMed] [Google Scholar]
- 8.Beer N. R., Hindson B. J., Wheeler E. K., Hall S. B., Rose K. A., Kennedy I. M., Colston B. W., On-chip, real-time, single-copy polymerase chain reaction in picoliter droplets. Anal. Chem. 79, 8471–8475 (2007). [DOI] [PubMed] [Google Scholar]
- 9.Anna S. L., Bontoux N., Stone H. A., Formation of dispersions using “flow focusing” in microchannels. Appl. Phys. Lett. 82, 364–366 (2003). [Google Scholar]
- 10.Kawakatsu T., Kikuchi Y., Nakajima M., Kawakatsu T., Kikuchi Y., Nakajima M., Regular-sized cell creation in microchannel emulsification by visual microprocessing method. J. Am. Oil Chem. Soc. 74, 317–321 (1997). [Google Scholar]
- 11.Unger M. A., Chou H.-P., Thorsen T., Scherer A., Quake S. R., Monolithic microfabricated valves and pumps by multilayer soft lithography. Science 7, 113–116 (2000). [DOI] [PubMed] [Google Scholar]
- 12.Song H., Tice J. D., Ismagilov R. F., A Microfluidic System for Controlling Reaction Networks in Time. Angew. Chem. Int. Ed. 42, 768–772 (2003). [DOI] [PubMed] [Google Scholar]
- 13.Witters D., Sun B., Begolo S., Rodriguez-Manzano J., Robles W., Ismagilov R. F., Digital biology and chemistry. Lab Chip 14, 3225–3232 (2014). [DOI] [PubMed] [Google Scholar]
- 14.Macosko E. Z., Basu A., Satija R., Nemesh J., Shekhar K., Goldman M., Tirosh I., Bialas A. R., Kamitaki N., Martersteck E. M., Trombetta J. J., Weitz D. A., Sanes J. R., Shalek A. K., Regev A., McCarroll S. A., Highly Parallel Genome-wide Expression Profiling of Individual Cells Using Nanoliter Droplets. Cell 161, 1202–1214 (2015). [DOI] [PMC free article] [PubMed] [Google Scholar]
- 15.Klein A. M., Mazutis L., Akartuna I., Tallapragada N., Veres A., Li V., Peshkin L., Weitz D. A., Kirschner M. W., Droplet Barcoding for Single-Cell Transcriptomics Applied to Embryonic Stem Cells. Cell 161, 1187–1201 (2015). [DOI] [PMC free article] [PubMed] [Google Scholar]
- 16.Bawazer L. A., McNally C. S., Empson C. J., Marchant W. J., Comyn T. P., Niu X., Cho S., Mc Pherson M. J., Binks B. P., deMello A., Meldrum F. C., Combinatorial microfluidic droplet engineering for biomimetic material synthesis. Sci. Adv. 2, e1600567 (2016). [DOI] [PMC free article] [PubMed] [Google Scholar]
- 17.Dressman D., Yan H., Traverso G., Kinzler K. W., Vogelstein B., Transforming single DNA molecules into fluorescent magnetic particles for detection and enumeration of genetic variations. Proc. Natl. Acad. Sci. 100, 8817–8822 (2003). [DOI] [PMC free article] [PubMed] [Google Scholar]
- 18.Plesa C., Sidore A. M., Lubock N. B., Zhang D., Kosuri S., Multiplexed gene synthesis in emulsions for exploring protein functional landscapes. Science 359, 343–347 (2018). [DOI] [PMC free article] [PubMed] [Google Scholar]
- 19.Collins D. J., Neild A., deMello A., Liu A.-Q., Ai Y., The Poisson distribution and beyond: Methods for microfluidic droplet production and single cell encapsulation. Lab Chip 15, 3439–3459 (2015). [DOI] [PubMed] [Google Scholar]
- 20.Dinsmore A. D., Hsu M. F., Nikolaides M. G., Marquez M., Bausch A. R., Weitz D. A., Colloidosomes: Selectively permeable capsules composed of colloidal particles. Science 298, 1006–1009 (2002). [DOI] [PubMed] [Google Scholar]
- 21.Chevalier Y., Bolzinger M.-A., Emulsions stabilized with solid nanoparticles: Pickering emulsions. Colloids Surf. A 439, 23–34 (2013). [Google Scholar]
- 22.Baret J. C., Surfactants in droplet-based microfluidics. Lab Chip 12, 422–433 (2012). [DOI] [PubMed] [Google Scholar]
- 23.Holtze C., Rowat A. C., Agresti J. J., Hutchison J. B., Angilè F. E., Schmitz C. H. J., Köster S., Duan H., Humphry K. J., Scanga R. A., Johnson J. S., Pisignano D., Weitz D. A., Biocompatible surfactants for water-in-fluorocarbon emulsions. Lab Chip 8, 1632–1639 (2008). [DOI] [PubMed] [Google Scholar]
- 24.Nie Z., Park J. I., Li W., Bon S. A. F., Kumacheva E., An “Inside-Out” Microfluidic Approach to Monodisperse Emulsions Stabilized by Solid Particles. J. Am. Chem. Soc. 130, 16508–16509 (2008). [DOI] [PubMed] [Google Scholar]
- 25.Pan M., Lyu F., Tang S. K. Y., Fluorinated Pickering Emulsions with Non-adsorbing Interfaces for Droplet-based Enzymatic Assays. Anal. Chem. 87, 7938–7943 (2015). [DOI] [PubMed] [Google Scholar]
- 26.Shapiro S. J., Dendukuri D., Doyle P. S., Design of hydrogel particle morphology for rapid bioassays. Anal. Chem. 90, 13572–13579 (2018). [DOI] [PubMed] [Google Scholar]
- 27.Lee H., Kim J., Kim H., Kim J., Kwon S., Colour-barcoded magnetic microparticles for multiplexed bioassays. Nat. Mater. 9, 745–749 (2010). [DOI] [PubMed] [Google Scholar]
- 28.Destgeer G., Ouyang M., Wu C.-Y., Di Carlo D., Formation of uniform reaction volumes using concentric amphiphilic microparticles. BioRxiv 10.1101/2020.03.15.992321 (2020). [DOI] [PubMed] [Google Scholar]
- 29.de Rutte J., Dimatteo R., van Zee M., Damoiseaux R., Di Carlo D., Massively parallel encapsulation of single cells with structured microparticles and secretion-based flow sorting. BioRxiv doi: 10.1101/2020.03.09.984245 , (2020). [Google Scholar]
- 30.Wu C.-Y., Owsley K., Di Carlo D., Rapid Software-Based Design and Optical Transient Liquid Molding of Microparticles. Adv. Mater. 27, 7970–7978 (2015). [DOI] [PubMed] [Google Scholar]
- 31.Wu C.-Y., Stoecklein D., Kommajosula A., Lin J., Owsley K., Ganapathysubramanian B., Carlo D. D., Shaped 3D microcarriers for adherent cell culture and analysis. Microsyst. Nanoeng. 4, 1–9 (2018). [DOI] [PMC free article] [PubMed] [Google Scholar]
- 32.Stoecklein D., Davies M., de Rutte J. M., Wu C.-Y., Carlo D. D., Ganapathysubramanian B., FlowSculpt: Software for efficient design of inertial flow sculpting devices. Lab Chip 19, 3277–3291 (2019). [DOI] [PubMed] [Google Scholar]
- 33.Stoecklein D., Owsley K., Wu C.-Y., Carlo D. D., Ganapathysubramanian B., uFlow: Software for rational engineering of secondary flows in inertial microfluidic devices. Microfluid. Nanofluid. 22, 74 (2018). [Google Scholar]
- 34.Paulsen K. S., Chung A. J., Non-spherical particle generation from 4D optofluidic fabrication. Lab Chip 16, 2987–2995 (2016). [DOI] [PubMed] [Google Scholar]
- 35.Baek T. J., Kim N. H., Choo J., Lee E. K., Seong G. H., Photolithographic Fabrication of Poly(Ethylene Glycol) Microstructures for Hydrogel-based Microreactors and Spatially Addressed Microarrays. J. Microbiol. Biotechnol. 17, 1826–1832 (2007). [PubMed] [Google Scholar]
- 36.Skhiri Y., Gruner P., Semin B., Brosseau Q., Pekin D., Mazutis L., Goust V., Kleinschmidt F., Harrak A. E., Hutchison J. B., Mayot E., Bartolo J.-F., Griffiths A. D., Taly V., Baret J.-C., Dynamics of molecular transport by surfactants in emulsions. Soft Matter 8, 10618–10627 (2012). [Google Scholar]
- 37.Gruner P., Riechers B., Semin B., Lim J., Johnston A., Short K., Baret J.-C., Controlling molecular transport in minimal emulsions. Nat. Commun. 7, 10392 (2016). [DOI] [PMC free article] [PubMed] [Google Scholar]
- 38.Dhar M., Lam J. N., Walser T., Dubinett S. M., Rettig M. B., Carlo D. D., Functional profiling of circulating tumor cells with an integrated vortex capture and single-cell protease activity assay. Proc. Natl. Acad. Sci. 115, 9986–9991 (2018). [DOI] [PMC free article] [PubMed] [Google Scholar]
- 39.Dong L., Agarwal A. K., Beebe D. J., Jiang H., Photodegradable hydrogels for dynamic tuning of physical and chemical properties. Nature 442, 551–554 (2006).16885981 [Google Scholar]
- 40.Wei Q., Qi H., Luo W., Tseng D., Ki S. J., Wan Z., Göröcs Z., Bentolila L. A., Wu T.-T., Sun R., Ozcan A., Fluorescent imaging of single nanoparticles and viruses on a smart phone. ACS Nano 7, 9147–9155 (2013). [DOI] [PMC free article] [PubMed] [Google Scholar]
- 41.Zhu H., Yaglidere O., Su T.-W., Tseng D., Ozcan A., Cost-effective and compact wide-field fluorescent imaging on a cell-phone. Lab Chip 11, 315–322 (2011). [DOI] [PMC free article] [PubMed] [Google Scholar]
- 42.Dong L., Agarwal A. K., Beebe D. J., Jiang H., Adaptive liquid microlenses activated by stimuli-responsive hydrogels. Nature 442, 551–554 (2006). [DOI] [PubMed] [Google Scholar]
- 43.Liu B., Wang B., Zhao R., Tong Y., Wei G.-W., ESES: Software for Eulerian solvent excluded surface. J. Comput. Chem. 38, 446–466 (2017). [DOI] [PubMed] [Google Scholar]
- 44.Jacobs M., Merkurjev E., Esedoḡlu S., Auction dynamics: A volume constrained MBO scheme. J. Comput. Phys. 354, 288–310 (2018). [Google Scholar]
- 45.W. E. Lorensen, H. E. Cline, W. E. Lorensen, H. E. Cline, Marching cubes: A high resolution 3D surface construction algorithm, in Proceedings of the 14th annual conference on Computer graphics and interactive techniques - SIGGRAPH ‘87 (ACM Press, 1987), vol. 21, pp. 163–169. [Google Scholar]
- 46.Dendukuri D., Hatton T. A., Doyle P. S., Synthesis and self-assembly of amphiphilic polymeric microparticles. Langmuir 23, 4669–4674 (2007). [DOI] [PubMed] [Google Scholar]
- 47.Stoecklein D., Wu C.-Y., Owsley K., Xie Y., Carlo D. D., Ganapathysubramanian B., Micropillar sequence designs for fundamental inertial flow transformations. Lab Chip 14, 4197–4204 (2014). [DOI] [PubMed] [Google Scholar]
Associated Data
This section collects any data citations, data availability statements, or supplementary materials included in this article.
Supplementary Materials
Supplementary material for this article is available at http://advances.sciencemag.org/cgi/content/full/6/45/eabb9023/DC1