

scRNA-seq of an invariant cell lineage reveals insights into asymmetric cell division, FGF signaling, and notochord specification.
Abstract
Progressive unfolding of gene expression cascades underlies diverse embryonic lineage development. Here, we report a single-cell RNA sequencing analysis of the complete and invariant embryonic cell lineage of the tunicate Ciona savignyi from fertilization to the onset of gastrulation. We reconstructed a developmental landscape of 47 cell types over eight cell cycles in the wild-type embryo and identified eight fate transformations upon fibroblast growth factor (FGF) inhibition. For most FGF-dependent asymmetric cell divisions, the bipotent mother cell displays the gene signature of the default daughter fate. In convergent differentiation of the two notochord lineages, we identified additional gene pathways parallel to the master regulator T/Brachyury. Last, we showed that the defined Ciona cell types can be matched to E6.5-E8.5 stage mouse cell types and display conserved expression of limited number of transcription factors. This study provides a high-resolution single-cell dataset to understand chordate early embryogenesis and cell lineage differentiation.
INTRODUCTION
Metazoans have vastly divergent cell types that develop from a single precursor. Recently, droplet-based high-throughput single-cell RNA sequencing (scRNA-seq) techniques have been applied extensively to a variety of model systems to study early embryogenesis (1–5). These studies inferred developmental paths through trajectory analysis and greatly improved our understanding of how cells differentiate. However, because in most animals the exact cell lineages are not known, the trajectories remain computational hypotheses. Cell barcoding techniques such as those based on CRISPR enable cell lineage tracing (6, 7) but still face technical limitation in temporal resolution to capture every cell division.
In this regard, model organisms with invariant cell lineage, such as the nematode Caenorhabditis elegans (8) and the ascidian Ciona (9), provide a unique opportunity where the known lineage underlies the interpretation of developmental trajectories. In particular, as the ascidians are sister group to vertebrates, they have comparable body plan and cell types, and thus, studies on ascidians are crucial to understand how vertebrate developmental programs arose during evolution (10). Recently, a high-throughput scRNA-seq study examined Ciona intestinalis development from 110-cell to the larva stage, revealing the developmental trajectories after the main tissue subtypes are specified (11). Another study investigated early development of a distant species Phallusia mammillata (2- to 64-cell stage) (12), demonstrating the resolvability of cell types by scRNA-seq and reconstruction of spatial axes from the transcriptome.
Here, we use scRNA-seq to systematically examine lineage specification in early chordate embryogenesis using the Ciona savignyi model. Using manual cell dissociation and isolation, we obtained a total of 750 single-cell expression profiles that correspond to 47 cell types for the wild type and 10 cell types for mitogen-activated protein kinase (MAPK) kinase (MEK) inhibitor–treated embryos. With a high-resolution and accurate map of cell types, we exploited the landscape of asymmetric cell division, fibroblast growth factor (FGF)–MAPK induction, and notochord differentiation. For most of the asymmetric cell divisions, we observed that the bipotent mother cell predominantly shows the gene signature of one daughter. Our analysis of drug inhibition revealed previously unidentified FGF targets as well as an unknown fate transformation {[the trunk ventral cells (TVCs)] to muscle}. We also found that the asymmetric segregation of mitochondrial genes is independent of FGF-MAPK signaling. In addition, we expanded the notochord gene regulatory network (GRN) with 18 genes that may function in parallel to Brachyury and found that FGF-MAPK drives part of these genes. Last, we compared our data to a mouse dataset on early embryogenesis (E6.5-E8.5) and showed that only a handful of transcription factors (TFs) are conserved between homologous tissues.
RESULTS
Cell isolation and sequencing
To best exploit the invariant cell lineage and low cell numbers in Ciona embryos, we dissociated C. savignyi embryos at eight developmental stages (1, 2, 4, 8, 16, 32, 64, and 110 cell) and manually collected individual cells from each embryo (Fig. 1A). For each embryonic stage, we sampled two to eight embryos for a total of 29 wild-type embryos. Furthermore, we collected cells from two 64-cell stage embryos that were treated with U0126, a MEK inhibitor. We recovered 100% of cells from each embryo up to 32-cell stage and more than 90% of cells for 64- and 110-cell embryos, totaling 648 wild-type and 125 U0126-treated cells to be sequenced (Fig. 1, A and B, and table S1A).
Fig. 1. Overview of scRNA-seq assay and cell type classification.
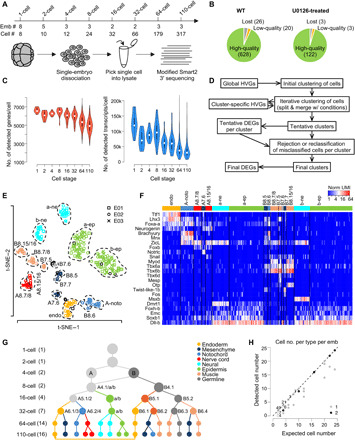
(A) Number of embryos and cells sampled from the 1- to 110-cell stage. (B) Number of cells lost during manual cell picking, showing low quality (≤2000 genes) and high quality for wild-type and U0126-treated embryos. (C) Distribution of gene and transcript numbers per cell for different stages. (D) Computational pipeline for iterative clustering to identify cell types and DEGs. (E) Identified cell types of the 110-cell stage. Cells from three embryos are represented by different symbols. Clusters are labeled with blastomere names or fates (ne, neural; ep, epidermis; endo, endoderm; noto, notochord). Black symbols represent rejected cells. (F) Expression levels of known cell type–specific markers at the 110-cell stage. Each column represents a cell. (G) Summary of identified cell types (circles) in the form of differentiation trajectories. Double-headed arrow indicates that the two lineages of endoderm at 110-cell stage are indistinguishable. Numbers in parentheses indicate the number of cell types identified for each stage. (H) Number of cells in each embryo assigned to each type compared to the expected numbers across all embryos and stages. Numbers indicate the number of points falling at the same coordinates.
For each isolated cell, we generated single-cell transcriptome using a modified Smart2 protocol that sequences transcripts at the 3′ end and allows transcript counting and multiplexed library preparation. On average, we detected >5000 genes and a median of 48,340 transcripts per cell (Fig. 1C). Earlier-stage cells, which have larger cell size, have more transcripts and genes than later-stage cells. A small number of cells have less than 2000 genes detected, which we discarded as low-quality cells. In total, we obtained 750 high-quality single-cell transcriptomes, including 628 from wild-type and 122 from U0126-treated embryos.
Cell type identification
For objective identification of cell types, we undertook an iterative clustering approach (Fig. 1D) and clustered cells at each developmental stage (Fig. 1E and figs. S2 and S3, A to E). Following identification of highly variable genes (HVGs) from the scRNA-seq dataset (fig. S1, B to D), we used the density-based spatial clustering of applications with noise (DBSCAN) algorithm (13) for unsupervised clustering of cells (see Materials and Methods), which not only provides objective measures to optimize for but also allows exclusion of individual cells as outliers (potentially low-quality cells). Each cluster undergoes the next round of clustering based on cluster-specific HVGs (Fig. 1D). When a cluster is split, we used bootstrapping to examine whether the newly produced, tentative clusters are significantly different from each other to be accepted (see Materials and Methods). In practice, most of the clusters produced showed P ≤ 0.001 (fig. S3F). Because the P value tends to lose significance on clusters with a small number of cells, we accepted some of the smaller clusters with P > 0.01 (fig. S3F) after examining the number and quality of different genes expressed in them. The weakest case is the separation of the A-line and B-line notochord cells at the 110-cell stage (P = 0.036), which is discussed in details below.
A total of 47 cell clusters were defined. These include 2, 2, 4, 7, 14, and 16 clusters for the 4-, 8-, 16-, 32-, 64-, and 110-cell stage (Fig. 1E and fig. S3, A to E), respectively, based on the iterative clustering analysis, while the 1- and 2-cell stages were each accepted as one cluster.
To examine whether the assignment of each cell to the corresponding cluster is proper, we performed additional verification by comparing the similarity between the gene expression of a cell and the average expression profile of its tentative cell cluster. We first computed differentially expressed genes (DEGs) for each cluster (see Materials and Methods). We then compared gene expression of a cell to the DEGs of its cluster by Pearson’s correlation test (see Materials and Methods). A cell is accepted into a cluster if P < 10−5. A total of 52 cells were reassigned, including 23 that were rejected from all clusters as unclassified cells because their gene expression profiles do not correlate well to any defined cell types (fig. S3G).
We then determined the blastomere identity of each cluster by examining the expression of known markers of different cell types (Fig. 1F) from the closely related species C. intestinalis (14, 15) and generated the average expression profile for each cell cluster (table S2) for ensuing expression analysis. Last, we ordered the 47 cell types based on their assigned lineage identity across development stages (Fig. 1G), which depicts the resolved landscape of lineage differentiation. Notably, our result achieves single-cell resolution of the entire B-line lineage.
As a test for the accuracy of cell type calling, we asked whether for each cell type, the number of cells from each embryo agrees with the expected number from the known cell lineage (Fig. 1H and table S1B). In all 124 groups of cells from each type and each embryo, the numbers of cells are equal to or less than the expected numbers. For 92 (74%) of the 124 groups, the number of cells exactly matches the expected number. Thirty-three (97%) of 34 groups at the 32-cell stage or earlier showed exact match. Most groups with the number of cells less than expected are from the 64- or 110-cell stage where cells were lost during isolation. Considering the fact that the number of cells in a given cell type was not part of the objectives in our computational analysis, the systematic agreement in cell number demonstrates the quality of our cell cluster identification and cell type assignment.
Despite the high success rate in cell type identification, some blastomeres that are known to be distinguishable in C. intestinalis are not separated by our iterative clustering. These are limited to two situations where the differences are known to be subtle with only a handful of markers by in situ assays, namely, early blastomeres at the 8- and 16-cell stages and tissue subtypes in later embryos (e.g., 110-cell stage a- and b-line neuronal subtypes). Several technical issues with our scRNA-seq assay likely contribute to the lack of resolution in these cases. First, some known C. intestinalis markers do not have homologs in the C. savignyi gene annotation and, thus, were left out from our sequencing data, such as the early 8- and 16-cell stage marker Ci-Bz1 used to distinguish a-line from b-line cells (16). Second, some markers are not differentially expressed between known cell types in our dataset. For example, Neurogenin is expressed in both A8.15 and A8.16 in our data, whereas in situ only detected expression in A8.16. Table S1C lists all the cases where known cell types were not separated.
We also compared our results with a recently published high-throughput single-cell analysis of C. intestinalis (11). The published study used the 10x Genomics platform to sample the 110-cell stage at 26× coverage (equivalent of 26 embryos) and reported 14 cell types, compared to 16 cell types in our study from three embryos. Specifically, we resolved three tissue subtypes including the A-line nerve cord, B-line mesenchyme, and B-line muscle. The separation of these cell types is supported by clear differences in the expression of 11 to 31 DEGs and one to two known markers (fig. S3, H to J). Meanwhile, our clustering did not resolve the A- and B-line endoderm. The high-throughput study revealed six genes that are differentially expressed between the two types (fig. S3K). In our dataset, two of these genes, Ephrina-a and Notrlc, were detected robustly in the endoderm cells. On the basis of the expression level of these two genes, the endoderm cells in our results can be divided manually into a putative A-line group and a putative B-line group. Each group has the right number of cells from each embryo. Thus, it appears that the difference reported there was marginally detected in our dataset but was not enough to resolve the two cell types by the same statistical threshold for other clusters. Overall, our study achieved comparable power of resolution to the high-throughput approach with about nine times higher coverage.
Identification of DEGs
After identifying the cell types, we characterized the DEGs among them. We took a conservative approach in defining the DEGs by requiring relatively stringent cutoffs for expression level, fold difference, and P value of Wilcoxon rank sum test (fig. S4, A and B; see Materials and Methods). In total, we identified 306 DEGs across all developmental stages examined (Fig. 2A and table S3), including most of the known markers. As expected, many of the DEGs are TFs and signaling molecules (56 and 43, respectively). Among the 387 predicted TFs (17), 15% were detected as DEGs. Furthermore, the DEG list contains genes involved in rich and yet unexplored cell-cell interactions (adhesion and other membrane proteins) and context-specific cell biology (cytoskeleton and motor proteins and vesicle trafficking) as well as chromatin-related pathways.
Fig. 2. Characterization of DEGs.

(A) Gene ontology (GO) term classification of the 306 identified DEGs. (B) Variance of DEG expression levels among expressing cells (red) and between expressing and low/no-expressing cells (black). (C) Number of DEGs per cell type across developmental stages. Each dot is a defined cell type. (D) Specificity of DEGs as measured by the percentage of expressing cells at each stage. (E) Expression logic of DEGs at the 64-cell stage. From the top, color disks represent A7.1/2/5, A7.6, A7.3/7, A7.4/8, B7.1/2, B7.3, B7.4, B7.5, B7.6, B7.7, B7.8, a7.9/10/13, a/b-epidermis, and b7.9/10, respectively. Black circles around each cell type denote cell type–specific DEGs. Lines denote lineage-specific DEGs. Arcs drawn left show DEGs shared by cell types in the same tissue type or germ layer. Arcs drawn right show other DEGs with complex combinatorial patterns. The thickness of lines and circles is proportional to the number of DEGs. DEG numbers in each category are in parentheses. (F) Comparison of expression sites for known cell type–specific markers at the 64-cell stage between in situ (15) (black squares) and detection in this study (red squares). HQ, high quality; LQ, low quality. (G) Summary of in situ and scRNA-seq comparison across stages. (H) Degree of expression site discrepancies between in situ and scRNA-seq for high-quality genes from all stages.
We then characterized the features of DEGs. The variance of expression level of individual DEGs among the expressing cell types is smaller than and cleanly separated from the variance between the expressing and nonexpressing cell types (Fig. 2B), demonstrating clear differences in expression levels between the two groups of cells. The number of DEGs per cell type increases over time (Fig. 2C), correlating with increased zygotic expression over time and differentiation. In terms of specificity, the DEGs on average are expressed in 25% of the cells at any stage (Fig. 2D). The DEGs exhibit complex combinatorial expression patterns. For example, at the 64-cell stage, only 20 of 147 DEGs are specific to a cell type, and 25 are shared by lineage, tissue type, or germ layer, while the remaining 102 genes show complex patterns (Fig. 2E).
In situ hybridization experiments provide rich and orthogonal information on gene expression patterns. To this end, we compared our results with published in situ data of 51 genes in the early C. intestinalis embryo (15) that have clear homologs in C. savignyi (referred to as Imai genes below). We evaluated two aspects of our data: DEG calling and consistency of expressed sites.
First, among the 37 genes that showed differential expression by in situ, 23, or 62%, are identified as DEGs in our data (Fig. 2F, gene names in red). Among the 14 genes that did not show differential expression by in situ, 12, or 86%, are not defined as DEGs in our data.
Second, we compared the consistency of expression sites between the two datasets. Taking each gene in each cell type as an expression site, only 8% of expression sites of our defined DEGs show discrepancy with those of in situ (Fig. 2F, gene names in red). We then focused on 51 Imai genes at the 64-cell stage, among which 33 genes show largely consistent patterns [Fig. 2F, HQ (high quality)], including Ttf-1, Brachyury, and Myod in the endoderm, notochord, and muscle lineages. Slight differences also exist, such as for Lhx3, which is detected by scRNA-seq but not by in situ in B7.5 (the TVC precursor) and A7.6. We observed the opposite pattern as well, such as E(spl)/hairy-a being detected by in situ but not by scRNA-seq in B7.5. Lhx3 was detected in B7.5 by in situ in C. savignyi (18) and was reported to be required for TVC specification in C. intestinalis (19), suggesting a false-negative result in Imai’s study For all stages, about 60% of the Imai genes show high degree of agreement between the two detection methods (Fig. 2G and fig. S4, C to E). Among these high-quality genes, 78% display <10% unmatched sites between in situ and scRNA-seq (Fig. 2H). Orthogonal evidence, such as genetic analysis, is needed to resolve the discrepancy. About 40% of the Imai genes show relatively large inconsistency (Fig. 2F), which can be further divided into three situations. At 64-cell stage, 14 Imai genes showed predominantly false-positive detection [Fig. 2F, LQ-1 (low quality–1)] in our data, i.e., they display cell type specificity by in situ but were ubiquitously detected by scRNA-seq in almost all cell types. These could be due to errors in the gene models used for C. savignyi or erratic complementary DNA (cDNA) amplification. Two Imai genes (Gata-b and Soxb2; Fig. 2F, LQ-2) were not detected by scRNA-seq in any cell type, likely resulted from low sensitivity or the use of divergent Ciona species. Last, two Imai genes (Soxc and Tbx2/3; Fig. 2F, LQ-3) showed large fraction of both false-positive and false-negative detections compared to in situ data across different cell types. Together, the systematic comparison between the scRNA-seq and in situ data shows moderate sensitivity in DEG detection by scRNA-seq but high specificity in those detected.
Insights on differential gene regulation in early ascidian embryo
Initiation of zygotic transcription is a major transition step in early embryo development. Ascidian embryogenesis does not display global maternal-to-zygotic activation (20). The earliest detected zygotic expression includes Foxa-a and Soxb1 at the eight-cell stage (21, 22). We used the scRNA-seq data to systematically examine the earliest zygotic transcription. Specifically, we analyzed the expression level of DEGs between each mother-daughter pair to identify presumptive de novo transcription from 1- to 16-cell stage (Fig. 3A; see Materials and Methods). We detected extensive de novo transcription at the 16-cell stage (Fig. 3B and fig. S5A), which includes 11 zygotic genes in all three somatic lineages, including the known cases of Soxb1 and Fgf9/16/20 (fig. S5A). However, it is a cell cycle later than the reported initiation at the eight-cell stage. We did detect a putative de novo transcription event at the eight-cell stage in the B4.1 cell, which turned out to be a mitochondrial transfer RNA gene (asterisk in Fig. 3B), a likely false-positive classification of a maternal gene. The delayed detection in our analysis may result from a combination of our stringent cutoffs and the lack of sensitivity in scRNA-seq. These results are in line with a recent study in C. intestinalis (23). Nine genes can be considered overlapping, with zygotic transcription detected in both species despite the different cutoffs.
Fig. 3. Differential gene regulation in the early embryo.
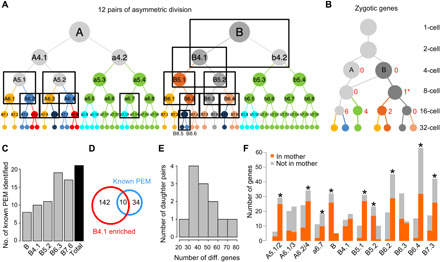
(A) Twelve asymmetric divisions (boxes, three degenerate pairs for A5.1/2, A6.1/3, and A6.2/4) resolved by cell type identification. For an enlarged version of the lineage, see fig. S1. (B) Number of genes predicted to be zygotically expressed in cells up to the 16-cell stage. Circles, lines, and colors follow the scheme in Fig. 1G. Numbers next to circles show the number of predicted genes in that cell type. * denotes a false-positive prediction (see main text). (C) Number of known PEM (for posterior end mark) genes detected by germline enrichment analysis across different stages. (D) Overlap between known PEM genes and genes enriched in the B4.1 cell type. (E) Histogram of the number of daughter pairs in the 12 asymmetric divisions based on the number of DEGs with >1.8-fold difference in expression level between each daughter pair. (F) Number of DEGs with >1.8-fold difference in expression level between each daughter pair in each daughter that are detected in the mother cell (orange) or not (gray). Blastomere identities denote the mother cell, and each pair of bars represents the two daughters as ordered in the lineage in (A). * denotes significant bias of mother toward one daughter’s DEGs (chi-square test, P < 0.01).
Before the start of zygotic transcription, the early Ciona blastomeres, nevertheless, display differential gene expression through asymmetric localization/inheritance of maternal mRNA. Among the 26 and 37 DEGs at the four- and eight-cell stage (table S3), most show higher numbers of average Unique Molecular Identifiers (UMIs) in the germ line (B and B4.1), including known cases like Eph1, Wnt5, and Pem (24). However, at each stage, there is also a group of genes showing the opposite pattern, such as Foxj2 with a higher level in A and Ci-ZF087 higher in A4.1/a4.2/b4.2 (unresolved cell type group).
We further examined genes associated with germline lineage formation. In ascidian embryo, a group of maternal RNAs called postplasmic/PEM are preferentially localized to the posterior blastomeres and contribute to the development of the germline lineage (25). We examined how well the known postplasmic/PEM genes can be detected by the pattern of elevated levels in the germ line than its sister lineage across all stages. Of the 44 C. savignyi genes that have been annotated as postplasmic/PEM (25), 21 can be identified (Fig. 3C and fig. S5B). In particular, at the eight-cell stage, 10 known postplasmic/PEM genes are among the 152 genes enriched in B4.1 (Fig. 3D). A previous work showed that some postplasmic/PEM genes are both ubiquitously expressed in the cytoplasm of all cells and enriched in a specialized cytoplasmic region (called the CAB, the centrosome-attracting body) in the posterior cell. Such a pattern may not be reflected as a simple whole-cell elevation in the germ line. For the remaining 142 of the 152 genes enriched in B4.1, it is difficult to say whether all of these are postplasmic/PEM genes without further evidence such as localization to the CAB.
In Ciona embryo, different cell types are generated by asymmetric cell divisions that involve both internal and external cues. Taking advantage of the single-cell expression data, we systematically examined expression profiles in mother-daughter trios where the two daughters take up different fates. Across all stages examined, we identified 12 asymmetric cell divisions where daughter cells were clustered into distinct cell types (Fig. 3A, boxes). Typically, daughter pairs showed 20 to 80 DEGs with a >1.8-fold difference between each other in expression level (Fig. 3E). We then asked for each case whether the mother cell, which is, in theory, bipotent, exhibits characteristic gene expression of the two daughter fates (Fig. 3F). The DEGs with a >1.8-fold difference in one daughter compared to the other were considered the characteristic gene expression of the former. We found that the 12 divisions fell in two groups. In 3 of the 12, namely, A6.1/3, B4.1, and B6.3, the mother cell has about equal number of characteristic genes of each daughter. In the other nine cases (asterisk, chi-square test P < 0.01; Fig. 3F), the mother cell is heavily biased toward one daughter’s DEG expression profile. Among these, two are influenced by maternal determinants (B, B5.2, and germ line), while the remaining seven cases are FGF dependent. The favored daughters are uniformly the default fate. These results suggested that there are two different scenarios in FGF-MAPK–dependent fate induction. In the first scenario, where the mother cell only has DEGs of the FGF-MAPK–negative daughter, FGF-MAPK directly activates the program of the FGF-MAPK–receiving daughter (e.g., Brachyury in the notochord) and also inhibits the DEGs of the FGF-MAPK–negative daughter in the FGF-MAPK–receiving daughter. By contrast, in the second scenario (i.e., A6.3), the mother cell has DEGs of both daughters. It would require a more complex mechanism to segregate the two daughter fates compared to the other cases. Our previous study showed that fate induction in A6.3 requires a complex interaction between FGF-MAPK, Ephrin, and Nodal signaling (26).
The molecular lineage and temporal dynamics of differentiation
Combining the invariant cell lineage and the DEGs in each cell type, we constructed a molecular lineage (Fig. 4A), which reveals a global view of how gene expression underlies lineage differentiation, i.e., emergence and turnover of DEGs along lineages. On the basis of the molecular lineage, we examined the divergence of the epidermal lineage.
Fig. 4. The molecular lineage and temporal dynamics of lineage differentiation.

(A) Illustration of DEGs in each cell type and their changes across development. Each short colored line in a rectangle node represents a DEG, and each rectangle node (formed by a group of short colored lines) represents a blastomere in the cell lineage. Embryonic stages start at the center at four-cell stage. Identity of the A cell, B cell, and cells in the germline lineage are shown as examples. Long lines across stages trace DEGs shared by mother and daughter cells. Colors are based on where a gene is most prominently expressed. Color scheme follows Fig. 1G. (B) Pseudotime analysis of epidermal fate differentiation at the 32-, 64-, and 110-cell stages. Each dot is a cell. C32 a/b, a-line and b-line epidermis at the 32-cell stage; C64 a/b-ep, a-line and b-line epidermis at the 64-cell stage; C110 a-ep, a-line epidermis at the 110-cell stage; C110 b-ep, b-line epidermis at the 110-cell stage. (C) Expression of two groups of DEGs from C32 a/b to C110 b-ep cells [color scheme, see (B)]. Each line is a gene. Cells are ordered on the basis of pseudotime [dimension 1 in (B)].
The a-line and b-line epidermal cells remain as one cell type up to the 64-cell stage but become two distinct types by the 110-cell stage (Fig. 1G). To further examine the divergence of cell fates, we used pseudotime analysis (see Materials and Methods) to reconstruct the bifurcation of cellular state toward the a-line and b-line epidermal fates and the accompanying changes of DEG expression (Fig. 4, B and C). The result showed that the divergence occurs during the 64-cell stage. Furthermore, the analysis showed a leap of cell state from the 32-cell stage to the 64-cell stage, which is followed by gradual transition during the 64- and 110-cell stage (Fig. 4B). Consistently, the expression level of DEGs changes rapidly between the 32- and 64-cell stages but less so between 64- and 110-cell stages (Fig. 4C). The leap is not an artifact of smaller number of cells at the 32-cell stage since there is a comparable number of cells in each of the gradually changing branches at the 64-cell stage. This pattern is also not an artifact of embryo age variation: Cells from individual embryos do not display biased ordering along the pseudotime (fig. S5C). The abrupt change of cell state indicates rapid gene expression and turnover, which may be dictated by the short cell cycle and continuous differentiation in an invariant cell lineage.
Role of FGF-MAPK signaling in asymmetric cell fate specification in Ciona embryo
Distinct cell types are generated by the interplay between signaling pathways and cellular determinants. The FGF pathway plays broad roles in metazoan development. In Ciona, the Fgf9/16/20-dependent MAPK pathway is the major inductive signal for cell fate specification across multiple lineages (27, 28). We inhibited FGF-MAPK signaling with the MEK inhibitor U0126 (29) at the 1-cell stage and performed single-cell analysis for two 64-cell embryos.
First, we examined fate transformation upon U0126 treatment. We performed iterative clustering of U0126-treated cells using DEGs from wild-type 64-cell embryos and identified 10 cell types (Fig. 5A and fig. S6). Among these, we identified eight fate transformation events including all seven known cases such as notochord to nerve cord and mesenchyme to muscle (table S1D). SplitsTree (30), which was originally developed for evolutionary phylogeny construction, was used to visualize the similarities of cell types between wild-type and U0126-treated embryos (Fig. 5B). The tree does not imply lineal or evolutionary relationship in this context. We noticed that for the case of notochord and mesenchyme induction, whereas the corresponding FGF-MAPK targets are diminished by U0126 treatment, the presumptive notochord and mesenchyme blastomeres do not adopt a complete fate transformation. They are still separable from the sibling nerve cord and muscle fates by 4 or 5 retained DEGs (table S1D), although the differences are much reduced compared to more than 30 DEGs in the wild-type. In addition, our analysis revealed a previously unknown fate transformation event in which the presumptive TVC (B7.5) is transformed to a muscle-like fate B7.4 (table S1D). This is consistent with the previous observation that the expression of Mesp in B7.5, a key TF of the TVC fate, is partially dependent on Fgf9/16/20 (19). Our result further revealed that upon loss of MAPK signaling B7.5 adopts a muscle fate.
Fig. 5. Analysis of FGF-MAPK signaling in fate specification and asymmetric cell divisions.
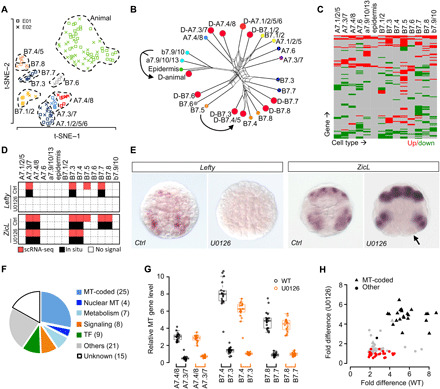
(A) Display of 10 identified cell types in 64-cell stage U0126-treated embryos. (B) SplitsTree showing similarity of DEG profiles among wild-type and U0126-treated cell types. U0126-treated cells are denoted by red dots; wild-type cells colored as in Fig. 1G. Arrows denote examples of fate transformation. (C) Changes of DEG expression after U0126 treatment. See table S3 for the list of genes and expression levels. (D) Summary of detected expression sites at the 64-cell stage by scRNA-seq (red) and in situ (black) for ZicL and Lefty in wild-type and U0126-treated embryos. (E) Representative in situ hybridization results of Lefty and ZicL in wild-type (Ctrl) and U0126-treated embryos. Lefty shows total loss of expression, while ZicL is lost in the posterior most mesodermal lineages (arrow). (F) GO term classification of genes cosegregating with MT-coded genes in three FGF-dependent sister pairs. (G) Asymmetric enrichment of MT-coded genes between sister pairs in wild-type and U0126-treated embryos. (H) Comparison of asymmetric enrichment for MT-coded and cosegregating genes between the wild-type and U0126 treatment. Each dot is a gene. Black, gray, and red: asymmetric in all cell pairs, in some pairs, and symmetric after treatment. Fold difference calculated as the geometric mean of fold differences of the three cell groups in (G).
Next, we examined gene regulation by the FGF-MAPK pathway. U0126 treatment caused broad changes in DEG expression across cell lineages at 22% of the expression sites (Fig. 5C and table S3). Specifically, known FGF-MAPK targets including Brachyury, Twist-like, and Otx were diminished from the corresponding cell types, confirming the specificity of the inhibitor (fig. S6B). Our analysis also identified previously unknown FGF-dependent gene expression. For example, Lefty, which belongs to the transforming growth factor–β superfamily, is normally expressed in notochord, B-line mesenchyme and TVC in wild-type embryos (Fig. 5D). Upon U0126 treatment, the expression is completely diminished in the embryo, suggesting that Lefty is a target for FGF-MAPK. In addition, we found that ZicL, an early specifier for mesoderm lineages, is under FGF-MAPK regulation in a context-dependent manner. In U0126-treated embryos, ZicL is specifically lost in the posterior muscle and mesenchyme lineage (B7.7/B7.8) but unaffected in the anterior muscle and mesenchyme (B7.3/B7.4) or the A-line blastomeres (Fig. 5D). The regulation of Lefty and ZicL by the FGF-MAPK pathway was further confirmed by our in situ experiments (Fig. 5E).
Last, we examined the interplay between FGF-MAPK signaling and asymmetric inheritance of cytoplasmic determinants during lineage differentiation. Among the asymmetric cell divisions that depend on FGF induction, three cases, namely, A7.3/7 versus A7.4/8, B7.3 versus B7.4, and B7.7 versus B7.8, are accompanied by transport of mitochondria (MT) toward the marginal daughter (31), which is reminiscent of asymmetric MT inheritance in mammalian embryonic development and stem cell differentiation (32, 33). This pattern can be robustly detected in our scRNA-seq dataset by examining MT-coded genes (fig. S6D). We identified 78 genes during these divisions whose mRNA show enrichment in the marginal daughters compared to their medial sisters. In addition to 25 MT-coded genes, this gene list also contains genes encoding signaling pathways and TFs (Fig. 5F). We then asked whether the asymmetry of MT and the cosegregating genes requires FGF-MAPK signaling. After U0126 treatment, 24 of the 25 MT-coded genes remain asymmetric (Fig. 5G), which suggests that MT segregation does not require FGF-MAPK signaling and another polarity cue exists. Similarly, 31 non-MT genes remain asymmetric. Further experiments are required to determine whether these mRNAs are transported by the same mechanism as the MT. Last, 22 non-MT genes become symmetric (Fig. 5H), which are consistent with being conventional target genes of the FGF-MAPK pathway. Together, these results suggest that multiple polarity pathways function in these asymmetric cell divisions and may involve transport of mRNA in addition to MT.
The GRN of notochord differentiation
The notochord is a chordate-specific innovation during evolution (34). In contrast to vertebrates, the Ciona notochord forms from two distinct lineages: the primary notochord from the A-line neural/notochord precursor (A6.2/4) and the secondary notochord from the B-line mesenchyme/notochord progenitor (B7.3). The two notochord lineages become fate restricted at different time points: 64-cell stage for the A-line and 110-cell stage for the B-line, as manifested by the onset of Brachyury expression, a key regulator of notochord fate in Ciona (35). Brachyury expression is also activated in distinct manners in the two notochord lineages. In the A-line notochord, Brachyury expression depends on ZicL and Fgf9/16/20 signaling, with ZicL being activated by Foxa.a and Foxd (Fig. 6A, pink box) (15, 27, 36–39). In the B-line notochord, Brachyury is subjected to an additional level of negative regulation, being repressed by Snail at the 64-cell stage and subsequently derepressed by Notch signaling (Fig. 6A, blue box) (40–42).
Fig. 6. The GRN of notochord differentiation.
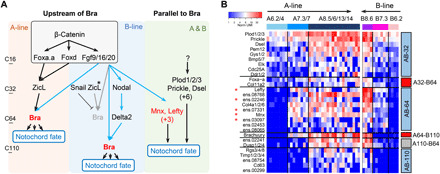
(A) GRNs of Ciona notochord fate specification in A- and B-line notochord lineage. Pink and blue boxes contain the regulatory interactions upstream of Brachyury, summarized from previous works (15, 27, 36–42) and validated in this study. * denotes genes that have different expression levels between two lineages. Notochord-specific genes identified in this paper, which are activated synchronously in both lineages and may function in parallel to Brachyury, are shown in the green box. Genes colored in red are FGF-MAPK targets identified in our U0126 inhibition experiment. (B) Expression dynamics of 28 notochord-specific genes in two notochord lineages. Genes displaying different temporal patterns are grouped and indicated by color bars on the right (red, genes turned on at the fate restriction point or one cell cycle before; blue, genes turned on synchronously in both lineages; gray, genes showing other temporal patterns).
To explore how notochord fate develops in these two lineages, we used single-cell expression data to characterize the notochord GRNs. We first identified notochord-specific genes that were defined as genes that are expressed in both notochord lineages and show specificity (>1.8-fold difference) compared to its non-notochord sister lineage (A7.3/7 versus A7.4/8, A8.5/6/13/14 versus A8.7/8/15/16, and B8.6 versus B8.5). A total of 28 notochord-specific genes were identified. In theory, these would include both upstream regulators and downstream targets of notochord fate, which should display different temporal dynamics with respect to notochord fate restriction in each lineage. We observed two major patterns of expression (Fig. 6B). The first pattern (Fig. 6B, red bar) contains three genes that are activated in the A-line one cell cycle before the B-line, including genes in the known Brachyury pathway, i.e., Brachyury and its upstream regulator Foxa-a. The second pattern of expression (Fig. 6B, blue bar, 23 genes) is synchronously turned on in both notochord lineages and contain most of the notochord-specific genes identified. Notably, 18 of the 23 genes are turned on at the 32- and 64-cell stage before the activation of Brachyury, suggesting the existence of pathways parallel to Brachyury (Fig. 6A, green box). These genes include TFs (Mnx and Elk), signaling molecules (Prickle, Lefty, Ddr1/2, and Bmp5/7), and extracellular protein genes (Plod1/2/3, Dsel, and Col4a1/2/6). Of these, Mnx and Prickle have been implicated in notochord development (43, 44). Among the nine genes turned on at the 64-cell stage, five are down-regulated in our FGF-MAPK drug inhibition experiment, including Mnx and Lefty [Fig. 6, A (genes in red) and B (asterisk)]. This result suggests that part of the parallel pathway is regulated by FGF signaling, which further expands our understanding of FGF function in notochord differentiation beyond the known role to activate Brachyury.
Despite the overall similarity of notochord-specific gene expression in the A and B lineages, the B-line notochord precursors give rise to secondary notochord lineage in the larval tail tip and express different genes than the primary notochord (40). To explore how these differences may arise, we identified 16 genes that are differentially expressed between the A-line and B-line (>1.8-fold difference in A8.5/6/13/14 versus B8.6, fig. S7). To distinguish whether these differences reflect their lineage history or diversification of subtypes, we examined whether these differences are already present in their progenitors before notochord fate restriction, i.e., 32-cell A-line and 64-cell B-line, respectively. Nine of the 16 genes come from lineage history. For example, ZicL is expressed in higher levels in A-line than B-line (Fig. 6B, asterisk, and fig. S7), whereas Snail is expressed exclusively in the B-line precursor. As ZicL is a direct activator of Brachyury, the lower level of ZicL in B notochord lineage may partially contribute to the delayed activation of Brachyury. In addition, 5 of the 16 genes are expressed at or after notochord fate restriction, suggesting that these are newly activated in either the A- or B-line and may contribute to the diversification of notochord subtypes. These include Orphan bhlh-1 and Ephrina-a in A-line (fig. S7). Thus, at this early stage of notochord differentiation, most of the differences between A- and B-line notochord come from lineage background but subtype-specific gene expressions begin to emerge.
Systematic comparison of cell types in early chordate embryogenesis
As the sister group to vertebrates, the ascidians provide a critical node in evolution to understand how vertebrate developmental programs arose. To this end, we conducted a comparison between Ciona and mouse embryonic cell types and investigated the degree of gene expression conservation between them.
Accurate match of developmental stages between Ciona and mouse is key to this question, but the two systems undergo very different embryogenesis patterns. Ciona embryonic tissue specification occurs before gastrulation with the 10 major tissue types (table S4B, Ciona tissue types) emerging at the 64- to 110-cell stage, while in mouse, such tissue specification events do not happen until after gastrulation (E6.5 and after). We compared the Ciona cell types defined in our study to those in a recently published single-cell study of mouse embryogenesis for E6.5-E8.5 (4) so that we could compare gene expression between the two species when the cell types first emerge.
First, we created a map of homologous cell types based on the known tissue homology and lineage in Ciona and mouse. Among the 10 tissue types defined in Ciona, 5 showed a one-to-one match in terms of tissue homology, namely, endoderm to foregut (E7.5), neuron to brain (E7.75), nerve cord to spinal cord (E7.75), notochord to notochord (E7.5), and germ line to primordial germ cell (PGC) (E7.0) (Fig. 7A, the earliest stage of mouse cell types with >10 cells; Fig. 7B, first two columns). The birth times of mouse cell types are not biased by the number of cells of each stage and are also evidenced by the onset of known cell type–specific markers (fig. S8A). The remaining five Ciona cell types do not have clear matches in mouse at E6.5-E8.5 because of heterochrony of development (muscle and epidermis) (45), different lineage route for the relevant cell types [TVC and trunk lateral cells (TLCs)] (46, 47), or derived ascidian-specific types (mesenchyme) (48) (Fig. 7B, first two columns).
Fig. 7. Comparison of single-cell transcriptomes of Ciona and mouse embryogenesis.
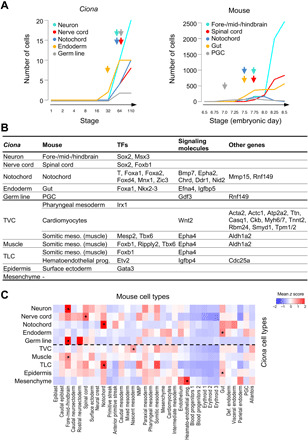
(A) Birth time of five tissues with clear homologous relationships in Ciona (left) and mouse (right). (B) Conserved DEGs in homologous tissues between Ciona and mouse. Top five tissues are considered as tissues with clear homology, i.e., one-on-one homologous tissue existing in mouse and a similar developmental stage in the mouse dataset. Ciona mesenchyme does not have homologous tissue in mouse. (C) Mean z scores of Ciona tissue-specific TFs in each mouse tissue. * denotes mouse tissues with the highest z score of tissue-specific TFs for each Ciona tissue. NMP, Neuro-mesodermal progenitors.
Next, we examined gene expression between Ciona and mouse cell types for patterns of conservation. Because the mouse study did not define DEGs for each cell type, we examined the expression of the homologous genes (table S4A) of the Ciona DEGs in corresponding mouse cell types. The most prominent pattern of conservation is shared expression of TFs (Fig. 7B and table S4). These include TFs essential for tissue specification. For cell types with clear homology, Sox2 is expressed in both Ciona and mouse neural tissues, Brachyury, Foxa1, and Mnx1 in the notochord, and Foxa1 in the endoderm (49). For Ciona TVC and TLC, we observed shared TF expression with their corresponding mouse cell types that would give rise to homologous cell types in their progeny. TVC shares Mesp2 and Tbx6 with mouse somitic mesoderm in the context of being a muscle progenitor (50) and Irx1 with the pharyngeal mesoderm in terms of the second heart field. The splanchnic mesoderm in mouse that gives rise to the first heart field was not identified in the published results. Similarly, TLC shares TFs with both mouse somitic mesoderm in terms of body muscle (Foxb1) and hematoendothelial progenitors [Etv2, (51)]. Ciona TVC, muscle, and TLC, all capable of giving rise to muscle, each express a unique combination of TFs that are coexpressed in mouse somitic mesoderm that gives rise to body muscle. In addition, Ciona epidermis expresses Gata3 that is essential for skin stem cell lineage determination (52). A few signaling molecules are also shared, such as Chrd in the notochord. However, the major signals for fate induction in mouse development are largely not, which may reflect the fact that fate allocation in the two species goes through different lineage route. Last, in terms of other types of genes, only TVC shows notable similarity to mouse in the context of the cardiomyocyte. The shared genes are structural genes for muscle in general. These results are based on the gene expression of each mouse cell type from its first appearance to E8.5. Using different time spans (table S4, C and D, 0.5 or 1 day after first appearance) did not affect the conserved gene list. Thus, conservation of gene expression between homologous cell types in Ciona and mouse embryo is limited to a small number of TFs important for tissue specification.
Last, we tested the possibility to identify homologous cell types de novo from expression data. We found that similarity based on tissue-specific TF expression was able to capture the homologous cell types. We calculated the similarity score for a given pair of Ciona and mouse cell type based on how specific the expressed TFs are to the given cell types, which is measured by the z score of a TF’s expression level within the species (see Materials and Methods for details). For four of the five Ciona tissues with clear mouse homology (neuron, nerve cord, notochord, and endoderm), the corresponding cell types show the best score (Fig. 7C). For the remaining five Ciona tissue types without clear homology, the similarity score led to spurious matches. It is worth noting that the scores for these spurious matches are not substantially lower compared to the correct matches above. That is, while homologous cell types are best matches for each other, not all best matches are homologous. Varying the time span in mouse (0.5 or 1 day after first appearance instead of to E8.5) did not improve the results (fig. S8B). Expanding the comparison to using tissue-specific DEGs instead of TFs produced worse results: Only two of the five pairs of homologous cell types were matched (fig. S8B). The deterioration is not a surprise given the observation in Fig. 7B that conservation of gene expression is limited to TFs that are essential for fate specification.
DISCUSSION
Single-cell technologies have revolutionized the developmental biology field and provide an unprecedented opportunity to reveal the role of individual cells in the developing embryo. However, embryos of most model organisms pose several challenges. First, at key tissue/cell type specification stage, embryos contain too many cells to sample using existing high-throughput platforms. Previous studies in mouse, zebrafish, or frog embryos often cover less than 5 to 10% of cells of a given embryo. Second, a given tissue type at a specific embryonic stage often contains cells of continuous development stages, making identification of the exact steps of cell fate specification and diversification difficult. Thus, these studies may provide an overview of major embryonic cell types but difficult to dissect detailed molecular events for lineage specification, progenitor-progeny relationship, and asymmetric cell fate specification. Instead, the ascidian embryo not only contains a low cell number (~100 at tissue specification and 2500 for larva) but also develops through invariant lineage, thus providing an ideal system for single-cell characterization of embryogenesis.
In this study, we chose a plate-based low-throughput approach and generated single-cell transcriptomes of C. savignyi embryos from fertilization up to early gastrulation. Instead of dissociating embryos together and sample cells from multiple embryos, we separately dissociated individual embryos and recorded the attribution of each cell. With this, our clustering results could be precisely validated using accurate cell number as a benchmark, and reliable clustering empowers us to explore gene dynamics along the true differentiation paths of Ciona invariant lineage. This approach was similarly used in a recent single-cell study of P. mammillata (12) and resulted in comparable results. By contrast, Cao et al. (11) used a droplet-based high-throughput method to study C. intestinalis embryogenesis from the 110-cell stage onward (11). This provides a unique case to compare the performance of two single-cell methods on comparable developmental systems. As to this, we revealed that despite the difference in cell coverage, our low-throughput data provide a comparable and, perhaps, better clustering result compared to their high-throughput data (16 versus 14 cell types), which implies that throughput and single-cell method both account for clustering quality.
Our work in FGF/MAPK perturbation, which enables systematic evaluation of FGF functions on Ciona cell types, identified unknown FGF-dependent fate transformation events, previously unidentified FGF targets, as well as new insights on asymmetric cell division: (i) Our data first showed that TVC (64-cell B7.5) adopts muscle fate upon FGF inhibition. (ii) We identified many FGF targets in different cell types, in particular, genes that are involved in notochord specification and working in parallel to Brachyury. (iii) The high precision of single-cell profiling allowed us to determine gene expression changes in the mother-daughter trio fate division process. We showed that in cases where FGF directly activates gene expression in the MAPK-positive progeny, the MAPK-negative progeny is very similar to the mother DEG expression, suggesting that FGF signaling may also act for asymmetric inheritance of mother DEGs and/or actively repress mother DEGs in the MAPK-positive daughter. This pattern is quite different from the mixed-state model of asymmetric cell division as observed in C. elegans and stem cell division, in which the mother cell has the signatures of both daughters (53, 54). More broadly, our FGF analysis illustrates that with whole-embryo single-cell studies of just a few perturbation experiments, one can resolve the major signaling requirements for embryonic cell fate specification, amounting decades of work with mutational and in situ analysis.
Single-cell data coupled with defined lineage development knowledge also allowed us to make new findings of GRN in lineage specification. In ascidian notochord development, Brachyury is long regarded as a master regulator of notochord fate (55, 56). However, only a subset of notochord-enriched genes is up-regulated by ectopic Brachyury expression (57), and Brachyury mutants still express certain notochord genes (58), indicating that Brachyury might not be a strictly defined master regulator. Our data detected the earlier activation of 18 notochord-specific genes before Brachyury, including TFs and signaling molecules. This result provides evidence to the idea that Brachyury together with Brachyury-independent genes act in parallel in notochord GRN for notochord specification. FGF-MAPK activates part of the parallel pathway in addition to activating Brachyury. In addition, our data also shed light on the differential activation of Brachyury between A- and B-line notochord. Traditional view holds that Brachyury is repressed by Snail in B-line at 64-cell stage and subsequently derepressed by Notch signaling at 110-cell stage. However, loss of Snail does not result in ectopic Brachyury expression in the muscle lineage (15), suggesting Snail repression may not be the only reason Brachyury is not turned on in 64-cell B-line notochord lineage. Our work identified one possible candidate, ZicL, a direct activator of Brachyury, which is expressed at much lower levels in 64-cell B-line than A-line (B7.3 < A7.3/7) and may not be sufficient for initiating Brachyury expression at 64-cell B-line notochord.
As more single-cell data become available regarding model organism embryonic development, it offers the chance to systematically examine the similarities and differences between homologous tissue/cell types across different species. A previous cross-species comparison (1) successfully aligned ~70% cell types between zebrafish and Xenopus, indicating broad conservation of lineage topologies between species. Spanning a larger evolutionary distance, our comparison between Ciona and mouse could link 50% of the Ciona cell types. Despite the different extent of conservation, epidermis and mesoderm tissues stand out as distinct cell types in both comparisons, suggesting the diversity of lineage topologies in these tissues. When it comes to conserved gene expression of homologous tissues, Sobral et al. (59) found a broad divergence in expression profiles between Ciona and zebrafish. Briggs and colleagues (1) reached a similar conclusion comparing between zebrafish and Xenopus that only a subset of genes are shared between homologous tissues and mostly limited to TFs, especially those of core regulators of tissue fates. This unexpectedly low level of conservation detected between Ciona and mouse, between Ciona and zebrafish, and between frog and fish indicates that only a small set of key regulators are conserved over evolution, while their upstream activators as well as downstream targets can drift. A similar notion is reflected in the developmental toolkit genes theory (60), although it is still unexpected to see that even at relatively short evolutionary distances, conservation of gene expression is reduced to key TFs.
MATERIALS AND METHODS
Animals and embryology
Fecund C. savignyi animals were collected from the Jiaozhou Bay in Qingdao, Shandong and kept in 18°C circulation seawater tank. Fertilization, dechorionation, and embryo cultures were done as previously described (61). For FGF-MAPK drug inhibitor experiments, embryos were grown in seawater containing U0126 (2 μg/ml) from 1-cell stage and kept to 64-cell stage for dissociation.
For embryo dissociation, staged embryos were transferred to Ca2+/Mg2+-free artificial seawater (61) containing freshly prepared 0.1% trypsin (MP Biomedicals). Single embryos were gently pipetted using a mouth pipette until all blastomeres dissociated. All blastomeres from a single embryo were transferred to a new dish of fresh seawater at 4°C, after which cells were individually transferred using a glass capillary needle attached to a mouth pipette to polymerase chain reaction (PCR) tubes containing the Smart-seq2 lysis buffer (62). The tubes were flash-frozen in liquid nitrogen and temporarily stored at −80°C before library preparation.
Single-cell RNA sequencing
A modified Smart-seq2 protocol with an 8–base pair (bp) barcode and 9-bp UMI in reverse transcription (RT)–primers was used to allow sample pooling and amplification bias removing. RT and preamplification were processed as the Smart-seq2 protocol. Briefly, cells in lysis buffer were thawed on ice, put on a 72°C thermal cycler for 3 min to denature, and immediately put on ice for annealing. RT mixture with template-switching oligos was added and proceeded using the following PCR steps: 42°C for 90 min and then 10 cycles of 50°C for 2 min, 42°C for 2 min, and last, 70°C 15 min. cDNA preamplification was performed for 12, 13, 14, 15, 16, and 17 cycles, respectively, for 1/2-cell, 4-cell, 8-cell, 16-cell, 32-cell, and 64/110-cell stage samples.
cDNA libraries from different cells were pooled and purified for subsequent sequencing library construction. cDNA (500 pg) of each pooled sample was fragmented and tagged and the 3′ end amplified according to the Nextera XT instructions except that a custom P5 primer was used for amplification. Libraries were sequenced on an Illumina HiSeq X Ten platform with a custom read1 sequencing primer. We used the 150-bp paired-end and 8-bp index mode, consistent with default X Ten machine settings. Each cell was sequenced for an average depth of 500,000 paired-end reads.
In situ hybridization
We performed in situ hybridization in both wild-type and U0126-treated embryos at the 64-cell stage. For drug-treated embryos, embryos were also grown in seawater containing U0126 (2 μg/ml) from 1-cell stage. Embryos were hybridized in situ with probes for ZicL (36) and lefty (63) using standard protocols described previously (64).
Gene classification
The C. savignyi gene model (CSAV2.0; Ensembl) was first compared against the gene models from C. intestinalis (KH2012; Aniseed) by BLASTP to transfer the functional annotation of the genes in C. intestinalis by orthology. Mutual best hit with identity >30% and an e value of <1−3 were considered as orthologs. The reference of all the gene models is provided in table S2. TFs (n = 387) in C. savignyi were downloaded from DBD (database of predicted TFs) (17). TFs (n = 1506) in Mus musculus were downloaded from TcoF-DB v2 (65). Ciona and mouse orthologous genes were downloaded from Ensembl. In addition, DEGs in Ciona that do not have Ensembl orthologs were matched to mouse genes on the basis of sequence similarity. Specifically, top BLASTP hits (maximal n = 3) with an e value of <10−10 and alignment length >30% were considered as orthologs. Among the DEGs in Ciona, 158 genes have Ensembl-assigned orthologs, and 45 have orthologs upon BLASTP (table S4A).
Gene ontology (GO) annotations for each gene were downloaded from Ensembl. Thirteen categories of GO terms were sequentially matched to GO terms of each DEG in the following order: TF, chromatin, RNA binding/splicing, protease/ubiquitin, signaling pathway, adhesion, extracellular matrix, cytoskeleton/microtubule, myosin/kinesin/dynein, vesicle, MT, metabolism, and membrane. Each gene is only assigned to one category. Genes whose GO annotation do not match to any category were assigned to “other.” Genes without any GO annotation were assigned to “unknown.”
Data processing of scRNA-seq
Drop-seq software (66) was used for data demultiplexing, reads alignment, and cellular-molecular barcodes processing. Barcodes (9 to 16 bp) and UMI (17 to 25 bp) extracted from read1 were added to read2 as tags. PolyA tail sequence and template switch oligo sequence were trimmed. Only read2 were mapped to the C. savignyi genome (CSAV2.0, Ensembl). A “GE” tag was added onto reads when the read overlaps the exon of a gene. Reads of used exact barcodes were counted to get the raw count matrix. The raw and processed data were deposited into Gene Expression Omnibus (GEO) (GSE113788). Low-quality cells with the number of detected genes less than 2000 were removed. Genes with per-embryo effect were considered systemic errors and removed from downstream analysis. Per-embryo effect was defined as greater than twofold difference on average UMIs between any pair of embryos at the same developmental stage. Normalization were performed by DESeq2 (67) in cells at each developmental stage.
Definition of clusters and DEGs through iterative clustering
Selection of HVGs
We used two methods (fig. S1, B and C) to select HVGs at each developmental stage as described below. The hypothesis is that HVGs do not conform to Poisson distribution as most of the genes. Genes from both methods were then merged as the HVGs at each stage.
Method 1
1) Theory: pi(k = 0) = yi = n · e−xi in Poisson distribution, where x is the mean and y is the number of 0 count.
2) Plot 0 count against log2 mean for each gene.
3) Tentative outliers on this plot were detected by k-nearest-neighbors distance (R package DDoutlier, k = 3 to 6, distance <15). The boundary between inliers and outliers was further smoothed by local polynomial regression fitting on maximal inliers on each value on the y axis. Final outliers were considered as genes out of the smooth boundary.
4) To exclude genes with low expression, HVGs were defined as outliers with a mean of >0.1 and number of 0 count >10% × n, where n is the total number of cells at each stage.
Method 2
1) Theory , σ2 = μ in Poisson distribution.
2) Plot CV2 against log2 mean.
3) Outliers on this plot were detected by confidence line (P = 0.999) of linear regression.
4) Same with method 1.4 to exclude genes with low expression, HVGs were defined as outliers with a mean of >0.1 and number of 0 count >10% × n, where n is the total number of cells at each stage.
Initial clustering of cells
Dimension reduction at each developmental stage was performed by t-distributed stochastic neighbor embedding (t-SNE) using HVGs (R package Seurat; parameters were set according to cell number, as listed in Table 1). Clustering was performed in t-SNE space with local density clustering (R package dbscan). To optimize parameters of dbscan, we enumerate the combination of parameter k (minimal number of points required to form a dense region: 2 to 6) and parameter eps (size of neighborhood: range from the minimal pairwise distance to the maximum pairwise distance in a step of 0.1). The objective function for the parameter search is to minimize the global Davies-Bouldin index , where Si is the average distance of all points in cluster i to its centroid, Mij is the distance between the centroids of cluster i and cluster j, and n is the number of clusters. Table 2 lists the optimized parameters of dbscan and DB index of clustering.
Table 1. Parameters used for different cell numbers in Seurat clustering.
PCA, principal components analysis.
|
Number of cells |
(0,10] | (10,20] | (20,40] | (40,60] | (60,100] | n > 100 |
| PCA dim | 5 | 10 | 10 | 15 | 20 | 30 |
| t-SNE dim | 5 | 5 | 8 | 10 | 15 | 20 |
| Perplexity | 1 | 3 | 5 | 10 | 10 | 20 |
Table 2. Optimized parameters for dbscan and DB index of clustering.
| Stage | k | eps | DB index |
| C4 | 3 | 38.8 | 0.31 |
| C8 | 4 | 39.3 | 0.38 |
| C16 | 4 | 13.8 | 0.52 |
| C32 | 3 | 4.2 | 0.38 |
| C64 | 4 | 1.8 | 0.50 |
| C110 | 2 | 1.6 | 0.59 |
Iterative clustering of cells
To obtain high resolution on cell types, we applied iterative clustering to resolve nested cell types (fig. S2).
Further division of a given cluster
1) Further clustering of a given cluster is based on the same t-SNE and DBSCAN-based method used for initial clustering. HVGs used in further clustering are filtered from global HVGs from step 1with an average UMI of >0.5 in the given cluster (Fig. 1D).
2) Each tentative cluster produced by further clustering is evaluated for the difference to its closest cluster and will only be accepted as a cluster if the difference is significant. The closest cluster is defined by the local Davies-Bouldin index, i.e., cluster j in is the closest cluster for cluster i. To evaluate the difference between cluster i and j, we first identify genes from the HVGs whose expression is significantly different between the two groups of cells. For each gene, a P value is calculated on the basis of the Wilcoxon rank sum test, where cells are ranked by the UMI of the given gene. A gene is considered significantly different if P < 0.01. The cumulative difference for two clusters, dij, is defined as , where pk is the P value of significant gene k and n is the number of significant genes. The significance of dij is further evaluated by a background distribution. This background is calculated by randomly sampling two groups of cells from all cells of the same developmental stage, with one group matching the number of cells in cluster i and the other cluster j. A d value is calculated for the sampled two groups. The distribution of d is compiled by repeating the random sampling 1000 times.
3) Iterative clustering was applied on each cluster until it reached any of the following four terminal conditions. (i) Number of cells less than 4, (ii) no partition by dbscan, (iii) further clustering identified a tentative cluster from one embryo (residual batch effect becomes locally dominant), and (iv) significance of difference between the tentative clusters show P > 0.01 as calculated above.
Merge clusters
Check whether any cluster can be merged after all clusters meet the termination condition. Merge clusters to its closest cluster if their significance of difference P is >0.01.
Definition of tentative DEGs
DEGs for a given developmental stage were defined as genes that have statistically significant difference between some cell types with high expression and other cell types with low/no expression. Wilcoxon test was used to measure the statistical difference.
Method
To define high- and low/no-expression groups for a given gene, we first sort cell types by their average expression level of the given gene. At each possible position to bisect the sorted list, we calculate the P value by Wilcoxon test between the two groups of cell types. The bisection with the minimal P value is used to define high- and low/no-expression groups.
Thresholds
1) Mean count in high-expression group >0.5.
2) Fold difference between high and low/no group >1.8.
3) Wilcoxon P value cutoffs at different developmental stages (higher cell number at late developmental stages gives a more significant P value, i.e., C4, 0.01; C8, 0.01; C16, 10−5; C32, 10−5; C64, 10−7; C110, 10−9.)
Special case
The 16-cell stage had the lowest detection ratio of known markers. Therefore, we used a more sophisticated process to recover the tentative DEGs at this stage. First, we used a more stringent cutoff of Wilcoxon P value compared with the other stages (see Thresholds above) to generate a core set of high-quality DEGs. Next, we searched for genes that show good correlation with any high-quality DEG (Pearson’s correlation coefficient > 0.6).
Reclassification of individual cells
To examine whether a cell truly belongs to the cluster that it has been assigned to, we compare the gene expression profile of the cell to that of the cluster (fig. S2).
Method
1) The gene expression profile of each cluster is defined as the vector of mean expression values of the tentative DEGs. The gene expression profile of the cell is defined as the vector of expression values of the tentative DEGs.
2) The similarity between a cell and a given cluster is measured by Pearson’s correlation. Genes with an expression value of 0 are excluded from the vectors before Pearson’s correlation was calculated (UMI in an individual cell ≤4 or mean UMI in a cluster ≤ 0.5). The P value of the correlation was calculated using Student’s t-distribution with degrees of freedom n − 2 (n is the length of the vector).
3) If the P value is <10−5, then the cell belongs to the cluster. If, for a cell, there are more than one cluster with P value of <10−5, assign the cell to the cluster with the minimal P value. If, for a cell, there is no cluster with P value of <10−5, then it is rejected as a vague cell.
4) After all cells are assigned as described above, we further examine each cluster for outliers based on the P value used above. Specifically, for each cluster in each embryo, cells were sorted by the P value. Moving from the most significant P value to the least, we examined the difference in P value between adjacent cells. If the less significant P value is 50-fold greater or more, then this less significant cell as well as all cells after it in the sorted list are rejected as outliers.
Final list of cell types and DEGs
After reclassification of individual cells, all cells remain in a cluster is consider the final list of cells for the cluster (table S3A). Final DEGs were computed on the basis of the final list of cells for each cluster using the same method of defining tentative DEGs.
Assignment of lineage identity
Assignment of canonical cell types/lineage identity was based on known markers (15). The relationship between cell clusters and canonical cell types was documented in table S1E.
Special cases
1) B at four-cell stage and B4.1 at eight-cell stage: When we proceeded to assign cell types and define DEGs, we found B and B4.1 subdivided into two clusters violating expected cell number per embryo. So, we rejected the subdivision and took the superclusters that correspond to B and B4.1.
2) The A-line and B-line notochord at 110-cell stage showed the weakest separation (P = 0.036 between the two groups). The legitimacy of their difference is systematically documented in fig. S7 and related text. ZicL expression was used to assign lineage identity between the two groups (15).
Identification of zygotic transcription
We detect potential zygotic transcription by searching for genes whose expression level is significant higher in a cell compared to that of its mother cell by two criteria: (i) not detected in mother or ancestors (average UMI in cell type <0.2 or total UMI in cell type ≤2) and (ii) robust detection in self (average UMI > 0.5 and fraction of positive cells in type ≥ 0.5) or present in self (average UMI > 0.25) but robust detection in one of its daughters. To focus on the earliest zygotic expression, we examined each mother-daughter pair from 1- to 16-cell stage.
Analysis of scRNA-seq data in drug-treated embryos
Data preprocessing and iterative clustering of scRNA-seq data in drug-treated embryos were performed as described above (Fig. 1D).
Matching cell types between drug-treated and wild-type embryo
For cell types in drug-treated embryos without fate transform, we considered wild-type cell type with the most similar expression of DEGs as its cell type. For cell types transforming cell fate, the expression of retained DEGs could be used to infer its presumptive cell type. The numbers of cells per cell type per drug-treated embryo agree with the expected number of cells.
Method
1) Calculate nonzero (mean of count > 0.5) correlation of mean expression of DEGs at 64-cell stage between clusters of drug-treated embryos and wild-type cell types (table S1D).
2) The most similar cell type in wild-type type is considered as the cell type for each cell cluster of drug treated embryos.
3) DEGs at 64-cell stage were used to distinguish cell types in a mixture cluster caused by fate transformation (table S1D).
B7.5 fate transformation
B7.4/5 is a mixture of B7.4 and B7.5. No retained DEG could distinguish B7.5 from B7.4. Because the probability of losing all four B7.5 cells is very low (; 6 cells were lost in a total of 128 cells from two drug-treated embryos), we concluded that B7.5 is transformed to B7.4.
The global hierarchy of cell type similarities
The similarity between cell types in wild-type and drug-treated embryos was visualized by SplitsTree (30). As input for SplitsTree, pairwise distances between cell types used in SplitsTree were computed as 1 − Jaccard index of the overlap of their DEGs.
MT cosegregating genes
To search for genes that have similar asymmetric expression as MT-encoded genes, we required uneven gene expression in all three pairs of asymmetrical divisions (A7.4/8 > A7.3/7, B7.4 > B7.3, and B7.8 > B7.7). Specifically, in wild-type embryos, genes with fold differences in three pairs greater than 1.5 and average UMI greater than 0.5 in high-expression cells (A7.4/8, B7.4, and B7.8) were defined as MT cosegregating genes. In drug-treated embryos, MT cosegregating genes with 1.5 or higher fold differences in A7.4/8 versus A7.3/7 and B7.4/8 versus B7.3/7 were considered as remaining asymmetrical, and those with 1.2 or lower fold differences in those two pairs were considered as losing asymmetrical.
Similarity of cell types between Ciona and mouse
When evaluating the similarity of gene expression, we consider the specificity of the shared genes. To measure the specificity of a gene in a species, we consider the distribution of its expression value across the cell types of the species (average UMI for each cell type). On the basis of this distribution, the given gene gets a z score for each cell type. The higher the z score, the more specific the gene is to the cell type.
Because the published study of the mouse dataset did not define DEGs, we focused on the DEGs defined in the Ciona cell types and examine the expression of their orthologs in the mouse cell types. For a given cell type in Ciona, we select all of its DEGs that have a z score (see above) of >2, that is, the DEGs that are more specific to the given cell type. When comparing to a mouse cell type, we calculate the average z score for the orthologs of the DEGs selected in the given Ciona cell type. This average z score is used as the similarity score of the mouse cell type to the given Ciona cell type. When similarity is measured by TFs, we use the TFs in the DEGs of a given Ciona cell type, followed by the same selection of z score > 2.
Supplementary Material
Acknowledgments
We thank K. Anderson, M. Baylies, A. Joyner, A.-K. Hadjantonakis, D. Huangfu, and E. Lacy for discussions. Funding: Z.B. is partially supported by an NIH grant (R01GM097576) and an NIH center grant to MSKCC (P30CA008748). W.S. is supported by the Funding Project of National Key Research and Development Program of China (2018YFD0900604), Natural Science Foundation of China (41676119 and 41476120), and a start-up fund from Ocean University of China. T.Y. is partially supported by NIH grant R01GM124061 and a grant from the University Development Fund of CUHK-Shenzhen (UDF01001585). K.I. is supported by the Japan Society for the Promotion of Science grant 18H02376. Y.S. is supported by the Japan Society for the Promotion of Science grant 17KT0020. B.D. is supported by the Fundamental Research Funds for the Central Universities from the Ocean University of China (201822016). Author contributions: W.S., T.Y., and Z.B. conceived the project. T.Z. and W.S. performed the single-cell sequencing experiments. T.Z., Y.X., T.F., T.Y., and Z.B. performed the bioinformatics analysis. K.I., Y.S., G.W., and B.D. performed the in situ experiments. W.S. and Z.B. wrote the paper with input from all authors. Competing interests: The authors declare that they have no competing interests. Data and materials availability: The raw data and gene counts table are available from GEO under accession number (GSE113788). All data needed to evaluate the conclusions in the paper are present in the paper and/or the Supplementary Materials. Additional data related to this paper may be requested from the authors.
SUPPLEMENTARY MATERIALS
Supplementary material for this article is available at http://advances.sciencemag.org/cgi/content/full/6/45/eabc4773/DC1
REFERENCES AND NOTES
- 1.Briggs J. A., Weinreb C., Wagner D. E., Megason S., Peshkin L., Kirschner M. W., Klein A. M., The dynamics of gene expression in vertebrate embryogenesis at single-cell resolution. Science 360, eaar5780 (2018). [DOI] [PMC free article] [PubMed] [Google Scholar]
- 2.Cao J., Spielmann M., Qiu X., Huang X., Ibrahim D. M., Hill A. J., Zhang F., Mundlos S., Christiansen L., Steemers F. J., Trapnell C., Shendure J., The single-cell transcriptional landscape of mammalian organogenesis. Nature 566, 496–502 (2019). [DOI] [PMC free article] [PubMed] [Google Scholar]
- 3.Farrell J. A., Wang Y. Q., Riesenfeld S. J., Shekhar K., Regev A., Schier A. F., Single-cell reconstruction of developmental trajectories during zebrafish embryogenesis. Science 360, eaar3131 (2018). [DOI] [PMC free article] [PubMed] [Google Scholar]
- 4.Pijuan-Sala B., Griffiths J. A., Guibentif C., Hiscock T. W., Jawaid W., Calero-Nieto F. J., Mulas C., Ibarra-Soria X., Tyser R. C. V., Ho D. L. L., Reik W., Srinivas S., Simons B. D., Nichols J., Marioni J. C., Göttgens B., A single-cell molecular map of mouse gastrulation and early organogenesis. Nature 566, 490–495 (2019). [DOI] [PMC free article] [PubMed] [Google Scholar]
- 5.Wagner D. E., Weinreb C., Collins Z. M., Briggs J. A., Megason S. G., Klein A. M., Single-cell mapping of gene expression landscapes and lineage in the zebrafish embryo. Science 360, 981–987 (2018). [DOI] [PMC free article] [PubMed] [Google Scholar]
- 6.Alemany A., Florescu M., Baron C. S., Peterson-Maduro J., van Oudenaarden A., Whole-organism clone tracing using single-cell sequencing. Nature 556, 108–112 (2018). [DOI] [PubMed] [Google Scholar]
- 7.Raj B., Wagner D. E., McKenna A., Pandey S., Klein A. M., Shendure J., Gagnon J. A., Schier A. F., Simultaneous single-cell profiling of lineages and cell types in the vertebrate brain. Nat. Biotechnol. 36, 442–450 (2018). [DOI] [PMC free article] [PubMed] [Google Scholar]
- 8.Sulston J. E., Schierenberg E., White J. G., Thomson J. N., The embryonic cell lineage of the nematode Caenorhabditis elegans. Dev. Biol. 100, 64–119 (1983). [DOI] [PubMed] [Google Scholar]
- 9.Kumano G., Nishida H., Ascidian embryonic development: An emerging model system for the study of cell fate specification in chordates. Dev. Dyn. 236, 1732–1747 (2007). [DOI] [PubMed] [Google Scholar]
- 10.Satoh N., Satou Y., Davidson B., Levine M., Ciona intestinalis: An emerging model for whole-genome analyses. Trends Genet. 19, 376–381 (2003). [DOI] [PubMed] [Google Scholar]
- 11.Cao C., Lemaire L. A., Wang W., Yoon P. H., Choi Y. A., Parsons L. R., Matese J. C., Wang W., Levine M., Chen K., Comprehensive single-cell transcriptome lineages of a proto-vertebrate. Nature 571, 349–354 (2019). [DOI] [PMC free article] [PubMed] [Google Scholar]
- 12.Sladitschek H. L., Fiuza U.-M., Pavlinic D., Benes V., Hufnagel L., Neveu P. A., MorphoSeq: Full single-cell transcriptome dynamics up to gastrulation in a chordate. Cell 181, 922–935.e21 (2020). [DOI] [PMC free article] [PubMed] [Google Scholar]
- 13.M. Ester, H.-P. Kriegel, R. Sander, X. Xu, A density-based algorithm for discovering clusters a density-based algorithm for discovering clusters in large spatial databases with noise, in Proceedings of the Second International Conference on Knowledge Discovery and Data Mining (1996), pp. 226–231. [Google Scholar]
- 14.Imai K. S., Hino K., Yagi K., Satoh N., Satou Y., Gene expression profiles of transcription factors and signaling molecules in the ascidian embryo: Towards a comprehensive understanding of gene networks. Development 131, 4047–4058 (2004). [DOI] [PubMed] [Google Scholar]
- 15.Imai K. S., Levine M., Satoh N., Satou Y., Regulatory blueprint for a chordate embryo. Science 312, 1183–1187 (2006). [DOI] [PubMed] [Google Scholar]
- 16.Tokuhiro S.-i., Tokuoka M., Kobayashi K., Kubo A., Oda-Ishii I., Satou Y., Differential gene expression along the animal-vegetal axis in the ascidian embryo is maintained by a dual functional protein Foxd. PLOS Genet. 13, e1006741 (2017). [DOI] [PMC free article] [PubMed] [Google Scholar]
- 17.Charoensawan V., Wilson D., Teichmann S. A., Genomic repertoires of DNA-binding transcription factors across the tree of life. Nucleic Acids Res. 38, 7364–7377 (2010). [DOI] [PMC free article] [PubMed] [Google Scholar]
- 18.Satou Y., Imai K. S., Satoh N., Early embryonic expression of a LIM-homeobox gene Cs-lhx3 is downstream of beta-catenin and responsible for the endoderm differentiation in Ciona savignyi embryos. Development 128, 3559–3570 (2001). [DOI] [PubMed] [Google Scholar]
- 19.Christiaen L., Stolfi A., Davidson B., Levine M., Spatio-temporal intersection of Lhx3 and Tbx6 defines the cardiac field through synergistic activation of Mesp. Dev. Biol. 328, 552–560 (2009). [DOI] [PubMed] [Google Scholar]
- 20.Oda-Ishii I., Satou Y., Initiation of the zygotic genetic program in the ascidian embryo. Semin. Cell Dev. Biol. 84, 111–117 (2018). [DOI] [PubMed] [Google Scholar]
- 21.Lamy C., Rothbächer U., Caillol D., Lemaire P., Ci-FoxA-a is the earliest zygotic determinant of the ascidian anterior ectoderm and directly activates Ci-sFRP1/5. Development 133, 2835–2844 (2006). [DOI] [PubMed] [Google Scholar]
- 22.Miya T., Nishida H., Expression pattern and transcriptional control of SoxB1 in embryos of the ascidian Halocynthia roretzi. Zoolog. Sci. 20, 59–67 (2003). [DOI] [PubMed] [Google Scholar]
- 23.Treen N., Heist T., Wang W., Levine M., Depletion of maternal cyclin B3 contributes to zygotic genome activation in the Ciona embryo. Curr. Biol. 28, 1330–1331 (2018). [DOI] [PubMed] [Google Scholar]
- 24.Yamada L., Kobayashi K., Satou Y., Satoh N., Microarray analysis of localization of maternal transcripts in eggs and early embryos of the ascidian, Ciona intestinalis. Dev. Biol. 284, 536–550 (2005). [DOI] [PubMed] [Google Scholar]
- 25.Prodon F., Yamada L., Shirae-Kurabayashi M., Nakamura Y., Sasakura Y., Postplasmic/PEM RNAs: A class of localized maternal mRNAs with multiple roles in cell polarity and development in ascidian embryos. Dev. Dynam. 236, 1698–1715 (2007). [DOI] [PubMed] [Google Scholar]
- 26.Shi W., Levine M., Ephrin signaling establishes asymmetric cell fates in an endomesoderm lineage of the Ciona embryo. Development 135, 931–940 (2008). [DOI] [PubMed] [Google Scholar]
- 27.Imai K. S., Satoh N., Satou Y., Early embryonic expression of FGF4/6/9 gene and its role in the induction of mesenchyme and notochord in Ciona savignyi embryos. Development 129, 1729–1738 (2002). [DOI] [PubMed] [Google Scholar]
- 28.Kim G. J., Nishida H., Role of the FGF and MEK signaling pathway in the ascidian embryo. Dev. Growth Differ. 43, 521–533 (2001). [DOI] [PubMed] [Google Scholar]
- 29.Sakabe E., Tanaka N., Shimozono N., Gojobori T., Fujiwara S., Effects of U0126 and fibroblast growth factor on gene expression profile in Ciona intestinalis embryos as revealed by microarray analysis. Dev. Growth Differ. 48, 391–400 (2006). [DOI] [PubMed] [Google Scholar]
- 30.Huson D. H., Bryant D., Application of phylogenetic networks in evolutionary studies. Mol. Biol. Evol. 23, 254–267 (2006). [DOI] [PubMed] [Google Scholar]
- 31.Negishi T., Yasuo H., Distinct modes of mitotic spindle orientation align cells in the dorsal midline of ascidian embryos. Dev. Biol. 408, 66–78 (2015). [DOI] [PubMed] [Google Scholar]
- 32.Katayama M., Zhong Z., Lai L., Sutovsky P., Prather R. S., Schatten H., Mitochondrial distribution and microtubule organization in fertilized and cloned porcine embryos: Implications for developmental potential. Dev. Biol. 299, 206–220 (2006). [DOI] [PMC free article] [PubMed] [Google Scholar]
- 33.Van Blerkom J., Davis P., Alexander S., Differential mitochondrial distribution in human pronuclear embryos leads to disproportionate inheritance between blastomeres: Relationship to microtubular organization, ATP content and competence. Hum. Reprod. 15, 2621–2633 (2000). [DOI] [PubMed] [Google Scholar]
- 34.Annona G., Holland N. D., D’Aniello S., Evolution of the notochord. EvoDevo 6, 30 (2015). [DOI] [PMC free article] [PubMed] [Google Scholar]
- 35.Satoh N., Tagawa K., Takahashi H., How was the notochord born? Evol. Dev. 14, 56–75 (2012). [DOI] [PubMed] [Google Scholar]
- 36.Imai K. S., Satou Y., Satoh N., Multiple functions of a Zic-like gene in the differentiation of notochord, central nervous system and muscle in Ciona savignyi embryos. Development 129, 2723–2732 (2002). [DOI] [PubMed] [Google Scholar]
- 37.Imai K. S., Satoh N., Satou Y., An essential role of a FoxD gene in notochord induction in Ciona embryos. Development 129, 3441–3453 (2002). [DOI] [PubMed] [Google Scholar]
- 38.Yagi K., Satou Y., Satoh N., A zinc finger transcription factor, ZicL, is a direct activator of Brachyury in the notochord specification of Ciona intestinalis. Development 131, 1279–1288 (2004). [DOI] [PubMed] [Google Scholar]
- 39.Hudson C., Sirour C., Yasuo H., Co-expression of Foxa.a, Foxd and Fgf9/16/20 defines a transient mesendoderm regulatory state in ascidian embryos. eLife 5, e14692 (2016). [DOI] [PMC free article] [PubMed] [Google Scholar]
- 40.Hudson C., Yasuo H., A signalling relay involving Nodal and Delta ligands acts during secondary notochord induction in Ciona embryos. Development 133, 2855–2864 (2006). [DOI] [PubMed] [Google Scholar]
- 41.Fujiwara S., Corbo J. C., Levine M., The snail repressor establishes a muscle/notochord boundary in the Ciona embryo. Development 125, 2511–2520 (1998). [DOI] [PubMed] [Google Scholar]
- 42.Hudson C., Yasuo H., Patterning across the ascidian neural plate by lateral Nodal signalling sources. Development 132, 1199–1210 (2005). [DOI] [PubMed] [Google Scholar]
- 43.Reeves W. M., Shimai K., Winkley K. M., Veeman M. T., Brachyury controls Ciona notochord fate as part of a feedforward network and not as a unitary master regulator. bioRxiv 10.1101/2020.05.29.124024 , (2020). [Google Scholar]
- 44.Tada M., Notochord morphogenesis: A prickly subject for ascidians. Curr. Biol. 15, R14–R16 (2005). [DOI] [PubMed] [Google Scholar]
- 45.Byrne C., Tainsky M., Fuchs E., Programming gene expression in developing epidermis. Development 120, 2369–2383 (1994). [DOI] [PubMed] [Google Scholar]
- 46.Anderson H. E., Christiaen L., Ciona as a simple chordate model for heart development and regeneration. J. Cardiovasc. Dev. Dis. 3, 25 (2016). [DOI] [PMC free article] [PubMed] [Google Scholar]
- 47.Jeffery W. R., Chiba T., Krajka F. R., Deyts C., Satoh N., Joly J.-S., Trunk lateral cells are neural crest-like cells in the ascidian Ciona intestinalis: Insights into the ancestry and evolution of the neural crest. Dev. Biol. 324, 152–160 (2008). [DOI] [PubMed] [Google Scholar]
- 48.Tokuoka M., Imai K. S., Satou Y., Satoh N., Three distinct lineages of mesenchymal cells in Ciona intestinalis embryos demonstrated by specific gene expression. Dev. Biol. 274, 211–224 (2004). [DOI] [PubMed] [Google Scholar]
- 49.Kaestner K. H., The FoxA factors in organogenesis and differentiation. Curr. Opin. Genet. Dev. 20, 527–532 (2010). [DOI] [PMC free article] [PubMed] [Google Scholar]
- 50.Windner S. E., Doris R. A., Ferguson C. M., Nelson A. C., Valentin G., Tan H., Oates A. C., Wardle F. C., Devoto S. H., Tbx6, Mesp-b and Ripply1 regulate the onset of skeletal myogenesis in zebrafish. Development 142, 1159–1168 (2015). [DOI] [PMC free article] [PubMed] [Google Scholar]
- 51.Garry D. J., Etv2 is a master regulator of hematoendothelial lineages. Trans. Am. Clin. Climatol. Assoc. 127, 212–223 (2016). [PMC free article] [PubMed] [Google Scholar]
- 52.Kaufman C. K., Zhou P., Pasolli H. A., Rendl M., Bolotin D., Lim K.-C., Dai X., Alegre M.-L., Fuchs E., GATA-3: An unexpected regulator of cell lineage determination in skin. Genes Dev. 17, 2108–2122 (2003). [DOI] [PMC free article] [PubMed] [Google Scholar]
- 53.Packer J. S., Zhu Q., Huynh C., Sivaramakrishnan P., Preston E., Dueck H., Stefanik D., Tan K., Trapnell C., Kim J., Waterston R. H., Murray J. I., A lineage-resolved molecular atlas of C. elegans embryogenesis at single-cell resolution. Science 365, eaax1971 (2019). [DOI] [PMC free article] [PubMed] [Google Scholar]
- 54.Frias-Aldeguer J., Kip M., Vivié J., Li L., Alemany A., Korving J., Darmis F., van Oudenaarden A., Van Blitterswijk C. A., Geijsen N., Rivron N. C., Embryonic signals perpetuate polar-like trophoblast stem cells and pattern the blastocyst axis. bioRxiv 2019, 510362 (2019). [Google Scholar]
- 55.Yasuo H., Satoh N., Conservation of the developmental role of Brachyury in notochord formation in a urochordate, the ascidian Halocynthia roretzi. Dev. Biol. 200, 158–170 (1998). [DOI] [PubMed] [Google Scholar]
- 56.Takahashi H., Hotta K., Erives A., Di Gregorio A., Zeller R. W., Levine M., Satoh N., Brachyury downstream notochord differentiation in the ascidian embryo. Genes Dev. 13, 1519–1523 (1999). [DOI] [PMC free article] [PubMed] [Google Scholar]
- 57.Reeves W. M., Wu Y., Harder M. J., Veeman M. T., Functional and evolutionary insights from the Ciona notochord transcriptome. Development 144, 3375–3387 (2017). [DOI] [PMC free article] [PubMed] [Google Scholar]
- 58.José-Edwards D. S., Kerner P., Kugler J. E., Deng W., Jiang D., Di Gregorio A., The identification of transcription factors expressed in the notochord of Ciona intestinalis adds new potential players to the brachyury gene regulatory network. Dev. Dyn. 240, 1793–1805 (2011). [DOI] [PMC free article] [PubMed] [Google Scholar]
- 59.Sobral D., Tassy O., Lemaire P., Highly divergent gene expression programs can lead to similar chordate larval body plans. Curr. Biol. 19, 2014–2019 (2009). [DOI] [PubMed] [Google Scholar]
- 60.Carroll S. B., Evo-devo and an expanding evolutionary synthesis: A genetic theory of morphological evolution. Cell 134, 25–36 (2008). [DOI] [PubMed] [Google Scholar]
- 61.Christiaen L., Wagner E., Shi W., Levine M., Isolation of sea squirt (Ciona) gametes, fertilization, dechorionation, and development. Cold Spring Harb. Protoc. 2009, pdb.prot5344 (2009). [DOI] [PubMed] [Google Scholar]
- 62.Picelli S., Faridani O. R., Björklund Å. K., Winberg G., Sagasser S., Sandberg R., Full-length RNA-seq from single cells using Smart-seq2. Nat. Protoc. 9, 171–181 (2014). [DOI] [PubMed] [Google Scholar]
- 63.Imai K. S., Isolation and characterization of β-catenin downstream genes in early embryos of the ascidian Ciona savignyi. Differentiation 71, 346–360 (2003). [DOI] [PubMed] [Google Scholar]
- 64.Yasuo H., Satoh N., An ascidian homolog of the mouse Brachyury(T) gene is expressed exclusively in notochord cells at the fate restricted stage. Dev. Growth Differ. 36, 9–18 (1994). [DOI] [PubMed] [Google Scholar]
- 65.Schmeier S., Alam T., Essack M., Bajic V. B., TcoF-DB v2: Update of the database of human and mouse transcription co-factors and transcription factor interactions. Nucleic Acids Res. 45, D145–D150 (2017). [DOI] [PMC free article] [PubMed] [Google Scholar]
- 66.Macosko E. Z., Basu A., Satija R., Nemesh J., Shekhar K., Goldman M., Tirosh I., Bialas A. R., Kamitaki N., Martersteck E. M., Trombetta J. J., Weitz D. A., Sanes J. R., Shalek A. K., Regev A., McCarroll S. A., Highly parallel genome-wide expression profiling of individual cells using nanoliter droplets. Cell 161, 1202–1214 (2015). [DOI] [PMC free article] [PubMed] [Google Scholar]
- 67.Anders S., Huber W., Differential expression analysis for sequence count data. Genome Biol. 11, R106 (2010). [DOI] [PMC free article] [PubMed] [Google Scholar]
Associated Data
This section collects any data citations, data availability statements, or supplementary materials included in this article.
Supplementary Materials
Supplementary material for this article is available at http://advances.sciencemag.org/cgi/content/full/6/45/eabc4773/DC1