

The structure of mTORC2 reveals the basis of its rapamycin insensitivity and explains how mTORC2 stability controls activity.
Abstract
The protein kinase mammalian target of rapamycin (mTOR) is the central regulator of cell growth. Aberrant mTOR signaling is linked to cancer, diabetes, and neurological disorders. mTOR exerts its functions in two distinct multiprotein complexes, mTORC1 and mTORC2. Here, we report a 3.2-Å resolution cryo-EM reconstruction of mTORC2. It reveals entangled folds of the defining Rictor and the substrate-binding SIN1 subunits, identifies the carboxyl-terminal domain of Rictor as the source of the rapamycin insensitivity of mTORC2, and resolves mechanisms for mTORC2 regulation by complex destabilization. Two previously uncharacterized small-molecule binding sites are visualized, an inositol hexakisphosphate (InsP6) pocket in mTOR and an mTORC2-specific nucleotide binding site in Rictor, which also forms a zinc finger. Structural and biochemical analyses suggest that InsP6 and nucleotide binding do not control mTORC2 activity directly but rather have roles in folding or ternary interactions. These insights provide a firm basis for studying mTORC2 signaling and for developing mTORC2-specific inhibitors.
INTRODUCTION
The serine/threonine kinase mammalian target of rapamycin (mTOR), a phosphatidylinositol 3-kinase–related kinase (PIKK) (1–3), controls cell growth by balancing anabolic and catabolic metabolism (1, 4). mTOR is found in two separate complexes: mTOR complex 1 (mTORC1) and mTORC2 (1, 5). mTORC1 consists of mTOR, regulatory-associated protein of mTOR (Raptor), and mammalian homolog of protein lethal with sec thirteen protein 8 (mLST8) (5–7). mTORC2 comprises mTOR, rapamycin-insensitive companion of mTOR (Rictor) (8), stress-activated map kinase-interacting protein 1 (SIN1) (9), and mLST8 (8), and associates with the facultative subunit protein observed with Rictor-1/2 (Protor-1/2) (10). mTORC2 is activated by insulin and phosphoinositide 3-kinase (PI3K) signaling (1) and acts on cell survival and proliferation (4) by phosphorylating the AGC family kinases: AKT, PKC, and SGK (1, 4, 11–13). mTORC2 also promotes tumorigenesis via up-regulation of lipid biosynthesis (14).
mTOR inhibitors played a major role in the elucidation of mTOR signaling and are used in cancer treatment (15). The polyketide rapamycin specifically inhibits mTORC1 (6) by forming a complex with the cellular protein FKBP12 that then binds the FKBP-rapamycin binding (FRB) domain in mTOR (Fig. 1A) (16). Adenosine 5′-triphosphate (ATP)–like inhibitors target the ATP-binding site in the kinase catalytic domain of the mTORCs (Fig. 1A) or the structurally related PI3K (17). Recently, mTORC2-selective inhibitors were identified, but their mechanism of action remains unknown (18). Several intermediate-resolution reconstructions of (m)TOR complexes (16, 19–22) and high-resolution reconstructions of human mTORC1 (23) have been reported, but no high-resolution information on mTORC2 is available. Of the mTORC2 accessory proteins, only the isolated pleckstrin homology (PH) and conserved region in the middle (CRIM) domains of SIN1 have been structurally characterized (24–26). For Rictor, fold- and secondary structure–based models have been proposed based on intermediate-resolution cryo–electron microscopy (cryo-EM) reconstructions (20–22).
Fig. 1. Structure of mTOR complex 2.
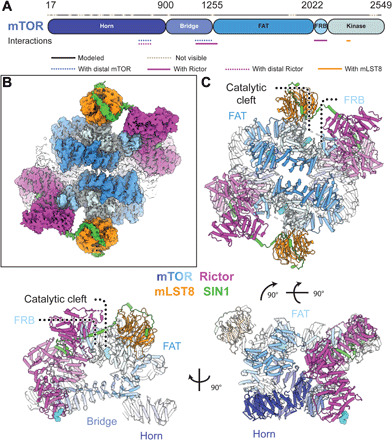
(A) Sequence-level domain organization of mTOR. Modeled and unresolved regions are indicated as dotted lines. Interactions with other proteins in the complex are highlighted below the sequences. (B) Density of the overall cryo-EM reconstruction of mTORC2 colored according to protein subunits and mTOR domains as indicated. The top half is better resolved than the lower one, most likely due to conformational flexibility. (C) Cartoon representation of mTORC2 in three different orientations. The proteins Rictor (magenta) and SIN1 (green) are unique to mTORC2, while mTOR (colored by domain) and mLST8 (orange) are common to both mTORC1 and mTORC2. Bound ligands are represented as cyan spheres.
RESULTS
Structure determination of mTORC2 by cryo-EM
To investigate the structure of mTORC2 and the mechanism of its regulation, we coexpressed recombinant components of human mTORC2 (mTOR, mLST8, Rictor, and SIN1) in Spodoptera frugiperda cells. The assembled complex, purified using tag-directed antibody affinity followed by size exclusion chromatography, was analyzed by cryo-EM (Fig. 1B and figs. S1, A to C, and S2) in the presence of ATPγS and either the full-length substrate Akt1 (fig. S1, D and E) or an Akt1 variant missing the PH domain (ΔPH-Akt1), or in the absence of Akt1 with and without ATPγS (fig. S2). The sample prepared in the presence of ATPγS and ΔPH-Akt1 yielded the highest overall resolution of 3.2 Å (density A in fig. S2).
mTORC2 forms a rhomboid-shaped dimer (Fig. 1C) as observed in lower-resolution mTORC2 reconstructions (20–22). The mTOR kinase consists of the N-terminal “Horn” and “Bridge” domains followed by the FAT, FRB, and kinase domains (Fig. 1A). mTOR forms the core of mTORC2 with mLST8 on the periphery, close to the active site cleft, similar to mTOR-mLST8 in mTORC1 (16, 23). In the overall reconstruction, as a consequence of EM refinement of a flexible molecule, one-half of the dimer showed better local resolution (Fig. 1B, fig. S3, A to C, and movie S1). Therefore, focused refinement on a unique half of the assembly improved the resolution to 3.0 Å (density C in fig. S2), and these maps were used for structural modeling (fig. S3, D to F). Previous mTORC2 and yeast TORC2 reconstructions (20–22) revealed that the two mTOR FAT domains are in closer proximity to each other than observed in mTORC1 (16, 23, 27), and in the current structure, the distance between the mTOR FAT domains is further reduced (fig. S3G). Irrespective of these structural differences between the two mTORCs, the catalytic site in mTORC2 closely resembles the catalytic site in mTORC1 without Rheb-mediated activation (23), suggesting that mTORC2 may be activated by a yet to be defined mechanism.
The characteristic mTORC2 subunit Rictor blocks the rapamycin binding site
Previous studies of mTORC2 subunits Rictor and SIN1 or their yeast orthologs were not of sufficient resolution to allow de novo model building, resulting in ambiguous or inconsistent interpretations (20, 22, 28). Here, we unambiguously model all structured regions of Rictor and the N-terminal region of SIN1 (Fig. 2, A to C), whereas the middle and C-terminal part of SIN1 retain high flexibility and are not resolved. The fold of Rictor differs substantially from previous interpretations (fig. S3, H and I) (20). Rictor is composed of three interacting stacks of α-helical repeats, here referred to as the ARM domain (AD), the HEAT-like domain (HD), and the C-terminal domain (CD) (Fig. 2, A to C). The N-terminal AD (residues 26 to 487) forms a large superhelical arrangement of nine ARM repeats (Fig. 2, A and B) that structurally separates the HD and CD. The HD (residues 526 to 1007), interpreted as two separate domains in previous lower-resolution studies (20, 22), is composed of 10 HEAT-like repeats. In sequence space, the HD and CD of Rictor are separated by an extended stretch of residues (1008 to 1559) that are predicted to be disordered and are not resolved in our reconstruction. We refer to this region as the phosphorylation site region (PR) because it contains most of Rictor’s phosphorylation sites (29). The two ends of the PR are anchored by a two-stranded β-sheet at the top of the HD, which is thus termed the PR anchor (Fig. 2, B and C, and fig. S4A). From here, a partially flexible linker wraps around the AD and the mTOR FRB domain extending toward the CD (Fig. 2B and fig. S4C).
Fig. 2. The architecture of Rictor.
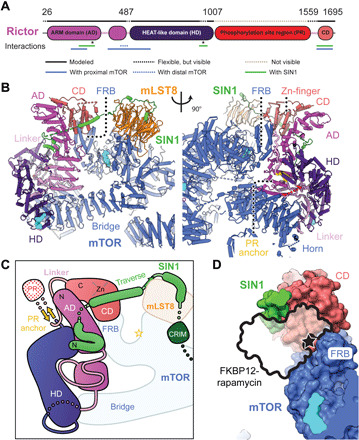
(A) Sequence-level domain organization of Rictor. Flexible and unresolved regions are indicated as dotted lines. Interactions with other proteins in the complex are highlighted below the sequences. Asterisks indicate residues interacting with the N-terminal region of SIN1. (B) Two views of Rictor, colored by domains. The structured part of Rictor forms three domains: an N-terminal Armadillo repeat domain (AD, magenta), a HEAT-like repeat domain (HD, dark magenta), and a C-terminal domain (CD, light red); the phosphorylation site region (PR) remains disordered. The sequences flanking the nonresolved PR are highlighted in red, and the PR anchor is colored in gold. Bound ligands are shown as cyan spheres. (C) Schematic representation of Rictor and SIN1 domain topology. (D) The Rictor CD occupies the FRB domain and sterically blocks FKBP-rapamycin binding (26).
The structured parts of the CD form a four-helix bundle and a zinc finger, with bound Zn2+, in the vicinity of the Rictor N terminus (Fig. 2A and fig. S4, B and C). Residues coordinating the zinc ion are highly conserved in metazoan Rictor (fig. S4F). In earlier work, this domain had been interpreted as representing the SIN1 domain (20). The complete CD is absent in sequences of fungal Rictor orthologs, but other large extensions in yeast Rictor and SIN1 sequences may occupy the equivalent location in yeast TORC2, as observed in an intermediate-resolution reconstruction of budding yeast TORC2 (fig. S4, D and E) (21). Increased levels of Zn2+ have been reported to stimulate Akt1 S473 phosphorylation in cells (30, 31), but no direct involvement of mTORC2 activation has been demonstrated.
Contacts between Rictor and mTOR are made by the Rictor AD, which sits between the Horn domain of the proximal mTOR subunit and the Bridge domain of the distal mTOR subunit (Fig. 2B). With its positioning on top of the mTOR FRB domain, the CD of Rictor blocks the binding space of FKBP12-rapamycin in mTORC1, thereby explaining the absence of an mTORC1-like mode of sensitivity to rapamycin for mTORC2 (Fig. 2D) (5, 8, 28).
SIN1 integrates its N terminus into Rictor and links Rictor to mLST8
The SIN1 subunit of mTORC2 exhibits an unexpected structural organization. The N-terminal region (residues 2 to 137), contrary to earlier interpretations, does not form an independently folding domain but interacts tightly with Rictor and mLST8 in an extended conformation (Figs. 2, A to C, and 3, A to E). The CRIM, Ras-binding domain (RBD), and PH domains of SIN1, however, remain flexibly disposed. The N terminus of SIN1 is inserted into a deep cleft at the interface of the AD and HD of Rictor. The N-terminal Ala2 with a structurally resolved acetylated N terminus and Phe3 of SIN1 are buried in a hydrophobic pocket of Rictor (Fig. 3, C and D, and fig. S5A). The anchored N-terminal region of SIN1 forms two short helices (residues 6 to 33) inserted into grooves on the surface of the Rictor AD (Fig. 3D) and then continues with a flexible sequence segment toward the Rictor CD (Figs. 2, B and C, and 3C and fig. S5B). Protruding from the Rictor CD, SIN1 forms a helical segment, referred to as the “traverse,” that spans the distance to mLST8 across the mTORC2 kinase cleft (Fig. 3C and fig. S5, B and C). The next region of SIN1 interacts with the fourth strand of the second blade of the mLST8 propeller by β-strand complementation, leading to displacement of an mLST8 loop relative to the structure of mLST8 in mTORC1 (Fig. 3, C and E, and fig. S5D). SIN1 then follows the surface of the mLST8 propeller, finally forming an α-helix anchored between the first and seventh blades of mLST8.
Fig. 3. The SIN1 N-terminal region is an integral component of mTORC2.
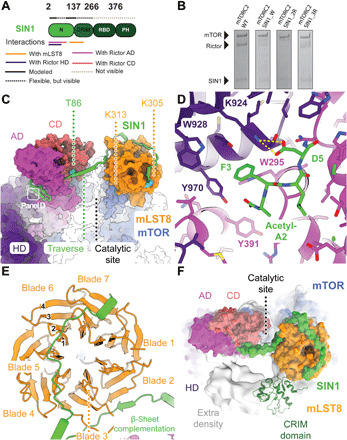
(A) Sequence-level domain organization of SIN1. Flexible and unresolved regions are shown above each domain representation as dotted lines in two colors as indicated. Interactions with other proteins in the complex are indicated below the domain representation. (B) Extension of the processed SIN1 N terminus disrupts assembly of Rictor and SIN1 with mTOR/mLST8 into mTORC2. SDS-polyacrylamide gel of a FLAG bead pulldown from lysates of insect cells expressing mTORC2 comprising SIN1 variants. Levels of Rictor are drastically reduced in the mTOR-based pulldown for mTORC2 carrying variants of SIN1 N-terminally extended by a tryptophan (mTORC2 SIN1_W), two consecutive arginines (mTORC2 SIN1_2R), and three consecutive arginines (mTORC2 SIN1_3R). (C) Surface representation of mTORC2. SIN1 (shown as green cartoon) interacts via two N-terminal helices with Rictor, winds around Rictor, traverses the catalytic site cleft, and winds around mLST8. The field of view of subpanel D is indicated. (D) Close-up view of the SIN1 N-terminal residues, which are deeply inserted between Rictor AD and HD. Acetylated Ala2 and Phe3 are bound in a hydrophobic pocket, while Asp5 interacts via salt bridges (yellow dashes). (E) Top view of mLST8 β-propeller (orange) and the interaction regions with SIN1 (green). The nomenclature for WD40 β-propeller repeats is indicated. (F) Top view of the catalytic site with the structure shown as surface together with the density of a subclass (light gray). The lower-resolution extra density is consistent with a placement of the SIN1 CRIM domain, here shown in dark green (PDB: 2RVK). Unassigned extra density protrudes from the CRIM domain to the mTOR active site and Rictor.
SIN1 integrates into the Rictor fold and connects Rictor with mLST8, suggesting a direct role in stabilizing mTORC2. To test the relevance of the anchoring of the N terminus of SIN1 on Rictor, we extended the N terminus of SIN1 using tryptophan or arginine residues to exploit steric hindrance or charge-charge repulsion to prevent the insertion into the Rictor pocket. Insertion of residues impairs critical interactions observed for the acetylated N terminus of SIN1 and prevents Rictor integration into mTORC2, as observed in baculovirus-mediated expression of mTOR components followed by pull-down assays (Fig. 3B and fig. S5E). Therefore, SIN1 acts as an integral part of the Rictor structure that critically stabilizes interdomain interactions, explaining the difficulties observed in purifying isolated Rictor (20).
These observations are also consistent with the locations of posttranslational modifications or mutations that affect mTORC2 activity. SIN1 phosphorylation at Thr86 and Thr398 has been reported to reduce mTORC2 integrity and kinase activity toward Akt1 Ser473 (32). Thr86 in SIN1, which is a target for phosphorylation by S6 kinase (32), is bound to a negatively charged pocket of the Rictor CD (Fig. 3C and fig. S5C). Phosphorylation of Thr86 would lead to repulsion from this pocket, destabilizing the interaction between Rictor and mTOR-mLST8 and presumably the entire mTORC2 assembly, in agreement with earlier in vivo and in vitro observations (32). The importance of SIN1 in connecting Rictor to mLST8, and therefore also indirectly to mTOR, is also consistent with the requirement of mLST8 for mTORC2 integrity (33, 34).
SIN1 mobile domains are positioned for substrate recruitment
A poorly resolved density linked to the SIN1 helix anchored to mLST8 is observed in all reconstructions. In previous structural studies of yeast TORC2, a similar region of density was associated with the CRIM domain of Avo1, the yeast SIN1 ortholog (21, 28). Most likely, it represents the mobile substrate-binding CRIM domain that directly follows the helix in the SIN1 sequence and has a matching shape based on the solution structure of the Schizosaccharomyces pombe SIN1 CRIM domain (Fig. 3F and fig. S6, A to C) (25, 26). The positions of the SIN1 RBD and PH domains remain unresolved. In the dataset collected for samples with added full-length Akt1 (dataset 2 in fig. S2), we observed additional low-resolution density (Fig. 3F and fig. S6, B and C) between the hypothetic CRIM domain and Rictor AD and CD in the vicinity of the mTOR active site. This density, not of sufficient resolution to assign specific interactions, may represent parts of bound Akt1 or SIN1 domains (fig. S6C).
A proposed regulatory mechanism for mTORC2 involves ubiquitylation of mLST8 on Lys305 and Lys313 (35). Loss of ubiquitylation by K305R and/or K313R mutation, or truncation of mLST8 at Tyr297, leads to mTORC2 hyperactivation and increased AKT phosphorylation (35). mLST8 Lys305 is proximal to the SIN1 helix anchoring the CRIM domain. Ubiquitylation of Lys305 would prevent association of the SIN1 helix, leading to dislocation of the SIN1 CRIM domain required for substrate recruitment (Figs. 3C and 4A). Ubiquitylation of Lys313, which is found on the lower face of mLST8 (Figs. 3C and 4A), presumably also interferes with positioning of the CRIM domain (fig. S6A).
Fig. 4. Small-molecule binding sites of mTORC2 outside the active site region.
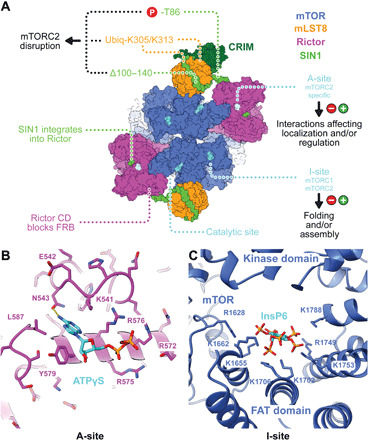
(A) Overview of mTORC2 architecture and ligand interaction sites. Each half of the dimeric mTORC2 has three small-molecule binding sites. The kinase active site and the A-site, which is located in the peripheral region of Rictor, bind to ATP (or ATP analogs). The I-site in the middle of the FAT domain of mTOR binds InsP6. The indicated modifications on SIN1 and mLST8 affect mTORC2 assembly. Extra-density region following the CRIM domain is indicated as a gray outline. (B). Close-up view of the A-site on the periphery of the Rictor HD with bound ATPγS. A hydrogen bond between ATPγS and Asn543 is shown as dashed yellow lines. (C) Close-up view of the I-site in the FAT domain of mTOR. InsP6 is surrounded by a cluster of positively charged amino acids. It only directly interacts with residues of the FAT domain.
Two small-molecule binding sites outside the mTOR kinase catalytic region are occupied with ATP and IP6
We observed two previously uncharacterized, small-molecule binding sites outside the mTOR catalytic site, which is itself occupied by ATPγS. The first (A-site) (Fig. 4B and fig. S7, A and B) is located in the HD of Rictor and is thus specific to mTORC2. The second (I-site) (Fig. 4C and fig. S7C) is located in the FAT domain of mTOR and is thus common to mTORC1 and mTORC2.
The density of the small molecule in the A-site matched that of an ATP molecule and was confirmed to be ATP (or ATPγS) through a comparison of cryo-EM reconstructions of mTORC2 with and without ATPγS added at a near physiological concentration of 2 mM (datasets 1 and 4, figs. S2 and S7A). The A-site does not resemble any known ATP-binding site. Positively charged amino acids (Lys541, Arg575, Arg576, and Arg572) of the A-site are conserved in Rictor orthologs from yeast to human (figs. S4E and S8). Other residues are not conserved, hinting at the possibility for interactions with alternative negatively charged ligands. The A-site is located approximately 100 Å from the mTOR catalytic site. Ligand binding to the A-site caused neither long-range allosteric change affecting the kinase site nor local structural perturbations (fig. S9, I to L).
To investigate the effect of ligand binding to the A-site, we generated a series of Rictor variants with a mutated A-site (table S1). Variants with three or four mutated residues (A3 and A4) assembled into mTORC2 (fig. S10B), while variant A5 was defective in assembly (fig. S10, B to D). Cryo-EM reconstructions of variants A3 and A4 in the presence of ATPγS (fig. S9, I to L) confirmed that the chosen mutations abolish ligand binding under near physiological conditions (figs. S7A and S9, J and L). Purified mTORC2 containing Rictor variant A3 or A4 exhibited thermal stability and kinase activity, in an Akt1 in vitro phosphorylation assay, comparable to wild-type (WT) mTORC2 (fig. S10, F to H). Complementation of a Rictor knockout (KO) in human embryonic kidney (HEK) 293T cells by transfected Rictor-WT, or Rictor variant A3 yielded comparable levels of Akt1-S473 phosphorylation (table S1 and fig. S11). Together, the above analyses indicate that ligand binding to the A-site does not directly influence mTORC2 kinase activity, suggesting rather a role in the interaction with other, yet unidentified, partner proteins of mTORC2.
The I-site is formed entirely by the FAT domain of mTOR, where a large, positively charged, pocket is lined by six lysine and two arginine residues to bind an extended ligand (Fig. 4C and fig. S7C). The I-site was still partially occupied in our reconstruction of mTORC2 prepared without addition of exogenous ATPγS or other relevant ligands (fig. S7A). The copurified molecule was identified by map appearance and by ion mobility spectrometry–mass spectrometry (IMS-MS) as inositol hexakisphosphate (InsP6) (figs. S7, D to F, and S12). InsP6 binds in a region, which is incomplete in related PI3Ks (36), but is generally conserved in members of the PIKK family of kinases (37). InsP6 was previously reported to associate with DNA-PKcs (38). Recently, structure determination of the PIKK family kinase SMG1 revealed InsP6 binding in a region corresponding to the I-site and led the authors to postulate a corresponding binding site in mTOR but involving both the kinase domain and FAT domain (37). InsP6 has previously been observed as a structural component of multi-subunit assemblies, including the spliceosome (39) and proteasome activator complex (40), and helical repeat regions have been identified as InsP6 interaction sites (41).
To investigate the function of InsP6 interaction, we purified recombinant mTORC2 containing mTOR I-site mutations (table S1). mTOR variants with two and three mutations, I2 and I3, yielded intact mTORC2 complexes (fig. S10A), while a variant with five mutations, I5, failed to assemble into mTORC2 (fig. S10, A and D). mTORC2 containing mTOR variants I2 and I3 displayed normal kinase activity toward Akt1 in vitro (fig. S10E). Notably, the mutations in I2 are equivalent to those reported previously to abolish completely the kinase activity of an N-terminally truncated “naked” mTOR fragment toward a C-terminal peptide of Akt1 (37). A possible explanation for this apparent discrepancy is provided by a reduced stability of mTORC2 assembled using the I2 variant (but not the I3 variant) (fig. S10G). This destabilizing effect might be more pronounced in an mTOR fragment than in the context of an assembled mTORC2 (fig. S10G).
To investigate a possible role of InsP6 metabolism on mTORC2 activity in HEK293T cells, we knocked down (KD) and knocked out (KO) inositol-pentakisphosphate 2-kinase (IPPK) and multiple inositol polyphosphate phosphatase 1 (MINPP1), respectively. The former enzyme generates InsP6, whereas the latter degrades it (fig. S13). These manipulations of InsP6-metabolizing enzymes did not alter mTORC2 kinase activity in nonstimulated cells or in cells stimulated with fetal calf serum (FCS) and insulin (fig. S13). These biochemical results are consistent with the observed stable binding of InsP6 to mTORC2 and suggest a role of InsP6 in mTOR folding or mTOR complex assembly, rather than as an acute transient metabolic input signal to mTORC1 or mTORC2.
DISCUSSION
Here, we describe a bona fide structure of mTORC2. We visualized how SIN1 stabilizes and tethers Rictor to the mTOR-mLST8 core. SIN1 further uses mLST8 as a platform for positioning its substrate-recruiting CRIM domain, revealing a new functional role for mLST8 and rationalizing the impact of SIN1 and mLST8 modifications on mTORC2 activity. We also provide the structural basis for how the Rictor CD determines mTORC2’s rapamycin insensitivity, by a mechanism different from those inferred from previous structural data (20, 22). We identified and functionally characterized two ligand binding sites in mTORC2. The I-site in mTOR is common to mTORC1 and mTORC2, binds InsP6, and presumably functions in mTOR folding or assembly rather than acting as a sensor site for acute changes in cellular InsP6 concentration. The mTORC2-specific A-site of Rictor binds ATP. It does not affect mTORC2 activity by allostery but may be involved in linking partner protein interactions to cellular nucleotide triphosphate concentrations. Together, the data presented here provide a firm basis for further analysis of the function of mTORC2 and its interplay with partner proteins for controlling subcellular localization and regulation of activity (1, 4, 14). Interaction sites of Rictor and mLST8 with SIN1 provide an opportunity for the development of inhibitors specific for mTORC2.
MATERIALS AND METHODS
Protein expression and purification
Insect cell vectors from the “MultiBac” Baculovirus expression system (42) (Geneva Biotech, Geneva, Switzerland) have been used to clone internally FLAG-tagged pAceBAC-mTOR (FLAG after Asp258), pIDK-Rictor, pIDC-mLST8, and pAceBAC1-SIN1 using Gateway Cloning (Thermo Fisher Scientific, USA). Rictor was originally amplified from myc-Rictor, which was a gift from D. Sabatini (8) (Addgene plasmid no. 11367). Site-directed mutagenesis was used to generate mTORC2 A- and I-site variants. The following set of A-site mutants with pIDK-Rictor as template was created: Rictor_R572E_R575E_R576E (A3), Rictor_R572E_R575E_R576E_Y579A (A4), and Rictor_R572E_R575E_R576E_Y579A_L587W (A5). The following I-site mutants with FLAG-tagged pAceBAC-mTOR were generated: mTOR_K1753E_K1788E (I2), mTOR_R1628E_K1655E_K1662E (I3), and mTOR_R1628E_K1655E_K1662E_K1706E_K1735E (I5). WT Rictor and mutants A3 and A5 were subcloned into plasmid MX01 (Addgene plasmid no. 158624). SIN1 N-terminal variants were generated by inserting a tryptophan (SIN1_W), two consecutive arginines (SIN1_2R), or three consecutive arginines (SIN1_3R) using site-directed mutagenesis and pAceBAC1-SIN1 as template. Plasmids encoding FLAG-tagged mTOR, Rictor, and mLST8 were fused to a MultiBac expression plasmid using Cre-recombinase (New England Biolabs, Ipswich, USA) and transposed into a bacmid for baculovirus production. Baculovirus encoding untagged SIN1 was produced separately.
Sf21 insect cells (Expression Systems) were grown in HyClone insect cell media (GE Life Sciences), and baculovirus was generated according to Fitzgerald et al. (42). For the expression of recombinant human WT mTORC2, A- and I-site mTORC2 mutants, and mTORC2 carrying SIN1 N-terminal variants, Sf21 cells were infected at a cell density of 1 Mio/ml. Cells were coinfected with 1:100 (v/v) ratio of two undiluted supernatants from cells previously infected with baculovirus encoding FLAG-mTOR, Rictor, and mLST8 or infected with baculovirus encoding untagged SIN1, respectively. WT mTORC2, A-site mutants A3, A4, and A5, and I-site mutants I2, I3, and I5 were purified as follows: Insect cells were harvested 72 hours after infection by centrifugation at 800g for 25 min and stored at −80°C until further use. Cell pellets were lysed in 50 mM bicine (pH 8.5), 200 mM NaCl, and 2 mM MgCl2 by sonication, and the lysate was cleared by ultracentrifugation. Soluble protein was incubated with 10 ml of anti-DYKDDDDK agarose beads (Genscript, Piscataway, USA) for 1 hour at 4°C. The beads were transferred to a 50-ml gravity flow column (Bio-Rad) and washed four times with 200 ml of wash buffer containing 50 mM bicine (pH 8.5), 200 mM NaCl, and 2 mM EDTA. Protein was eluted by incubating beads for 30 min with 10 ml of wash buffer supplemented with synthetic DYKDDDDK peptide (0.6 mg/ml) (Genscript, Piscataway, USA). The eluate was combined with three additional elution steps using synthetic DYKDDDDK peptide (0.1 mg/ml) and 5-min incubation time. The eluted protein was concentrated using a 100,000-Da molecular mass cutoff centrifugal concentrator (Amicon) of regenerated cellulose membrane and purified by size exclusion chromatography on a custom-made Superose 6 Increase 10/600 GL gel filtration column equilibrated with 10 mM bicine (pH 8.5), 150 mM NaCl, 0.5 mM EDTA, and 2 mM tris(2-carboxyethyl)phosphine (TCEP). Purified WT mTORC2 was concentrated in gel filtration buffer to a final concentration of 3 to 3.5 mg/ml determined by A280 absorption using NanoDrop 2000 (Thermo Fisher Scientific). Sample was supplemented with 5% (v/v) glycerol and stored at −80°C for later cryo-EM use. Purified mTORC2 variants with A- and I-site mutants were concentrated in gel filtration buffer to a final concentration of 0.4 to 2 mg/ml as determined by absorption at 280-nm wavelength using NanoDrop 2000 (Thermo Fisher Scientific). The resulting samples were supplemented with 5% (v/v) glycerol and stored at −80°C for later use.
The coding sequence for Akt1 (43) was cloned into a pAceBAC1 expression vector (Geneva Biotech, Geneva, Switzerland) with an N-terminal His10-Myc-FLAG tag by Gateway cloning. Baculovirus was produced as described for mTORC2. Akt1 was purified with anti-DYKDDDDK agarose beads as described for mTORC2. The eluted protein was concentrated using a 10,000-Da molecular mass cutoff centrifugal concentrator (Amicon) of regenerated cellulose membrane and further purified by size exclusion chromatography with a Superdex 75 Increase column equilibrated with 10 mM bicine (pH 8.5), 150 mM NaCl, 0.5 mM EDTA, and 2 mM TCEP. Purified Akt1 was concentrated in gel filtration buffer, supplemented with 5% (v/v) glycerol, and stored at −80°C for further experiments. Dephosphorylated Akt1 was obtained after overnight incubation of 4.5 mg of protein with 6 μg of λ-protein phosphatase (New England Biolabs) in the presence of PMP buffer (New England Biolabs) and 1 mM MnCl2 before size exclusion chromatography. Successful Akt1 dephosphorylation was confirmed by Western blot with antibodies against phospho–AKT-Ser473 (no. 4060; Cell Signaling Technology, Beverly, USA) and phospho–AKT-Thr450 (no. 9267; Cell Signaling Technology, Beverly, USA) at a dilution of 1:1000 in 5 ml of Tris-buffered saline with 0.1% Tween20 (TBST). Human (Delta-PH) Akt1 protein (residues 144 to 480, mono-phosphorylated on T450), as described by Lučić et al. (44) (therein referred to as Akt1KD), was provided by T. Leonard (Max-Perutz Labs, Vienna).
Expression and assembly analysis via immunoprecipitation
A-site mutants A3, A4, and A5 and I-site mutants I2, I3, and I5, and mTORC2 carrying SIN1 N-terminal variants extended by a tryptophan (SIN1_W), two consecutive arginines (SIN1_2R), and three consecutive arginines (SIN1_3R) inserted between the processed Met1 and Ala2, were immunoprecipitated in small scale using FLAG beads. Five-gram wet weight of pellets from insect cells expressing A- and I-site mutants and SIN1 N-terminal variants was lysed in 50 mM bicine (pH 8.5), 200 mM NaCl, and 2 mM MgCl2 using a Dounce homogenizer. The lysate was cleared by ultracentrifugation for 45 min at 35,000g. Soluble protein was incubated with 125 μl of anti-DYKDDDDK agarose beads (Genscript, Piscataway, USA) for 1 hour at 4°C. The beads were transferred to a 5-ml gravity flow column (Pierce Centrifuge Columns, Thermo Fisher Scientific) and washed with 50 ml of buffer containing 50 mM bicine (pH 8.5), 200 mM NaCl, and 2 mM EDTA. Protein was eluted by 30-min incubation of the beads with 400-μl wash buffer supplemented with synthetic DYKDDDDK peptide (0.6 mg/ml) (Genscript, Piscataway, USA). Total lysate, soluble supernatant after ultracentrifugation, flow through from FLAG column, buffer wash, and elution fraction were loaded onto a 4 to 15% SDS polyacrylamide gel (Bio-Rad Laboratories). In addition, total lysate, supernatant after ultracentrifugation, and elution fraction of mTORC2 WT, SIN1 N-terminal variants, and mutants A5 and I5 were analyzed by immunoblotting using antibodies against mTOR (no. 2972; Cell Signaling Technology, Beverly, USA), SIN1 (A300-910A; Bethyl), Rictor (A300-458A; Bethyl), and actin (MAB1501; Merck Millipore) at a dilution of 1:1000 in 5 ml of TBST. A goat anti-rabbit horseradish peroxidase (HRP)–labeled antibody (ab6721; Abcam, Cambridge, UK) was used as the secondary antibody at a dilution of 1:3000 in 5 ml of TBST.
Assay for mTORC2 kinase activity
mTORC2 kinase activity assays were conducted in 100 mM Hepes (pH 7.4), 1 mM EGTA, 1 mM TCEP, 0.0025% Tween 20, and 10 mM MnCl2 using dephosphorylated Akt1 as a substrate. In a 60-μl reaction volume, 0.05 μM of either WT or A- and I-site mutant mTORC2 was mixed with 1 μM Akt1 and, where indicated, either dimethyl sulfoxide or 25 μM Torin1. The mixture was preincubated for 5 min at room temperature, and the reaction was initiated by the addition of 10 μM ATP. After 20 min at 37°C, the reaction was terminated by the addition of 60 μl of 2× Laemmli sample buffer. The reactions were analyzed by Western blotting using primary antibodies against phospho–AKT-Ser473 (no. 4060; Cell Signaling Technology, Beverly, USA), phospho–AKT-Thr450 (no. 9267; Cell Signaling Technology, Beverly, USA), AKT (no. 4685), and mTOR (no. 2972; Cell Signaling Technology, Beverly, USA), anti-FLAG antibodies (Sigma-Aldrich, F1804), SIN1 (Bethyl, A300-910A), and Rictor (Bethyl, A300-458A) at a dilution of 1:1000 in 5 ml of TBST. A goat anti-rabbit HRP-labeled antibody (ab6721; Abcam, Cambridge, UK) was used as the secondary antibody at a dilution of 1:3000 in 5 ml of TBST. Signals were detected using the Enhanced Chemiluminescence (ECL) Kit SuperSignal West Femto Maximum Sensitivity Substrate (Thermo Fisher Scientific). Images were acquired using a Fusion FX (Vilber) imaging system.
Thermal stability assay
Thermal unfolding was monitored by differential scanning fluorimetry (DSF) based on internal tryptophane fluorescence on a Prometheus NT.48 instrument (NanoTemper Technologies). Purified WT mTORC2 or mTORC2 containing mutations in A- or I-site was diluted to 0.1 mg/ml in 10 mM bicine (pH 8.5), 150 mM NaCl, 0.5 mM EDTA, and 2 mM TCEP. High-precision capillaries (NanoTemper Technologies) were filled with 10-μl sample and placed on the sample holder. A temperature gradient of 0.1°C/min from 22° to 65°C was applied, and fluorescence intensity at 330 and 350 nm was recorded. A plot of the ratio of fluorescence intensities at those wavelengths (F350/F330) was generated using a Python script. The experiment was repeated two times with five replicates per sample run each time. Melting points were calculated using PR.ThermControl software version 2.1.2. Data were analyzed using GraphPad Prism version 8.0.0 (GraphPad Software, San Diego, CA, USA) to generate the mean and SD of the melting points. One outlier, likely resulting from capillary handling, for sample A4 was excluded from data analysis.
In-cell analysis of mTORC2 activity for A-site mutants
HEK293T cells were cultured and maintained in Dulbecco’s modified Eagle’s medium (DMEM) high glucose with 10% FCS, 4 mM glutamine, 1 mM sodium pyruvate, and 1× penicillin/streptomycin. RICTOR KO cells were generated as described by Bossler et al. (45). Four micrograms of plasmids harboring RICTOR-WT, RICTOR-A_3, and RICTOR-A_5 was transfected with jetPRIME (Polyplus). Twenty-four hours after transfection, cells were starved for serum for overnight and stimulated with 10% FCS and 100 nM insulin for 15 min. Total cell lysates were prepared in lysis buffer containing 100 mM tris-HCl (pH 7.5), 2 mM EDTA, 2 mM EGTA, 150 mM NaCl, 1% Triton X-100, complete inhibitor cocktail (Roche), and PhosSTOP (Roche). Protein concentration was determined by a Bradford assay, and equal amounts of protein were separated by SDS–polyacrylamide gel electrophoresis (SDS-PAGE) and transferred onto nitrocellulose membranes (GE Healthcare). Antibodies used were as follows: AKT (1:1000 dilution, catalog no. 2920, Cell Signaling Technology), AKT-pS473 (1:1000, catalog no. 4060, Cell Signaling Technology), RICTOR (1:1000, catalog no. 2040, Cell Signaling Technology), ACTIN (1:2000, catalog no. MAB1501, Millipore), IRDye 800CW goat anti-rabbit immunoglobulin G (IgG) (1:20,000, catalog no. 926-32211, LI-COR), and IRDye 680RD goat anti-mouse IgG (1:20,000, catalog no. 926-68070). All antibodies were diluted in 10 ml of TBST and Licor intercept (TBS) blocking buffer (1:1). Signals were detected by LI-COR Fc (LI-COR Biosciences).
In-cell analysis of the dependence of mTORC2 activity on IPPK and MINPP1
HEK293T cells were cultured and maintained in DMEM high glucose with 10% FCS, 4 mM glutamine, 1 mM sodium pyruvate, and 1× penicillin/streptomycin. For KD of IPPK and MINPP1, 0.1 × 10⁶ cells per well were seeded in a six-well plate and transfected with 100 nM small interfering RNA (siRNA) using the jetPRIME (Polyplus) system. After 32 hours, cells were washed twice with phosphate-buffered saline (PBS) (−/−) and starved for serum for 16 hours. Forty-eight hours after transfection, cells were incubated at 37°C with PBS (+/+) for 10 min followed by stimulation with 10% FCS and 100 nM insulin for 15 min at 37°C. Cells were washed with ice-cold PBS (−/−) and harvested for SDS-PAGE or RNA isolation for quantitative polymerase chain reaction (qPCR) analysis. KO experiments were conducted as described above, using generated KO cells instead of transfection with siRNA. Total cell lysates were prepared in M-PER lysis buffer (Thermo Fisher Scientific) containing complete inhibitor cocktail (Roche) and PhosSTOP (Roche), and protein concentrations were determined by Bradford assay. Equal amounts of protein were separated by SDS-PAGE and transferred onto nitrocellulose membranes (GE Healthcare), and signals were detected by LI-COR Fc (LI-COR Biosciences). Antibodies used were as follows: AKT (1:1000, catalog no. 2920, Cell Signaling Technology), AKT-pS473 (1:1000, catalog no. 4060, Cell Signaling Technology), ACTIN (1:5000, catalog no. MAB1501, Millipore), IRDye 800CW goat anti-rabbit IgG (1:20,000, catalog no. 926-32211, LI-COR), and IRDye 680RD goat anti-mouse IgG (1:20,000, catalog no. 926-68070). All antibodies were diluted in 10 ml of TBST and Licor intercept (TBS) blocking buffer (1:1).
For qPCR, total RNA was isolated using the RNeasy Kit (Qiagen). RNA was reverse-transcribed to complementary DNA (cDNA) using the iScript cDNA Synthesis Kit (Bio-Rad). Semiquantitative real-time PCR analysis was performed using Fast SYBR Green (Applied Biosystems). Relative expression levels were determined by normalizing each CT values to POLR2A using the ∆∆CT method. The sequence for the primers used in this study was as follows: IPPK-fw, 5′-AATGAATGGGGGTACCACGG-3′; IPPK-rv, 5′-AACTTCAGAAACCGCAGCAC-3′; MINPP1-fw, 5′-AGCTACTTTGCAAGTGCCAG-3′; MINPP1-rv, 5′-TGCATGACCAAACTGGAGGA-3′.
KO cells were generated using the LentiCRISPR system as described by Sanjana et al. (46). Guide RNAs (gRNAs) against IPPK and MINPP1 were expressed from LentiCRISPRv2 (gifts from F. Zhang; Addgene plasmid nos. 49535 and 52961) by transfection of HEK293T cells with 1 μg of DNA using jetPRIME. The following gRNA target sequences were used: IPPK gRNA, 5′-TCGGCCGGTGCTCTGCAAAG-3′; MINPP1 gRNA, 5′-ATCCAGTCCGCGTACCACAA-3′. Following transfection, cells were selected with puromycin, propagated, and screened for loss of target protein by qPCR. DNA sequencing of PCR products confirmed insertions or deletions leading to interrupted sequencing reactions. Pools of KO cells were used to avoid clonal variation. HEK293T cells transfected with empty vector were used as control.
Sample preparation for LC-MS analysis
Ten micrograms of mTORC2 I-site mutants I2 and I3 and A-site mutants A3, A4, and A5 was dissolved in 50 μl of digestion buffer [1% sodium deoxycholate (SDC), 0.1 M tris, 10 mM TCEP, 15 mM chloroacetamide (CAA) (pH 8.5)] using vortexing for trypsin digestion. For endoproteinase GluC and chymotrypsin digestion, the same protein aliquots were dissolved in 20 μl of a digestion buffer consisting of 1 M urea, 0.1 M ammonium bicarbonate, 10 mM TCEP, and 15 mM CAA. Samples were either incubated for 10 min at 95°C (trypsin) or 1 hour at 37°C (GluC and chymotrypsin) to reduce and alkylate disulfide bonds. Protein aliquots were digested overnight at 37°C by incubation with sequencing-grade modified trypsin, GluC, and chymotrypsin (all 1:50, w/w; Promega). Then, the peptides were cleaned up using iST cartridges (PreOmics, Munich) according to the manufacturer’s instructions. Samples were dried under vacuum and dissolved in LC-buffer A (0.1% formic acid) at a concentration of 0.05 μg/μl.
Targeted parallel reaction monitoring–LC-MS analysis to confirm the presence of mutations
To enhance the sensitivity of the liquid chromatography–MS (LC-MS) analysis, a label-free targeted LC-MS approach was carried out. Therefore, three lists of peptides considering the cleavage specificity of the three proteases used and containing all mutation sites were generated. The peptide sequences were imported into Skyline (version 20.1; https://brendanx-uw1.gs.washington.edu/labkey/project/home/software/Skyline/begin.view) to generate a mass isolation list of all doubly and triply charged precursor ions for each protease. These were then loaded into a Q Exactive plus LC-MS platform and analyzed using the following settings: The setup of the μRPLC-MS system was as described previously (47). Chromatographic separation of peptides was carried out using an EASY nano-LC 1000 system (Thermo Fisher Scientific), equipped with a heated RP-HPLC column (75 μm by 30 cm) packed in-house with 1.9-μm C18 resin (Reprosil-AQ Pur, Maisch). Peptides were analyzed per LC-MS/MS run using a linear gradient ranging from 95% solvent A (0.15% formic acid and 2% acetonitrile) and 5% solvent B (98% acetonitrile, 2% water, and 0.15% formic acid) to 45% solvent B over 60 min at a flow rate of 200 nl/min. MS analysis was performed on a Q Exactive plus mass spectrometer equipped with a nano-electrospray ion source (both Thermo Fisher Scientific). Each MS cycle consisted of one MS1 scan followed by high-collision dissociation of the selected precursor ions in the isolation mass lists. Total cycle time was approximately 2 s. For MS1, 3 × 10⁶ ions were accumulated in the Orbitrap cell over a maximum time of 50 ms and scanned at a resolution of 35,000 FWHM [at 200 mass/charge ratio (m/z)]. MS2 scans were acquired at a target setting of 3 × 10⁶ ions, accumulation time of 110 ms, and a resolution of 35,000 FWHM (at 200 m/z). The normalized collision energy was set to 27%, the mass isolation window was set to 0.4 m/z, and one microscan was acquired for each spectrum.
The acquired raw files were converted to the mascot generic file (mgf) format using the msconvert tool [part of ProteoWizard, version 3.0.4624 (2013-6-3)]. Using the MASCOT algorithm (Matrix Science, version 2.4.1), the mgf files were searched against a decoy database containing normal and reverse sequences of the predicted SwissProt entries of Homo sapiens (www.ebi.ac.uk, release date 9 December 2019), the mTOR and Rictor mutations, and commonly observed contaminants (in total 41,556 sequences for H. sapiens) generated using the SequenceReverser tool from the MaxQuant software (version 1.0.13.13). The precursor ion tolerance was set to 10 ppm, and fragment ion tolerance was set to 0.02 Da. The search criteria were set as follows: Full tryptic specificity was required (cleavage after lysine or arginine residues unless followed by proline), three missed cleavages were allowed, carbamidomethylation (C) was set as a fixed modification, and oxidation (M) was set as a variable modification. Next, the database search results were imported to the Scaffold Q+ software (version 4.3.2, Proteome Software Inc., Portland, OR), and the protein false identification rate was set to 1% based on the number of decoy hits. Specifically, peptide identifications were accepted if they could be established at greater than 97.0% probability to achieve a false discovery rate less than 1.0% by the scaffold local FDR algorithm. Protein identifications were accepted if they could be established at greater than 65.0% probability to achieve an FDR less than 1.0% and contained at least one identified peptide. Protein probabilities were assigned by the Protein Prophet program (48). Proteins that contained similar peptides and could not be differentiated based on MS/MS analysis alone were grouped to satisfy the principles of parsimony. Proteins sharing significant peptide evidence were grouped into clusters. Last, a spectral library (*.blib) was generated from the assigned MS/MS spectra and imported to Skyline together with the acquired raw data files. Only precursor ions confidently identified by database searching and present in the spectral library were used for quantitative analysis. Quantitative result reports were further analyzed by Microsoft Excel and PRISM (GraphPad Software, San Diego, USA).
EM sample preparation and data collection
Different conditions were screened for mTORC2 in the presence and absence of substrates (fig. S2). For all conditions, freshly thawed mTORC2 aliquots were used to prepare samples with an mTORC2 concentration of 0.37 mg/ml. Shortly before grid preparation, the samples were diluted to reach a final mTORC2 concentration of 0.12 mg/ml.
For each grid, a small piece of continuous carbon was floated on top of the sample for 1 min. The carbon was then picked with a Quantifoil R2/2 holey carbon copper grid (Quantifoil Micro Tools), which was swiftly mounted in a Vitrobot (Thermo Fischer Scientific) whose chamber was set to 4°C and 100% humidity. Five microliters of buffer was then added on top of the grid on the side showing the carbon covered with particles, which was immediately blotted with a setting of 0- to 6-s blotting time and rapidly plunge-frozen in a mixture 2:1 of propane:ethane (Carbagas).
Data were collected using a Titan Krios (Thermo Fisher Scientific) transmission electron microscope equipped with either a K2 Summit direct electron detector (Gatan), a K3 direct electron detector (Gatan), or a Falcon 3EC direct electron detector (Thermo Fisher Scientific) using either EPU (Thermo Fisher Scientific) or SerialEM (fig. S2) (49). Cameras were used in counting and/or super-resolution mode. During data collection, the defocus was varied between −1 and −3 μm and four exposures were collected per holes. Stacks of frames were collected with a pixel size of 0.84 Å/pixel and a total dose of about 70 e−/Å2.
Data processing
For all datasets, the initial processing was done in similar fashion. First, the stacks of frames were aligned and dose-weighted using Motioncor2 (50). GCTF (51) was used to estimate the contrast transfer function (CTF) of the non–dose-weighted micrographs. After a selection of good micrographs using both the quality of the power spectra and the quality of the micrographs themselves as criteria, particles were picked using batchboxer from the EMAN1.9 package (52) using particle averages from manually picked particles as references. Particles were extracted using Relion3.0 (53), followed by two rounds of two-dimensional (2D) classification using cryoSPARCv2 (Structura Biotechnology Inc.) (table S2) (54). The first reference was generated by ab initio reconstruction using cryoSPARCv2. Good particles from 2D classification were then used for a homogeneous 3D refinement followed by nonuniform refinement using cryoSPARCv2. Two masks were then generated manually around each half of the pseudo-dimeric mTORC2 using UCSF Chimera (55), and two focused refinements around each half of the complex using cryoSPARCv2 were performed using those masks. For dataset 1, which contained ΔPH-Akt1, the resolution was further improved by performing Bayesian particle polishing (53) followed by CTF refinement using Relion3.1. Those particles were again subjected to a round of nonuniform refinement and local refinement using cryoSPARC v2. For each reconstruction, the maps were sharpened using phenix.auto_sharpen (56) or were transformed to structure factors using phenix.map_to_structure_factors (56) and sharpened in COOT (57).
Further 3D classifications without alignment for local structural variability close to the catalytic center were performed using the particles from the datasets containing the purified Akt1 and, independently, the ones from the dataset with ΔPH-Akt1 using Relion3.0 (53) and using a mask manually created in UCSF Chimera (55). After classification, the particles were used for refinement using cryoSPARCv2 (Structura Biotechnology Inc.). To compare the density of the sample with and without ATPγS, the final density (volume A) was filtered to 4.2 Å and compared to the density without ATPγS (volume F). Difference density was calculated using UCSF ChimeraX (58).
Modeling and docking
First, mTOR and mLST8 models were taken from the EM structure of mTORC2 [Protein Data Bank (PDB): 5ZCS (20)] and each fold was rigid body–fitted into the better half of the density. Minor changes in mTOR conformation were done manually to fit the density, and then Rictor and SIN1 were manually built de novo using COOT (57). Map quality enabled direct model building for structured regions, and lower-resolution density provided connectivity information for assigning and linking regions of Sin1 and Rictor as shown in figs. S4C and S5B. The second half of mTORC2 was made by copying and rigid body fitting each chain of the first half in the second one. Last, the structure of either one- or two-sided mTORC2 was refined using phenix.real_space_refine (table S2) (56), using Ramachandran and secondary structure restraints. As the horns of mTOR were flexible and their local resolutions were considerably lower, additional reference restraints were applied, using PDB: 6BCX (23) as reference. The model was then validated by comparing the Fourier Shell Correlations (FSC) calculated for the experimental density and the models (fig. S3). In addition, both the half and full structure were also refined in their respective half map (half map 1) and the FSCs of this structure against the same half map (half map 1), the other half (half map 2), and the full map were compared. The similarity of the curves shows that the structure was not overfitted.
Ligand identification via MS
InsP6 (Sigma-Aldrich) was directly dissolved in 10 mM ammonium acetate (pH 8.5) and diluted to 50 μM. mTORC2 in cryo-EM buffer was buffer-exchanged and concentrated in 10 mM ammonium acetate (pH 8.5) using an Amicon Ultra-0.5 mL—MWCO 100kDa. The concentrated complex was mixed with an equal volume of Phenol at pH 8, thoroughly vortexed for 30 s, and incubated at room temperature for 30 min. The tube was then centrifuged for 5 min at 15,000g. The aqueous phase was then used for MS. A sample containing only buffer and no protein was subjected to the same treatment for reference. The samples were then mixed with four volumes of injection buffer [90% acetonitrile, 9% methanol, 50 mM ammonium acetate (pH 7)] and directly injected using a Hamilton syringe in Synapt G2-SI HDMS (Waters) in negative mode and using the T-Wave IMS.
Figure generation
All density and structure representations were generated using UCSF ChimeraX (58). Difference densities were calculated in ChimeraX using the “volume subtract” command. Local resolutions were estimated using cryoSPARC v2 (Structura Biotechnology Inc.). The electrostatic surface representation of Rictor was generated using APBS [Adaptive Poisson-Boltzmann Solver (59)]. Multiple sequence alignment was performed using Clustal Omega (60) and visualized with Espript (61). Conservation analysis was done with AL2CO (62) and visualized in UCSF ChimeraX (58).
Supplementary Material
Acknowledgments
We thank T. Sharpe at the Biophysics facility and A. Schmidt at the Proteomics Core Facility of Biozentrum and the sciCORE scientific computing facility, all from University of Basel. We thank M. Leibundgut for advice with model building, A. Jomaa and S. Mattei for advice on cryo-EM data processing, the ETH scientific center for optical and electron microscopy (ScopeM), and, in particular, M. Peterek and P. Tittmann for technical support. We are indebted to E. Laczko and J. Hu of the Functional Genomics Center Zürich for the help with mass spectrometry. We thank I. Lučić and T. Leonard (Max F. Perutz Laboratories, Vienna) for providing (Delta-PH) Akt1 protein. Funding: F.M. and K.B. are recipients of a fellowship from the Biozentrum International PhD program. This work was supported by the Swiss National Science Foundation (SNSF) via the National Center of Excellence in RNA and Disease (project funding 138262) to N.B. and M.N.H. and SNSF project funding 179323 and 177084 to T.M. Author contributions: A.S. designed the experiments, prepared the sample for cryo-EM, and carried out data processing and structure modeling. A.S. and D.B. performed data collection. F.M. designed the experiments; cloned Akt1, mTORC2 mutants, and Rictor mutants; expressed and purified proteins; and performed the activity assays and the nano-DSF measurements. E.S. established the mTORC2 purification procedure. S.I. cloned mTORC2 and contributed to data analysis and manuscript preparation. M.S. performed the in-cell analysis of mTORC2 activity. K.B. and M.S. performed the KO/KD of MINPP1 and IPPK. A.S., F.M., D.B., S.I., N.B., M.N.H., and T.M. participated in the writing of the manuscript. Competing interests: The authors declare that they have no competing interests. Data and materials availability: All data needed to evaluate the conclusions in the paper are present in the paper and/or the Supplementary Materials. The high-resolution cryo-EM map of the half-mTORC2 (density C) and full-mTORC2 (density A) has been deposited in the Electron Microscopy Data Bank as EMD-11492 and EMD-11488, respectively, while the corresponding models are in the Protein Data Bank as PDB ID 6ZWO and 6ZWM. In addition, the density of mTORC2 in the absence of ATPγS (density F), as well as the densities showing extra density (densities G and H) were deposited in the Electron Microscopy Data Bank as EMD-11489, EMD-11491, and EMD-11490, respectively. Plasmid MX01 is available from Addgene. Requests for materials should be addressed to T.M.
SUPPLEMENTARY MATERIALS
Supplementary material for this article is available at http://advances.sciencemag.org/cgi/content/full/6/45/eabc1251/DC1
REFERENCES AND NOTES
- 1.Mossmann D., Park S., Hall M. N., mTOR signalling and cellular metabolism are mutual determinants in cancer. Nat. Rev. Cancer 18, 744–757 (2018). [DOI] [PubMed] [Google Scholar]
- 2.Imseng S., Aylett C. H., Maier T., Architecture and activation of phosphatidylinositol 3-kinase related kinases. Curr. Opin. Struct. Biol. 49, 177–189 (2018). [DOI] [PubMed] [Google Scholar]
- 3.Keith C. T., Schreiber S. L., PIK-related kinases: DNA repair, recombination, and cell cycle checkpoints. Science 270, 50–51 (1995). [DOI] [PubMed] [Google Scholar]
- 4.Dazert E., Hall M. N., mTOR signaling in disease. Curr. Opin. Cell Biol. 23, 744–755 (2011). [DOI] [PubMed] [Google Scholar]
- 5.Loewith R., Jacinto E., Wullschleger S., Lorberg A., Crespo J. L., Bonenfant D., Oppliger W., Jenoe P., Hall M. N., Two TOR complexes, only one of which is rapamycin sensitive, have distinct roles in cell growth control. Mol. Cell 10, 457–468 (2002). [DOI] [PubMed] [Google Scholar]
- 6.Hara K., Maruki Y., Long X., Yoshino K.-i., Oshiro N., Hidayat S., Tokunaga C., Avruch J., Yonezawa K., Raptor, a binding partner of target of rapamycin (TOR), mediates TOR action. Cell 110, 177–189 (2002). [DOI] [PubMed] [Google Scholar]
- 7.Kim D.-H., Sarbassov D. D., Ali S. M., Latek R. R., Guntur K. V. P., Erdjument-Bromage H., Tempst P., Sabatini D. M., GβL, a positive regulator of the rapamycin-sensitive pathway required for the nutrient-sensitive interaction between raptor and mTOR. Mol. Cell 11, 895–904 (2003). [DOI] [PubMed] [Google Scholar]
- 8.Sarbassov D. D., Kim D.-H., Guertin D. A., Latek R. R., Erdjument-Bromage H., Tempst P., Sabatini D. M., Rictor, a novel binding partner of mTOR, defines a rapamycin-insensitive and raptor-independent pathway that regulates the cytoskeleton. Curr. Biol. 14, 1296–1302 (2004). [DOI] [PubMed] [Google Scholar]
- 9.Yang Q., Inoki K., Ikenoue T., Guan K.-L., Identification of Sin1 as an essential TORC2 component required for complex formation and kinase activity. Genes Dev. 20, 2820–2832 (2006). [DOI] [PMC free article] [PubMed] [Google Scholar]
- 10.Pearce L. R., Huang X., Boudeau J., Pawłowski R., Wullschleger S., Deak M., Ibrahim A. F. M., Gourlay R., Magnuson M. A., Alessi D. R., Identification of Protor as a novel Rictor-binding component of mTOR complex-2. Biochem. J. 405, 513–522 (2007). [DOI] [PMC free article] [PubMed] [Google Scholar]
- 11.García-Martínez J. M., Alessi D. R., mTOR complex 2 (mTORC2) controls hydrophobic motif phosphorylation and activation of serum- and glucocorticoid-induced protein kinase 1 (SGK1). Biochem. J. 416, 375–385 (2008). [DOI] [PubMed] [Google Scholar]
- 12.Ikenoue T., Inoki K., Yang Q., Zhou X., Guan K.-L., Essential function of TORC2 in PKC and Akt turn motif phosphorylation, maturation and signalling. EMBO J. 27, 1919–1931 (2008). [DOI] [PMC free article] [PubMed] [Google Scholar]
- 13.Sarbassov D. D., Guertin D. A., Ali S. M., Sabatini D. M., Phosphorylation and regulation of Akt/PKB by the rictor-mTOR complex. Science 307, 1098–1101 (2005). [DOI] [PubMed] [Google Scholar]
- 14.Guri Y., Colombi M., Dazert E., Hindupur S. K., Roszik J., Moes S., Jenoe P., Heim M. H., Riezman I., Riezman H., Hall M. N., mTORC2 promotes tumorigenesis via lipid synthesis. Cancer Cell 32, 807–823.e12 (2017). [DOI] [PubMed] [Google Scholar]
- 15.Xie J., Wang X., Proud C. G., mTOR inhibitors in cancer therapy. F1000Res. 5, 2078 (2016). [DOI] [PMC free article] [PubMed] [Google Scholar]
- 16.Aylett C. H., Sauer E., Imseng S., Boehringer D., Hall M. N., Ban N., Maier T., Architecture of human mTOR complex 1. Science 351, 48–52 (2016). [DOI] [PubMed] [Google Scholar]
- 17.Benjamin D., Colombi M., Moroni C., Hall M. N., Rapamycin passes the torch: A new generation of mTOR inhibitors. Nat. Rev. Drug Discov. 10, 868–880 (2011). [DOI] [PubMed] [Google Scholar]
- 18.Benavides-Serrato A., Lee J., Holmes B., Landon K. A., Bashir T., Jung M. E., Lichtenstein A., Gera J., Specific blockade of Rictor-mTOR association inhibits mTORC2 activity and is cytotoxic in glioblastoma. PLOS ONE 12, e0176599 (2017). [DOI] [PMC free article] [PubMed] [Google Scholar] [Retracted]
- 19.Baretić D., Berndt A., Ohashi Y., Johnson C. M., Williams R. L., Tor forms a dimer through an N-terminal helical solenoid with a complex topology. Nat. Commun. 7, 11016 (2016). [DOI] [PMC free article] [PubMed] [Google Scholar]
- 20.Chen X., Liu M., Tian Y., Li J., Qi Y., Zhao D., Wu Z., Huang M., Wong C. C. L., Wang H.-W., Wang J., Yang H., Xu Y., Cryo-EM structure of human mTOR complex 2. Cell Res. 28, 518–528 (2018). [DOI] [PMC free article] [PubMed] [Google Scholar]
- 21.Karuppasamy M., Kusmider B., Oliveira T. M., Gaubitz C., Prouteau M., Loewith R., Schaffitzel C., Cryo-EM structure of Saccharomyces cerevisiae target of rapamycin complex 2. Nat. Commun. 8, 1729 (2017). [DOI] [PMC free article] [PubMed] [Google Scholar]
- 22.Stuttfeld E., Aylett C. H., Imseng S., Boehringer D., Scaiola A., Sauer E., Hall M. N., Maier T., Ban N., Architecture of the human mTORC2 core complex. eLife 7, e33101 (2018). [DOI] [PMC free article] [PubMed] [Google Scholar]
- 23.Yang H., Jiang X., Li B., Yang H. J., Miller M., Yang A., Dhar A., Pavletich N. P., Mechanisms of mTORC1 activation by RHEB and inhibition by PRAS40. Nature 552, 368–373 (2017). [DOI] [PMC free article] [PubMed] [Google Scholar]
- 24.Pan D., Matsuura Y., Structures of the pleckstrin homology domain of Saccharomyces cerevisiae Avo1 and its human orthologue Sin1, an essential subunit of TOR complex 2. Acta Crystallogr. Sect. F Struct. Biol. Cryst. Commun. 68, 386–392 (2012). [DOI] [PMC free article] [PubMed] [Google Scholar]
- 25.Tatebe H., Murayama S., Yonekura T., Hatano T., Richter D., Furuya T., Kataoka S., Furuita K., Kojima C., Shiozaki K., Substrate specificity of TOR complex 2 is determined by a ubiquitin-fold domain of the Sin1 subunit. eLife 6, e19594 (2017). [DOI] [PMC free article] [PubMed] [Google Scholar]
- 26.Furuita K., Kataoka S., Sugiki T., Hattori Y., Kobayashi N., Ikegami T., Shiozaki K., Fujiwara T., Kojima C., Utilization of paramagnetic relaxation enhancements for high-resolution NMR structure determination of a soluble loop-rich protein with sparse NOE distance restraints. J. Biomol. NMR 61, 55–64 (2015). [DOI] [PubMed] [Google Scholar]
- 27.Yang H., Rudge D. G., Koos J. D., Vaidialingam B., Yang H. J., Pavletich N. P., mTOR kinase structure, mechanism and regulation. Nature 497, 217–223 (2013). [DOI] [PMC free article] [PubMed] [Google Scholar]
- 28.Gaubitz C., Oliveira T. M., Prouteau M., Leitner A., Karuppasamy M., Konstantinidou G., Rispal D., Eltschinger S., Robinson G. C., Thore S., Aebersold R., Schaffitzel C., Loewith R., Molecular basis of the rapamycin insensitivity of target of rapamycin complex 2. Mol. Cell 58, 977–988 (2015). [DOI] [PubMed] [Google Scholar]
- 29.Dibble C. C., Asara J. M., Manning B. D., Characterization of Rictor phosphorylation sites reveals direct regulation of mTOR complex 2 by S6K1. Mol. Cell. Biol. 29, 5657–5670 (2009). [DOI] [PMC free article] [PubMed] [Google Scholar]
- 30.Lee S., Chanoit G., McIntosh R., Zvara D. A., Xu Z., Molecular mechanism underlying Akt activation in zinc-induced cardioprotection. Am. J. Physiol. Heart Circ. Physiol. 297, H569–H575 (2009). [DOI] [PMC free article] [PubMed] [Google Scholar]
- 31.Nimmanon T., Ziliotto S., Morris S., Flanagan L., Taylor K. M., Phosphorylation of zinc channel ZIP7 drives MAPK, PI3K and mTOR growth and proliferation signalling. Metallomics 9, 471–481 (2017). [DOI] [PMC free article] [PubMed] [Google Scholar]
- 32.Liu P., Gan W., Inuzuka H., Lazorchak A. S., Gao D., Arojo O., Liu D., Wan L., Zhai B., Yu Y., Yuan M., Kim B. M., Shaik S., Menon S., Gygi S. P., Lee T. H., Asara J. M., Manning B. D., Blenis J., Su B., Wei W., Sin1 phosphorylation impairs mTORC2 complex integrity and inhibits downstream Akt signalling to suppress tumorigenesis. Nat. Cell Biol. 15, 1340–1350 (2013). [DOI] [PMC free article] [PubMed] [Google Scholar]
- 33.Hwang Y., Kim L. C., Song W., Edwards D. N., Cook R. S., Chen J., Disruption of the scaffolding function of mLST8 selectively inhibits mTORC2 assembly and function and suppresses mTORC2-dependent tumor Growth in vivo. Cancer Res. 79, 3178–3184 (2019). [DOI] [PMC free article] [PubMed] [Google Scholar]
- 34.Wullschleger S., Loewith R., Oppliger W., Hall M. N., Molecular organization of target of rapamycin complex 2. J. Biol. Chem. 280, 30697–30704 (2005). [DOI] [PubMed] [Google Scholar]
- 35.Wang B., Jie Z., Joo D., Ordureau A., Liu P., Gan W., Guo J., Zhang J., North B. J., Dai X., Cheng X., Bian X., Zhang L., Harper J. W., Sun S.-C., Wei W., TRAF2 and OTUD7B govern a ubiquitin-dependent switch that regulates mTORC2 signalling. Nature 545, 365–369 (2017). [DOI] [PMC free article] [PubMed] [Google Scholar]
- 36.Burke J. E., Structural basis for regulation of phosphoinositide kinases and their involvement in human disease. Mol. Cell 71, 653–673 (2018). [DOI] [PubMed] [Google Scholar]
- 37.Gat Y., Schuller J. M., Lingaraju M., Weyher E., Bonneau F., Strauss M., Murray P. J., Conti E., InsP6 binding to PIKK kinases revealed by the cryo-EM structure of an SMG1–SMG8–SMG9 complex. Nat. Struct. Mol. Biol. 26, 1089–1093 (2019). [DOI] [PubMed] [Google Scholar]
- 38.Hanakahi L. A., Bartlet-Jones M., Chappell C., Pappin D., West S. C., Binding of inositol phosphate to DNA-PK and stimulation of double-strand break repair. Cell 102, 721–729 (2000). [DOI] [PubMed] [Google Scholar]
- 39.Zhang X., Zhan X., Yan C., Zhang W., Liu D., Lei J., Shi Y., Structures of the human spliceosomes before and after release of the ligated exon. Cell Res. 29, 274–285 (2019). [DOI] [PMC free article] [PubMed] [Google Scholar]
- 40.Toste Rego A., da Fonseca P. C. A., Characterization of fully recombinant human 20S and 20S-PA200 proteasome complexes. Mol. Cell 76, 138–147.e5 (2019). [DOI] [PMC free article] [PubMed] [Google Scholar]
- 41.Ouyang Z., Zheng G., Tomchick D. R., Luo X., Yu H., Structural basis and IP6 requirement for Pds5-dependent cohesin dynamics. Mol. Cell 62, 248–259 (2016). [DOI] [PMC free article] [PubMed] [Google Scholar]
- 42.Fitzgerald D. J., Berger P., Schaffitzel C., Yamada K., Richmond T. J., Berger I., Protein complex expression by using multigene baculoviral vectors. Nat. Methods 3, 1021–1032 (2006). [DOI] [PubMed] [Google Scholar]
- 43.Andjelković M., Alessi D. R., Meier R., Fernandez A., Lamb N. J. C., Frech M., Cron P., Cohen P., Lucocq J. M., Hemmings B. A., Role of translocation in the activation and function of protein kinase B. J. Biol. Chem. 272, 31515–31524 (1997). [DOI] [PubMed] [Google Scholar]
- 44.Lučić I., Rathinaswamy M. K., Truebestein L., Hamelin D. J., Burke J. E., Leonard T. A., Conformational sampling of membranes by Akt controls its activation and inactivation. Proc. Natl. Acad. Sci. U.S.A. 115, E3940–E3949 (2018). [DOI] [PMC free article] [PubMed] [Google Scholar]
- 45.Bossler F., Kuhn B. J., Günther T., Kraemer S. J., Khalkar P., Adrian S., Lohrey C., Holzer A., Shimobayashi M., Dürst M., Mayer A., Rösl F., Grundhoff A., Krijgsveld J., Hoppe-Seyler K., Hoppe-Seyler F., Repression of human papillomavirus oncogene expression under hypoxia is mediated by PI3K/mTORC2/AKT signaling. MBio 10, e02323-18 (2019). [DOI] [PMC free article] [PubMed] [Google Scholar]
- 46.Sanjana N. E., Shalem O., Zhang F., Improved vectors and genome-wide libraries for CRISPR screening. Nat. Methods 11, 783–784 (2014). [DOI] [PMC free article] [PubMed] [Google Scholar]
- 47.Ahrné E., Glatter T., Viganò C., von Schubert C., Nigg E. A., Schmidt A., Evaluation and improvement of quantification accuracy in isobaric mass tag-based protein quantification experiments. J. Proteome Res. 15, 2537–2547 (2016). [DOI] [PubMed] [Google Scholar]
- 48.Nesvizhskii A. I., Keller A., Kolker E., Aebersold R., A statistical model for identifying proteins by tandem mass spectrometry. Anal. Chem. 75, 4646–4658 (2003). [DOI] [PubMed] [Google Scholar]
- 49.Mastronarde D. N., Automated electron microscope tomography using robust prediction of specimen movements. J. Struct. Biol. 152, 36–51 (2005). [DOI] [PubMed] [Google Scholar]
- 50.Zheng S. Q., Palovcak E., Armache J.-P., Verba K. A., Cheng Y., Agard D. A., MotionCor2: Anisotropic correction of beam-induced motion for improved cryo-electron microscopy. Nat. Methods 14, 331–332 (2017). [DOI] [PMC free article] [PubMed] [Google Scholar]
- 51.Zhang K., Gctf: Real-time CTF determination and correction. J. Struct. Biol. 193, 1–12 (2016). [DOI] [PMC free article] [PubMed] [Google Scholar]
- 52.Ludtke S. J., Baldwin P. R., Chiu W., EMAN: Semiautomated software for high-resolution single-particle reconstructions. J. Struct. Biol. 128, 82–97 (1999). [DOI] [PubMed] [Google Scholar]
- 53.Zivanov J., Nakane T., Scheres S. H. W., A Bayesian approach to beam-induced motion correction in cryo-EM single-particle analysis. IUCrJ 6, 5–17 (2019). [DOI] [PMC free article] [PubMed] [Google Scholar]
- 54.Punjani A., Rubinstein J. L., Fleet D. J., Brubaker M. A., cryoSPARC: Algorithms for rapid unsupervised cryo-EM structure determination. Nat. Methods 14, 290–296 (2017). [DOI] [PubMed] [Google Scholar]
- 55.Pettersen E. F., Goddard T. D., Huang C. C., Couch G. S., Greenblatt D. M., Meng E. C., Ferrin T. E., UCSF Chimera—A visualization system for exploratory research and analysis. J. Comput. Chem. 25, 1605–1612 (2004). [DOI] [PubMed] [Google Scholar]
- 56.Adams P. D., Afonine P. V., Bunkóczi G., Chen V. B., Davis I. W., Echols N., Headd J. J., Hung L. W., Kapral G. J., Grosse-Kunstleve R. W., McCoy A. J., Moriarty N. W., Oeffner R., Read R. J., Richardson D. C., Richardson J. S., Terwilliger T. C., Zwart P. H., PHENIX: A comprehensive Python-based system for macromolecular structure solution. Acta Crystallogr. D Biol. Crystallogr. 66, 213–221 (2010). [DOI] [PMC free article] [PubMed] [Google Scholar]
- 57.Emsley P., Lohkamp B., Scott W. G., Cowtan K., Features and development of Coot. Acta Crystallogr. D Biol. Crystallogr. 66, 486–501 (2010). [DOI] [PMC free article] [PubMed] [Google Scholar]
- 58.Goddard T. D., Huang C. C., Meng E. C., Pettersen E. F., Couch G. S., Morris J. H., Ferrin T. E., UCSF ChimeraX: Meeting modern challenges in visualization and analysis. Protein Sci. 27, 14–25 (2018). [DOI] [PMC free article] [PubMed] [Google Scholar]
- 59.Baker N. A., Sept D., Joseph S., Holst M. J., McCammon J. A., Electrostatics of nanosystems: Application to microtubules and the ribosome. Proc. Natl. Acad. Sci. U.S.A. 98, 10037–10041 (2001). [DOI] [PMC free article] [PubMed] [Google Scholar]
- 60.Sievers F., Wilm A., Dineen D., Gibson T. J., Karplus K., Li W., Lopez R., McWilliam H., Remmert M., Söding J., Thompson J. D., Higgins D. G., Fast, scalable generation of high-quality protein multiple sequence alignments using Clustal Omega. Mol. Syst. Biol. 7, 539 (2011). [DOI] [PMC free article] [PubMed] [Google Scholar]
- 61.Gouet P., Courcelle E., Stuart D. I., Métoz F., ESPript: Analysis of multiple sequence alignments in PostScript. Bioinformatics 15, 305–308 (1999). [DOI] [PubMed] [Google Scholar]
- 62.Pei J., Grishin N. V., AL2CO: Calculation of positional conservation in a protein sequence alignment. Bioinformatics 17, 700–712 (2001). [DOI] [PubMed] [Google Scholar]
Associated Data
This section collects any data citations, data availability statements, or supplementary materials included in this article.
Supplementary Materials
Supplementary material for this article is available at http://advances.sciencemag.org/cgi/content/full/6/45/eabc1251/DC1