

Ceramide locally thickens the ER-bilayer to compartmentalize diffusion in the ER-membrane and structure ER-TGN-contact sites.
Abstract
In the plasma membrane and in synthetic membranes, resident lipids may laterally unmix to form domains of distinct biophysical properties. Whether lipids also drive the lateral organization of intracellular membranes is largely unknown. Here, we describe genetically encoded fluorescent reporters visualizing local variations in bilayer thickness. Using them, we demonstrate that long-chained ceramides promote the formation of discrete domains of increased bilayer thickness in the yeast ER, particularly in the future plane of cleavage and at ER–trans-Golgi contact sites. Thickening of the ER membrane in the cleavage plane contributed to the formation of lateral diffusion barriers, which restricted the passage of short, but not long, protein transmembrane domains between the mother and bud ER compartments. Together, our data establish that the ER membrane is laterally organized and that ceramides drive this process, and provide insights into the physical nature and biophysical mechanisms of the lateral diffusion barriers that compartmentalize the ER.
INTRODUCTION
The distinct lipid compositions of the different eukaryotic membranes largely establish their identities by determining their fluidity, bendability, thickness, electrostatic properties, or ability to partition into domains [reviewed in (1, 2)]. For example, in vitro studies established that saturated lipids tend to assemble into liquid-ordered domains that show poor fluidity, are more resistant to curvature, and form thick bilayer domains (3). Furthermore, the ability to form these domains is thought to be crucial for the proper function of the plasma membrane (4). However, whether and how lipids affect the lateral organization and function of intracellular membranes has been difficult to study.
For example, the membrane of the endoplasmic reticulum (ER) is particularly rich in unsaturated phosphatidylcholine, phosphatidylethanolamine, and phosphatidylinositol (5), which lend it its remarkable fluidity, a property that is essential for newly synthesized proteins and lipids to rapidly diffuse toward their next destination (6–8). It also comprises specialized domains, such as contact sites with other organelles and lipid droplets [reviewed in (9)], vesicle budding sites [ER-exit sites (ERES); (10)], and rough and smooth membrane territories. However, to which extent lipids contribute to the organization of these domains is not known. On one side, the biophysical properties of the ER lipids suggest that the ER membrane does not partition into distinct lipid domains [discussed in (1)]. On the other side, previous studies have indicated that saturated lipids, particularly ceramides, which are the precursors of complex sphingolipids, contribute to the formation of lateral diffusion barriers in the ER membrane, along the future cleavage plane (11, 12). These barriers compartmentalize the ER membrane of dividing yeast (8, 13), mammalian stem cells (14), and nematode embryos (15) and thereby enable the confinement and asymmetric segregation between daughter cells of diverse cellular factors, such as aging factors and protein aggregates, (13, 16–18). Genetic studies of diffusion barriers in yeast established the ceramide biosynthesis pathway as the central pathway in barrier formation, suggesting that ceramide might be a component of these barriers (11). If correct, this interpretation suggests that specialized lipid domain might form in the ER membrane, at least in the future cleavage plane. However, no method or assay allowing the unambiguous visualization of ceramide distribution in intracellular membranes has been described yet, such that this hypothesis remains untested. Therefore, how ceramide contributes to the makeup and function of lateral diffusion barriers has remained unknown.
To address these questions, we have designed biosensors able to visualize the lateral organization of the yeast ER membrane. We took advantage of the fact that the surface area and the length of protein transmembrane domains (TMDs) are strong determinants of their differential partitioning between lipid domains (19). TMDs with a small surface area, i.e., comprising mainly short hydrophobic residues (alanine, valine, leucine, and isoleucine), are more likely to cofractionate with liquid-ordered membrane domains than TMDs formed of bulky hydrophobic amino acids (phenylalanine, tyrosine, and tryptophan). Furthermore, hydrophobic mismatch causes short TMDs to be excluded from thick bilayer domains, such as liquid-ordered ones, whereas long TMDs are not (20, 21). Thus, we have investigated whether tailored TMDs can be used to probe membrane thickness in vivo and tested whether these tools identify areas of increased bilayer thickness in the ER membrane.
RESULTS AND DISCUSSION
We reasoned that if bilayer thickness were to be nonuniform, then reporter proteins with a slim but increasingly long TMD would distribute themselves differently along the ER membrane. In such a case, the relative distribution of a reference protein containing a short TMD (labeled in one color) and of reporter proteins carrying a single TMD of variable length (in another color) should provide a local readout for the thickness of the bilayer throughout the membrane (Fig. 1 and fig. S1): Long TMD reporters should be specifically more abundant than the reference protein in thick bilayer areas, whereas all proteins should be similarly abundant wherever the membrane is thinner.
Fig. 1. Design of ER-targeted fluorescent reporters with a transmembrane domain varying in length.
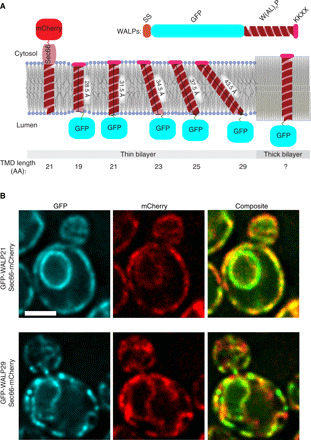
(A) A collection of GFP-labeled WALP peptides is targeted and retained in the ER membrane through a Suc2 signal peptide sequence (SS) and a KKXX motif. The diagram depicts the various conformations WALP (reporter) and Sec66 (reference) TMDs can assume in an idealized bilayer containing shorter unsaturated phospholipids (thin bilayer) or longer saturated ceramides (thick bilayer). The TMD lengths are indicated in amino acids (AA) and in Å. (B) Images of cells coexpressing the reference marker Sec66-mCherry and the reporter proteins GFP-WALP21 and GFP-WALP29. The individual channels and the composite image are shown. Scale bar, 2 μm.
Design of reporter proteins with increasing TMD length
Classically, yeast ER membrane proteins have an average TMD of 21 amino acids, whereas proteins of the plasma membrane show longer TMDs, ranging from 24 to 30 amino acids in length (22). Therefore, we constructed a collection of ER-directed reporter proteins, the TMD of which was composed of a variable number of alanine-leucine dipeptide repeats (AL)n, ranging from 9 repeats (to form a TMD of 19 residues—WALP19) to 14 (TMD of 29 residues—WALP29; Fig. 1A). Thereby, the TMD length of these reporters ranged from 28.5 Å (WALP19) to 43.5 Å (WALP29) (23). We reasoned that these reporters should all be soluble in thin membrane bilayers (less than 3 nm), while only the longest WALPs would be able to enter thicker bilayer domains (~4 nm). WALP19-WALP29 were tagged with green fluorescent protein (GFP) for visualization in vivo and coexpressed with the endogenous protein and translocon component Sec66 (one TMD of 21 residues) tagged with mCherry and used as the reference protein (Fig. 1A). Using Sec61 as reference gave qualitatively identical results (fig. S2A).
Biochemical analysis indicated that these reporter proteins were highly stable (see pulse-chase experiment for WALP21 and WALP29 in fig. S3A), did not aggregate (as they are not solubilized by high salt and sodium carbonate; see WALP29 as example in fig. S3B), and were properly inserted in membranes (as indicated by their solubilization by the membrane detergent Triton X-100; see fig. S3, B and C). Furthermore, their expression did not affect ER homeostasis, as demonstrated by the fact that it did not activate the UPR (unfolded protein response; fig. S3D). The UPR is the main ER–stress response pathway in yeast (24). Last, fluorescence imaging (Fig. 1B and fig. S4A) established that all these GFP-WALP fusion proteins localized to the ER membrane, as intended. Thus, we next investigated more closely the distribution of these proteins relative to the reference marker.
Visual examination of the fluorescence images did not identify substantial difference in localization between GFP–WALP19 through GFP-WALP25 and our reference markers of the ER membrane (Fig. 1A and figs. S2 and S4A). In contrast, GFP-WALP27 and WALP29 were enriched over the reference protein in dispersed dots throughout the ER (Fig. 1B and fig. S4A for WALP27). Among those two proteins, WALP27 affected cell growth for some unknown reason. Therefore, we focalized our further analysis on WALP29, which did not show effects on cellular organization and proliferation. Among the short TMD proteins, WALP21 was used as our standard for most analyses, because it best reflects the average TMD length of yeast ER proteins.
Long TMD WALPs identify discrete structures in the ER membrane
Quantitative analysis of the fluorescence intensities in the GFP (WALPs, reporters) and mCherry (Sec66, reference) channels for all ER pixels (positive for the reference protein) established that WALP21 and Sec66 levels correlate extremely well with each other (Fig. 2, A and B, normalized signal, the corresponding channel is normalized by the median value of that channel for each cell; see Materials and Methods, n = 20 cells, 6046 pixels), indicating that their relative distribution follows a fairly linear relationship. In contrast, the ER pixels of GFP-WALP29–expressing cells formed two main populations (Fig. 2A; n = 20 cells, 6744 pixels). The first one, which forms the bulk, follows pretty much the same distribution as the pixels for WALP21 (Fig. 2, A and B, and fig. S5A). The second one, however, populates the upper part of the graph (Fig. 2A), indicating that their GFP level is disproportionately higher than their mCherry intensity, compared to the bulk pixels. This observation is consistent with the presence of GFP-high dots in the cells expressing GFP-WALP29 and not in those expressing GFP-WALP21 (Fig. 1B). Notably, these GFP-high pixels showed a wide range of mCherry levels, indicating that they do not specifically correspond to mCherry-high or mCherry-low structures.
Fig. 2. Statistical analysis of the signal in ER pixels.
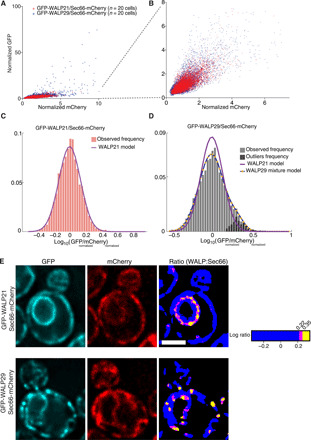
(A) Plot of the normalized GFP intensity of each ER pixel as a function of their normalized mCherry intensity. In each channel (GFP and mCherry), the median intensity is set to 1 in each individual cell (fig. S1 and Materials and Methods). ER pixels are identified by thresholding the sum of the GFP and mCherry signals (fig. S1 and Materials and Methods). Data are shown for 20 cells each of strains coexpressing Sec66-mCherry with GFP-WALP21 (red) and GFP-WALP29 (blue). (B) Close-up of the indicated region in (A). (C) Frequency distribution of the GFP:mCherry ratio (log10) for all ER pixels shown in (A) for the GFP-WALP21–expressing cells. The Gaussian model of this distribution is indicated. (D) Same as (C) for the ER pixels of the GFP-WALP29–expressing cells. The Gaussian model of (C) (WALP21 model) and the mixed model for GFP-WALP29 are shown. Dark gray bars represent the residuals after applying the WALP21 model to the distribution. (E) Distribution of the pixels deviating significantly from the null hypothesis (WALP21 model) at threshold P values of P = 0.05 (magenta) and P = 0.01 (yellow). The same cells as in Fig. 1B are shown. Each channel is shown, as well as the ratiometric image of the ER pixels, onto which the significant pixels are mapped. Scale bars, 2 μm. The significant dots observed in the GFP-WALP29:Sec66-mCherry ratiometric image represent RITs.
Next, the ratio of GFP to mCherry intensities was computed and the distribution of their logarithmic values was plotted. As expected from Fig. 2A, the distribution of the ratios obtained from the WALP21-expressing cells formed a single and nicely symmetric peak that was very well modeled by a single Gaussian (Fig. 2C and fig. S5B for normality test). In contrast, the distribution of the ratios obtained from the WALP29-expressing cells (Fig. 2D) formed an asymmetric peak due to a shoulder toward high GFP values, as expected from the presence of high GFP pixels in the images (Fig. 1B) and in the graph (Fig. 2A) and as highlighted by the QQ plot (fig. S5C). This ratio distribution was best modeled by a mixed model of two Gaussians (Fig. 2D), one overlapping quite extensively with that of the WALP21 model and a second one, smaller and centered at a higher GFP value. The two Gaussians intersected at a value of 0.35, which corresponds to 2.24 times more GFP than mCherry (see Materials and Methods for statistics). We therefore used the WALP21 model as null hypothesis to calculate the P value of the pixels. All pixels with a ratio value above 0.35 have all a probability inferior to 0.01 (P < 0.01) to belong to the bulk distribution. However, they represent 7% of the total number of ER pixels in WALP29-expressing cells, demonstrating that they are roughly sevenfold more abundant than expected by random emergence from the bulk distribution.
When mapped back in the GFP-WALP29/Sec66-mCherry ratiometric images, all of these pixels fall in groups of up to 20 contiguous pixels that form discrete dots in the cell, indicating that they do not localize randomly but identify some discrete structure to which WALP29 tends to localize (Fig. 2E). Furthermore, these structures always colocalized with one of the GFP dots observed in the WALP29 images (Fig. 1B), which were all GFP-high and mCherry-average/low. This observation is consistent with the notion that these dots represented local accumulation of WALP29, specifically. These dots were extremely rare in the WALP19-WALP25 images and generally corresponded to mCherry-high structures, indicating that they reflected local accumulation of ER membrane rather than of the WALP marker specifically. Using the log ratio of 0.35 as cutoff (P < 0.01), 74% of the GFP-intense dots in the WALP29 images lighted up (fig. S6, A and B). Using a log ratio of 0.22 (P < 0.05) as cutoff lighted up 97% of them. At this cutoff, the lighted pixels were still largely grouped in the discrete locations corresponding to GFP-high Sec66-average/low dots in the images, indicating that only few of these pixels reflected imaging noise. In sharp contrast, the rare dots observed in the WALP21 images did not appear significant at these cutoff values. However, the ER pixels lighting up in these images at the 1 and 5% cutoff values were nearly continuously dispersed in the nuclear envelope (NE), indicating that for some unknown reason WALP21 tends to be generally more abundant in the NE than in the rest of the ER (Figs. 1B and 2E). Possibly, short but not long WALPs might readily pass the nuclear pores and populate both the outer and inner nuclear membranes (ONM and INM, respectively), whereas Sec66 is only present in the ONM. This observation is supported by the WALP19-WALP25 images, where the NE is prominent in the GFP channel (fig. S4A), whereas it is not in the Sec66 channel and not in the GFP channel of the images for WALP27 (fig. S4A) and WALP29 (Fig. 1B). In summary, the quantitative analysis of the WALP21 and WALP29 signals and its mapping to the images indicates that WALP29, but not WALP21, accumulates 2- to ≈10-fold in discrete structures throughout the ER membrane. Extrapolation to the images obtained with the other WALPs indicates that the underlying structures accumulate WALP27 and WALP29, but not shorter ones. In reverse, shorter WALPs tend to accumulate in the NE, possibly because they enter the INM more readily. Last, taking a cutoff value at P = 0.05 efficiently discriminates the WALP29-enriched structures from the remainder of the ER. The specific enrichment of the long WALP proteins at specific locations suggested that the lipid bilayer is thicker at these sites and supported the notion that the ER membrane comprises separate lipid domains. Therefore, we refer to these structures as RITs (regions of increased membrane thickness). We are aware that additional fluctuations of the GFP/mCherry ratio can be observed in the images, but at this stage, we cannot assign any significance to them. Some of them might identify small RITs; most might simply reflect noise.
Thick bilayer domains localize to specific structures of the ER membrane
RITs appeared to localize randomly in the cell, with the exception of the bud neck, where they were particularly frequent and appeared enlarged and longer. RITs formed otherwise well-defined dots that regularly decorated the cortical and perinuclear ER (Fig. 1B). Time-lapse imaging indicated that these dots are stable over a minute or longer (i.e., much longer than the time of imaging) and slowly move on the ER surface (fig. S6C). In the bud neck, their presence correlated with a relative depletion of the reference protein [Sec66 and Sec61; Fig. 1C; (8, 11)]. Furthermore, WALP19-WALP25 were also excluded from the bud neck compared to WALP29 (Fig. 3, A and B, and fig. S2A) and relative to the marker DsRed-HDEL, which marks the ER lumen (fig. S2B) (8, 11). Thus, this reduced abundance at the bud neck was not due to ER depletion, consistent with electron microscopy images (25). Together, these observations support the notion that the ER membrane is thicker in the bud neck, i.e., the future cleavage plane of wild-type cells.
Fig. 3. RITs localize to two distinct ER membrane domains.
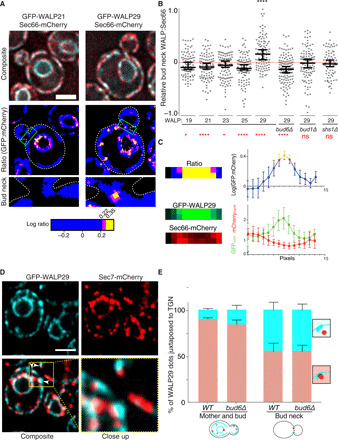
(A) Ratiometric analysis of cells expressing either a short TMD (GFP-WALP21) or long TMD (GFP-WALP29) together with Sec66-mCherry. Close-up images of the indicated bud neck regions are shown. (B) Quantification of the bud neck WALP:Sec66 log ratio relative to the rest of the cortical ER (see fig. S1 and Materials and Methods) for the indicated GFP-WALP reporters in wild-type and mutant cells of indicated genotype. Medians and 95% confidence intervals are shown. Asterisks in black depict statistical significance compared to WALP21, while red asterisks depict whether the means are different from “0.” *P < 0.05, ****P < 0.0001; ns, not significant. n > 100 cells. (C) Intensity scan through RITs. The normalized GFP and mCherry intensity of line scans through 27 RITs is averaged and plotted after aligning all RITs relative to their center (right). The GFP/mCherry ratio (log) is also plotted and color-coded according to significance as in (A). The close-up images of the GFP, mCherry, and ratiometric channels are shown for a RIT example (left). (D) Relative localization of GFP-WALP29 (blue) and the TGN marker Sec7 (labeled with mCherry, red). The images shown were acquired by super-resolution microscopy (Airyscan) to enhance resolution. The individual and merged channels, as well as close-up of the indicated area (yellow box), are shown. (E) Quantification of the relative localization of the different markers in (D). Medians with corresponding SDs are depicted (n > 100 cells per clone, three independent clones). Scale bars, 2 μm.
We next characterized the dispersed RITs, which were the vast majority. Line scans through RITS showed that at these locations WALP accumulation is associated in average with a partial depletion of the Sec66 protein (Fig. 3C). Thus, all RITs correspond to ER areas from which the short TMD reference resides less efficiently. These dispersed RITs did not appear to localize fully randomly but rather associated with specific structures. Although colabeling with markers of the ERES and COPII vesicles (Sec31, Sec13), of the cis-Golgi (Mnn9-mCherry) and of lipid droplets (Erg6-mCherry; fig. S7A) did not reveal much colocalization, nearly 90% of RITs were juxtaposed, but generally not completely superposed to puncta labeled with Sec7-mCherry, a marker of the trans-Golgi network (TGN). This juxtaposition was confirmed using high-resolution imaging (Fig. 3, D and E) (26). We concluded that the dispersed RITs are frequently observed at ER-TGN contact sites. This colocalization was, however, less pronounced in the bud neck (Fig. 3E), suggesting that the dispersed and the bud-neck RITs might not all be fully identical entities. Furthermore, at least some RITs were not apposed to the TGN, suggesting that additional RITs might correspond to additional structures of the ER membrane.
Supporting the notion that dispersed and bud-neck RITs might be partially distinct structures, the enrichment of WALP29 at the bud neck required the function of the septin Shs1, the guanosine triphosphatase (GTPase) Bud1/Rsr1, and the polarisome component Bud6, which are all also required for the assembly of the lateral diffusion barrier in the ER membrane at the bud neck (8, 11, 27). Sec66-mCherry was no longer excluded, and WALP29 was no longer enriched in the bud neck of shs1∆, bud1∆, and bud6∆ single mutant cells (Fig. 3B and fig. S4, B and C). In contrast, the shs1∆ and bud1∆ mutations did not affect formation of the dispersed RITs, as determined by counting their number per WALP29-expressing cells. Furthermore, the bud6∆ mutation did not prevent but actually promoted the formation of dispersed RITs, as the bud6∆ mutant cells contained ≈1.5-fold more of them (fig. S4D). Thus, the dispersed RITs and those localizing to the bud neck seemed to be under different genetic control.
Ceramide drives RITs’ formation
We next thought to test more thoroughly the notion that RITs reflected local bilayer thickening in the ER membrane. The fact that ceramides play an important role in the formation of the lateral diffusion barrier in the ER membrane at the bud neck (11, 12) suggested that they may play a role in bilayer thickening at least at this location. Ceramides, which represent around 3% of the total lipid content of the ER membrane, stand out from the thousands of other ER-lipids due to their long and saturated fatty acid chains (5). More specifically, yeast ceramides are formed of a long chain base of 18 carbon atoms and a saturated very long chain fatty acid (VLCFA) moiety that consists of 24 to 26 carbon atoms (C18:24 and C18:26 ceramides). Because most other ER lipids are formed of unsaturated shorter acyl-chains (16 and 18 carbons), the accumulation of ceramides would be predicted to locally thicken the bilayers, as observed in model membranes in vitro (28). To test whether ceramides play a role in RIT formation, we took advantage of the fact that other organisms, such as mammals, express several ceramide synthases producing ceramides of varying lengths, ranging from C18:16 to C18:26. Ceramide synthases determine the length of the VLCFA that is condensed with sphingosine to produce ceramide, and hence are the determining factor of ceramide length (29). Previous work established that yeast ceramide synthases can be replaced by the mammalian enzymes (30–32). These experiments established that ceramide length in these cells was determined by the enzyme expressed (30, 31). Furthermore, under standard conditions, these cells grew as well as wild-type cells (31, 32), unlike yeast cells lacking ceramide synthase, which are not viable. Thus, under normal conditions, yeast cells grow virtually as well with short as with long ceramides (30). Therefore, we used yeast strains expressing either mammalian CerS3 or CerS5 as sole ceramide synthase to ask whether ceramide length interfere with RIT formation. The CerS3 enzyme produces long ceramides (C18:26) akin to the yeast ceramide synthases, whereas CerS5 produces short ones (C18:16).
Notably, the localization of our WALP reporters was strongly affected by ceramide length. Cells living on short ceramide (C18:16), due to the replacement of the endogenous ceramide synthases (Lac1 and Lag1) by CerS5 (31), showed enrichment of WALP23 and all longer WALPs into RITs similar to those observed with WALP27-WALP29 in wild-type cells (Fig. 4, A and C). Likewise, the WALP23-WALP29 RITs observed in the lac1∆ lag1∆/CerS5 cells were largely juxtaposed to the Sec7-GFP signal, indicating that they also colocalized with ER-TGN interfaces (fig. S8A). WALP19-WALP21 failed to show increased levels there, indicating that they did not pass the threshold of length required for accumulation in this membrane domain (Fig. 4, C and D). In contrast, synthesis of long ceramides [C18:26, using CerS3; (31)] restored the exclusion of WALP23 and WALP25 from dispersed RITs (fig. S9A). Similarly, the short ceramides (lac1∆ lag1∆/CerS5 mutant cells) caused WALP exclusion from the bud neck to progressively decrease from WALP19 to WALP25, compared to wild-type cells (fig. S8B). Furthermore, in these cells, WALP29 was no longer enriched relative to the reference protein Sec66-mCherry at the bud neck (Fig. 5A). This enrichment was, however, restored in the lac1∆ lag1∆/CerS3 mutant cells (Fig. 5A and fig. S9, B and C). Thus, ceramide length determined the ability of RITs to recruit or exclude membrane proteins, depending on the length of their TMD.
Fig. 4. Ceramide length modulates the localization of WALP23 and WALP25 reporters.
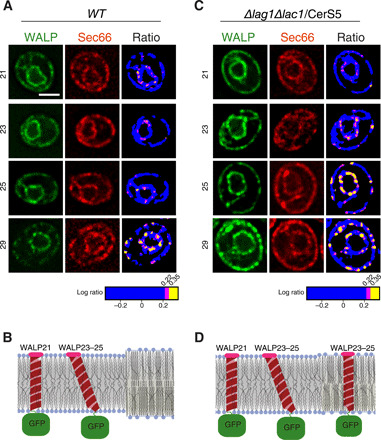
(A and C) Ratiometric imaging of indicated GFP-WALP proteins coexpressed with Sec66-mCherry in cells of indicated genotype and producing C18:24/26 ceramide (A) or C18:16 ceramide (C, short ceramide). The individual channels, as well as the ratiometric images with significant pixels highlighted in magenta (P < 0.05) and yellow (P < 0.01), are shown. Scale bar, 2 μm. (B and D) Schematic representations of the various conformations W(AL)Ps can assume in a bilayer containing unsaturated phospholipids (left side of panels) or in a phospholipid/ceramide mixture (right side of the panels). (B) C18:26 ceramide; (D) C18:16 ceramide.
Fig. 5. Effect of ceramide length on the compartmentalization of the ER.
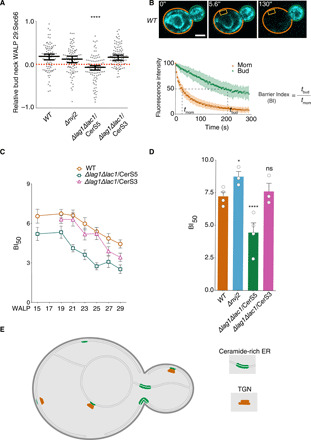
(A) Quantification of the relative bud neck WALP29:Sec66 log ratio in cells of indicated genotype. Median with 95% confidence intervals are shown. *P < 0.05, ****P < 0.0001; n > 100 cells. (B) Metaphase cells expressing Sec61-GFP were subjected to constant photobleaching (yellow box, bleached area); elapsed time is indicated in each movie frame (scale bar, 2 μm). The graph shows the average fluorescence decay kinetics of the monitored areas (mother, orange; bud, green; n = 15 cells). The Barrier index (B.I.50) is defined as the ratio of the bud fluorescence half-life (tbud) over the mother half-life (tmom). (C) Means and SEM of the B.I.50’s of cells expressing different lengths of GFP-WALP as a function of ceramide length (mean is from two to four biological replicate with n ≥ 10 cells per clone). WALP17 is not determined. (D) The means and SEM of the B.I.50’s of cells expressing Sec61-GFP as reporter are plotted. Each circle corresponds to the mean of a biological replicate (n ≥ 10 cells per clone). *P < 0.05, ****P < 0.0001; ns, not significantly different to wild-type. (E) Schematic model of the yeast ER with thick, ceramide-rich domains (green, RITs) associated with the TGN (red) in the mother and bud but not at the bud neck.
Therefore, together, several of our observations indicate that RITs preexist the expression of long WALPs and are therefore endogenous structures of wild-type cells. First, the fact that Sec66 and short WALPs, but not long ones, are depleted at the bud neck relative to the ER-marker DsRed-HDEL (fig. S2, C and D) even in cells that do not express WALP27 or WALP29 supports the notion that the thick ER membrane highlighted by WALP29 there is present already in wild-type cells. The fact that ceramide shortening alleviates the depletion of short WALPs and Sec66 from the bud neck substantially strengthens this conclusion. Second, the fact that the dispersed RITs do not localize randomly but mainly to ER-TGN contact sites, which are the main site of ceramide transport from the ER to the Golgi apparatus in yeast, like in animal cells (33, 34), supports the idea that GFP-WALP29 highlights preexisting and functionally relevant RITs rather than creating them de nihilo. In support of these RITs functioning in lipid exchange, the ceramide transport protein Nvj2 (33) largely colocalized with the dispersed RITs (fig. S7B). Third, upon shortening of ceramide length, shorter WALPs started to also highlight these RITs, indicating that they are not simply an artifact of WALP29/WALP27 expression. Therefore, we conclude that RITs represent functionally differentiated, thick bilayer domains of the normal ER membrane.
The effect of ceramide length on RIT properties is probably also indicative of their nature. The reduced threshold to a TMD of 23 amino acids for entering RITs in the cells producing C18:16 ceramide suggests a thinning of the bilayer in RITs from about 40 Å in cells producing long ceramide (C18:24/26, recruiting WALP29 and possibly WALP27 but not WALP25 and shorter ones) to 32 to 34 Å in cells producing short ceramides (C18:16, recruiting WALP23-WALP29 but not shorter WALPs). The stringency of these domains toward WALP19 and WALP21 compared to the rest of the membrane is consistent with the idea that they represent liquid-ordered domains, which are thicker at equal fatty acid length than disordered domains (35). Furthermore, the hydrophobic core of a bilayer formed solely of C18:26 ceramides is expected to be up to 55 Å thick (35). However, our longest constructs, WALP27 and WALP29, are considerably shorter than this (40.5 and 43.5 Å, respectively) and would be excluded from the hydrophobic core of a pure ceramide bilayer. Thus, our thickness estimates suggest that the dispersed RITs are formed of a lipid mixture (Fig. 4B), the thickness of which is dictated by ceramide, rather than of a membrane patch composed solely of ceramide.
Together, these observations establish several notions. First, they show that ceramides are major determinants of the lateral organization of the ER membrane, in which they locally control bilayer thickness. Second, the ER membrane must be enriched in ceramide at RITs. Last, WALPs are powerful reporters for monitoring lateral variations in membrane thickness in live cells.
Bilayer thickening restricts diffusion through barrier sites
Together, these observations may explain how lateral diffusion barriers form and function at the bud neck. When measuring how rapidly WALP proteins exchange through the bud neck, using fluorescence loss in photobleaching (FLIP) measurements (Fig. 5, B to D) (36), long WALPs exchanged more readily between mother and bud than short ones (fig. S10, A to G). Accordingly, the barrier index (BI), which reports on how tight the barrier is for a given reporter, was much higher for short than for long WALPs (Fig. 5, B and C). This effect was most prominent for WALP27 and WALP29, which both passed the barrier at similar rates, and much faster than their shorter counterparts. Furthermore, reducing ceramide length (lac1∆ lag1∆/CerS5 mutant cells) allowed all WALPs to exchange more freely across the bud neck than in wild-type cells. Restriction of exchange was restored in cells producing long ceramides (lac1∆ lag1∆/CerS3 mutant cells). Thus, ceramide-dependent thickening of the ER membrane at the bud neck contributes to barrier formation, and accordingly, the barrier selectively impairs the passage of short TMDs more than that of long ones.
Supporting this notion, the compartmentalization of an endogenous ER membrane protein such as Sec61 was also largely abrogated in cells producing short ceramides but not in those expressing long ones (Fig. 5D and fig. S10, H to J). Furthermore, barrier strength was increased in cells accumulating more ceramide in the ER due to inactivation of the ceramide transport protein Nvj2 (Fig. 5D). We conclude that Shs1-, Rsr1/Bud1-, and Bud6-dependent accumulation of long ceramides thickens the ER bilayer at the bud neck, where this ensures barrier assembly and function.
In summary, our study establishes the following points. First, our study establishes that the lateral organization of endomembranes is as complex as that suggested for the plasma membrane [reviewed in (4)]. The yeast ER membrane does comprise specialized lipid domains. The formation of these thick bilayer domains is largely driven by ceramides, which must therefore be one of their major components, although we cannot show this directly at this stage. Many of them localize to ER-TGN contact sites, but we anticipate that other RITs will also be found associated with other ER structures.
Second, this study sheds light onto the physical nature of the lateral diffusion barriers observed in the yeast ER membrane. Not only are RITs present at the bud neck but also the thickening of the bilayer is on its own a key feature for their function in restricting lateral diffusion across the membrane. Adapting the tools developed here to animal cells may allow determining whether similar mechanisms drive the assembly and function of the lateral diffusion barriers observed in the ER and plasma membranes of metazoans [(15, 14, 37); reviewed in (38)] and provide insights into how ceramides influence processes such as asymmetric cell division [as observed in (39)] and ciliogenesis (40). Furthermore, deciphering how the assembly and localization of the bud neck RITs is controlled will provide important insights into how cells assemble and regulate these structures.
Last, the method established here for measuring and mapping the thickness of the lipid bilayer in the membranes of living cells is a powerful tool that could be adapted for mapping bilayer thickness in other organelles. This may open doors for dissecting further the relationships between the chemico-physical properties of membranes, their lateral organization, lipid distribution, and their various cellular functions.
MATERIALS AND METHODS
Yeast strains
Yeast strains used in this study are listed in table S1.
Fluorescence microscopy
All strains were grown at 30°C on YPD (yeast extract, peptone and dextrose) medium. Airyscan imaging (Fig. 2, C and D, and figs. S6 and S11) was performed with an upright confocal laser scanning microscope (ZEISS LSM 880) with an alpha Plan-Apochromat 63×/1.4 oil objective. The microscope was additionally equipped with Airyscan detection module (Carl Zeiss) and, before imaging the beam position on the 32-detector array, is calibrated to the center. A diode laser at 561 nm and argon laser light at 488 nm were used as fluorescence excitation sources. Excitation powers were set to 1 to 3% for both lasers and were adjusted within this range for each image individually to achieve a strong enough fluorescence signal for both channels with over 22 Z-stacks that were 0.22 μm apart. The emission signals for both channels were collected subsequently on the 32-channel GaAsP-PMT (gallium arsenide phosphide photomultiplier tube) Airy detector. ZEN Airyscan software (Zeiss) was used to process the acquired datasets that processes each of the 32 Airy detector channels separately by performing filtering, deconvolution, and pixel reassignment to obtain images with enhanced resolution and improved signal to noise ratio.
For the generation of ratiometric images, light microscopy was performed using a DeltaVision wide-field microscope (GE Healthcare) equipped with a pco.edge 5.5 detector (PCO AG) and a ×100/1.4 numerical aperture (NA) objective (×100 1.4 NA oil UPlanSApo) (Figs. 1B, 2B, 3A, and 4, A and C, and figs. S4, A and B, and S9) or a Zeiss 780 FCS inverted microscope (Carl Zeiss AG) equipped with a duo-camera system (GaAsP and PMT detectors) and an alpha Plan-Apochromat 63×/1.4 oil objective (fig. S4, WALP27 cells; fig. S6C, WALP29; movies and data for fig. S2).
FLIP measurements
FLIP experiments were performed as previously described (13, 30). Briefly, cells were grown at 30°C on YPD for 1 to 2 days and re-streaked on YPD for 12 to 14 hours before imaging. Cells were next immobilized on a 2% agar pad containing nonfluorescent medium. The cells were imaged on an LSM 780 or LSM 880 confocal microscope (Carl Zeiss AG) with a ×63/1.4 NA objective and a multiarray 32PMT GaAsP detector, using 3% of 488 nm argon laser intensity. ZEN 2011/2013 software (Carl Zeiss AG) was used to control the microscope. Bleaching was applied with 90 to 110 iterations at 100% laser power. Imaging was done for 40 to 60 time points (4- to 6-s intervals). Quantification was performed with ImageJ 1.52p (National Institutes of Health). In FLIP experiments, the total integrated fluorescence density of the entire mother and bud compartments, as well as five neighboring control cells, was quantified. After normalization of the background fluorescence signal, the fluorescence signal of the mother and bud was normalized to the mean of five neighboring control cells and set to 100% at the beginning of the experiment (after discarding the first time point). The BI was defined as the ratio of the times needed to lose 50% of the fluorescence signal in the bud over the mother. Each experiment was repeated at least three times with a sample size of ≥10 cells. A mean BI was calculated from the BI of replicated experiments.
Ratiometric processing of images
Before processing the images, cells were manually segmented into individual slices from the z-stack taking care to include the slice with the clearest bud neck signal. The corresponding raw images used for analysis therefore consists of two channels (mCherry and GFP) of a single cell, with the bud neck membrane signal present. In the case of wide-field microscopy images, we used the deconvolved images.
The first step of analysis involves the generation of a binary mask that can later be applied to each individual channel to eliminate as much signal from nonmembrane structures. To generate this mask, we take the sum of both channels and apply a general thresholding algorithm (FIJI documentation; max entropy) to generate a binary mask where the signal of interest has a value of “1,” while the rest of the image consists of pixels with a value of “0.”
The second stage of processing consists of applying the mask to each individual channel by multiplying the corresponding channel with the mask to isolate the signal. The next step is to normalize the corresponding pixel values by the median of that channel for that particular cell. Once the relevant pixels have been isolated and normalized, the next step is to generate a ratiometric image from the two resulting images. This is done by simply dividing one image by another (e.g., C1(no background)/C1(no background)). The resulting ratiometric map of the cell must undergo one more processing step after this division step because the distribution of the ratiometric values follows a skewed log distribution. Therefore, the last step involves log-transforming the pixel values into a more normal distribution, after which a custom lookup table was applied according to the WALP21 null hypothesis (values above 0.22 and 0.35 are color-coded, see the “Image statistics” section). The relevant ImageJ macro and MATLAB scripts are available upon request.
Calculating relative bud neck ratio
Once the log-transformed ratiometric images were generated, the relative bud neck ratio was calculated by taking the average fluorescence intensity for the bud neck membrane (as judged by cell morphology using the contrast channel) and subtracting the average value of the mother cell membrane (S2). The resulting statistic for that individual cell is then plotted as a single data point. In cases where the segmentation of the ER signal was not as efficient, we took special care to include as much signal as possible (sometimes with some background). To get the most precise measurements possible, raw images were used to generate regions of interest of mother and bud neck membrane regions for analysis, which were later applied to the ratiometric images.
Cycloheximide chase assay and immunoblotting
Cells were grown to mid-log phase in YPD media. Cessation of protein synthesis was initiated by adding cycloheximide to 200 μg/ml to begin the chase. At each time point, chase was terminated by transferring 9 ml of cells into 1 ml of ice-cold 10% trichloroacetic acid (TCA). Cells were lysed with zirconia-silicate beads on a FastPrep-24 homogenizer. Lysate was cleared by centrifugation at 14,000 rpm at 4°C for 10 min, and pellet was dissolved and resuspended in TCA suspension buffer [100 mM tris-HCl (pH 11.0), 3% SDS, 1 mM phenylmethylsulfonyl fluoride (PMSF)] and heated to 100°C for 10 min. Sample was finally spun down at 14,000 rpm for 10 min at 4°C to remove SDS-insoluble debris, and the supernatant was collected in a fresh tube. The whole-cell lysate in TCA resuspension buffer was stored at −20°C for further analysis.
Crude cell lysates were separated by SDS–polyacrylamide gel electrophoresis (PAGE) and transferred to nitrocellulose. The membrane was blocked for 30 min at 37°C [5% nonfat milk in PBST (phosphate-buffered saline containing 0.1% Tween 20)] before incubation with the primary antibody in the same buffer (overnight at 4°C). The membrane was subsequently washed with PBST twice for 13 min at room temperature and probed with secondary antibody at a dilution of 1:5000 [horseradish peroxidase (HRP)–conjugated mouse immunoglobulin G (IgG) (Bio-Rad) or HRP-conjugated rabbit IgG (Bio-Rad)] in PBST with 0.5% nonfat milk for 1 hour at room temperature. Membrane was washed thrice with PBST buffer for 10 min at room temperature. The membrane was incubated with HRP substrate (KPL LumiGLO Chemiluminescent Substrate, Sera Care) for 2 to 5 min, and signal was visualized. If required, the membrane was stripped by incubating in 100 mM glycine (pH 2.5) at 55° to 60°C for 30 min followed by another round of protein detection.
Alkali extraction assay
Yeast were grown to mid-log phase, and five OD600 (optical density at 600 nm) equivalents were harvested and washed in spheroplast buffer [1 M sorbitol, 20 mM sodium phosphate (pH 7.5), and 75 mM NaCl]. Cells were incubated for 10 min at 30°C in 1 ml of spheroplast buffer and 30 mM dithiothreitol (DTT) and then were spun down and resuspended in spheroplast buffer and 2 mM DTT. After addition of 70 μg of zymolase 100T (ICN), the cells were incubated for 20 min at 30°C, washed in spheroplast buffer, and lysed by glass-bead shearing for 1 min in 1 ml of fractionation buffer [200 mM d-mannitol, 75 mM NaCl, 20 mM sodium phosphate (pH 7.5), and 1 mM MgCl2] plus protease inhibitors. Unlysed cells and cell debris were pelleted at 500g for 5 min, and the supernatant was divided into separate tubes that were subjected to one of the following treatments for 1 hour on ice: 0.1 M Na2CO3 (pH 11.5), 1% Triton X-100, and 0.5 M NaCl. Samples were then separated into pellet and supernatant fractions by centrifugation at 100,000 rpm for 1 hour at 4°C. Pellets were washed once with fractionation buffer containing the original additions, as appropriate, and resuspended in fractionation buffer. Proteins were precipitated in 10% TCA for 30 min on ice, pelleted, washed in ethanol, resuspended in gel loading buffer, and evaluated by immunoblotting. Substrate protein is detected from total, pellet, and supernatant fractions by using anti-HA (Hemagglutinin) antibody. Sec61p and Kar2p serve as controls for integral membrane and soluble proteins, respectively.
Analysis of WALP aggregates
Wild-type cells expressing WALP21 or WALP29 were grown to log phase. Five OD600 units of cells were harvested, washed once in water, and resuspended in 500 μl of TNE buffer [50 mM tris (pH 7.4), 150 mM NaCl, and 5 mM EDTA] containing 1 mM PMSF and 1.5 μl of yeast protease inhibitor cocktail. Cells were disrupted by beating with 0.5-mm zirconium beads (10× 1 min, with 1 min between each interval on ice) using a vortex mixer at full speed at 4°C. Low-speed centrifugation (500g, 5 min at 4°C) was performed twice to remove cell debris. Membranes in the supernatant fraction were solubilized by adding 1% Triton X-100 followed by incubation at room temperature for 5 min. Fifty microliters of this material (T, total) was saved. The remaining lysate was centrifuged at 100,000g for 15 min at 4°C. The supernatant fraction (S) was removed and saved. The pellet fraction (P) was resuspended in 450 μl of 3% SDS and 50 mM tris (pH 7.5) and boiled at 100°C for 5 min. Fifty microliters of each fraction (T, S, and P) was resolved by SDS-PAGE, and proteins were detected using enhanced chemiluminescence (ECL)–based Western-blotting analysis as described.
Analysis of HAC1 splicing
To assess the splicing status of HAC1 mRNA in GFP-WALP21 or WALP29/Sec66-mCherry cells, cells were grown overnight and diluted to OD600 = 0.1 in liquid YPD media. Cells were then allowed to grow to OD600 = 0.35, after which DTT was added at various concentrations to WALP29 cells. Cells were then grown in DTT for 1.5 hours, after which 2 OD600 units were harvested to make complementary DNA (cDNA) libraries.
To generate cDNA libraries, a TRIzol kit (Thermo Fisher Scientific) was used to isolate RNA according to the manufacturer’s instructions. Next, we used the RevertAid First Strand cDNA Synthesis Kit (Thermo Fisher Scientific) using Oligo(dt)18 primers according to the manufacturer’s instructions. Two microliters of cDNA was then used for polymerase chain reactions (PCRs) with HAC1 primers (hac1f: TCGCACTCGTCGTCTGATA and hac1r: TCATGAAGTGATGAAGAAATCATTC) or actin control primers (act1f: GGTTGCTGCTTTGGTTATTGA and act1r: TTTTGACCCATACCGACCAT). The products of RT− and RT+ cDNA libraries were next ran on a 1.5% agarose gel at 100 V for 55 min.
Statistics
The SD of independent clones is shown in the graphs, or as indicated. All the statistical analyses were performed, and the graphs were prepared with PRISM software (GraphPad Software). Comparisons between two groups were done with t test and multiple groups with one-way analysis of variance (ANOVA).
Image statistics
For the generation of the ratiometric color-coded images, we first compared the distribution of normalized Sec66-mCherry/GFP-WALP21 and the distribution of normalized Sec66-mCherry/GFP-WALP29 images (20 cells each, 6046 pixels analyzed for WALP21 and 6744 pixels for WALP29). We used the median value of each channel for each cell to normalize the corresponding channel of that cell after masking out the background pixels. Filtering out the high-GFP average/low-mCherry pixels from the WALP29 distribution showed that these two distributions show a very similar relationship between mCherry and GFP (WALP21 slope = 0.873, WALP29filtered slope = 0.909, WALP29unfiltered slope = 1.86). Because the relationship between mCherry and GFP pixels in the bulk pixels of WALP29 data can be approximated by the WALP21 data, we next fitted a normal distribution model to the log10(GFP:mCherry) for WALP21 data (μ = 0.0067, σ = 0.138) and computed the frequency of high-GFP/average-mCherry pixels by subtracting the observed frequency of these pixels from the expected frequency (using the parameters for WALP21 data). We next fitted these outliers with a second Gaussian (μ = 0.32, σ = 0.08) and computed the proportionality of the second Gaussian using a mean squared error (MSE) approach. This yielded a proportionality factor of 6 to 7% (R = 0.0647). As a last step, we evaluated whether the WALP29 data could be better described by a mixed Gaussian model using the aforementioned parameters and compared it to the single WALP21 and a separate single model fitted to WALP29 (WALP29unfiltered μ = 0.02, σ = 0.185). Using an MSE approach to score fits showed that the mixed model fitted could describe the WALP29 data better than both single models, across different datasets. Because the mixed model essentially contains information about how the bulk pixel pairs (GFP/mCherry) behave as well as about the outliers (the second smaller Gaussian), we used the parameters for the WALP21 single model as our null hypothesis to assign P values to all images, by deriving the ratios at which 1% (yellow pixels in our ratiometric images) and 5% (magenta pixels) of the pixels are explained by the WALP21 model (our null hypothesis), as long as the imaging conditions were not changed.
Supplementary Material
Acknowledgments
We would like to thank H. Reizman and K. Weis for strains, reagents, and feedback and S. Oliferenko and the current and past members of the Barral and Kroschewski laboratories, and particularly C. Weirich for valuable comments and discussions and H. Mustapha for assistance in RNA isolation. We are also grateful to T. Schwarz and ScopeM (ETH Zurich Scientific Center for Optical and Electron Microscopy) for technical support and instrumentation. Funding: This study was supported by the Advanced Grant “Barrage” of the European Research Council (ERC AdG) and a grant of the ETH Research commission to Y.B. Author contributions: This study stems from an original idea of Y.B. R.P., A.S.-G., and Y.B. were involved in its further conceptualization. R.P. and A.S.-G. performed all experiments and measurements. A.S.-G. and Y.B. performed formal analysis of ratiometric images. R.P., A.S.-G., and Y.B. drafted the manuscript together. Review and editing was performed by A.S.-G. and Y.B. Competing interests: The authors declare that they have no competing interests. Data and materials availability: All data needed to evaluate the conclusions in the paper are present in the paper and/or the Supplementary Materials. ImageJ macro and MATLAB script for ratiometric analysis is freely available upon request.
SUPPLEMENTARY MATERIALS
Supplementary material for this article is available at http://advances.sciencemag.org/cgi/content/full/6/46/eaba5130/DC1
REFERENCES AND NOTES
- 1.Bigay J., Antonny B., Curvature, lipid packing, and electrostatics of membrane organelles: Defining cellular territories in determining specificity. Dev. Cell 23, 886–895 (2012). [DOI] [PubMed] [Google Scholar]
- 2.Harayama T., Riezman H., Understanding the diversity of membrane lipid composition. Nat. Rev. Mol. Cell Biol. 19, 281–296 (2018). [DOI] [PubMed] [Google Scholar]
- 3.van Meer G., Voelker D. R., Feigenson G. W., Membrane lipids: Where they are and how they behave. Nat. Rev. Mol. Cell Biol. 9, 112–124 (2008). [DOI] [PMC free article] [PubMed] [Google Scholar]
- 4.Sezgin E., Levental I., Mayor S., Eggeling C., The mystery of membrane organization: Composition, regulation and roles of lipid rafts. Nat. Rev. Mol. Cell Biol. 18, 361–374 (2017). [DOI] [PMC free article] [PubMed] [Google Scholar]
- 5.Ejsing C. S., Sampaio J. L., Surendranath V., Duchoslav E., Ekroos K., Klemm R. W., Simons K., Shevchenko A., Global analysis of the yeast lipidome by quantitative shotgun mass spectrometry. Proc. Natl. Acad. Sci. U.S.A. 106, 2136–2141 (2009). [DOI] [PMC free article] [PubMed] [Google Scholar]
- 6.Grabski S., De Feijter A. W., Schindler M., Endoplasmic reticulum forms a dynamic continuum for lipid diffusion between contiguous soybean root cells. Plant Cell 5, 25–38 (1993). [DOI] [PMC free article] [PubMed] [Google Scholar]
- 7.Storrie B., Pepperkok R., Stelzer E. H., Kreis T. E., The intracellular mobility of a viral membrane glycoprotein measured by confocal microscope fluorescence recovery after photobleaching. J. Cell Sci. 107 (Pt 5), 1309–1319 (1994). [DOI] [PubMed] [Google Scholar]
- 8.Luedeke C., Frei S. B., Sbalzarini I., Schwarz H., Spang A., Barral Y., Septin-dependent compartmentalization of the endoplasmic reticulum during yeast polarized growth. J. Cell Biol. 169, 897–908 (2005). [DOI] [PMC free article] [PubMed] [Google Scholar]
- 9.Wu H., Carvalho P., Voeltz G. K., Here, there, and everywhere: The importance of ER membrane contact sites. Science 361, eaan5835 (2018). [DOI] [PMC free article] [PubMed] [Google Scholar]
- 10.Kurokawa K., Nakano A., The ER exit sites are specialized ER zones for the transport of cargo proteins from the ER to the Golgi apparatus. J. Biochem. 165, 109–114 (2019). [DOI] [PubMed] [Google Scholar]
- 11.Clay L., Caudron F., Denoth-Lippuner A., Boettcher B., Buvelot Frei S., Snapp E. L., Barral Y., A sphingolipid-dependent diffusion barrier confines ER stress to the yeast mother cell. eLife 3, e01883 (2014). [DOI] [PMC free article] [PubMed] [Google Scholar]
- 12.Megyeri M., Prasad R., Volpert G., Sliwa-Gonzalez A., Haribowo A. G., Aguilera-Romero A., Riezman H., Barral Y., Futerman A. H., Schuldiner M., Yeast ceramide synthases, Lag1 and Lac1, have distinct substrate specificity. J. Cell Sci. 132, jcs228411 (2019). [DOI] [PMC free article] [PubMed] [Google Scholar]
- 13.Shcheprova Z., Baldi S., Buvelot Frei S., Gonnet G., Barral Y., A mechanism for asymmetric segregation of age during yeast budding. Nature 454, 728–734 (2008). [DOI] [PubMed] [Google Scholar]
- 14.Moore D. L., Pilz G. A., Arauzo-Bravo M. J., Barral Y., Jessberger S., A mechanism for the segregation of age in mammalian neural stem cells. Science 349, 1334–1338 (2015). [DOI] [PubMed] [Google Scholar]
- 15.Lee Z. Y., Prouteau M., Gotta M., Barral Y., Compartmentalization of the endoplasmic reticulum in the early C. elegans embryos. J. Cell Biol. 214, 665–676 (2016). [DOI] [PMC free article] [PubMed] [Google Scholar]
- 16.Denoth-Lippuner A., Krzyzanowski M. K., Stober C., Barral Y., Role of SAGA in the asymmetric segregation of DNA circles during yeast ageing. eLife 3, e03790 (2014). [DOI] [PMC free article] [PubMed] [Google Scholar]
- 17.Saarikangas J., Caudron F., Prasad R., Moreno D. F., Bolognesi A., Aldea M., Barral Y., Compartmentalization of ER-bound chaperone confines protein deposit formation to the aging yeast cell. Curr. Biol. 27, 773–783 (2017). [DOI] [PubMed] [Google Scholar]
- 18.Baldi S., Bolognesi A., Meinema A. C., Barral Y., Heat stress promotes longevity in budding yeast by relaxing the confinement of age-promoting factors in the mother cell. eLife 6, e28329 (2017). [DOI] [PMC free article] [PubMed] [Google Scholar]
- 19.Lorent J. H., Diaz-Rohrer B., Lin X., Spring K., Gorfe A. A., Levental K. R., Levental I., Structural determinants and functional consequences of protein affinity for membrane rafts. Nat. Commun. 8, 1219 (2017). [DOI] [PMC free article] [PubMed] [Google Scholar]
- 20.Milovanovic D., Jahn R., Organization and dynamics of SNARE proteins in the presynaptic membrane. Front. Physiol. 6, 89 (2015). [DOI] [PMC free article] [PubMed] [Google Scholar]
- 21.Diaz-Rohrer B. B., Levental K. R., Simons K., Levental I., Membrane raft association is a determinant of plasma membrane localization. Proc. Natl. Acad. Sci. U.S.A. 111, 8500–8505 (2014). [DOI] [PMC free article] [PubMed] [Google Scholar]
- 22.Sharpe H. J., Stevens T. J., Munro S., A comprehensive comparison of transmembrane domains reveals organelle-specific properties. Cell 142, 158–169 (2010). [DOI] [PMC free article] [PubMed] [Google Scholar]
- 23.Pauling L., Corey R. B., Branson H. R., The structure of proteins; two hydrogen-bonded helical configurations of the polypeptide chain. Proc. Natl. Acad. Sci. U.S.A. 37, 205–211 (1951). [DOI] [PMC free article] [PubMed] [Google Scholar]
- 24.Wu H., Ng B. S. H., Thibault G., Endoplasmic reticulum stress response in yeast and humans. Biosci. Rep. 34, e00118 (2014). [DOI] [PMC free article] [PubMed] [Google Scholar]
- 25.West M., Zurek N., Hoenger A., Voeltz G. K., A 3D analysis of yeast ER structure reveals how ER domains are organized by membrane curvature. J. Cell Biol. 193, 333–346 (2011). [DOI] [PMC free article] [PubMed] [Google Scholar]
- 26.Huff J., The Airyscan detector from ZEISS: Confocal imaging with improved signal-to-noise ratio and super-resolution. Nat. Methods 12, i–ii (2015). [Google Scholar]
- 27.Chao J. T., Wong A. K. O., Tavassoli S., Young B. P., Chruscicki A., Fang N. N., Howe L. J., Mayor T., Foster L. J., Loewen C. J. R., Polarization of the endoplasmic reticulum by ER-septin tethering. Cell 158, 620–632 (2014). [DOI] [PubMed] [Google Scholar]
- 28.Chiantia S., Kahya N., Ries J., Schwille P., Effects of ceramide on liquid-ordered domains investigated by simultaneous AFM and FCS. Biophys. J. 90, 4500–4508 (2006). [DOI] [PMC free article] [PubMed] [Google Scholar]
- 29.Guillas I., Kirchman P. A., Chuard R., Pfefferli M., Jiang J. C., Jazwinski S. M., Conzelmann A., C26-CoA-dependent ceramide synthesis of Saccharomyces cerevisiae is operated by Lag1p and Lac1p. EMBO J. 20, 2655–2665 (2001). [DOI] [PMC free article] [PubMed] [Google Scholar]
- 30.Cerantola V., Vionnet C., Aebischer O. F., Jenny T., Knudsen J., Conzelmann A., Yeast sphingolipids do not need to contain very long chain fatty acids. Biochem. J. 401, 205–216 (2007). [DOI] [PMC free article] [PubMed] [Google Scholar]
- 31.Hannich J. T., Haribowo A. G., Gentina S., Paillard M., Gomez L., Pillot B., Thibault H., Abegg D., Guex N., Zumbuehl A., Adibekian A., Ovize M., Martinou J.-C., Riezman H., 1-deoxydihydroceramide causes anoxic death by impairing chaperonin-mediated protein folding. Nat. Metab. 1, 996–1008 (2019). [DOI] [PubMed] [Google Scholar]
- 32.Haribowo A. G., Hannich J. T., Michel A. H., Megyeri M., Schuldiner M., Kornmann B., Riezman H., Cytotoxicity of 1-deoxysphingolipid unraveled by genome-wide genetic screens and lipidomics in Saccharomyces cerevisiae. Mol. Biol. Cell 30, 2814–2826 (2019). [DOI] [PMC free article] [PubMed] [Google Scholar]
- 33.Liu L.-K., Choudhary V., Toulmay A., Prinz W. A., An inducible ER-Golgi tether facilitates ceramide transport to alleviate lipotoxicity. J. Cell Biol. 216, 131–147 (2017). [DOI] [PMC free article] [PubMed] [Google Scholar]
- 34.Hanada K., Kumagai K., Yasuda S., Miura Y., Kawano M., Fukasawa M., Nishijima M., Molecular machinery for non-vesicular trafficking of ceramide. Nature 426, 803–809 (2003). [DOI] [PubMed] [Google Scholar]
- 35.Moore T. C., Hartkamp R., Iacovella C. R., Bunge A. L., McCabe C., Effect of ceramide tail length on the structure of model stratum corneum lipid bilayers. Biophys. J. 114, 113–125 (2018). [DOI] [PMC free article] [PubMed] [Google Scholar]
- 36.Bolognesi A., Sliwa-Gonzalez A., Prasad R., Barral Y., Fluorescence recovery after photo-bleaching (FRAP) and fluorescence loss in photo-bleaching (FLIP) experiments to study protein dynamics during budding yeast cell division. Methods Mol. Biol. 1369, 25–44 (2016). [DOI] [PubMed] [Google Scholar]
- 37.Hu Q., Milenkovic L., Jin H., Scott M. P., Nachury M. V., Spiliotis E. T., Nelson W. J., A septin diffusion barrier at the base of the primary cilium maintains ciliary membrane protein distribution. Science 329, 436–439 (2010). [DOI] [PMC free article] [PubMed] [Google Scholar]
- 38.Caudron F., Barral Y., Septins and the lateral compartmentalization of eukaryotic membranes. Dev. Cell 16, 493–506 (2009). [DOI] [PubMed] [Google Scholar]
- 39.Borsa M., Barnstorf I., Baumann N. S., Pallmer K., Yermanos A., Gräbnitz F., Barandun N., Hausmann A., Sandu I., Barral Y., Oxenius A., Modulation of asymmetric cell division as a mechanism to boost CD8+ T cell memory. Sci. Immunol. 4, eaav1730 (2019). [DOI] [PubMed] [Google Scholar]
- 40.He Q., Wang G., Dasgupta S., Dinkins M., Zhu G., Bieberich E., Characterization of an apical ceramide-enriched compartment regulating ciliogenesis. Mol. Biol. Cell 23, 3156–3166 (2012). [DOI] [PMC free article] [PubMed] [Google Scholar]
Associated Data
This section collects any data citations, data availability statements, or supplementary materials included in this article.
Supplementary Materials
Supplementary material for this article is available at http://advances.sciencemag.org/cgi/content/full/6/46/eaba5130/DC1