

The uptake and spread of a-synuclein pathology in the brain are governed by neuronal phenotype and connectomics.
Abstract
In Parkinson’s disease (PD), fibrillar forms of α-synuclein are hypothesized to propagate through synaptically coupled networks, causing Lewy pathology (LP) and neurodegeneration. To more rigorously characterize the determinants of spreading, preformed α-synuclein fibrils were injected into the mouse pedunculopontine nucleus (PPN), a brain region that manifests LP in PD patients and the distribution of developing α-synuclein pathology compared to that ascertained by anterograde and retrograde connectomic mapping. Within the PPN, α-synuclein pathology was cell-specific, being robust in PD-vulnerable cholinergic neurons but not in neighboring noncholinergic neurons. While nearly all neurons projecting to PPN cholinergics manifested α-synuclein pathology, the kinetics, magnitude, and persistence of the propagated pathology were unrelated to the strength of those connections. Thus, neuronal phenotype governs the somatodendritic uptake of pathological α-synuclein, and while the afferent connectome restricts the subsequent spreading of pathology, its magnitude and persistence is not a strict function of the strength of coupling.
INTRODUCTION
Lewy pathology (LP), α-synuclein (aSYN)–rich proteinaceous cytoplasmic inclusions, is a histological hallmark of clinical Parkinson’s disease (cPD) and other related disorders (1, 2). In cPD, LP shows a discrete, patch-like distribution pattern affecting a collection of vulnerable brain regions over the course of the disease (3, 4). Despite growing in severity and spatial magnitude, even at late-stage, LP is confined to distinct nuclei (5, 6).
The distribution of LP in cPD brains is commonly held to be a consequence of the seeding and subsequent spread of a misfolded form of aSYN through synaptically coupled brain networks (7). In support of this view, studies using preformed aSYN fibril (PFF) injections into the brain of animal models have found that PFFs appear to spread in a prion-like manner, leading to a distributed pathology that includes phosphorylated, endogenous aSYN (8). Moreover, the spatiotemporal pattern of aSYN pathology seen in these studies is largely consistent with retrograde axonal propagation and trans-synaptic spread (9–15). However, there are fundamental questions about the determinants of seeding and spreading that remain unanswered.
One basic question is whether all neurons are capable of taking up fibrillar forms of aSYN from the extracellular space and whether this process is similar at pre- and postsynaptic sites. There are several mechanisms by which extracellular depositions of pathological species of aSYN have been hypothesized to be internalized, some of which might be cell type specific and peculiar to subcellular domain (16–18). Another unresolved question is whether the probability of trans-synaptic spreading between two brain structures is directly related to the strength of the synaptic coupling between them. Two recently published papers have argued that the strength of connections is the primary determinant of spreading fibrillar forms of aSYN pathology (19, 20). However, these studies relied upon inferential mathematical approaches and regional connectivity data that is of uncertain measurement scale and blind to neuronal heterogeneity; moreover, in each study, there was a substantial residual variance in the distribution of pathology that was unexplained. Another basic question is whether trans-synaptically propagated aSYN pathology is persistent in all neurons or whether some phenotypes are able to clear aSYN pathology.
To rigorously address these issues, the uptake and spread of aSYN pathology from PD-relevant brain site in a mouse were compared to the afferent and efferent connectome of that site using advanced quantitative anatomical methods. Specifically, aSYN PFFs were focally injected into the pedunculopontine nucleus (PPN) of wild-type mice and the pattern of aSYN mapped with time; the PPN was chosen because it is cytologically heterogeneous and manifests both LP and cell loss in cPD (21–23). This pattern of spread was compared to brain-wide connectomes determined by the cell-specific monosynaptic rabies virus mapping (msRVm) and anterograde axonal tracing. These studies led to several insights. First, PFF-induced pathology in the PPN was largely limited to the cholinergic neurons (CNs) that are most vulnerable in cPD (21, 22), being only rarely detected in neighboring noncholinergic cells, which are either glutamatergic or GABAergic. Thus, the seeding of aSYN pathology was cell type specific. Next, comparison of the spatiotemporal map of pathology with the retro- and anterograde tracing data revealed that most of the neurons in the brain making synaptic contact with PPN CNs manifested signs of aSYN pathology. However, in contrast to the inferences drawn from previous modeling studies, the pattern of pathology was not a simple function of connectivity, as there was no consistent relationship between the number of synaptically coupled neurons in a region and the number of cells manifesting aSYN pathology. Moreover, there was no consistent relationship between the synaptic coupling and the onset of aSYN pathology or its persistence; in many regions, aSYN pathology was transient. Together, these studies demonstrate that while synaptic connectivity constrains the spread of aSYN pathology in the brain, other factors, such as cell type, play a critical role in determining its pattern and persistence, in agreement with inferences drawn from examination of human PD brains (2).
RESULTS
PFF-induced pathology in the PPN was largely limited to CNs
Previous studies have demonstrated that aSYN PFFs seed the aggregation of endogenous aSYN when added to neuronal cultures or stereotactically injected in the rodent brain (9, 10, 17). What has been less clear from these studies is whether the seeding is cell type specific. To address this question in a region relevant to cPD, mouse-derived aSYN PFFs or aSYN monomers were unilaterally injected into the left PPN of a mouse (550 nl of solution, protein concentration of 2.5 μg/μl) (Fig. 1A). By using biotin-tagged aSYN PFFs, an injection volume was chosen that yielded good coverage of the PPN without creating spread to the adjacent regions (Fig. 1B). To assess the evolving aSYN pathology, immunoreactivity (IR) for aSYN phosphorylated at serine-129 (S129) (24, 25) was determined. Injection of non-tagged aSYN PFFs, but not of aSYN monomers, led to S129 IR (p-aSYN) in the PPN by 1-week postinjection (wpi). The p-aSYN IR consisted mostly of perinuclear inclusions and neuritic threads (Fig. 1, C and D). In general, the observed p-aSYN pathology was greatest in the caudal portions of the PPN, referred to as the pars compacta (26), and less pronounced in the more rostral region of the PPN (fig. S1B). To determine whether the p-aSYN pathology was localized to insoluble, aggregated forms of aSYN, tissue sections were treated with proteinase K (PK), confirming the insolubility of the inclusions (Fig. 1E). Most p-aSYN inclusions were also immunoreactive for p62, a common marker of LP in cPD (27, 28).
Fig. 1. Induction of local p-aSYN pathology within the PPN.

(A) Schematic showing PFF injections and pathology assessment. WT, wild type. (B) Distribution of biotin-tagged aSYN PFFs within the PPN at 1 wpi. PAG, Periaqueductal gray. (C) Representative image showing PFF-induced aSYN aggregation detected by p-aSYN. (D) p-aSYN–positive inclusions in ChAT-positive neurons. (E) Representative images after PK or control treatment. (F) Quantification of aggregate location at 1, 6, and 12 wpi on the injected side (Student’s t test with post hoc correction for three t tests). (G) Ratio of aggregate containing cholinergic PPN neurons on the injected side [one-way analysis of variance (ANOVA) followed by Tukey’s post hoc test]. (H) Count of non-CNs (Kruskal-Wallis test followed by Dunn’s multiple comparisons test). (I) Representative images depicting ChAT- and NeuN-positive neurons. (J) Count of ChAT-positive PPN neurons (Kruskal-Wallis test followed by Dunn’s multiple comparisons test). (K) Graph showing percentage of IbA1-positive pixels at the injection site for PFF and monomer groups (one-way ANOVA followed by Tukey’s post hoc test). (L) Microglia (IbA1) within the PPN region. Quantification includes n = 3 for 1 wpi, n = 4 for 6 wpi, and n = 5 for 12 wpi. Scale bars, 250 μm (A), 100 μm (C), 25 μm (D, E, and L), and 500 μm (I). *P < 0.05, **P < 0.01, ***P < 0.001, and ****P < 0.0001.
As noted above, the PPN has a heterogeneous neuronal population, containing glutamatergic (~40%), GABAergic (~35%), and CNs (~25%) (26). CNs are relatively more abundant in the pars compacta portion of the PPN than in the pars dissipata (29). Despite being the least abundant cell type in the PPN, CNs manifested the vast majority of p-aSYN IR following injection of aSYN PFFs (83% at 1 wpi, n = 3; 90% at 6 wpi, n = 4; and 71% at 12 wpi, n = 5) (Fig. 1, F and G). At 1 wpi, p-aSYN IR was sparse and almost exclusively in PPN CN somata and axons. At 6 wpi, a little more than a third of PPN CNs manifested discernible p-aSYN pathology (35%, n = 4); this proportion rose with time, reaching 50% at 12 wpi (n = 5) (Fig. 1G).
The appearance of p-aSYN pathology was associated with a significant decrease of choline acetyltransferase (ChAT) IR, indicating that CNs were down-regulating their phenotype or being lost, while markers for other types of neuron were unaltered (Fig. 1, H to J). As loss of functional PPN CNs is associated with motor deficits (30, 31), mice were tested for motor function. However, there was no deficit in open-field, rotarod, or cylinder test assays at 6 or 12 wpi (fig. S2).
Since neuroinflammation has been implicated in the appearance and spread of aSYN pathology (32), the mesopontine region was examined for signs of microglial activation using an antibody for Iba1 (33). Both aSYN PFFs and aSYN monomers induced a very similar pattern of Iba1 IR at the injection site. However, the similarity in the response to PFF and monomer injections argues that it was triggered by the injection pipette, not PFFs (Fig. 1, K and L). Whether the inflammation induced by the pipette played some role in determining the PFF response remains to be determined.
The input connectome of PPN CNs was distributed along the neuroaxis
As the vast majority of p-aSYN pathology was found in PPN CNs at 1 wpi, subsequent mapping studies were focused on their connectome. The afferent (or input) connectome of PPN CNs was mapped using approaches similar to those that have been used to study neighboring glutamatergic and GABAergic PPN neurons (34–36). Specifically, to obtain a highly quantitative, whole-brain map of neurons making synaptic contact with PPN CNs, the msRVm approach was used (37–39). To this end, ChAT-Cre mice were injected with a mix of two Cre-dependent adeno-associated viral vectors (AAV) carrying an expression plasmid for the avian sarcoma virus receptor (TVA-mCherry) and rabies glycoprotein (RG). Two weeks later, EnvA-pseudotyped, helper-dependent, G protein–deficient rabies virus expressing enhanced green fluorescent protein (eGFP) (ΔG-RV) was injected in the same location (Fig. 2A). This combination resulted in cell type–specific transduction of PPN CNs. PPN starter neurons in which RV capable of trans-synaptic spread were present expressed both mCherry and eGFP reporters (Fig. 2B). All of the starter neurons were confirmed to be ChAT immunoreactive and had a distribution within the PPN that matched that described previously (fig. S1C). To obtain a whole-brain connectome, injected brains were cut into coronal slices (interslice distance of 90 μm), and eGFP-positive neurons were mapped (from the olfactory bulb to the caudal medulla). The Allen Brain Atlas (Allen Institute, USA; http://atlas.brain-map.org/) was used as a reference for assigning neurons to nuclei or regions. Control experiments confirmed the cell type specificity of the tracing (fig. S3).
Fig. 2. Presynaptic inputs to PPN CNs revealed by rabies-mediated retrograde tracing.
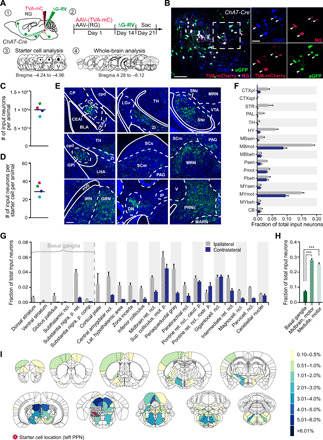
(A) Schematic showing strategy of trans-synaptic tracing. (B) Injected PPN region stained for ChAT, RG, and mCherry. Starter cells (arrowheads) costain for RG, mCherry (indicator for TVA expression), and eGFP (indicator for rabies). (C) Number of traced eGFP-positive input neurons per animal. (D) Calculation of the convergence index revealed 32 presynaptic input neurons per starter cell. (E) Monosynaptic input neurons in selected brain areas. (F) Quantification of presynaptic neurons in gross anatomical regions normalized against the total number of input neurons throughout the respective brain. (G) Fraction of total input neurons for basal ganglia structures and other brain regions accounting for at least 1% of total input. (H) PPN CNs receive significantly more synaptic input from midbrain and motor-related medullar brain regions than from basal ganglia structures (one-way ANOVA followed by Tukey’s multiple comparisons test). (I) Heatmaps of inputs to cholinergic PPN neurons accounting for more than 0.1% of all inputs. Color scale represents the percentage of total inputs. Red circle indicates the location of starter cells. Quantification includes n = 4. Scale bars, 100 μm (B; overview), 50 μm (B; high magnification), and 250 μm (E). ***P < 0.001. All abbreviations used can be found in table S2 in the Supplementary Materials.
On average, about 10,000 input neurons were mapped per animal (n = 4, SD = 1317 cells) (Fig. 2C). On average, there were 32 neurons labeled per starter cell (convergence index) (n = 4, SD = 6.6 cells) (Fig. 2D). Over half of the total innervation of PPN CNs originated in mesencephalic and medullar motor regions (Fig. 2, E and F); this innervation was largely bilateral. PPN CNs also were robustly innervated by neurons in the lateral hypothalamus, zona incerta, inferior colliculus, superior colliculus, parabrachial nucleus, vestibular nuclei, central nucleus of the amygdala, and periaqueductal gray. Aside from the bilateral innervation from motor regions, the innervation of PPN CNs was largely ipsilateral (Fig. 2G). The projection of basal ganglia nuclei to PPN CNs was modest, constituting only a small fraction of the input from mesencephalic and medullar motor regions (Fig. 2H). The basal ganglia input was not only derived primarily from the substantia nigra pars reticulata but also included a small projection from the external segment of the globus pallidus, the substantia nigra pars compacta, and the dorsal striatum. In summary, there were 46 nuclei that contributed at least 0.5% of the total input connectome of PPN CNs (Fig. 2I and fig. S4).
PPN CN axonal projections partially overlapped with the input connectome
Propagation of aSYN pathology also has been reported to occur following axonal transport of pathological forms of aSYN and release at synaptic terminals in vitro (40). To determine whether the pattern of p-aSYN pathology induced by PFF injection into the PPN aligned with the axonal projections of PPN CNs, their anterograde (axonal) projections were mapped. To this end, the left PPN of ChAT-Cre mice was injected with AAV-FLEX-eGFP (41). Three weeks later, mice were sacrificed and perfused, and their brains were sectioned for immunohistochemical analysis (Fig. 3A). Roughly 90% of the eGFP-positive starter cells were localized to the PPN; the remaining neurons were observed in the adjacent laterodorsal tegmental nucleus (LDT). As expected, virtually, all of the starter neurons also were immunoreactive for ChAT (Fig. 3, B and C). Moreover, starter cell mapping (fig. S1D) showed that their distribution was very similar to that of PPN CNs as a whole, arguing that the “projectome” was unbiased and reflected that of the entire PPN CN population. To obtain a comprehensive map of the PPN cholinergic projections, every fourth coronal brain section (30 μm thick) was aligned to the corresponding Allen Brain reference atlas image and graded for axonal eGFP expression.
Fig. 3. Efferent projections of PPN CNs revealed by Cre-dependent eGFP overexpression.
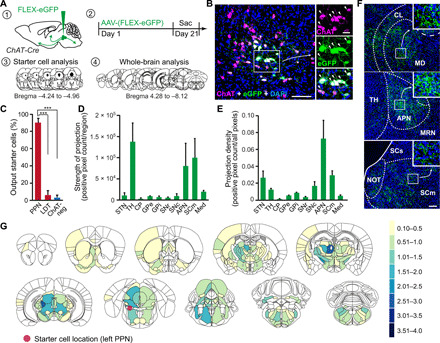
(A) Schematic showing the strategy of cholinergic output tracing. (B) Injected PPN region stained for ChAT, eGFP, and 4′,6-diamidino-2-phenylindole (DAPI). Output tracing starter cells (arrowheads) are indicated by eGFP expression. (C) Distribution of starter cells between cholinergic PPN, cholinergic LDT, and non-CNs (one-way ANOVA followed by Tukey’s post hoc test). (D and E) Quantification of axonal density (positive pixel count normalized to the total area, D) and total positive pixel count (E) in 10 predetermined brain regions (three sections per brain region and animal). (F) Representative images of eGFP-positive axonal projections from PPN CNs. (G) Heatmaps of eGFP-positive axonal density in coronal brain sections. Color scale represents average axonal density assessed semiquantitatively with a grading system from 1 to 4. Red circle indicates the location of starter cells. Quantification includes n = 4. Scale bars, 100 μm (B; overview), 25 μm (B; high magnification), and 100 μm (F). ***P < 0.001. All abbreviations used can be found in table S2 in the Supplementary Materials.
In total, 272 brain regions exhibited eGFP-positive labeling. Midbrain and thalamic regions received most of the PPN cholinergic axonal projections (Fig. 3D). The highest projection density was observed in the anterior pretectal nucleus (APN), a brainstem region involved in sensory information processing and antinociception (Fig. 3, E and F). Consistent with previous single-cell tracing studies (42, 43), two robust ascending projections were identified: one reached mesencephalic structures, such as the midbrain reticular nucleus, APN, periaqueductal gray, superior colliculus (motor part), and the inferior colliculus, and the other pathway broadly targeted thalamic structures (Fig. 3G), such as the parafascicular nucleus and the centrolateral nucleus. In addition, PPN CNs projected to the subthalamic nucleus, substantia nigra pars compacta, ventral tegmental area (VTA), zona incerta, lateral hypothalamus, globus pallidus, basal forebrain, and ventral parts of the dorsal striatum. Notably, the bed nucleus of the anterior commissure, a small structure located below the fornix and directly adjacent to the anterior commissure, exhibited robust axonal labeling. In addition to these rostral projections, PPN CNs sent axons to the deep cerebellar nuclei and medulla. Thus, the afferent and efferent (axonal) connectomes of PPN CNs partially overlapped. A detailed summary of the complete cholinergic PPN output connectome is provided in figs. S5 and S6.
p-aSYN pathology conformed to the afferent connectome
Next, the extent to which the connectomes of PPN CNs aligned with the whole-brain pattern of p-aSYN pathology induced by focal PFF injections was assessed. As a first step toward achieving this assessment, a grading protocol similar to that used in previous studies (12, 44) was developed to quantify p-aSYN IR in somata and neurites (fig. S7). Using this grading system, the extent of p-aSYN IR induced by PFFs and monomers was recorded in coronal brain sections (interslice distance of 240 μm) spanning the complete rostrocaudal extent of the rodent brain (Fig. 4A). Each coronal section was then aligned with the corresponding Allen Brain Atlas image to assign pathology scores to defined brain regions.
Fig. 4. Comparison of systemic p-aSYN pathology induced by aSYN PFF injection.
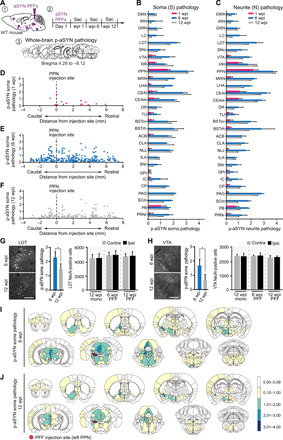
(A) Strategy for PFF injections and assessment of developing brain-wide pathology. (B and C) p-aSYN soma and neurite pathology scores at 1, 6, and 12 wpi of 29 preselected brain regions. (D to F) Caudo-rostral distribution of brain regions relative to the injection site (PPN, 0) showing p-aSYN soma pathology at 1 (D), 6 (E), or 12 (F) wpi. (G and H, left column) Images depicting p-aSYN pathology in LDT or VTA at 6 and 12 wpi. (G and H, middle column) p-aSYN soma pathology was significantly decreased at 12 wpi compared to 6 wpi in LDT or VTA (Mann-Whitney test). (G and H, right column) This decrease was not associated with loss of NeuN-positive cells (Kruskal-Wallis followed by Dunn’s multiple comparisons test). (I and J) Heatmaps depicting brain-wide p-aSYN soma pathology at 6 and 12 wpi. Color scale represents average p-aSYN soma pathology assessed semiquantitatively with a grading system from 1 to 4. Quantification includes n = 3 for 1 wpi, n = 4 for 6 wpi, and n = 5 for 12 wpi. Scale bars, 250 μm (G and H). *P < 0.05.
Previous studies have shown that the spreading of p-aSYN pathology can be relatively rapid (11, 13, 15). Thus, a subset of mice was sacrificed 1 wpi. At this time, 18 brain structures had detectable levels of somatic or neuritic p-aSYN pathology (Fig. 4, B and C). Notably, all of these structures were ipsilateral to the injection site and belonged to the afferent (input) connectome of PPN CNs. Of these regions, 11 also were part of the axonal (output) projection field of PPN CNs. Pathology was preferentially found in structures that were rostral to the PPN. There was no relationship between the distance of the labeled nuclei from the PPN and p-aSYN staining (Fig. 4D). Also of note, the contralateral PPN did not exhibit any p-aSYN pathology at 1 wpi, despite there being contralateral innervation of the PPN CNs.
By 6 wpi, the number of brain regions exhibiting p-aSYN IR had increased substantially: 278 brain regions had somatic and 286 regions had neuritic p-aSYN IR (Fig. 4E and figs. S5 and S6). In general, p-aSYN pathology was more abundant ipsilateral to the injection site. Outside of the PPN, the greatest p-aSYN IR was observed in the central nucleus of the amygdala, the LDT, the sublaterodorsal nucleus, the bed nuclei of the stria terminalis, the periaqueductal gray, the midbrain reticular nucleus, and the lateral hypothalamus. The hippocampus and cerebellum, including the deep cerebellar nuclei, were completely devoid of p-aSYN IR.
In contrast to previous reports, by 12 wpi, p-aSYN IR had clearly declined. Only 168 brain regions had detectable somatic p-aSYN IR, and 176 regions contained neuritic pathology (Fig. 4F and figs. S5 and S6). Many brain regions of interest in cPD decreased in p-aSYN IR from 6 to 12 wpi (Fig. 4, B and C). To determine whether this decrease was associated with cell loss (45), neurons of the LDT and VTA, two brain regions that had high levels of p-aSYN IR at 6 wpi but significantly lower levels at 12 wpi (Fig. 4, G and H), were examined in detail using NeuN staining. In neither region was there any significant loss of neurons between 6 and 12 wpi. Somatic and neuritic p-aSYN pathology was summarized in 10 coronal heatmaps (Fig. 4, I and J, and fig. S8).
Connectomes alone did not explain the evolving pattern of LP
The most parsimonious model of propagation is that the probability of trans-synaptic retrograde spread is the same for all synapses. This would imply that the number of cells manifesting p-aSYN pathology in a particular region would be proportional to the number of neurons innervating the seeding site and the average number of synapses made per neuron. A very similar rule should apply to the afferent connectome determined by msRVm (37, 46). In principle, the only difference between the two maps should be in the relative probability of trans-synaptic spread. To get a better handle on the relationship between these two outcomes, a simple mathematical model of retrograde spreading was constructed (fig. S9). The probability of retrograde labeling at an individual synapse was varied over a range of values (0.1 to 0.9), and the number of synapses formed by an individual axon varied from 1 to 20. This simple exercise provided some valuable insights into the relationship between these two parameters and the labeling pattern obtained by msRVm and aSYN. For example, the functional strength of neurons having a high degree of synaptic convergence on a starter population will be underestimated by msRVm but will be more accurately estimated for sparsely connected populations. The model also suggested that the ratio of msRVm-labeled neurons to those retrogradely labeled by propagated aSYN should be strongly correlated for a biologically reasonable range of retrograde transmission probabilities and synapses per axon (fig. S9).
Against this conceptual backdrop, the number of p-aSYN IR somata was plotted against the number of retrogradely labeled neurons for the 50 strongest input regions to PPN CNs. These plots suggested that there was only a weak correlation between the number of neurons innervating the seeding site and the number of neurons manifesting somatic p-aSYN pathology (nonparametric Spearman’s rank correlation; r2 = 0.0078 at 1 wpi, r2 = 0.2419 at 6 wpi, and r2 = 0.1780 at 12 wpi) (Fig. 5A). An even weaker correlation was observed between neuritic p-aSYN IR and the output tracing scores (nonparametric Spearman’s rank correlation; r2 = 0.00002 at 1 wpi, r2 = 0.0167 at 6 wpi, and r2 = 0.00314 at 12 wpi) (Fig. 5B). As expected, somatic and neuritic p-aSYN pathology were strongly correlated (Fig. 5C).
Fig. 5. Comparison of tracing results and brain-wide p-aSYN pathology.
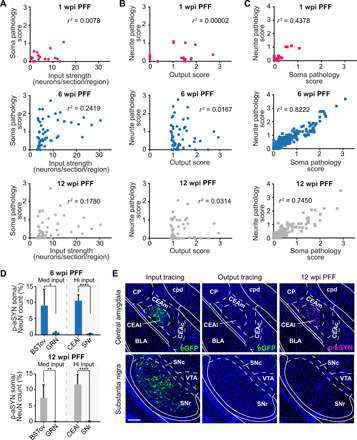
(A and B) Correlating the 50 highest input (A) or output regions (B) for PPN CNs with their respective p-aSYN soma or neurite pathology revealed no correlation between the degree of synaptic input/degree of PPN cholinergic axonal output density and p-aSYN pathology at 1, 6, and 12 wpi (nonparametric Spearman’s rank correlation test). (C) In contrast, p-aSYN soma pathology correlated strongly with p-aSYN neuritic pathology at 1, 6, and 12 wpi (nonparametric Spearman’s rank correlation test). (D) Ratio of input neurons or p-aSYN soma pathology at 6 and 12 wpi in four predetermined brain regions that are either medium (~4% of total input) or high (~8% of total input) inputs of PPN CNs (unpaired t tests). (E) Representative images of PPN input tracing (left, eGFP-labeled neurons), PPN output tracing (middle, eGFP-labeled axons), and p-aSYN pathology (right) of the central amygdala (CEAl) and the substantia nigra at 12 wpi. Quantification includes n = 4 for output and input tracing, n = 3 for PFF 1 wpi, n = 4 for PFF 6 wpi, and n = 5 for PFF 12 wpi. Scale bar, 250 μm (E). *P < 0.05, **P < 0.01, and ****P < 0.0001. BSTov, bed nuclei of the stria terminalis, oval nucleus; GRN, gigantocellular reticular nucleus.
While some regions that strongly innervated PPN CNs, such as the central amygdala (CEAl) or bed nuclei of the stria terminalis, exhibited robust p-aSYN IR, other major innervating regions, such as the SNr or the motor part of the superior colliculus, manifested only very sparse pathology. For example, on average, 22 SNr (Substantia nigra pars reticulata) neurons in each coronal section projected to PPN CNs, but the p-aSYN pathology score for SNr was only 0.23 at 12 wpi, meaning that around 75% of the coronal sections containing the SNr lacked any detectable p-aSYN IR, and the remaining sections had only one to three labeled neurons. Similarly, the caudal pontine reticular nucleus, which provided the strongest innervation of PPN CNs measured with msRVm, with roughly 30 input neurons per coronal section, also had a p-aSYN somatic pathology score of less than 1 at 12 wpi.
The relationship between somatic p-aSYN pathology and the strength of synaptic connectivity also was investigated by determining the percentage of synaptically coupled neurons in a coronal brain slice that had p-aSYN inclusions; this was done in four brain regions (Fig. 5, D and E). This analysis revealed considerable regional heterogeneity in susceptibility to p-aSYN pathology. For example, in a single section, the lateral part of the CEAl and the SNr both had about 8% of their neurons retrogradely labeled from PPN CNs. However, at 6 and 12 wpi, the p-aSYN pathology CEAl and SNr manifested was markedly different (CEAl, 10% at 6 wpi; 11% at 12 wpi; SNr, 0.31% at 6 wpi; and 0.08% at 12 wpi). A similar level of heterogeneity was found in brain regions with more modest innervation of the PPN (Fig. 5, D and E).
Collectively, these data suggest that although the spread of p-aSYN pathology from a seeding site was constrained by the afferent connectome, the probability of spreading at synapses was not uniform. To illustrate this point, maps were constructed that allowed visualization of the relationship between three variables: rostrocaudal distance from the seeding site, the number of neurons innervating the seeding site, and the extent of p-aSYN pathology (Fig. 6). These maps were constructed for three time points after seeding to provide a picture of how pathology evolved. At 1 wpi (Fig. 6A), p-aSYN pathology was not present in those regions with the largest number of neurons innervating PPN CNs but rather in regions with a more modest innervation. Distance from the PPN also was not a factor, eliminating retrograde propagation per se as a major factor in determining the timing of pathology. By 6 wpi (Fig. 6B), p-aSYN pathology was evident in almost all of the innervating regions. By 12 wpi (Fig. 6C), although somatic p-aSYN pathology persisted in a number of sites, such as the CEAl, it had begun to fall in many brain regions and had completely cleared in some innervating nuclei.
Fig. 6. Synaptic connectivity alone does not predict the spreading or persistence of p-aSYN pathology.
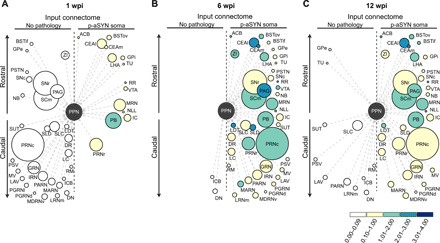
(A to C) Plots of the cholinergic PPN input connectome depicting the 40 strongest input structures and brain regions exhibiting p-aSYN pathology after 1 wpi with their corresponding p-aSYN soma pathology for 1, 6, and 12 wpi. Brain nuclei are represented as circles distributed along the rostrocaudal axis. The diameter of each circle is proportional to the projection strength, whereas the color of the circles corresponds to the strength of pathology. Brain nuclei on the left side show no p-aSYN pathology, while nuclei on the right side exhibit p-aSYN pathology at 1, 6, or 12 wpi.
DISCUSSION
LP is the major histopathological hallmark of cPD. Although LP has many constituents, misfolded and phosphorylated aSYN is a major component of these intracellular depositions (1). It is widely believed that the staging of LP in the brains of patients with cPD reflects the spreading of pathological species of aSYN from regions of the nervous system that interface with the environment (47). Over the past decade, recombinant aSYN PFFs have commonly been used to model the spreading of aSYN from seeding sites either in the brain or in the periphery through synaptic connections (7, 9, 11, 12, 14, 17, 19, 20). While there clearly is evidence that fibrillar or oligomeric forms of aSYN can spread, it remains to be determined whether cellular or regionally autonomous factors govern the spread, as the human pattern of LP does not conform to a simple connectivity map of the brain (2).
This study attempted to rigorously address these issues by mapping the brain-wide distribution of p-aSYN IR following the inoculation of the PPN, a region that manifests LP in cPD brains, with PFFs and then comparing this distribution to that of the cell-specific afferent and efferent connectomes of the PPN neurons exhibiting p-aSYN pathology following inoculation. These studies revealed several key insights into the determinants of the spreading phenomenon. First, in the phenotypically heterogeneous PPN, the introduction of PFFs led to significant p-aSYN pathology only in CNs, not neighboring non-CNs, suggesting that the somatodendritic uptake or retention of fibrillar forms of aSYN is governed by factors that vary from one type of neuron to another. Second, essentially, all of the neurons forming synapses on PPN CNs exhibited signs of retrograde spread of aSYN pathology, arguing that synaptic connectivity was a determinant of spreading. However, the regional strength of this synaptic connection, as judged with msRVm approach, was not consistently correlated with the regional magnitude of the p-aSYN pathology, suggesting that the probability of spread was influenced by other factors. Third, in many regions of the brain, the aSYN pathology induced by PPN PFFs was transient, suggesting that many cell types are capable of eliminating misfolded forms of aSYN pathology. These findings provide a framework for understanding not only how misfolded forms of aSYN might spread in the human brain but also how neuronal phenotype might contribute to the spread of pathological aSYN.
PPN CNs preferentially manifested aSYN pathology induced by PFFs
Of the three PPN neuronal cell types, CNs account for roughly 25% of the total, with roughly equal numbers of GABAergic and glutamatergic neurons making up the balance of the population (26). Despite being the least common type of PPN neuron, the p-aSYN pathology triggered by focal injection of murine PFFs was almost entirely limited to CNs. At 1 wpi, pathology was found primarily in CN somata, with less pathology in axons. This pathology remained for the duration of the experiment. With time, the proportion of PPN CNs exhibiting aSYN pathology increased, likely reflecting both the spread among CNs and the growing detectability of the pathology within individual neurons. S129 aSYN IR also appeared in a small percentage of nominally non-CNs. As IR for ChAT declined in parallel, it is possible that these nominally non-CNs were PPN CNs that had down-regulated their transmitter phenotype in response to the stress of the aSYN pathology (48). Regardless, the selective vulnerability of PPN CNs to PFFs is consistent with studies of the human cPD brain, in which neuronal cell loss and LP in the PPN is largely limited to CNs (22, 23, 49–51).
Why are PPN CNs more susceptible to aSYN PFFs and to LP in humans than neighboring glutamatergic and GABAergic neurons? Although it is possible that in humans with cPD, the LP in PPN CNs is a product of their synaptic connectivity with other “infected” brain regions exhibiting aSYN pathology, our results suggest that cell-autonomous factors also may contribute. There are several possibilities. One factor that is well known to enhance aSYN pathology is the expression of aSYN itself. High levels of endogenous expression promote pathology (19, 52). As aSYN is largely a synaptic protein (53), neuronal expression levels should scale with axonal arbor size. PPN CNs have a significantly larger and more complex axonal arborization compared to their glutamatergic and GABAergic neighbors (42, 43). A second potential cell-specific factor is the expression of surface proteins that bind extracellular aSYN fibrils and promote internalization (16–18). PPN CNs may express one or more of these proteins (e.g., LAG3, neurexin-1b, and amyloid-β precursor-like protein 1), whereas neighboring neurons might not. Another cell-specific factor is the mitochondrial oxidant stress (54). Mitochondrially generated reactive oxygen and reactive nitrogen species are known drivers of aSYN aggregation (55, 56). Moreover, mitochondrial damage resulting from oxidant stress could tax autophagic systems and diminishing cellular capacity to degrade misfolded aSYN (57). A fourth distinguishing factor to consider is intracellular Ca2+. Ca2+ promotes aSYN aggregation (58). Free intracellular Ca2+ concentration is determined by many factors, among these are mobile buffers such as calbindin and calretinin (59). Both of these proteins are more highly expressed in PPN glutamatergic and GABAergic neurons than in CNs (60). PPN CNs exhibit significant oscillations in intracellular Ca2+ concentration that resemble those found in LP-vulnerable dopaminergic neurons in the ventral tier of the substantia nigra (52, 61). Additional studies will be required to determine which (if any) of these factors governs selective uptake of PFFs by PPN CNs.
Anatomical connectivity alone did not explain the distribution of p-aSYN pathology
Our study revealed three features of the spread of aSYN pathology induced by PFFs. First, the distribution of p-aSYN pathology within the first 12 weeks after inoculation was strongly correlated with the afferent connectome of PPN CNs, not with the efferent connectome. That is, our data were consistent with the proposition that there was trans-synaptic spread within the PPN and then retrograde propagation to innervating structures, rather than anterograde spread along the axons of PPN CNs to other brain regions. This conclusion is consistent with recent work examining spread from central seeding sites (9, 13, 19, 20). However, it is unclear whether this is also true for peripheral seeding sites (14). In vitro studies have shown that both retrograde and anterograde propagation of misfolded aSYN are possible (40, 62); but, it is unclear to what extent anterograde propagation in these experiments depends on PFF loading or covalent modification of aSYN pathology. It has been found that at much longer survival times than those examined here, anterograde transport of aSYN pathology in mice becomes apparent after PFF injection into the olfactory bulb (20).
Second, although essentially all of the regions making synaptic contact with PPN CNs manifested aSYN pathology following PFF inoculation, the magnitude of this pathology was not consistently correlated with the strength of the connection as estimated using msRVm. This conclusion is at odds with two recent studies that used a simple diffusion model and regional connectivity data from the Allen Brain Atlas to assess the role of synaptic connectivity in the spreading of aSYN PFF pathology (19, 20). Although of value in exploring hypotheses about spreading, our results highlight limitations to this approach. One of the most significant limitations is that the initial seeding event is cell specific, but the connectivity data used in these studies were not; rather, it was regional data that lumped the synaptic connections of all the cell types in the region. Another limitation of these studies is that the measurement scale of the Allen Brain Atlas connectivity data can only be taken as ordinal, not at an interval or ratio scale; this makes quantitative comparisons between connection strength and aSYN pathology problematic. Last, it is important to note that in both of these previous studies, there was a substantial residual variance in the aSYN pathology data that was not accounted for by the models.
In contrast, our connectomic data was cell specific and was at a ratio scale of measurement, as was the measure of cellular pathology (12, 44). Although our approach did not suffer from these shortcomings, there are caveats to consider. One is that our estimate of aSYN pathology was limited to S129 p-aSYN IR. Although commonly used because of its presence in LP (24, 25), spreading may involve other types of aSYN pathology (63). Second, despite its broad applicability as a cell type–specific anterograde tracer, Cre-dependent eGFP expression labels presynaptic terminals and axons (41). Thus, regions without terminal zones, but passing axons, will likely appear as output regions of PPN CNs; that said, p-aSYN pathology is found in both axons and axon terminals (62). Another caveat is that the estimate of synaptic input strength was based upon msRVm. Although it provides the most quantitative estimate of synaptic connectivity with a genetically defined set of starter neurons, it does come with some uncertainties. For example, the probability of retrograde labeling across an individual synapse is likely to be considerably less than one (~0.3). As rabies virus has not been reported to exhibit any significant cell type–specific tropism in the brain (64, 65), with sparsely coupled cell types, the msRVm approach should provide a robust measure of relative synaptic strength, as defined by the number of synapses formed by an input region (fig. S9). However, with stronger coupling of individual neurons (more than three to four synapses per neuron), the msRVm approach is likely to underestimate the synaptic strength of an input. It is also true that no anatomical approach can unequivocally estimate the functional strength of a synaptic contact. Despite these caveats, the retrograde spread of RV offers the best available means of testing the hypothesis that retrograde propagation of aSYN pathology is dictated strictly by the connectome. Our results are clearly at odds with this conclusion.
The third distinguishing feature of the pathology triggered by PFF injection was that in the vast majority of brain regions innervating PPN CNs, p-aSYN pathology declined after reaching a peak at 6 wpi. In agreement with previous work (66), this finding suggests that many neurons are capable of clearing misfolded forms of aSYN either by autophagy, exocytic release, or some other mechanism (67). While our analysis was restricted to 12 weeks after initial inoculation, it will be important to determine whether the inferred trajectory of aSYN clearance is confirmed at later time points (44). In humans, LP is rarely evident in GABAergic nuclei or regions, suggesting that neurons with this phenotype either do not take up or rapidly dispose of misfolded aSYN (2, 5). In our experiments, several GABAergic nuclei (e.g., CEA) manifested p-aSYN pathology. Given that PPN CNs in humans have LP (as noted above), the reasons for the discrepancy are unclear. One possibility is that with a longer observation period, the pathology in these GABAergic nuclei would have cleared. Another possibility is that synthetic PFFs do not faithfully reproduce the pattern of spreading that is produced by naturally occurring, human LP (68). In addition to containing other constituents that might alter spreading (69, 70), human LP is known to vary in the strain of aSYN it contains, providing another means of shaping propagation (71, 72).
Beyond the role of synaptic connectivity in determining aSYN spreading
A central conclusion of our study is that while synaptic connectivity constrains the spreading of aSYN pathology from an initial seeding site, the magnitude and persistence of this pathology are shaped by other factors. Although a rigorous characterization of these factors is beyond the scope of the current study, there are several possibilities that can be gleaned from the work of others. For example, there are several lines of evidence that suggest that aSYN oligomers or fibrils must undergo some form of posttranslational modification (PTM) to make them capable of trans-synaptic spread (56, 73, 74). One form of PTM implicated in spreading is mediated by reactive oxygen or reactive nitrogen species (56). This type of PTM could be the result of local inflammation or intracellular stress. In addition to PTMs, another potential factor that might contribute to spreading is the recruitment of endogenous aSYN to aggregates seeded by the PFFs. As mentioned above, PPN CNs have massively arborized axons and should, therefore, express high levels of aSYN; this could increase the amount of misfolded aSYN “dumped” at synaptic sites. PTM of aggregated forms of aSYN also could affect the balance between their retention and degradation or release (74). Although this is an emerging area of research, PPN CNs and other vulnerable types of neuron, such as substantia nigra dopaminergic neurons, may create an optimal environment for the PTMs necessary to enable aSYN spreading.
The properties of the neuron making synaptic contact with the host neuron could also be important. For example, the expression level and localization of membrane proteins, such as neurexins, that bind to fibrillar forms of aSYN could be a determinant of trans-synaptic spread (17, 75). That said, all of the neurons making synaptic contact with PPN CNs manifested signs of aSYN propagation. This observation suggests that if these presynaptic proteins govern spread, then they are broadly expressed. Another factor that might contribute to the spreading is the electrophysiological activity. The release of native aSYN at synapses is positively correlated with neuronal spiking (76). Perhaps uptake is as well. While some neurons that exhibited robust retrograde pathology are spontaneously active (e.g., the bed nucleus of the stria terminalis), others that did manifest pathology are not (e.g., CEA). Moreover, SNr GABAergic neurons have very high levels of intrinsic activity and robust connectivity with PPN CNs but little retrograde aSYN pathology. Thus, spiking per se is not likely to be a major determinant of retrograde spreading of PFF pathology. A third factor is how recipient cells deal with misfolded forms of aSYN. The association of aSYN with intracellular membranes, which shapes toxicity (77), is very likely to be shaped by cell type–specific factors, such as intracellular [Ca2+]. The ability of recipient neurons to degrade or release misfolded forms of aSYN also may vary from one cell to the next. The fact that p-aSYN pathology was persistent in some neurons (e.g., CEA GABAergic neurons) and transient in others (e.g., GPe GABAergic neurons) provides a roadmap for future experimental work on these factors.
Conclusions
Together, our study provides new insights into the mechanisms governing the spread of misfolded aSYN in the brain. In addition to demonstrating neuronal specificity in the uptake of aSYN PFFs, our experiments suggest that while synaptic contacts govern the spread of misfolded aSYN from the PPN, they are not the sole determinant of the magnitude of the resulting pathology. The recognition that both synaptic connectivity and other cellular or regional factors determine the pattern and temporal evolution of aSYN pathology in the brain creates a context for understanding the origins of the LP distribution in cPD brains, as well as potentially developing new strategies for controlling its evolution.
MATERIALS AND METHODS
Animals
All animal experiments were performed according to the National Institutes of Health (NIH) Guide for the Care and Use of Laboratory Animals and approved by the Northwestern University Animal Care and Use Committee. For injection of aSYN proteins, wild-type mice (WT:C57Bl/6J; Stock JAX:000664, the Jackson laboratory, USA) were used. Whole-brain input and output tracing studies were conducted in heterozygous ChAT-Cre mice [B6;129S6-Chattm2(cre)lowl/J; Stock JAX:006410, the Jackson laboratory, USA]. To examine the ratio of ChAT-positive PPN neurons expressing Cre recombinase, ChAT-Cre mice were crossed in-house with Ai14-tdTomato mice [B6;129S6-Gt(ROSA)26Sortm14(CAG-tdTomato)Hze/J; Stock JAX:007908, the Jackson laboratory, USA]. Tracing control experiments were performed in ChAT-Cre–negative wild-type littermates on a C57Bl/6 background. We used a similar distribution of male and female mice in all experiments. All animals were between 2 and 3 months old at the beginning of the experiments.
Preparation of purified aSYN PFFs and aSYN monomers and quality controls
Mouse full-length aSYN PFFs were prepared at the Johns Hopkins University School of Medicine, Baltimore, USA, as previously described (17, 78). Briefly, purified monomeric full-length mouse aSYN was stirred at 350 rpm in a glass vial with a magnetic stir bar for 7 days. Thereafter, formed aSYN aggregates were sonicated for 30 s at 10% amplitude with a Branson Digital Sonifier (Danbury, CT, USA). Separation of aSYN monomers and PFFs was performed with fast protein liquid chromatography using a Superose 6 10/300 GL column (GE Healthcare, Life Sciences, Wauwatosa, WI, USA). PFFs were briefly sonicated, and monomeric aSYN and PFFs were frozen at −80°C. A subset of the stock solutions was then used to perform several quality control experiments, including structure analysis with transmission electron microscopy (TEM), immunoblots, and thioflavin T (ThT) binding assays. For TEM analysis, aSYN PFFs were first adsorbed to copper grids (Electron Microscopy Sciences, Hatfield, PA, USA). After washing three times, the grids were negatively stained with uranyl formate. Images were acquired using Philips/FEI BioTwin CM120 Transmission Electron Microscope (Hillsboro, OR, USA). TEM images confirmed the fibrillar morphology of PFFs (~100 nm). For ThT analysis, aSYN monomer and PFFs were incubated with 50 μM ThT, and fluorescence was measured at 450 nm of excitation and 485 nm of emission wavelengths by a plate reader (Tecan, Switzerland). PFFs exhibited a significantly increased fluorescence intensity compared to aSYN monomer. The ability to induce cellular aSYN pathology was further investigated by treating primary cortical neurons from C57BL/6 mice with aSYN PFFs. After 7 days of incubation, all neurons were fixed with 4% paraformaldehyde (PFA) and permeabilized with 0.2% Triton X-100. Then, the cells were blocked and incubated with primary anti-aSYN (pS129) antibody (ab51253, Abcam, Cambridge, MA, USA), confirming the induction of S129 phosphorylated aSYN pathology in primary neurons. Last, aliquoted stock solutions were shipped to Northwestern University, Chicago, USA on dry ice and stored at −80°C. On the day of injection, aliquots were thawed, and sterile phosphate-buffered saline (PBS) was added to achieve a final protein concentration of 2.5 μg/μl. For the preparation of biotin-tagged monomeric aSYN and aSYN PFFs, purified monomeric aSYN was labeled with biotin using EZ-Link Sulfo-NHS-LC-Biotinylation Kit (catalog no. 21435, Thermo Fisher Scientific, Grand Island, NY, USA). Following conjugation, biotin-tagged monomeric aSYN and PFFs were prepared, as described above.
Stereotaxic injections
Stereotaxic injections into the PPN were conducted with a computer-guided system (Angle Two, Leica Biosystems, USA). First, isoflurane-anesthetized mice were placed in the stereotaxic frame (David Kopf Instruments, USA). For injection of viral constructs and aSYN proteins, the following bregma (B1) coordinates were entered into the system: anteroposterior (AP), −4.6; mediolateral (ML), −1.15; and dorsoventral (DV), −3.65. Thereafter, a glass pipette (P-97 Pipette Puller, Sutter Instruments, Novato, CA), containing the respective viral vectors or aSYN proteins, was navigated to the injection site. After drilling a small hole, the glass pipette was slowly lowered into the brain. Injections were performed at low speed (100 nl/min) with an automated microinjector (IM-300, Narishige, Japan), and the pipette was left for an additional 5 min in the brain after the injection was completed. For injection of aSYN proteins, the total volume (550 nl) was split into two injections. While we used the above-described bregma coordinates (B1) for injecting 300 nl of the respective aSYN species, the remaining 250 nl was injected slightly more rostral at a second set of bregma coordinates (B2): AP, −4.24; ML, −1.07; and DV, −3.86. Using two injection sites allowed us to cover the complete extent of the PPN while sparing the adjacent regions. Animals received, in total, 550-nl preparations of either mouse aSYN PFF or biotin-tagged aSYN PFF or biotin-tagged mouse aSYN monomers diluted in PBS with a final protein concentration of 2.5 μg/μl for each aSYN species.
Viral tracing
For rabies virus tracing of the cholinergic PPN input connectome, 30 nl of a 1:1:1 volume mixture of AAV-EF1α-FLEX-TVAmCherry-WPRE-pA (2.14 × 10¹³ vg/ml; Virovek, USA), AAV-EF1α-FLEX-RG-WPRE-pA (2.29 × 10⁻¹³ vg/ml; Virovek, USA), and sterile saline was injected into the PPN of ChAT-Cre mice. Two weeks later, 100 nl of ΔG-RV-NPM-eGFP-L-pA (4.6 × 10⁸ vg/ml; The Salk Institute, USA) was injected into the same bregma coordinate (AP, −4.6; ML, −1.15; and DV, −3.65). To avoid creating false starter cells along the injection track, the pipette for injecting ΔG-RV was tilted 15° from the vertical position. Mice were then housed for 6 days in a BSL2 facility before sacrificing them. For tracing the anterograde axonal connectome of the cholinergic PPN population, 50 nl of a 1:1 volume mixture of AAV2-CAG-FLEX-eGFP-WPRE-bGH (3.92 × 10¹² gc/ml; Penn Vector Core, USA) and sterile saline was injected (AP, −4.6; ML, −1.15; and DV, −3.65), as described above, and mice were sacrificed after 3 weeks.
Histology and imaging
All mice were anesthetized with a ketamine/xylazine mixture and sacrificed by transcardial perfusion with 0.1 M PBS followed by 4% ice-cold PFA for 5 min. After perfusion, mice were decapitated and brains were quickly removed, followed by postfixation for 3 days in PFA and 3 days in 30% sucrose solution. Brains were then frozen on dry ice and stored in −80°C until sectioning. On the day of sectioning, brains were embedded in tissue-freezing media (OCT Compound, Tissue-Tek, USA) and cut into 30-μm-thick consecutive coronal sections using a cryostat microtome (CM3050 S, Leica, Germany). All sections spanning the complete rostrocaudal extent of the brain were kept in correct order and stored at 4°C in cryoprotect solution [1:1:3 volume ratio of ethylene glycol, glycerol, and 0.1 M phosphate buffer (PB)] until further processing.
Immunofluorescence stainings used for data analysis or representative images in Figs. 1, 3, and 5, and figs. S1 and S3 were performed according to the following protocol. Sections were washed 4 × 5 min in 0.1 M PB (phosphate buffer) and blocked for 1 hour in 10% normal donkey serum (NDS) in 0.1 M PB with 0.3% Triton X-100 (PBT) at room temperature (RT). Primary antibodies (table S1) were diluted in 10% NDS in PBT and incubated overnight at 4°C. On the second day, sections were washed four times for 5 min in PBT, then incubated with fluorophore-conjugated, species-specific secondary antibodies (table S1) for 2 hours at RT, and blocked with 10% NDS in PBT. In most cases, sections were additionally stained with 4′,6-diamidino-2-phenylindole (DAPI; 1:10,000 of 5 mg/ml; Sigma-Aldrich, D9542-5MG) for 10 min in 0.1 M PB. Before mounting with antifade mounting medium (ProLong Diamond Antifade Mountant, Invitrogen, P36965), sections were washed five times for 5 min in PBT.
Exceptions to this general immunofluorescence staining protocol were made for staining S129 phosphorylated aSYN in Figs. 1, 4, and 5, and fig. S7 and the microglial marker IbA1 in Fig. 1, where a streptavidin-based amplification of fluorescence was used. For this, sections were washed four times for 5 min in 0.1 M PB and blocked for 1 hour in 10% NDS in PBT at RT. Primary antibodies [anti-aSYN (p-S129); 1:2000; Abcam, ab51253; anti-IbA1; 1:500; Wako, 019-19741] were diluted in 10% NDS in PBT and incubated overnight at 4°C. On the second day, after an initial wash for four times for 5 min in PBT, sections were incubated with a biotinylated species-specific secondary antibody (biotinylated anti-rabbit; 1:1000; Jackson ImmunoResearch, 711-065-152) directed against the rabbit p-aSYN or rabbit IbA1 antibody with 10% NDS in PBT for 1 hour at RT. Sections were then washed (three times for 5 min in PBT) and incubated with fluorophore-conjugated streptavidin (streptavidin Alexa Fluor 647; 1:1000; Jackson ImmunoResearch, 016-600-084) in 10% NDS in PBT for 2 hours at RT. Before mounting, sections were additionally stained with DAPI as described above and thereafter washed again five times for 5 min in PBT.
For analysis of input tracing experiments (Fig. 2) and generation of representative images, sections were washed four times for 5 min and only stained with DAPI for 10 min in 0.1 M PB. Before mounting, sections were washed again two times for 5 min in 0.1 M PB. For analysis of starter cells (Fig. 2B), sections were washed four times for 5 min in 0.1 M PB and blocked with mouse immunoglobulin G blocking reagent (M.O.M Kit, Vector Laboratories, BMK-2202) and 10% NDS in PBT for 4 hours at RT. Thereafter, primary antibody directed against RG (anti-RG; 1:250; Merck Millipore, MAB8727) was incubated with M.O.M protein concentrate and 10% NDS in PBT for 2 days at 4°C. On the second day, other primary antibodies (anti-ChAT; 1:100; Merck Millipore, AB144P; anti-mCherry; 1:1000; Thermo Fisher Scientific, M11217) were added. On day 3, sections were washed four times for 5 min in PBT and incubated with a biotinylated species-specific secondary antibody (biotinylated anti-mouse; 1:1000; Jackson ImmunoResearch, 715-065-151) directed against the mouse RG with M.O.M protein concentrate and 10% NDS in PBT for 3 hours at RT. After another wash (three times for 5 min in PBT), sections were incubated with fluorophore-conjugated, species-specific secondary antibodies (anti-goat Alexa Fluor 405; 1:1000; Abcam, ab175664; anti-rat Cy3; 1:1000; Jackson ImmunoResearch, 712-165-150; streptavidine Alexa Fluor 647; 1:1000; Jackson ImmunoResearch, 016-600-084) for 2 hours at RT, with 10% NDS in PBT. Before mounting, sections were washed again 5 × 5 min in PBT.
Representative images in Figs. 1B, 2E, 3F, 4 (G and H), and 5E, and figs. S1A, S3 (A and C to E), and S7 (A and B) were acquired using an AxioImager M2 microscope (Zeiss, Germany) equipped with an ORCA-Flash 4.0 LT CMOS camera (Hamamatsu C11440-42U, Japan). Representative images in Figs. 1 (C, D, G, and L), 2B, and 3B were acquired with a TCS SP8 confocal microscope (Leica, Germany). All images were processed with FIJI (79) to enhance signal-to-noise or to rearrange colors of certain image channels.
PK treatment
To analyze the formation of insoluble p-aSYN aggregates (Fig. 1G), PPN sections were digested with PK using a protocol described previously (33). Briefly, 30-μm-thick coronal sections containing the PPN region were washed in 0.1 M PB and subsequently digested at 65°C for 10 min in PBT and PK (12 μg/ml) (Invitrogen, no. 4333793). To visualize insoluble aggregates, digested sections were double stained against p-aSYN and p62 in combination with ChAT, following the fluorescence staining protocol described above. Complete absence of ChAT IR indicated successful PK digestion; thus, sections in which ChAT IR was still visible were excluded from analysis, implicating an incomplete protein digestion. Control sections received the same treatment without incubating them in PK.
Quantification of PPN, LDT, and VTA neuronal cell counts
To quantify cholinergic and noncholinergic PPN neurons (Fig. 1 H and I), coronal sections (30 μm thick) of five defined bregma coordinates (−4.24, −4.48, −4.72, −4.84, and −4.96) were analyzed. To assess neuronal cell counts of LDT neurons (Fig. 4G), four defined bregma coordinates (−4.96, −5.02, −5.20, and −5.34) were investigated. Neuronal numbers of VTA neurons (Fig. 4H) were quantified in three defined coronal sections (−3.16, −3.40, and −3.64). Brain tissue was washed three times for 5 min in 0.1 M PB and, thereafter, quenched with 3% H2O2 and 10% methanol for 15 min at RT. After a second wash (four times for 5 min in 0.1 M PB), sections were blocked for 1 hour in 5% NDS in PBT. Primary antibody [anti-neuronal nuclei (NeuN); 1:1000; Merck Millipore, MAB377] was diluted in 5% NDS in PBT and incubated overnight at 4°C. On the second day, sections were washed four times for 5 min in 0.1 M PB and then incubated with a biotinylated secondary antibody (biotinylated donkey anti-mouse; 1:500; Jackson ImmunoResearch, 715-065-151) for 1 hour at RT, followed by incubation in avidin-biotin-peroxidase solution (VECTASTAIN Elite ABC HRP Kit, Vector Laboratories, PK-6100) for 1 hour at RT. Color reaction was initiated with 5% DAB (3,3′-diaminobenzidin; Serva, catalog no. 18865.02), diluted in 0.1 M PB with 0.02% H2O2. After color reaction, sections were washed 4 × 5 min and blocked again for 1 hour in 5% NDS in PBT. Tissue sections were then incubated with another primary antibody [for PPN and LDT sections: anti-ChAT; 1:100; Merck Millipore, AB144P; for VTA sections: anti–tyrosine hydroxylase (TH); 1:1000; Merck Millipore, AB152] diluted in 5% NDS in PBT overnight at 4°C. On the third day, sections were washed four times for 5 min in 0.1 M PB, incubated with a biotinylated secondary antibody (biotinylated donkey anti-goat; 1:500; Jackson ImmunoResearch, 705-065-147; or biotinylated donkey anti-rabbit; 1:500; Jackson ImmunoResearch, 711-065-152) for 1 hour at RT, followed by incubation in avidin-biotin-peroxidase solution (VECTASTAIN Elite ABC HRP Kit, Vector Laboratories, PK-6100) for 1 hour at RT and initiation of color reaction with a peroxidase substrate kit (SG Peroxidase Substrate Kit, Vector Laboratories, SK-4700). All stained sections were mounted, dehydrated, and coverslipped with mounting medium (EUKITT medium, Sigma-Aldrich, catalog no. 03989). Bright-field images were acquired using an Axio Imager M2 microscope (Zeiss, Germany) equipped with an Axiocam 506 color camera (Zeiss, Germany). For quantification of neuronal cell counts, the optical fractionator workflow (Stereo Investigator version 9, MicroBrightField Biosciences, USA) was used. For analysis of PPN and LDT neurons, contours were drawn on the basis of the cytoarchitectonic distribution of ChAT-positive neurons, whereas for assessing VTA cell counts, the distribution of TH-positive neurons was used. Parameters used for counting were as follows: grid size of 100 × 100 μm, counting frame of 85 × 85 μm, and 2 μm of guard zones.
Behavioral analysis
To determine whether aSYN PFFs or aSYN monomers induced behavioral alterations (fig. S2), mice were subjected to open-field, rotarod, and cylinder tests at 6 and 12 wpi. Investigators were blinded to the treatment group, and all experiments were carried out on different days between 12 p.m. and 4 p.m. in the lights-on cycle. Before each test, mice were allowed to habituate to the behavior room for 30 min. For open-field tests, mice were placed in a 56 cm by 56 by 30 cm open-field box (Phenome Technologies, USA) surrounded by a light- and sound-proof chamber (Industrial Acoustics, USA), and their activity was tracked for 5 min using the LimeLight video software (Actimetrics, USA). Analyzed parameters included the total distance traveled and average speed. To evaluate motor performance, mice were tested on a rotarod system (rod diameter, 30 mm; TSE Systems, USA). Therefore, mice were trained at the first 2 days with constant speed (12 rpm, 60 s per trial, three trials per animal and day) and accelerating speed on the third day (4 to 40 rpm over 300 s, max of 300 s per trail, three trails per animal and day). Mice were tested on day 4 with accelerating speed, and three trials were carried out with 10 min of resting time between each trial. Time on the rod was recorded for each trial, and the mean time of all three trials was calculated. To measure spontaneous forelimb use and rearing behavior, the cylinder test was performed. Mice were placed in a glass cylinder (diameter, 12 cm; height, 20 cm) covered with a transparent plexiglass plate and recorded for 3 min without leaving the mice any time for habitation in the new environment. Video recordings were later analyzed, and the number of wall contacts performed with the left or right forelimb was counted. We then calculated the ratio of right forepaw contacts/left forepaw contacts. For analysis of rearing behavior, we quantified each time the mouse raised both forelimbs from the ground and extended its head upwards to explore the environment.
Quantification of reactive microgliosis
To quantify reactive microgliosis (Fig. 1K), 30-μm-thick sections of the PPN region were analyzed using the FIJI software with investigators blinded to the treatment. Briefly, triple immunofluorescent stainings against ChAT, IbA1 (microglial cells), and p-aSYN were carried out, as described above. For analysis of microgliosis, we isolated the IbA1 image channel and performed a background subtraction. The mean background was then multiplied by 4 and set as a threshold. All pixels above this threshold were interpreted as Iba1-positive microglial signal and quantified. The background threshold was quantified for every section, taking into account that the local background was slightly different in every section based on variance in tissue autofluorescence, staining conditions, and imaging. Since microglial activation is accompanied by cell proliferation, migration, and characteristic morphological changes, an increase in IbA1-positive pixel count can be considered as microglial activation.
Whole-brain analysis for input and output tracing
For input tracing of the cholinergic PPN (Fig. 2), every third 30-μm-thick coronal section was stained for DAPI (1:10,000 of 5 mg/ml; Sigma-Aldrich, Germany) and coverslipped with antifade mounting medium (ProLong Diamond Antifade Mountant, Invitrogen, P36965). All sections were scanned with a 10× objective using a Zeiss AxioImager M2 microscope equipped with an ORCA-Flash 4.0 LT CMOS camera (Hamamatsu C11440-42U, Japan) and a two-dimensional slide scanning module (MBF Bioscience, USA). All image tiles of an individual section were automatically stitched together, and a composite image was created by the software. Digital images were then opened in FIJI to carry out brightness and contrast adaptions. Rabies input tracing was analyzed using previously published methods (38). Briefly, each image was matched to the corresponding reference atlas image (Allen Brain Atlas, Allen Institute, USA; http://atlas.brain-map.org/), and eGFP-positive input neurons were manually counted through the entire brain, except for the defined exclusion area surrounding the starter cell population (fig. S3), using the Cell Counter plugin in FIJI. Input neurons were assigned to brain regions based on the morphology of the DAPI stain and tissue autofluorescence. Brain regions lying completely within the exclusion area were not analyzed for input neurons and are, therefore, not represented within the analysis. Brain regions partially lying within the exclusion area were included in the analysis, and synaptic input from those regions is therefore likely underestimated. The number of input neurons of each brain region was normalized by the total number of input neurons counted in the same brain (38). For analysis of the starter cell population, every third 30-μm-thick coronal section containing the PPN region (bregma −4.24 to −4.96) was analyzed. Sections were stained for ChAT, mCherry, and RG, as described above. We defined starter cells as those cells that costained for mCherry, RG, and eGFP. Starter cells of each animal were manually mapped along the rostrocaudal axis to analyze whether spatial starter cell distribution overlapped with distribution of ChAT-positive PPN neurons (fig. S1C).
For analysis of the cholinergic PPN axonal output projectome (Fig. 3), every fourth 30-μm-thick coronal section was stained for DAPI (1:10,000 of 5 mg/ml; Sigma-Aldrich, Germany) and eGFP (anti-GFP; 1:1000; Millipore, AB16901) and coverslipped with antifade mounting medium (ProLong Diamond Antifade Mountant, Invitrogen, P36965). Imaging and generation of a composite image were performed as described above for the input tracing. After matching the composite image to the respective atlas image using anatomical landmarks within the DAPI staining and tissue autofluorescence, eGFP-positive axonal labeling within each brain region was graded from 1 to 4 in every tissue slice. In case a brain region exhibited no eGFP signal in a given brain slice, we graded this as 0. The final output tracing values for every animal were then calculated by adding the individual values and dividing the sum by the number of tissue sections that covered the respective brain region. Fully quantitative data (Fig. 4, D and E) were obtained by a modified method described previously (39). Briefly, 10 brain regions of interest were selected and, for every selected region, three sections covering defined Bregma coordinates were imaged [for STN (subthalamic nucleus): −2.06, −2.18, and −2.30; TH: −0.94, −1.58, and −2.06; CP (caudoputamen): +1.10, +0.62, and +0.14; GPe: −0.22, −0.70, and −1.58; GPi (globus pallidus, internal segment): −1.06, −1.34, and −1.58; SNr and SNc (substantia nigra pars compacta): −3.08, −3.52, and −3.80; APN: −2.70, −3.08, and −3.28; SCm (superior colliculus, motor related) −3.08, −3.52, and −4.04; and Med (medulla): −5.80, −6.12, and −6.64]. After performing a background subtraction, the mean background was multiplied by 4 and set as a threshold. All pixels above this threshold were interpreted as PPN cholinergic output signal. The respective brain regions were outlined on the basis of the anatomical boundaries in the mouse atlas (Allen Brain Atlas, Allen Institute, USA; http://atlas.brain-map.org/), and positive pixel count was quantified. For analysis of the starter cell population (fig. S1D), every fourth 30-μm-thick coronal section containing the PPN region (bregma −4.24 to −4.96) was analyzed. Sections were stained for ChAT, eGFP, and DAPI, and starter cells were defined as those cells that expressed eGFP, regardless of whether they costained for ChAT or not. Every starter cell was then analyzed for ChAT costaining and mapped along the rostrocaudal axis, as described for PPN input tracing.
Whole-brain analysis of p-aSYN pathology
For assessing p-aSYN pathology (Fig. 4), coronal brain sections with an interslice distance of 240 μm, spanning the complete rostrocaudal extent of the mouse brain, were stained for p-aSYN and DAPI, as described above. We first established a grading system (fig. S7) for p-aSYN soma and neurite pathology ranging from 0 to 4, which allowed us to grade soma (S) and neurite pathology (N) independently [0, no p-aSYN signal; 1, sparse (very few neurites in brain region or one to three soma in the brain region); 2, mild (more neurites, but large areas without or four or more soma, but large areas uncovered); 3, dense (brain region covered with neurites, but places spared or many soma aggregates in the brain region, but places spared); and 4, very dense (brain region densely covered with neurites or brain region densely covered with soma aggregates)]. For analysis, each image was matched to the corresponding reference atlas image (Allen Brain Atlas, Allen Institute, USA; http://atlas.brain-map.org/), and p-aSYN soma and neurite pathology was graded in every brain region. The investigator was blinded to the treatment and time point. Pathology scores were assigned to specific brain regions on the basis of the morphology of the DAPI stain and tissue autofluorescence. Means were then calculated for each brain region, aSYN protein group, and time point. No p-aSYN pathology was observed in aSYN monomer–injected control mice. For assessment of local p-aSYN pathology (Fig. 1 and fig. S1B), coronal sections (30 μm thick) of four defined bregma coordinates (−4.24, −4.48, −4.72, and −4.96) were analyzed. Brain tissue was stained for ChAT, p-aSYN, and MAP2, and p-aSYN–positive somatic inclusions were counted using the Cell Counter plugin in FIJI.
Statistical methods
All data were analyzed using GraphPad Prism (version 8.3.1; GraphPad Software, USA), FIJI, or Microsoft Excel 2016. In all experiments, sample size was based on prior studies using similar techniques. Column bar graphs display mean, and whiskers represent the SD. Whisker plots show median, lower, and upper quartiles, and whiskers represent the minimum and maximum values in the sample. In dot plots, dots display data of individual animals, and line indicates mean value. Normality of data distribution was tested with Schapiro-Wilk test for every experiment. Statistical significance of differences between two normally distributed groups was analyzed by unpaired Student’s t test. Differences between multiple groups were assessed by one- or two-way analysis of variance (ANOVA) followed by Tukey’s or Dunnett’s multiple comparisons test. Data analysis of behavioral tests was performed with one-way ANOVA for matched samples. For not normally distributed data, the corresponding nonparametric test (Mann-Whitney test for the comparison of two groups and Kruskal-Wallis test followed by Dunn’s multiple comparison test for the comparison of three or more groups) was used. To calculate correlations, we used scatterplots and performed nonparametric Spearman’s rank correlation analysis. Differences were considered significant at P < 0.05. Significance indicators were kept constant in all figures (*P < 0.05, **P < 0.01, ***P < 0.001, and ****P < 0.0001). All figures were created with Adobe Illustrator version 21.1 (Adobe Systems).
Supplementary Material
Acknowledgments
We wish to thank S. Anfimov for technical assistance with the tissue processing and immunohistochemistry; K. Roth and the Core Facility Cellular Imaging of Philipps University-Marburg for the use and assistance with the Leica TCS SP8 confocal microscope; and C. Weiss, M. Kando, and the Northwestern University Behavioral Phenotyping Core for help with behavioral testing and data analysis. Furthermore, we wish to thank E. Callaway and I. R. Wickersham for guidance about the quantitative aspects of msRVm. Funding: This work was supported by the awards to D.J.S. by the JPB Foundation and to F.F.G. by the ParkinsonFonds Deutschland. W.H.O. is supported by the Charitable Hertie Foundation, Frankfurt/Main, Germany. M.T.H. received a grant from the German Society for Parkinson and Movement Disorders. X.M. was supported by NIH/NIA K01AG056841, NIH/NINDS R01NS107318, American Parkinson’s Disease Association 90076052, and Parkinson’s Foundation the Stanley Fahn Junior Faculty Award PF-JFA-1933. Author contributions: M.T.H., F.F.G., W.H.O., and D.J.S. conceived and designed the project. M.T.H. and F.F.G. executed the stereotaxic injections, conducted the behavioral testing, performed immunohistochemistry and data analysis, and prepared the figures. A.S. performed immunohistochemistry and data analysis. H.L. assisted in establishing the tracing techniques. X.M., V.L.D., and T.M.D. provided feedback on the PFF injection strategies and analysis of the spreading. B.I.G. generated and provided the 81A antibody. X.M., V.L.D., T.M.D., and B.I.G. critically reviewed the manuscript. M.T.H., F.F.G., and D.J.S. composed the figures. D.J.S., M.T.H., F.F.G., and W.H.O. wrote the manuscript. Competing interests: The authors declare that they have no competing interests. Data and materials availability: All data needed to evaluate the conclusions in the paper are present in the paper and/or the Supplementary Materials. Additional data related to this paper may be requested from the authors.
SUPPLEMENTARY MATERIALS
Supplementary material for this article is available at http://advances.sciencemag.org/cgi/content/full/6/46/eabc2487/DC1
REFERENCES AND NOTES
- 1.Spillantini M. G., Schmidt M. L., Lee V. M.-L., Trojanowski J. Q., Jakes R., Goedert M., α-synuclein in Lewy bodies. Nature 388, 839–840 (1997). [DOI] [PubMed] [Google Scholar]
- 2.Surmeier D. J., Obeso J. A., Halliday G. M., Selective neuronal vulnerability in Parkinson disease. Nat. Rev. Neurosci. 18, 101–113 (2017). [DOI] [PMC free article] [PubMed] [Google Scholar]
- 3.Braak H., Del Tredici K., Rüb U., de Vos R. A. I., Jansen Steur E. N. H., Braak E., Staging of brain pathology related to sporadic Parkinson’s disease. Neurobiol. Aging 24, 197–211 (2003). [DOI] [PubMed] [Google Scholar]
- 4.Beach T. G., Adler C. H., Lue L. F., Sue L. I., Bachalakuri J., Henry-Watson J., Sasse J., Boyer S., Shirohi S., Brooks R., Eschbacher J., White C. L. III, Akiyama H., Caviness J., Shill H. A., Connor D. J., Sabbagh M. N., Walker D. G., Unified staging system for Lewy body disorders: Correlation with nigrostriatal degeneration, cognitive impairment and motor dysfunction. Acta Neuropathol. 117, 613–634 (2009). [DOI] [PMC free article] [PubMed] [Google Scholar]
- 5.Surmeier D. J., Obeso J. A., Halliday G. M., Parkinson’s disease is not simply a prion disorder. J. Neurosci. 37, 9799–9807 (2017). [DOI] [PMC free article] [PubMed] [Google Scholar]
- 6.Geibl F. F., Henrich M. T., Oertel W. H., Mesencephalic and extramesencephalic dopaminergic systems in Parkinson’s disease. J. Neural Transm. (Vienna) 126, 377–396 (2019). [DOI] [PubMed] [Google Scholar]
- 7.Kordower J. H., Chu Y., Hauser R. A., Freeman T. B., Olanow C. W., Lewy body-like pathology in long-term embryonic nigral transplants in Parkinson’s disease. Nat. Med. 14, 504–506 (2008). [DOI] [PubMed] [Google Scholar]
- 8.Goedert M., Alzheimer’s and Parkinson’s diseases: The prion concept in relation to assembled Aβ, tau, and α-synuclein. Science 349, 1255555 (2015). [DOI] [PubMed] [Google Scholar]
- 9.Luk K. C., Kehm V., Carroll J., Zhang B., O’Brien P., Trojanowski J. Q., Lee V.-M., Pathological α-synuclein transmission initiates Parkinson-like neurodegeneration in nontransgenic mice. Science 338, 949–953 (2012). [DOI] [PMC free article] [PubMed] [Google Scholar]
- 10.Masuda-Suzukake M., Nonaka T., Hosokawa M., Oikawa T., Arai T., Akiyama H., Mann D. M. A., Hasegawa M., Prion-like spreading of pathological α-synuclein in brain. Brain 136, 1128–1138 (2013). [DOI] [PMC free article] [PubMed] [Google Scholar]
- 11.Rey N. L., Petit G. H., Bousset L., Melki R., Brundin P., Transfer of human α-synuclein from the olfactory bulb to interconnected brain regions in mice. Acta Neuropathol. 126, 555–573 (2013). [DOI] [PMC free article] [PubMed] [Google Scholar]
- 12.Rey N. L., Steiner J. A., Maroof N., Luk K. C., Madaj Z., Trojanowski J. Q., Lee V. M.-Y., Brundin P., Widespread transneuronal propagation of α-synucleinopathy triggered in olfactory bulb mimics prodromal Parkinson’s disease. J. Exp. Med. 213, 1759–1778 (2016). [DOI] [PMC free article] [PubMed] [Google Scholar]
- 13.Holmqvist S., Chutna O., Bousset L., Aldrin-Kirk P., Li W., Björklund T., Wang Z.-Y., Roybon L., Melki R., Li J.-Y., Direct evidence of Parkinson pathology spread from the gastrointestinal tract to the brain in rats. Acta Neuropathol. 128, 805–820 (2014). [DOI] [PubMed] [Google Scholar]
- 14.Kim S., Kwon S.-H., Kam T.-I., Panicker N., Karuppagounder S. S., Lee S., Lee J. H., Kim W. R., Kook M., Foss C. A., Shen C., Lee H., Kulkarni S., Pasricha P. J., Lee G., Pomper M. G., Dawson V. L., Dawson T. M., Ko H. S., Transneuronal propagation of pathologic α-synuclein from the gut to the brain models Parkinson’s Disease. Neuron 103, 627–641.e7 (2019). [DOI] [PMC free article] [PubMed] [Google Scholar]
- 15.Okuzumi A., Kurosawa M., Hatano T., Takanashi M., Nojiri S., Fukuhara T., Yamanaka T., Miyazaki H., Yoshinaga S., Furukawa Y., Shimogori T., Hattori N., Nukina N., Rapid dissemination of alpha-synuclein seeds through neural circuits in an in-vivo prion-like seeding experiment. Acta Neuropathol. Commun. 6, 96 (2018). [DOI] [PMC free article] [PubMed] [Google Scholar]
- 16.Holmes B. B., De Vos S. L., Kfoury N., Li M., Jacks R., Yanamandra K., Ouidja M. O., Brodsky F. M., Marasa J., Bagchi D. P., Kotzbauer P. T., Miller T. M., Papy-Garcia D., Diamond M. I., Heparan sulfate proteoglycans mediate internalization and propagation of specific proteopathic seeds. Proc. Natl. Acad. Sci. U.S.A. 110, E3138–E3147 (2013). [DOI] [PMC free article] [PubMed] [Google Scholar]
- 17.Mao X., Ou M. T., Karuppagounder S. S., Kam T.-I., Yin X., Xiong Y., Ge P., Umanah G. E., Brahmachari S., Shin J.-H., Kang H. C., Zhang J., Xu J., Chen R., Park H., Andrabi S. A., Kang S. U., Gonçalves R. A., Liang Y., Zhang S., Qi C., Lam S., Keiler J. A., Tyson J., Kim D., Panicker N., Yun S. P., Workman C. J., Vignali D. A. A., Dawson V. L., Ko H. S., Dawson T. M., Pathological α-synuclein transmission initiated by binding lymphocyte-activation gene 3. Science 353, aah3374 (2016). [DOI] [PMC free article] [PubMed] [Google Scholar]
- 18.Shrivastava A. N., Redeker V., Fritz N., Pieri L., Almeida L. G., Spolidoro M., Liebmann T., Bousset L., Renner M., Léna C., Aperia A., Melki R., Triller A., α-Synuclein assemblies sequester neuronal α3-Na+/K+-ATPase and impair Na+ gradient. EMBO J. 34, 2408–2423 (2015). [DOI] [PMC free article] [PubMed] [Google Scholar]
- 19.Henderson M. X., Cornblath E. J., Darwich A., Zhang B., Brown H., Gathagan R. J., Sandler R. M., Bassett D. S., Trojanowski J. Q., Lee V. M. Y., Spread of α-synuclein pathology through the brain connectome is modulated by selective vulnerability and predicted by network analysis. Nat. Neurosci. 22, 1248–1257 (2019). [DOI] [PMC free article] [PubMed] [Google Scholar]
- 20.Mezias C., Rey N., Brundin P., Raj A., Neural connectivity predicts spreading of alpha-synuclein pathology in fibril-injected mouse models: Involvement of retrograde and anterograde axonal propagation. Neurobiol. Dis. 134, 104623 (2020). [DOI] [PMC free article] [PubMed] [Google Scholar]
- 21.Hirsch E. C., Graybiel A. M., Duyckaerts C., Javoy-Agid F., Neuronal loss in the pedunculopontine tegmental nucleus in Parkinson disease and in progressive supranuclear palsy. Proc. Natl. Acad. Sci. U.S.A. 84, 5976–5980 (1987). [DOI] [PMC free article] [PubMed] [Google Scholar]
- 22.Jellinger K., The pedunculopontine nucleus in Parkinson’s disease, progressive supranuclear palsy and Alzheimer’s disease. J. Neurol. Neurosurg. Psychiatry 51, 540–543 (1988). [DOI] [PMC free article] [PubMed] [Google Scholar]
- 23.Giguère N., Burke Nanni S., Trudeau L.-E., On cell loss and selective vulnerability of neuronal populations in Parkinson’s Disease. Front. Neurol. 9, 455 (2018). [DOI] [PMC free article] [PubMed] [Google Scholar]
- 24.Fujiwara H., Hasegawa M., Dohmae N., Kawashima A., Masliah E., Goldberg M. S., Shen J., Takio K., Iwatsubo T., α-Synuclein is phosphorylated in synucleinopathy lesions. Nat. Cell Biol. 4, 160–164 (2002). [DOI] [PubMed] [Google Scholar]
- 25.Anderson J. P., Walker D. E., Goldstein J. M., de Laat R., Banducci K., Caccavello R. J., Barbour R., Huang J., Kling K., Lee M., Diep L., Keim P. S., Shen X., Chataway T., Schlossmacher M. G., Seubert P., Schenk D., Sinha S., Gai W. P., Chilcote T. J., Phosphorylation of Ser-129 is the dominant pathological modification of α-synuclein in familial and sporadic Lewy body disease. J. Biol. Chem. 281, 29739–29752 (2006). [DOI] [PubMed] [Google Scholar]
- 26.Luquin E., Huerta I., Aymerich M. S., Mengual E., Stereological estimates of glutamatergic, GABAergic, and cholinergic neurons in the pedunculopontine and laterodorsal tegmental nuclei in the rat. Front. Neuroanat. 12, 34 (2018). [DOI] [PMC free article] [PubMed] [Google Scholar]
- 27.Kuusisto E., Salminen A., Alafuzoff I., Ubiquitin-binding protein p62 is present in neuronal and glial inclusions in human tauopathies and synucleinopathies. Neuroreport 12, 2085–2090 (2001). [DOI] [PubMed] [Google Scholar]
- 28.Richter-Landsberg C., Leyk J., Inclusion body formation, macroautophagy, and the role of HDAC6 in neurodegeneration. Acta Neuropathol. 126, 793–807 (2013). [DOI] [PubMed] [Google Scholar]
- 29.Mena-Segovia J., Micklem B. R., Nair-Roberts R. G., Ungless M. A., Bolam J. P., GABAergic neuron distribution in the pedunculopontine nucleus defines functional subterritories. J. Comp. Neurol. 515, 397–408 (2009). [DOI] [PubMed] [Google Scholar]
- 30.Karachi C., Grabli D., Bernard F. A., Tandé D., Wattiez N., Belaid H., Bardinet E., Prigent A., Nothacker H.-P., Hunot S., Hartmann A., Lehéricy S., Hirsch E. C., François C., Cholinergic mesencephalic neurons are involved in gait and postural disorders in Parkinson disease. J. Clin. Invest. 120, 2745–2754 (2010). [DOI] [PMC free article] [PubMed] [Google Scholar]
- 31.Grabli D., Karachi C., Folgoas E., Monfort M., Tande D., Clark S., Civelli O., Hirsch E. C., François C., Gait disorders in parkinsonian monkeys with pedunculopontine nucleus lesions: A tale of two systems. J. Neurosci. 33, 11986–11993 (2013). [DOI] [PMC free article] [PubMed] [Google Scholar]
- 32.George S., Rey N. L., Tyson T., Esquibel C., Meyerdirk L., Schulz E., Pierce S., Burmeister A. R., Madaj Z., Steiner J. A., Escobar Galvis M. L., Brundin L., Brundin P., Microglia affect α-synuclein cell-to-cell transfer in a mouse model of Parkinson’s disease. Mol. Neurodegener. 14, 34 (2019). [DOI] [PMC free article] [PubMed] [Google Scholar]
- 33.Henrich M. T., Geibl F. F., Lee B., Chiu W.-H., Koprich J. B., Brotchie J. M., Timmermann L., Decher N., Matschke L. A., Oertel W. H., A53T-α-synuclein overexpression in murine locus coeruleus induces Parkinson’s disease-like pathology in neurons and glia. Acta Neuropathol. Commun. 6, 39 (2018). [DOI] [PMC free article] [PubMed] [Google Scholar]
- 34.Roseberry T. K., Lee A. M., Lalive A. L., Wilbrecht L., Bonci A., Kreitzer A. C., Cell-type-specific control of brainstem locomotor circuits by basal ganglia. Cell 164, 526–537 (2016). [DOI] [PMC free article] [PubMed] [Google Scholar]
- 35.Caggiano V., Leiras R., Goñi-Erro H., Masini D., Bellardita C., Bouvier J., Caldeira V., Fisone G., Kiehn O., Midbrain circuits that set locomotor speed and gait selection. Nature 553, 455–460 (2018). [DOI] [PMC free article] [PubMed] [Google Scholar]
- 36.Kroeger D., Ferrari L. L., Petit G., Mahoney C. E., Fuller P. M., Arrigoni E., Scammell T. E., Cholinergic, glutamatergic, and GABAergic neurons of the pedunculopontine tegmental nucleus have distinct effects on sleep/wake behavior in mice. J. Neurosci. 37, 1352–1366 (2017). [DOI] [PMC free article] [PubMed] [Google Scholar]
- 37.Wickersham I. R., Lyon D. C., Barnard R. J. O., Mori T., Finke S., Conzelmann K.-K., Young J. A. T., Callaway E. M., Monosynaptic restriction of transsynaptic tracing from single, genetically targeted neurons. Neuron 53, 639–647 (2007). [DOI] [PMC free article] [PubMed] [Google Scholar]
- 38.Schwarz L. A., Miyamichi K., Gao X. J., Beier K. T., Weissbourd B., DeLoach K. E., Ren J., Ibanes S., Malenka R. C., Kremer E. J., Luo L., Viral-genetic tracing of the input-output organization of a central noradrenaline circuit. Nature 524, 88–92 (2015). [DOI] [PMC free article] [PubMed] [Google Scholar]
- 39.Beier K. T., Steinberg E. E., DeLoach K. E., Xie S., Miyamichi K., Schwarz L., Gao X. J., Kremer E. J., Malenka R. C., Luo L., Circuit architecture of VTA dopamine neurons revealed by systematic input-output mapping. Cell 162, 622–634 (2015). [DOI] [PMC free article] [PubMed] [Google Scholar]
- 40.Freundt E. C., Maynard N., Clancy E. K., Roy S., Bousset L., Sourigues Y., Covert M., Melki R., Kirkegaard K., Brahic M., Neuron-to-neuron transmission of α-synuclein fibrils through axonal transport. Ann. Neurol. 72, 517–524 (2012). [DOI] [PMC free article] [PubMed] [Google Scholar]
- 41.Oh S. W., Harris J. A., Ng L., Winslow B., Cain N., Mihalas S., Wang Q., Lau C., Kuan L., Henry A. M., Mortrud M. T., Ouellette B., Nguyen T. N., Sorensen S. A., Slaughterbeck C. R., Wakeman W., Li Y., Feng D., Ho A., Nicholas E., Hirokawa K. E., Bohn P., Joines K. M., Peng H., Hawrylycz M. J., Phillips J. W., Hohmann J. G., Wohnoutka P., Gerfen C. R., Koch C., Bernard A., Dang C., Jones A. R., Zeng H., A mesoscale connectome of the mouse brain. Nature 508, 207–214 (2014). [DOI] [PMC free article] [PubMed] [Google Scholar]
- 42.Mena-Segovia J., Bolam J. P., Rethinking the pedunculopontine nucleus: From cellular organization to function. Neuron 94, 7–18 (2017). [DOI] [PubMed] [Google Scholar]
- 43.Mena-Segovia J., Sims H. M., Magill P. J., Bolam J. P., Cholinergic brainstem neurons modulate cortical gamma activity during slow oscillations. J. Physiol. 586, 2947–2960 (2008). [DOI] [PMC free article] [PubMed] [Google Scholar]
- 44.Rey N. L., George S., Steiner J. A., Madaj Z., Luk K. C., Trojanowski J. Q., Lee V. M.-Y., Brundin P., Spread of aggregates after olfactory bulb injection of α-synuclein fibrils is associated with early neuronal loss and is reduced long term. Acta Neuropathol. 135, 65–83 (2018). [DOI] [PMC free article] [PubMed] [Google Scholar]
- 45.Osterberg V. R., Spinelli K. J., Weston L. J., Luk K. C., Woltjer R. L., Unni V. K., Progressive aggregation of alpha-synuclein and selective degeneration of lewy inclusion-bearing neurons in a mouse model of parkinsonism. Cell Rep. 10, 1252–1260 (2015). [DOI] [PMC free article] [PubMed] [Google Scholar]
- 46.Osakada F., Callaway E. M., Design and generation of recombinant rabies virus vectors. Nat. Protoc. 8, 1583–1601 (2013). [DOI] [PMC free article] [PubMed] [Google Scholar]
- 47.Hawkes C. H., Del Tredici K., Braak H., Parkinson’s disease: A dual-hit hypothesis. Neuropathol. Appl. Neurobiol. 33, 599–614 (2007). [DOI] [PMC free article] [PubMed] [Google Scholar]
- 48.Chu Y., Muller S., Tavares A., Barret O., Alagille D., Seibyl J., Tamagnan G., Marek K., Luk K. C., Trojanowski J. Q., Lee V. M. Y., Kordower J. H., Intrastriatal alpha-synuclein fibrils in monkeys: Spreading, imaging and neuropathological changes. Brain 142, 3565–3579 (2019). [DOI] [PMC free article] [PubMed] [Google Scholar]
- 49.Pienaar I. S., Elson J. L., Racca C., Nelson G., Turnbull D. M., Morris C. M., Mitochondrial abnormality associates with type-specific neuronal loss and cell morphology changes in the pedunculopontine nucleus in Parkinson disease. Am. J. Pathol. 183, 1826–1840 (2013). [DOI] [PMC free article] [PubMed] [Google Scholar]
- 50.Rinne J. O., Ma S. Y., Lee M. S., Collan Y., Röyttä M., Loss of cholinergic neurons in the pedunculopontine nucleus in Parkinson’s disease is related to disability of the patients. Parkinsonism Relat. Disord. 14, 553–557 (2008). [DOI] [PubMed] [Google Scholar]
- 51.Gai W. P., Halliday G. M., Blumbergs P. C., Geffen L. B., Blessing W. W., Substance P-containing neurons in the mesopontine tegmentum are severely affected in Parkinson’s disease. Brain 114, 2253–2267 (1991). [DOI] [PubMed] [Google Scholar]
- 52.Tubert C., Galtieri D., Surmeier D. J., The pedunclopontine nucleus and Parkinson’s disease. Neurobiol. Dis. 128, 3–8 (2019). [DOI] [PMC free article] [PubMed] [Google Scholar]
- 53.Burré J., Sharma M., Südhof T. C., Cell biology and pathophysiology of α-synuclein. Cold Spring Harb. Perspect. Med. 8, a024091 (2018). [DOI] [PMC free article] [PubMed] [Google Scholar]
- 54.Pacelli C., Giguère N., Bourque M. J., Lévesque M., Slack R. S., Trudeau L.-É., Elevated mitochondrial bioenergetics and axonal arborization size are key contributors to the vulnerability of dopamine neurons. Curr. Biol. 25, 2349–2360 (2015). [DOI] [PubMed] [Google Scholar]
- 55.Xiang W., Schlachetzki J. C. M., Helling S., Bussmann J. C., Berlinghof M., Schäffer T. E., Marcus K., Winkler J., Klucken J., Becker C.-M., Oxidative stress-induced posttranslational modifications of alpha-synuclein: Specific modification of alpha-synuclein by 4-hydroxy-2-nonenal increases dopaminergic toxicity. Mol. Cell. Neurosci. 54, 71–83 (2013). [DOI] [PubMed] [Google Scholar]
- 56.Musgrove R. E., Helwig M., Bae E.-J., Aboutalebi H., Lee S.-J., Ulusoy A., Di Monte D. A., Oxidative stress in vagal neurons promotes parkinsonian pathology and intercellular α-synuclein transfer. J. Clin. Invest. 129, 3738–3753 (2019). [DOI] [PMC free article] [PubMed] [Google Scholar]
- 57.Michel P. P., Hirsch E. C., Hunot S., Understanding dopaminergic cell death pathways in Parkinson disease. Neuron 90, 675–691 (2016). [DOI] [PubMed] [Google Scholar]
- 58.Lautenschläger J., Stephens A. D., Fusco G., Ströhl F., Curry N., Zacharopoulou M., Michel C. H., Laine R., Nespovitaya N., Fantham M., Pinotsi D., Zago W., Fraser P., Tandon A., St. George-Hyslop P., Rees E., Phillips J. J., De Simone A., Kaminski C. F., Schierle G. S. K., C-terminal calcium binding of α-synuclein modulates synaptic vesicle interaction. Nat. Commun. 9, 712 (2018). [DOI] [PMC free article] [PubMed] [Google Scholar]
- 59.Berridge M. J., Bootman M. D., Roderick H. L., Calcium signalling: Dynamics, homeostasis and remodelling. Nat. Rev. Mol. Cell Biol. 4, 517–529 (2003). [DOI] [PubMed] [Google Scholar]
- 60.Martinez-Gonzalez C., Wang H.-L., Micklem B. R., Bolam J. P., Mena-Segovia J., Subpopulations of cholinergic, GABAergic and glutamatergic neurons in the pedunculopontine nucleus contain calcium-binding proteins and are heterogeneously distributed. Eur. J. Neurosci. 35, 723–734 (2012). [DOI] [PubMed] [Google Scholar]
- 61.Takakusaki K., Kitai S. T., Ionic mechanisms involved in the spontaneous firing of tegmental pedunculopontine nucleus neurons of the rat. Neuroscience 78, 771–794 (1997). [DOI] [PubMed] [Google Scholar]
- 62.Volpicelli-Daley L. A., Luk K. C., Patel T. P., Tanik S. A., Riddle D. M., Stieber A., Meaney D. F., Trojanowski J. Q., Lee V. M.-Y., Exogenous α-synuclein fibrils induce Lewy body pathology leading to synaptic dysfunction and neuron death. Neuron 72, 57–71 (2011). [DOI] [PMC free article] [PubMed] [Google Scholar]
- 63.Xu Y., Deng Y., Qing H., The phosphorylation of α-synuclein: Development and implication for the mechanism and therapy of the Parkinson’s disease. J. Neurochem. 135, 4–18 (2015). [DOI] [PubMed] [Google Scholar]
- 64.Ugolini G., Advances in viral transneuronal tracing. J. Neurosci. Methods 194, 2–20 (2010). [DOI] [PubMed] [Google Scholar]
- 65.Choi J., Callaway E. M., Monosynaptic inputs to ErbB4-expressing inhibitory neurons in mouse primary somatosensory cortex. J. Comp. Neurol. 519, 3402–3414 (2011). [DOI] [PMC free article] [PubMed] [Google Scholar]
- 66.Burtscher J., Copin J.-C., Rodrigues J., Kumar S. T., Chiki A., Guillot de Suduiraut I., Sandi C., Lashuel H. A., Chronic corticosterone aggravates behavioral and neuronal symptomatology in a mouse model of alpha-synuclein pathology. Neurobiol. Aging 83, 11–20 (2019). [DOI] [PubMed] [Google Scholar]
- 67.Stefanis L., Emmanouilidou E., Pantazopoulou M., Kirik D., Vekrellis K., Tofaris G. K., How is alpha-synuclein cleared from the cell? J. Neurochem. 150, 577–590 (2019). [DOI] [PubMed] [Google Scholar]
- 68.Recasens A., Dehay B., Bové J., Carballo-Carbajal I., Dovero S., Pérez-Villalba A., Fernagut P.-O., Blesa J., Parent A., Perier C., Fariñas I., Obeso J. A., Bezard E., Vila M., Lewy body extracts from Parkinson disease brains trigger α-synuclein pathology and neurodegeneration in mice and monkeys. Ann. Neurol. 75, 351–362 (2014). [DOI] [PubMed] [Google Scholar]
- 69.Strohäker T., Jung B. C., Liou S.-H., Fernandez C. O., Riedel D., Becker S., Halliday G. M., Bennati M., Kim W. S., Lee S.-J., Zweckstetter M., Structural heterogeneity of α-synuclein fibrils amplified from patient brain extracts. Nat. Commun. 10, 5535 (2019). [DOI] [PMC free article] [PubMed] [Google Scholar]
- 70.Shahmoradian S. H., Lewis A. J., Genoud C., Hench J., Moors T. E., Navarro P. P., Castaño-Díez D., Schweighauser G., Graff-Meyer A., Goldie K. N., Sütterlin R., Huisman E., Ingrassia A., de Gier Y., Rozemuller A. J. M., Wang J., De Paepe A., Erny J., Staempfli A., Hoernschemeyer J., Großerüschkamp F., Niedieker D., El-Mashtoly S. F., Quadri M., Van IJcken W. F. J., Bonifati V., Gerwert K., Bohrmann B., Frank S., Britschgi M., Stahlberg H., Van de Berg W. D. J., Lauer M. E., Lewy pathology in Parkinson’s disease consists of crowded organelles and lipid membranes. Nat. Neurosci. 22, 1099–1109 (2019). [DOI] [PubMed] [Google Scholar]
- 71.Prusiner S. B., Woerman A. L., Mordes D. A., Watts J. C., Rampersaud R., Berry D. B., Patel S., Oehler A., Lowe J. K., Kravitz S. N., Geschwind D. H., Glidden D. V., Halliday G. M., Middleton L. T., Gentleman S. M., Grinberg L. T., Giles K., Evidence for α-synuclein prions causing multiple system atrophy in humans with parkinsonism. Proc. Natl. Acad. Sci. U.S.A. 112, E5308–E5317 (2015). [DOI] [PMC free article] [PubMed] [Google Scholar]
- 72.Peelaerts W., Bousset L., Van der Perren A., Moskalyuk A., Pulizzi R., Giugliano M., Van den Haute C., Melki R., Baekelandt V., α-Synuclein strains cause distinct synucleinopathies after local and systemic administration. Nature 522, 340–344 (2015). [DOI] [PubMed] [Google Scholar]
- 73.Bae E.-J., Kim D.-K., Kim C., Mante M., Adame A., Rockenstein E., Ulusoy A., Klinkenberg M., Jeong G. R., Bae J. R., Lee C., Lee H.-J., Lee B.-D., Di Monte D. A., Masliah E., Lee S.-J., LRRK2 kinase regulates α-synuclein propagation via RAB35 phosphorylation. Nat. Commun. 9, 3465 (2018). [DOI] [PMC free article] [PubMed] [Google Scholar]
- 74.Mahul-Mellier A.-L., Burtscher J., Maharjan N., Weerens L., Croisier M., Kuttler F., Leleu M., Knott G. W., Lashuel H. A., The process of Lewy body formation, rather than simply α-synuclein fibrillization, is one of the major drivers of neurodegeneration. Proc. Natl. Acad. Sci. U.S.A. 117, 4971–4982 (2020). [DOI] [PMC free article] [PubMed] [Google Scholar]
- 75.Birol M., Wojcik S. P., Miranker A. D., Rhoades E., Identification of N-linked glycans as specific mediators of neuronal uptake of acetylated α-synuclein. PLOS Biol. 17, e3000318 (2019). [DOI] [PMC free article] [PubMed] [Google Scholar]
- 76.Yamada K., Iwatsubo T., Extracellular α-synuclein levels are regulated by neuronal activity. Mol. Neurodegener. 13, 9 (2018). [DOI] [PMC free article] [PubMed] [Google Scholar]
- 77.Burré J., Sharma M., Südhof T. C., Definition of a molecular pathway mediating α-synuclein neurotoxicity. J. Neurosci. 35, 5221–5232 (2015). [DOI] [PMC free article] [PubMed] [Google Scholar]
- 78.Kam T.-I., Mao X., Park H., Chou S.-C., Karuppagounder S. S., Umanah G. E., Yun S. P., Brahmachari S., Panicker N., Chen R., Andrabi S. A., Qi C., Poirier G. G., Pletnikova O., Troncoso J. C., Bekris L. M., Leverenz J. B., Pantelyat A., Ko H. S., Rosenthal L. S., Dawson T. M., Dawson V. L., Poly(ADP-ribose) drives pathologic α-synuclein neurodegeneration in Parkinson’s disease. Science 362, eaat8407 (2018). [DOI] [PMC free article] [PubMed] [Google Scholar]
- 79.Schindelin J., Arganda-Carreras I., Frise E., Kaynig V., Longair M., Pietzsch T., Preibisch S., Rueden C., Saalfeld S., Schmid B., Tinevez J.-Y., White D. J., Hartenstein V., Eliceiri K., Tomancak P., Cardona A., Fiji: An open-source platform for biological-image analysis. Nat. Methods 9, 676–682 (2012). [DOI] [PMC free article] [PubMed] [Google Scholar]
Associated Data
This section collects any data citations, data availability statements, or supplementary materials included in this article.
Supplementary Materials
Supplementary material for this article is available at http://advances.sciencemag.org/cgi/content/full/6/46/eabc2487/DC1