Abstract
Purpose:
To investigate the diagnostic accuracy and clinical usefulness of the rim sign in breast lesions observed in diffusion-weighted magnetic resonance imaging (DWI).
Materials and methods:
The magnetic resonance imaging (MRI) findings of 98 pathologically confirmed lesions (62 malignant and 36 benign) in 84 patients were included. Five breast radiologists were asked to independently review the breast MRI results, to grade the degree of high peripheral signal, the “rim sign”, in the DWI, and to confirm the mean apparent diffusion coefficient (ADCmean) values. We analyzed the diagnostic accuracy and compared the consensus (when ≥ 4 of 5 independent reviewers agreed) results of the rim sign with the ADCmean values. Additionally, we evaluated the correlation between the DCE-MRI morphologic appearance and DWI rim sign.
Results:
According to the consensus results, the rim sign in DWI was observed on 59.7% of malignant lesions and 19.4% of benign lesions. The sensitivity, specificity, and area under the curve (AUC) value for the rim sign in DWI were 59.7%, 80.6%, and 0.701, respectively. The sensitivity, specificity, and AUC value for the ADCmean value (criteria ≤ 1.46 × 10⁻³ mm2/sec) were 82.3%, 63.9%, and 0.731, respectively. Based on consensus, no correlation was observed between the DCE-MRI and DWI rim signs.
Conclusion:
In DWI, a high-signal rim is a valuable morphological feature for improving specificity in DWI.
Keywords: breast cancer, magnetic resonance imaging, diffusion-weighted image
INTRODUCTION
Dynamic contrast-enhanced magnetic resonance imaging (DCE-MRI) is a sensitive tool to detect breast cancer; it has a reported sensitivity that can reach 94–100% (1). The ability of DCE-MRI to provide high-resolution morphological imaging along with information about contrast enhancement characteristics has widely demonstrated diagnostic value in breast imaging (2–4). However, the specificity of DCE-MRI varies between 37% and 99.7% (1). For example, a rim sign on DCE is strongly correlated with malignancy, and rim enhancement on DCE-MRI is reported to be associated with a poor prognosis (5).
Diffusion-weighted MRI (DWI) is an unenhanced MRI sequence that has recently been integrated into breast MRI as an adjunct to DCE-MRI to discriminate between benign and malignant breast lesions (5–9). Several DWI studies have reported significantly lower apparent diffusion coefficient (ADC) values in malignant tumors than in normal tissues, and the ADC value is correlated with prognostic factors for breast cancer (5,6,10). The low ADC value is known to be related to positive estrogen receptor and progesterone receptor expression, an increased Ki-67 index, and increased microvascular density of breast cancer (5,6).
While DWI studies have shown promising results, the inherent limitations of DWI acquisitions complicate the ability to consistently acquire high-quality diffusion-weighted images. Most notably, the necessary motion sensitivity of the DWI sequences also makes them susceptible to severe artifacts from bulk motion. Furthermore, single-shot Echo Planar Imaging (EPI), which is the most commonly utilized sequence for DWI, mitigates bulk motion artifacts, but in doing so, it limits the available resolution and introduces potential artifacts and distortions due to B0 inhomogeneity, gradient eddy currents, and other effects. This greatly reduced resolution, particularly compared to DCE-MRI, has limited the ability to utilize morphological information from diffusion-weighted images. Existing studies have not investigated breast cancer morphologic features in DWI (5–9,11). Instead, these studies have only emphasized signal intensity and overall lesion ADC value. However, we have observed that even with this reduced resolution, certain morphological features are discernible in DWI, although their diagnostic utility has not been widely investigated.
In this study, we focused on the morphological features of the rim sign in DWI. This feature in DCE-MRI is a relatively specific sign of cancer (3,9,12–14). Because the diagnostic results of rim enhancement in DCE-MRI vary depending on the presence of a smooth or spiculated margins and an early or delayed rim-enhancement pattern, the reported frequency of peripheral ring-like enhancement ranges widely from 15.9%–65% (3,13–19). We hypothesized that the rim sign would be associated with cancer in DWI. If diagnostically applicable, the rim sign could be useful in those cases in which only unenhanced MRI is possible or to add specificity to DWI.
The purpose of this study was to determine whether the rim sign occurs in DWI and to determine its diagnostic accuracy for breast cancer.
MATERIALS AND METHODS
Patient Population
This study was performed in accordance with the regulations of the institutional review board at our hospital, which approved this retrospective study and waived the requirement for informed patient consent. Of the 241 patients who underwent breast MRI between February 2009 and June 2011, 33 did not undergo DWI, 19 underwent neoadjuvant chemotherapy, 9 were scanned with a different imaging protocol, and 1 underwent bilateral mastectomy. These patients were therefore excluded, yielding 179 potential subjects. Among these 179 women, 95 did not have pathologic confirmation of the imaging findings available, and they were also excluded. Therefore, we enrolled 84 patients with 98 lesions. The mean patient age was 47.4 ± 11.9 years (range, 20–74 years). The mean maximal length of the lesions was 2.2 ± 1.6 cm (range, 0.5–7.1 cm). MRI examinations were performed for known cancer staging in 62 patients, to evaluate lesions that were diagnostically unclear on mammography or sonography in 14 patients, for high-risk screening in 6 patients, and for therapy surveillance in 2 patients. The confirmed pathology of the 98 lesions is described in Table 1.
Table 1.
The ADCmean value and consensus results of the rim sign in DWI, the rim sign in DCE-MRI, and high SI in T2WI of 98 lesions in 84 patients based on the pathology and lesion size.
| No. | ADCmean value (× 10−3 mm2/sec) | Consensus* |
|||
|---|---|---|---|---|---|
| Rim in DWI | Rim in DCE- MRI | High SI in T2WI | |||
| Mean ± SD | No. (%) | No. (%) | No. (%) | ||
| Total | 98 | 1.36 ± 0.59 | 44.0 (44.9) | 28.0 (28.6) | 27.0 (27.6) |
| Malignant# | 62 | 1.17 ± 0.38 | 37.0 (59.7) | 17.0 (27.4) | 17.0 (27.4) |
| IDC | 44 | 1.07 ± 0.35 | 28.0 (63.6) | 16.0 (36.4) | 15.0 (34.1) |
| DCIS | 10 | 1.48 ± 0.35 | 7.0 (70) | 1.0 (10) | 1.0 (10) |
| ILC | 6 | 1.38 ± 0.27 | 1.0 (16.7) | 0.0 (0) | 1.0 (16.7) |
| Tubular ca | 1 | 1.16 | 1.0 (100) | 0.0 (0) | 0.0 (0) |
| Paget | 1 | 1.30 | 0.0 (0) | 0.0 (0) | 0.0 (0) |
| Non-Malignant | 36 | 1.68 ± 0.63 | 7.0 (19.4) | 11.0 (30.6) | 10.0 (27.8) |
| High-risk£ | 7 | 1.59 ± 0.68 | 3.0 (42.9) | 2.0 (28.6) | 3.0 (42.9) |
| Benign≠ | 29 | 1.70 ± 0.60 | 4.0 (13.8) | 9.0 (31) | 7.0 (24.1) |
| ≤ 1 cm | 18 | 1.41 ± 0.60 | 6 (33.3) | 6 (33.3) | 3 (16.7) |
| ≤ 2 cm | 40 | 1.32 ± 0.45 | 18 (45) | 9 (22.5) | 10 (25) |
| > 2 cm | 40 | 1.37 ± 0.59 | 20 (50) | 13 (32.5) | 14 (35) |
Image Acquisition
All images were acquired in the axial plane on a 3.0 Tesla GE MR 750 scanner (Discovery; GE Medical Systems, Milwaukee, WI, U.S.A) with an 8-channel GE HD phased array dedicated breast coil. The breast MRI protocol included the following acquisitions: T2-weighted Fast Relaxation Fast Spin-Echo (FRFSE) with IDEAL for fat suppression with 4 mm slice thickness, matrix size 320 × 256, ETL 16, and a 6-minute scan time; DWI using the water-selective Echo-Planar Imaging (EPI) technique, water-selective spectro-spatial excitation, parallel imaging with 4-fold acceleration in the right-left direction (ASSET factor 4), b = 0 and b = 600 images with 2 and 8 signal averages (NEX) respectively, 5 mm slice thickness, matrix size 128 × 128; and DCE acquisition with multiphase high-resolution centric-encoded 3D spoiled gradient-echo T1-weighted images with view sharing and a simultaneous bolus IV injection of gadolinium-based contrast agent (0.1 mmol/kg).
DWI Rim Sign Grading Scheme
The rim signs were graded according to a standardized 5-point scheme: Lesions with a complete thick rim were graded “5”. Lesions with, a complete thin rim were graded “4”. Lesions with an incomplete thick rim were graded “3”. Lesions with an incomplete thin rim were graded “2” (Figure 1). A complete rim was defined as a surrounding line outlining ≥ 90% of the lesion (Figure 2). An incomplete rim was defined as outlining < 90% of the mass. A thick rim was defined as >3 mm and when most of the mass showed high signal intensity and left a central non-enhanced area, similar to a donut (Figure 2). A thin rim was defined as ≤3 mm, with only the outermost margin of the mass showing a high signal on DWI. Lesions with a unclear, indefinite, or unobserved rim on DWI was classified as no rim sign and graded “1” (Figure 3).
Figure 1.

A diagram of the rim sign in diffusion-weighted imaging (DWI).
Figure 2.
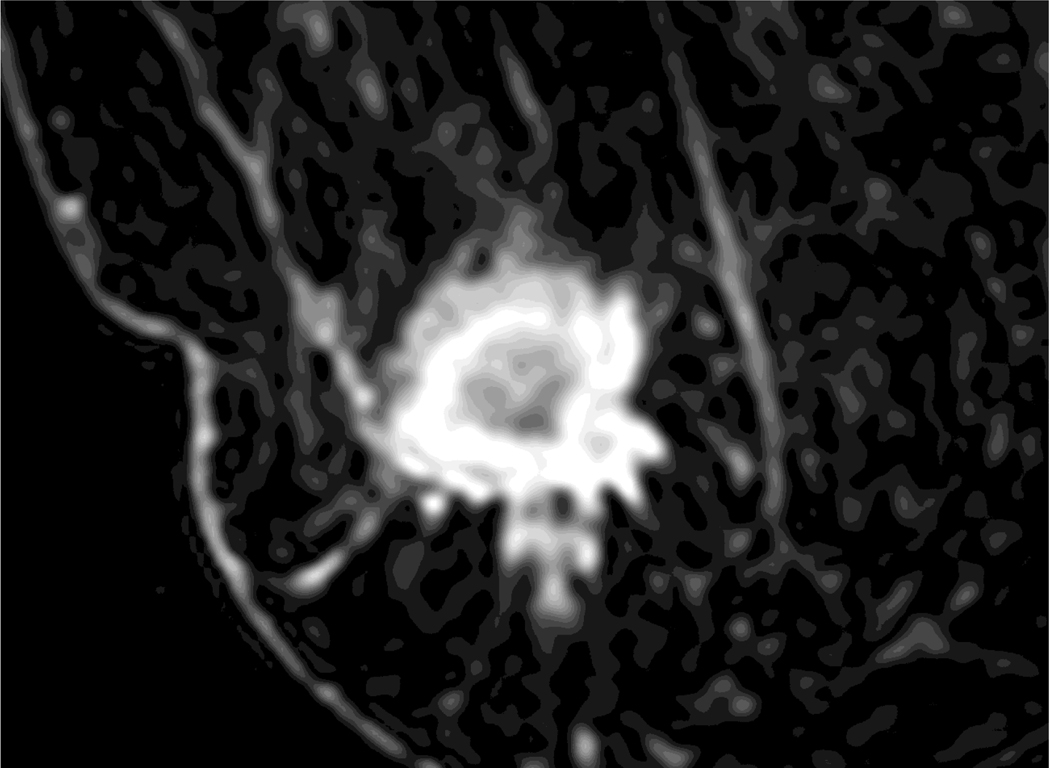
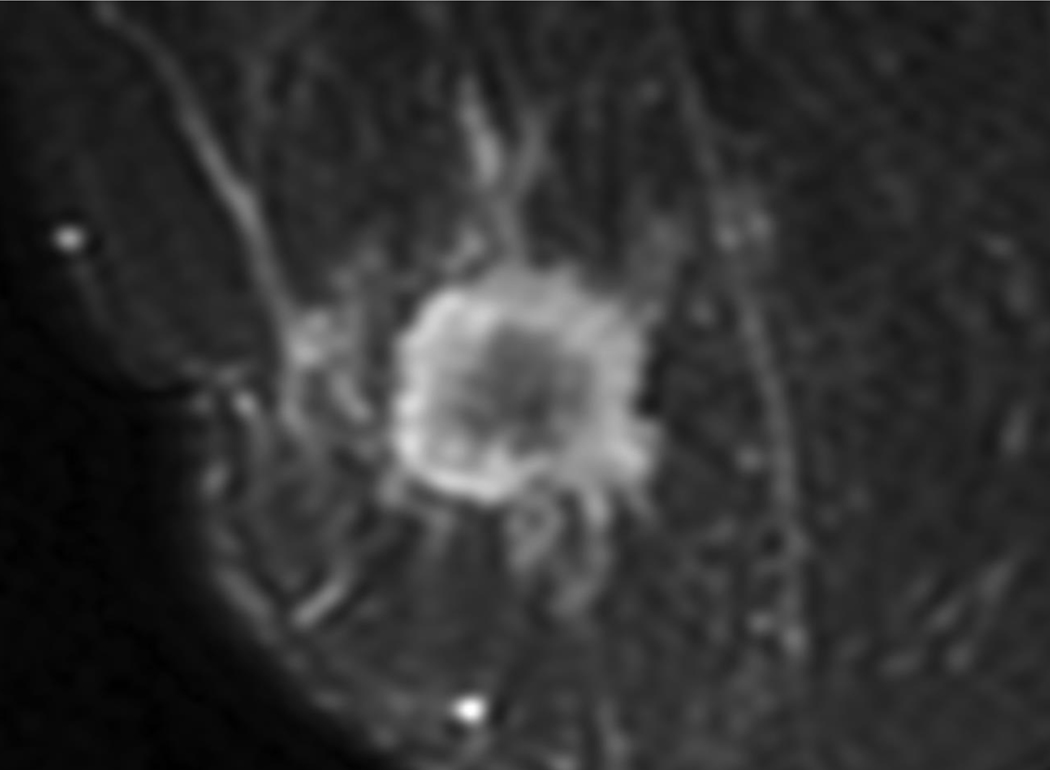
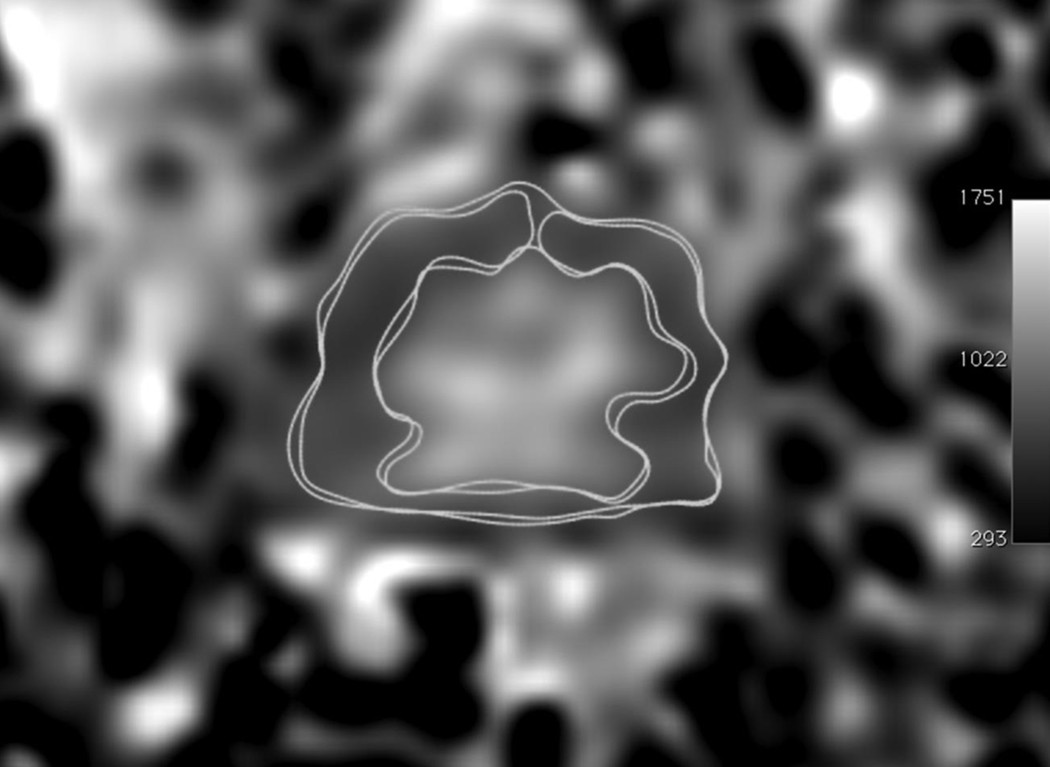
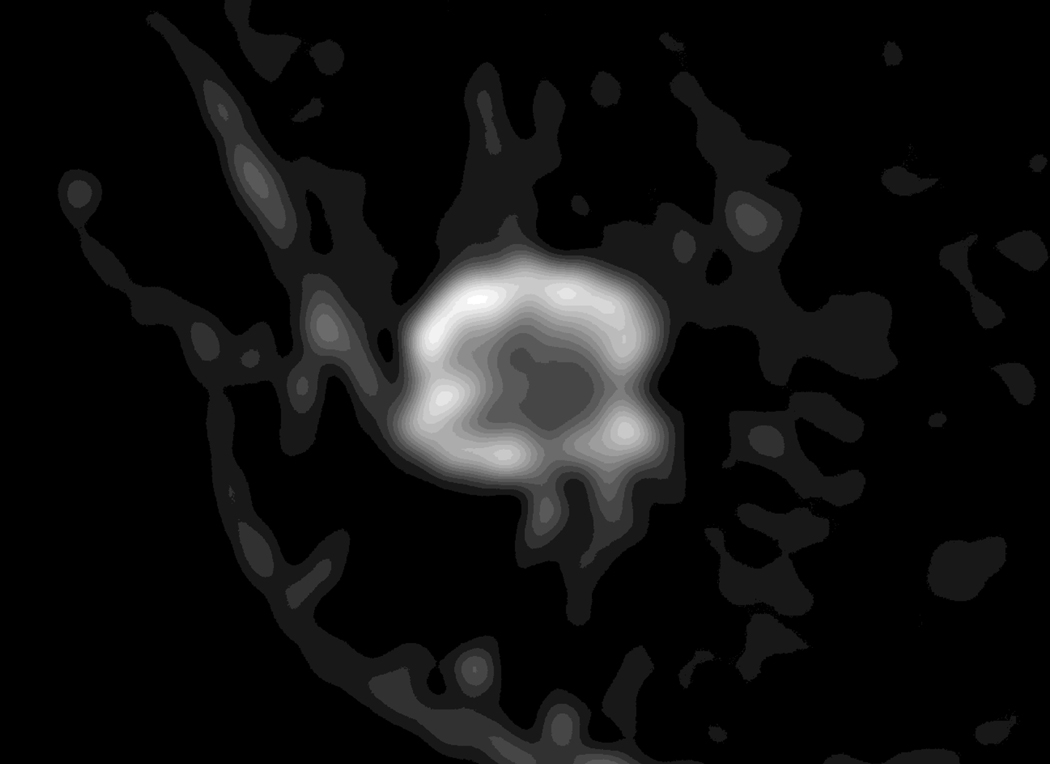
A 35-year-old woman with 2.3 cm invasive ductal cancer in the right breast.
A. Post-contrast-enhanced image showing typical rim enhancement described as BI-RADS category 5.
B. A T2-weighted image showing high signal intensity of the rim area.
C. The ADC map shows the ROI of the whole lesion, the rim, and the area excluding the rim.
D. Diffusion-weighted image showing a typical complete thick rim surrounding the breast mass.
Figure 3.
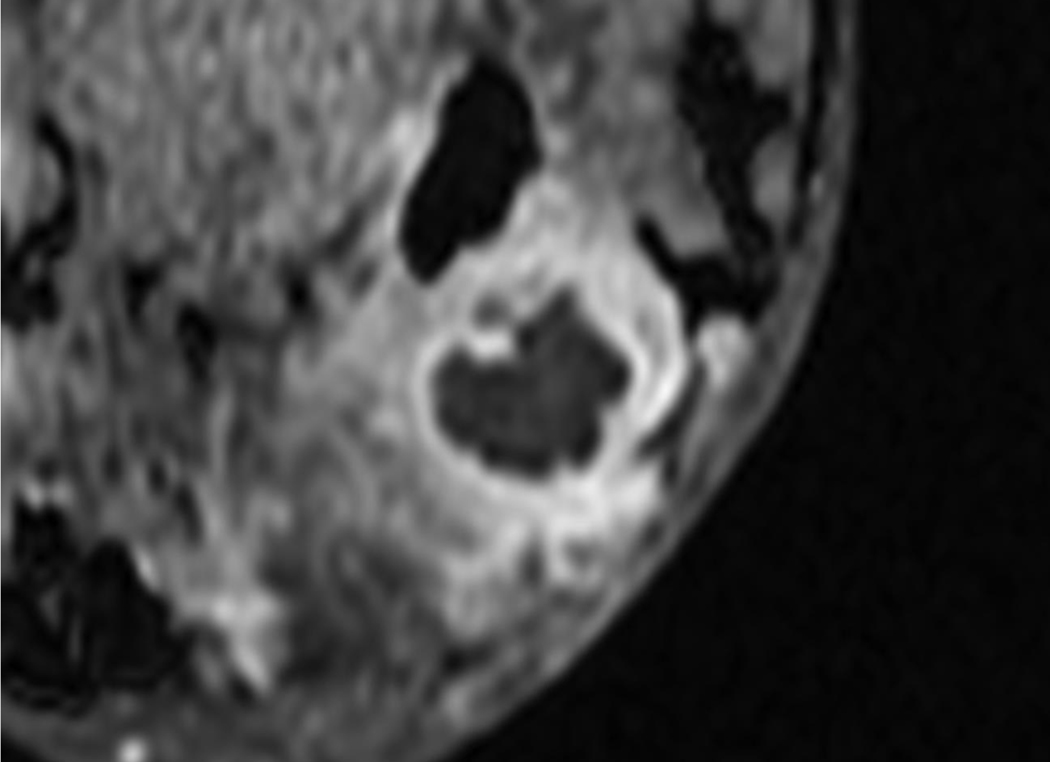
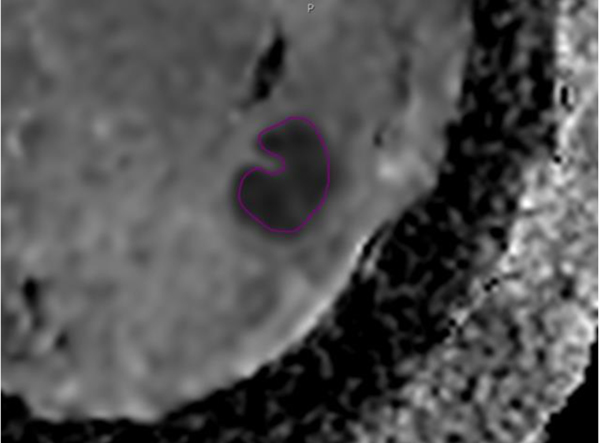
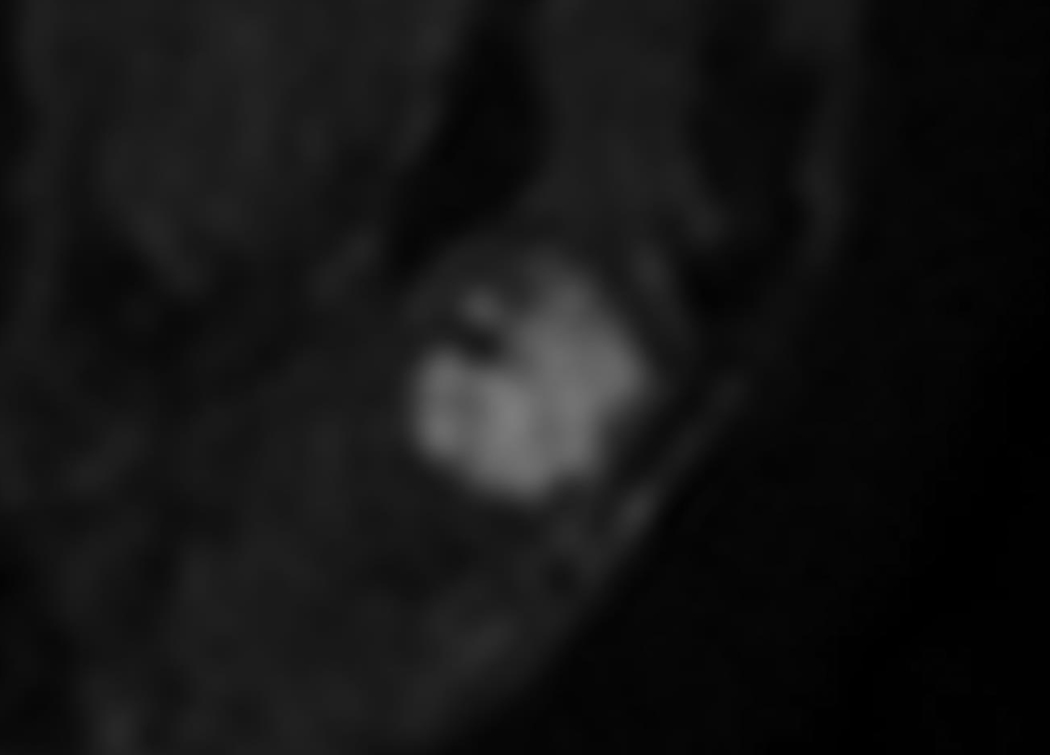
A 62-year-old woman with a 2.4 cm abscess in the right breast.
A. Post-contrast-enhanced image showing thick rim enhancement, but subtle enhancement revealed BI-RADS category 4a.
B. The ADC map shows the ROI of the whole lesion.
C. Diffusion-weighted image showing the definite absence of a rim
Image Analysis
One breast radiologist (with 12 years of experience) reviewed the routine breast MRIs, including T2-weighted and T1-weighted pre- and post-contrast images, DWI, and ADC maps, to identify all pathologically proven lesions. A region of interest (ROI) around each lesion was manually drawn, and the ADCmean value of each ROI was measured. After training on the grading scheme for the DWI rim sign and rim grading (Figure 1), 5 (BJK, JAL, DMI, JK, and SP) fellowship-trained breast radiologists (with 8–23 years of breast MRI experience) independently reviewed the breast MRIs to describe the rim sign in the DWI and also to confirm the ADC value on the ADC map. When they confirmed the ADC value, the location and size of the ROI was changed if they wanted to change the ROI of the ADC map. Additionally, they separately reviewed the rim signs from the DCE-MRI and the high-signal rims on T2-weighted images.
We analyzed the ADCmean value and the rim sign based on benign versus malignant lesions and based on the lesion size. We analyzed the rim grading and the diagnostic accuracy of the individual reviewers. The consensus results of rim sign were compared with the ADCmean values. We defined a “consensus” result as having agreement among ≥ 4 of the 5 independent reviewers.
We also analyzed the correlation between the DWI and DCE-MRI rim signs and between the DWI rim signs and the high-signal rims on T2-weighted images. Finally, we compared the ADCmean values of the lesions with rim signs and the lesions without rim signs for all reviewers. In a patient subset (n = 44) with a consensus of rim sign in DWI, the ROIs of the whole lesion, the rim signal area, and the area excluding the rim signal were drawn, and the ADCmean values were measured by 1 radiologist (Figure 2 C). We also compared the ADCmean values of the whole lesion, the rim signal area, and the central area excluding the rim signal.
Statistical Analyses
The ADCmean values were compared for benign, high-risk, and malignant lesions using Student’s t-test. Receiver operating characteristic (ROC) curves were used to determine the optimal ADCmean thresholds for discriminating between benign and malignant lesions. The area under the ROC curve (AUC), sensitivity, and specificity were calculated for the DWI rim sign based on the individual reviewers and consensus result and compared with those results of the mean of ADCmean value to assess diagnostic performance (20).
McNemar’s test of proportions was used to compare the rim signs between CE-MRI and DWI and between the DWI rim signs and the high-signal rims on T2-weighted images. P < 0.05 was considered significant.
The ADCmean values of the lesions with rim signs and the lesions without rim signs for all reviewers were compared using Student’s t-test. Additionally, the ADCmean values of the whole lesion, the rim signal area, and the area excluding the rim signal were compared using Student’s t-test.
MedCalc version 10.4.0.0 (MedCalc Software, Mariakerke, Belgium) was used for the statistical and ROC analyses.
RESULTS
As described in Table 1, the mean ADCmean value of the 62 malignant lesions (1.17 ± 0.38 × 10⁻³ mm2/sec) was significantly lower than that of 36 non-malignant lesions (1.68 ± 0.63 × 10⁻³ mm2/sec) (P < 0.05). According to the consensus results, the rim sign (grade 2 or higher) in DWI was observed on 59.7% of malignant lesions and 19.4% of non-malignant lesions.
Based on the individual reviewers and pathology, the mean number of each rim was described as shown in table 2. In malignant lesions, grade 4 (complete thin rim) (36.5%) was the most frequent. In non-malignant lesions, grade 1 (no rim) (66.7%) was the most frequent.
Table 2.
Comparison of the mean number of each rim grade recorded based on the individual reviewers and pathology.
| No. | Grade 1 | Grade 2 | Grade 3 | Grade 4 | Grade 5 | |
|---|---|---|---|---|---|---|
| Mean No. (%) | No rim | Incomplete thin | Incomplete thick | Complete thin | Complete thick | |
| Total | 98 | 41.6 (42.4) | 14 (14.2) | 3.2 (3.3) | 28.6 (29.2) | 10.6 (10.8) |
| Malignant# | 62 | 17.6 (28.4) | 10.2 (16.5) | 2.8 (4.5) | 22.6 (36.5) | 8.8 (14.2) |
| IDC | 44 | 10.6 (24.1) | 6.8 (15.5) | 1.8 (4.1) | 16.8 (38.2) | 8 (18.2) |
| DCIS | 10 | 3 (30) | 2.4 (24) | 1 (10) | 2.8 (28) | 0.8 (8) |
| ILC | 6 | 3.4 (56.7) | 0.8 (13.3) | 0 | 1.8 (30) | 0 |
| Tubular ca | 1 | 0 | 0 | 0 | 1 (100) | 0 |
| Paget | 1 | 1 (100) | 0 | 0 | 0 | 0 |
| Non-Malignant | 36 | 24 (66.7) | 3.8 (10.6) | 0.4 (1.1) | 6 (16.7) | 1.8 (5) |
| High-risk£ | 7 | 4 (57.1) | 0.8 (11.4) | 0 (0) | 1.8 (25.7) | 0.4 (5.7) |
| Benign≠ | 29 | 20 (69) | 3 (10.3) | 0.4 (1.4) | 4.2 (14.5) | 1.4 (4.8) |
According to the individual reviewers, the ranges of the sensitivity, specificity, and AUC values for the rim sign in DWI were 54.8~82.3%, 47.2~83.3%, and 0.647~0.820, respectively. According to the consensus of ≥ 4 of the 5 reviewers, the sensitivity, specificity, and AUC values for the rim sign in DWI were 59.7%, 80.6%, and 0.701, respectively. The sensitivity, specificity, and AUC values for the ADCmean value (criteria ≤ 1.46 × 10⁻³ mm2/sec) were 82.3%, 63.9%, and 0.731, respectively (Table 3).
Table 3.
Comparison of the AUC, sensitivity, and specificity according to the rim sign and ADCmean values.
| AUC | Sensitivity# | Specificity# | ||
|---|---|---|---|---|
| Consensus* | Rim Sign | 0.701 | 59.7 | 80.6 |
| ADCmean (criteria ≤ 1.46) | 0.731 | 82.3 | 63.9 | |
| Range of 5 reviewers’ | Rim Sign | 0.647–0.820 | 54.8–82.3 | 47.2–83.3 |
| ADCmean (criteria ≤ 1.41–1.50) | 0.733–0.752 | 83.9–88.7 | 58.3–63.9 | |
Consensus means the agreement of ≥ 4 of the 5 reviewers
Sensitivity and specificity criteria of the rim sign containing complete thick, complete thin, incomplete thick, and incomplete thin rims
As described in table 1, the frequency of the rim sign in DCE-MRI and the high-signal rim in T2-weighted imaging was lower than the rim sign in DWI. The rim sign in DWI was more often observed on invasive ductal cancer and ductal carcinoma in situ than invasive lobular cancer (63.6% and 70% vs. 16.7%). Moreover, larger tumors demonstrated more prominent rim signs in DWI.
Based on consensus, no correlation was observed between the DCE-MRI and DWI rim signs using McNemar’s test of proportions (p=0.0177). Additionally, no correlation was observed between the DWI rim signs and the high-signal rims in T2-weighted imaging using McNemar’s test of proportions (p=0.0125).
The ADCmean values of the lesions with rim signs were lower than those without rim signs according to all reviewers (P value=0.0566 ~ < 0.0001) (Figure 4). The ADCmean value of the rim signal area was lower than the area excluding the rim signal for the malignant lesions with rim signs, but it was not significantly different (P = 0.1379) (Figure 5).
Figure 4.
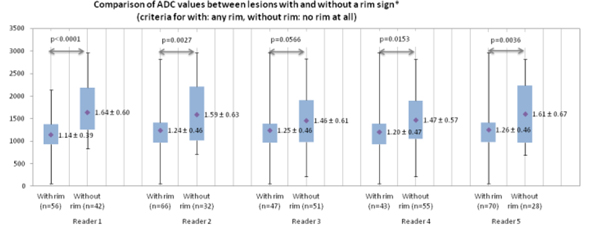
The graph shows the mean apparent diffusion coefficient (ADCmean) values for the lesions with and without a rim sign in diffusion-weighted imaging (DWI).
Figure 5.
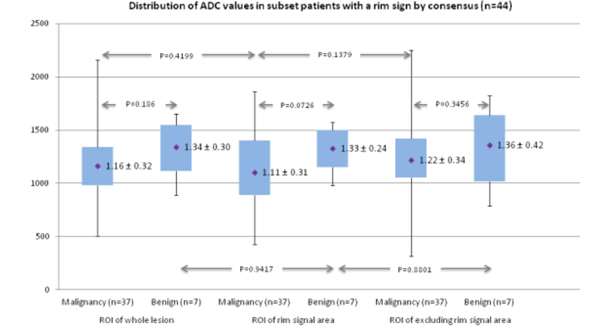
The graph shows the distribution of the mean apparent diffusion coefficient (ADCmean) values of the whole lesion, the rim signal area, and the area excluding the rim signal in a subset of patients (n = 44) with a rim sign by consensus.
DISCUSSION
DCE-MRI has a high sensitivity for breast cancer, and it is known to be a promising tool in detecting, diagnosing, and staging breast cancer, but it has varied specificity (1,4,21). In addition, administering a gadolinium-based contrast agent in DCE-MRI is contraindicated in rare patients with renal insufficiency or previous allergic reaction, and it is time consuming (1). Recent studies continue to show the potential contribution of unenhanced imaging techniques to distinguish between benign and malignant lesions either alone or combined with DCE-MRI (11,22–25). The unenhanced T2 sequence is useful as an adjunct to contrast-enhanced sequences and offers the potential to improve the differential diagnosis of benign and malignant lesions (22,23,25–27). However, the significance and diagnostic impact of the unenhanced T2 sequence alone are still being clinically established (11,28). DWI is another unenhanced method for which usefulness has been determined. Most DWI studies of the breast have reported that the ADC values in malignant tumors were significantly lower than those in normal tissues and that the ADC value correlated with the prognostic factors for breast cancer (5,6,10). Furthermore, low intra-observer and inter-observer variability has been reported (29). However, the cut-off values in several reports vary from 1.10 × 10⁻³ mm2/sec to 1.60 × 10⁻³ mm2/sec (7–10,30). Diagnostic performance also varies depending on the cutoff value, with a sensitivity of 80–100% and a specificity of 47–81% (7,8,10). However, existing studies have only investigated the DWI and ADC of the entire lesion and have not emphasized the importance of the spatial features of DWI. We evaluated morphological DWI features in this study. According to the consensus results of our study, the specificity of the rim sign (grade 2 or higher) in DWI was higher than that of the ADCmean value (80.6% vs. 63.9%).
In another report that evaluated the diagnostic accuracy of the combination of DCE-MRI and DWI, the sensitivity and specificity were 92% and 86%, respectively (9). Even in this study, the Breast Imaging-Reporting and Data System (BIRADS) was emphasized and was effective in distinguishing between the malignant and benign lesions, but evaluations based only on DCE-MRI and multiple qualitative and morphological features overlapped and were therefore combined (3,9,12,16). Of the multiple qualitative and morphological features in BIRADS on DCE-MRI, the internal characteristic of rim enhancement in DCE-MRI is an important sign in the differential diagnosis of a breast mass (3,9,12–14). Rim enhancement has a 79–92% predictive value for breast malignancy (5). Schnall et al. reported that the Az value of rim enhancement in DCE-MRI is 0.58. In our study, we evaluated only 1 characteristic feature, the rim sign, in DWI. The sensitivity was low, but the specificity was high. Although a much larger study of the multiple qualitative and morphologic features of DWI is needed to confirm its diagnostic impact, this initial study demonstrates that the morphological features of DWI can be used to expand the diagnostic information available in breast MRI.
Rim enhancement in DCE-MRI varied from grade 2 and 4 (a thin pattern, in which only the outermost margin of the mass showed enhancement), to grade 3 and 5 (a thick pattern with most of the mass showing enhancement and leaving a small central non-enhanced area that resembled a donut) (14). A thin rim with a smooth margin indicates a large solid cluster of cancer cells with mucin or an intracystic carcinoma with an expansive growth pattern. A thick rim with a spiculated margin suggests a scattered invasion of cancer cells into the stroma in small clusters or in trabecular structures with varying degrees of desmoplasia (14). Rim enhancement of breast lesions in DCE-MRI is caused by the combination of angiogenesis, the distribution and degree of fibrosis, the expression pattern of vascular endothelial growth factor, and various histological features (17). However, a cyst, fat necrosis, or abscess can also cause rim enhancement in DCE-MRI. We found abscesses that showed rim enhancement in DCE-MRI but not the rim sign in DWI. It is well known that DWI has high diagnostic value in soft-tissue abscesses, including breast abscesses (31). It has also been suggested that DWI is a helpful tool for distinguishing between benign and malignant lesions that show rim enhancement in DCE-MRI.
In our study, the ADCmean values of lesions with rim signs were lower than those without rim signs, according to all reviewers. The ADCmean value of the rim signal area was lower than the area excluding the rim signal for malignant lesions with a rim sign, but it was not significantly different. We suggested that a low ADCmean value is a cause of the rim sign in DWI, rather than T2-shine-through (since high signal on T2 was not correlated with rim sign on DWI).
Notably, our study had several limitations, including the small number of patients and the relatively low prevalence of the rim sign. In addition, the patient population included a mix of screening and staging patients; therefore, the prevalence of cancer was higher than that in a pure screening population. A low signal artifact from metallic biopsy clips (14 cases in this study) at the center or margin of the lesions could mimic a rim sign in DWI in some cases. Because the radiologists were trained to recognize this anomaly in clinical practice, their ability to describe the lesions was not affected. However, radiologists who use the rim sign in DWI in clinical practice must differentiate true rim signs from artifacts caused by metallic clips after biopsy. In addition, because this study specifically focused in DWI analysis, reviewers were not asked to provide full BIRADS classifications for the DCE-MRI images. Finally, unlike research performed on the rim sign in DCE-MRI, we did not investigate or report the pathologic causes of a rim in DWI. Further studies of rim features with histology should be undertaken in patients undergoing excision biopsy or lumpectomy.
Rim sign could be investigated as a potential prognostic sign to characterize lesions. The rim sign in DWI could help further improve diagnosis and reduce false positives. In addition, this basic study indicated that the rim sign in DWI potentially improves the accuracy of unenhanced MRI, which some clinicians have considered for screening.
REFERENCES
- 1.Orel SG, Schnall MD. MR imaging of the breast for the detection, diagnosis, and staging of breast cancer. Radiology 2001;220:13–30. [DOI] [PubMed] [Google Scholar]
- 2.Sinha S, Lucas-Quesada FA, DeBruhl ND, et al. Multifeature analysis of Gd-enhanced MR images of breast lesions. J Magn Reson Imaging 1997;7:1016–1026. [DOI] [PubMed] [Google Scholar]
- 3.Orel SG, Schnall MD, LiVolsi VA, Troupin RH. Suspicious breast lesions: MR imaging with radiologic-pathologic correlation. Radiology 1994;190:485–493. [DOI] [PubMed] [Google Scholar]
- 4.Liu PF, Debatin JF, Caduff RF, Kacl G, Garzoli E, Krestin GP. Improved diagnostic accuracy in dynamic contrast enhanced MRI of the breast by combined quantitative and qualitative analysis. Br J Radiol 1998;71:501–509. [DOI] [PubMed] [Google Scholar]
- 5.Jeh SK, Kim SH, Kim HS, et al. Correlation of the apparent diffusion coefficient value and dynamic magnetic resonance imaging findings with prognostic factors in invasive ductal carcinoma. J Magn Reson Imaging 2011;33:102–109. [DOI] [PubMed] [Google Scholar]
- 6.Choi SY, Chang YW, Park HJ, Kim HJ, Hong SS, Seo DY. Correlation of the apparent diffusion coefficiency values on diffusion-weighted imaging with prognostic factors for breast cancer. Br J Radiol 2012;85:e474–479. [DOI] [PMC free article] [PubMed] [Google Scholar]
- 7.Marini C, Iacconi C, Giannelli M, Cilotti A, Moretti M, Bartolozzi C. Quantitative diffusion-weighted MR imaging in the differential diagnosis of breast lesion. Eur Radiol 2007;17:2646–2655. [DOI] [PubMed] [Google Scholar]
- 8.Partridge SC, Mullins CD, Kurland BF, et al. Apparent diffusion coefficient values for discriminating benign and malignant breast MRI lesions: effects of lesion type and size. AJR Am J Roentgenol 2010;194:1664–1673. [DOI] [PubMed] [Google Scholar]
- 9.Yabuuchi H, Matsuo Y, Okafuji T, et al. Enhanced mass on contrast-enhanced breast MR imaging: Lesion characterization using combination of dynamic contrast-enhanced and diffusion-weighted MR images. J Magn Reson Imaging 2008;28:1157–1165. [DOI] [PubMed] [Google Scholar]
- 10.Fornasa F, Pinali L, Gasparini A, Toniolli E, Montemezzi S. Diffusion-weighted magnetic resonance imaging in focal breast lesions: analysis of 78 cases with pathological correlation. Radiol Med 2011;116:264–275. [DOI] [PubMed] [Google Scholar]
- 11.Park MJ, Cha ES, Kang BJ, Ihn YK, Baik JH. The role of diffusion-weighted imaging and the apparent diffusion coefficient (ADC) values for breast tumors. Korean J Radiol 2007;8:390–396. [DOI] [PMC free article] [PubMed] [Google Scholar]
- 12.Radiology. ACo. Breast imaging reporting and data system, breast imaging atlas, 4th edition: American College of Radiology; 2003. [Google Scholar]
- 13.Kobayashi M, Kawashima H, Matsui O, et al. Two different types of ring-like enhancement on dynamic MR imaging in breast cancer: correlation with the histopathologic findings. J Magn Reson Imaging 2008;28:1435–1443. [DOI] [PubMed] [Google Scholar]
- 14.Uematsu T, Kasami M, Nicholson BT. Rim-enhancing breast masses with smooth or spiculated margins on magnetic resonance imaging: histopathology and clinical significance. Jpn J Radiol 2011;29:609–614. [DOI] [PubMed] [Google Scholar]
- 15.Sherif H, Mahfouz AE, Oellinger H, et al. Peripheral washout sign on contrast-enhanced MR images of the breast. Radiology 1997;205:209–213. [DOI] [PubMed] [Google Scholar]
- 16.Schnall MD, Blume J, Bluemke DA, et al. Diagnostic architectural and dynamic features at breast MR imaging: multicenter study. Radiology 2006;238:42–53. [DOI] [PubMed] [Google Scholar]
- 17.Matsubayashi R, Matsuo Y, Edakuni G, Satoh T, Tokunaga O, Kudo S. Breast masses with peripheral rim enhancement on dynamic contrast-enhanced MR images: correlation of MR findings with histologic features and expression of growth factors. Radiology 2000;217:841–848. [DOI] [PubMed] [Google Scholar]
- 18.Buadu LD, Murakami J, Murayama S, et al. Patterns of peripheral enhancement in breast masses: correlation of findings on contrast medium enhanced MRI with histologic features and tumor angiogenesis. J Comput Assist Tomogr 1997;21:421–430. [DOI] [PubMed] [Google Scholar]
- 19.Buadu LD, Murakami J, Murayama S, et al. Breast lesions: correlation of contrast medium enhancement patterns on MR images with histopathologic findings and tumor angiogenesis. Radiology 1996;200:639–649. [DOI] [PubMed] [Google Scholar]
- 20.Hanley JA, McNeil BJ. The meaning and use of the area under a receiver operating characteristic (ROC) curve. Radiology 1982;143:29–36. [DOI] [PubMed] [Google Scholar]
- 21.Fischer U, Kopka L, Grabbe E. Breast carcinoma: effect of preoperative contrast-enhanced MR imaging on the therapeutic approach. Radiology 1999;213:881–888. [DOI] [PubMed] [Google Scholar]
- 22.Ballesio L, Savelli S, Angeletti M, et al. Breast MRI: Are T2 IR sequences useful in the evaluation of breast lesions? Eur J Radiol 2009;71:96–101. [DOI] [PubMed] [Google Scholar]
- 23.Malich A, Fischer DR, Wurdinger S, et al. Potential MRI interpretation model: differentiation of benign from malignant breast masses. AJR Am J Roentgenol 2005;185:964–970. [DOI] [PubMed] [Google Scholar]
- 24.Partridge SC, Rahbar H, Murthy R, et al. Improved diagnostic accuracy of breast MRI through combined apparent diffusion coefficients and dynamic contrast-enhanced kinetics. Magn Reson Med 2011;65:1759–1767. [DOI] [PMC free article] [PubMed] [Google Scholar]
- 25.Yuen S, Uematsu T, Kasami M, et al. Breast carcinomas with strong high-signal intensity on T2-weighted MR images: pathological characteristics and differential diagnosis. J Magn Reson Imaging 2007;25:502–510. [DOI] [PubMed] [Google Scholar]
- 26.Baltzer PA, Dietzel M, Kaiser WA. Nonmass lesions in magnetic resonance imaging of the breast: additional T2-weighted images improve diagnostic accuracy. J Comput Assist Tomogr 2011;35:361–366. [DOI] [PubMed] [Google Scholar]
- 27.Moran CJ, Hargreaves BA, Saranathan M, et al. 3D T2-weighted spin echo imaging in the breast. J Magn Reson Imaging 2013. [DOI] [PMC free article] [PubMed] [Google Scholar]
- 28.Mann RM, Kuhl CK, Kinkel K, Boetes C. Breast MRI: guidelines from the European Society of Breast Imaging. Eur Radiol 2008;18:1307–1318. [DOI] [PMC free article] [PubMed] [Google Scholar]
- 29.Petralia G, Bonello L, Summers P, et al. Intraobserver and interobserver variability in the calculation of apparent diffusion coefficient (ADC) from diffusion-weighted magnetic resonance imaging (DW-MRI) of breast tumours. Radiol Med 2011;116:466–476. [DOI] [PubMed] [Google Scholar]
- 30.Imamura T, Isomoto I, Sueyoshi E, et al. Diagnostic performance of ADC for Non-mass-like breast lesions on MR imaging. Magn Reson Med Sci 2010;9:217–225. [DOI] [PubMed] [Google Scholar]
- 31.Unal O, Koparan HI, Avcu S, Kalender AM, Kisli E. The diagnostic value of diffusion-weighted magnetic resonance imaging in soft tissue abscesses. Eur J Radiol 2011;77:490–494. [DOI] [PubMed] [Google Scholar]


