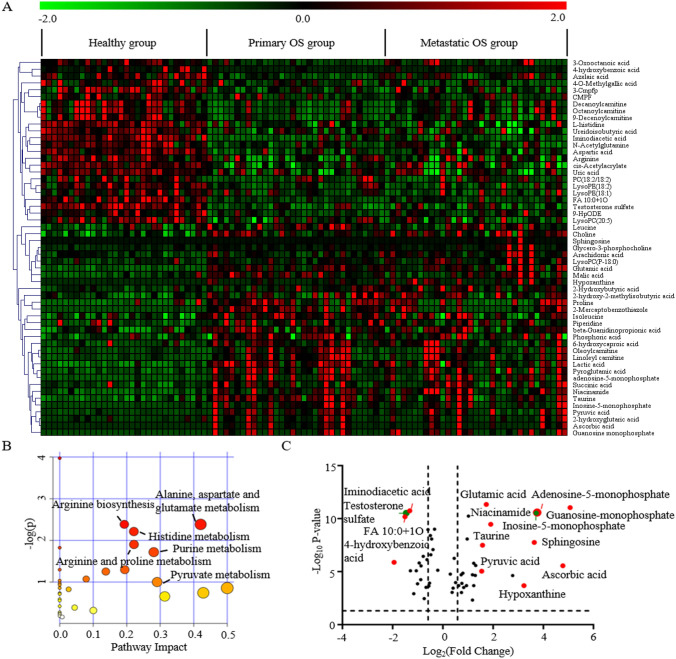
Fig. 2.
Identification of metabolic characteristics between osteosarcoma patients and healthy controls. A Heat map displaying the change direction of the discriminators. Upregulated metabolites are shown in red, while downregulated metabolites are shown green. B Pathway enrichment analysis of differential metabolites between OS patients and healthy controls. The abscissa represents the influencing factor of path topological analysis. The ordinate represents the p value of pathway enrichment analysis (negative logarithm). The larger the circle is, the larger the influence factor is. The deeper red color has the larger value of − log(p), which means the more significant enrichment. C A volcano plot shows the differential metabolites. Marked metabolites are the most distinct in OS patients compared with healthy controls

