

Abstract
Chronic loss of sleep damages health and disturbs the quality of life. Long-lasting sleep deprivation (SD) as well as sleep abnormalities are substantial risk factors for major depressive disorder, although the underlying mechanisms are not clear. Here, we showed that chronic SD in mice promotes a gradual elevation of extracellular ATP, which activates astroglial P2X7 receptors (P2X7Rs). Activated P2X7Rs, in turn, selectively down-regulated the expression of 5-HT2B receptors (5-HT2BRs) in astrocytes. Stimulation of P2X7Rs induced by SD selectively suppressed the phosphorylation of AKT and FoxO3a in astrocytes, but not in neurons. The over-expression of FoxO3a in astrocytes inhibited the expression of 5-HT2BRs. Down-regulation of 5-HT2BsRs instigated by SD suppressed the activation of STAT3 and relieved the inhibition of Ca2+-dependent phospholipase A2. This latter cascade promoted the release of arachidonic acid and prostaglandin E2. The depression-like behaviors induced by SD were alleviated in P2X7R-KO mice. Our study reveals the mechanism underlying chronic SD-induced depression-like behaviors and suggests 5-HT2BRs as a key target for exploring therapeutic strategies aimed at the depression evoked by sleep disorders.
Keywords: Astrocyte, Sleep deprivation, P2X7 receptor, 5-HT2B receptor, FoxO3a
Introduction
Good sleep safeguards physical health and the quality of life, and contributes to cognitive and emotional functions. Prolonged sleep deprivation (SD) increases the risk of mood disorders [1] and impairs the regulation of emotions [2]. Our previous studies revealed that chronic SD induces depression-like behaviors via stimulating an astroglial inflammatory response. This response is linked to the activation of P2X7 purinoceptors associated with the activation of the NLRP3 (nucleotide-binding domain and leucine-rich repeat protein-3) inflammasome. We also found that the anti-depressant fluoxetine suppresses the activation of the NLRP3 inflammasome caused by SD via astroglial 5-HT2B receptors (5-HT2BRs) [3, 4]. In this study, we found that the depression-like behaviors induced by SD were improved in P2X7-receptor knockout mice, and 5-HT2BRs can be regulated by SD via P2X7Rs. Hence, a potential mechanism linking P2X7Rs and 5-HT2BRs is further studied in this work, especially in the context of chronic SD.
Dynamic changes in brain extracellular ATP during the sleep-wake cycle have not been studied extensively. Increased ATP release from neurons during wakefulness has nonetheless been suggested to activate P2X7Rs in neural cells [5]. Functional P2X7Rs are distributed in the cortex, hippocampus, and retina, and P2X7Rs interfere with sleep rhythms directly or indirectly through the release of cytokines and neurotransmitters [6]. The expression of P2X7Rs is up-regulated in people subjected to chronic SD, and this change in expression is linked to the cycling in bipolar disorder [7].
We previously reported that astroglial 5-HT2BRs are associated with major depressive disorder. These receptors expressed in astrocytes are targets for serotonin-specific re-uptake inhibitors [3, 8, 9]. Down-regulation of 5-HT2BRs leads to a loss of sleep homeostasis in Drosophila [10]. We found that leptin enhances the anti-depressive potential of fluoxetine in the context of SD-induced depression-like behaviors by stimulating 5-HT2BRs in astrocytes with a consequent increase in the phosphorylation of ERK1/2 [11]. We also found that 5-HT2BRs regulate the expression of Ca2+-dependent phospholipase A2 (cPLA2) via transactivation of epidermal growth factor receptors [8]. In spinal cord astrocytes, the phosphorylation of cPLA2 induced by ATP leads to the rapid release of arachidonic acid (AA) and prostaglandin E2 (PGE2) [12]. However, whether the level of AA or PGE2 in astrocytes is influenced by chronic SD remains unknown.
Ionotropic P2X7Rs promote NLRP3 inflammasome assembly and trigger the ATP-induced release of mature interleukin (IL)-1β and IL-18 from astrocytes [4]. Activation of P2X7Rs is linked to the NLRP3 inflammasome and the induction of depression-like behaviors induced by chronic stress [13]. Furthermore, P2X7Rs suppress the phosphorylation of AKT (protein kinase B) and ERK (extracellular-regulated kinase) induced by BzATP in microglia [14]. We demonstrated that SD decreases the phosphorylation of AKT, but not that of ERK [4], while activation of AKT phosphorylates the Forkhead transcriptional factor FoxO3a on the Ser253 site (FoxO3a is an attractive candidate for regulating stress responses) [15].
In this study, we dissected how the SD-induced activation of P2X7Rs regulates the expression of 5-HT2BRs and the production of AA and PGE2 to reveal the possible mechanism linking chronic SD with mood disorders, including the major depressive disorder.
Materials and Methods
Animals
As in our previous studies [4, 16], C57BL/6, B6.Cg-Tg(Thy1-YFP)HJrs/J, FVB/N-Tg(GFAP-GFP)14Mes/J, and B6.129P2-P2rx7tm1Gab/J (P2X7R-KO) mice were all purchased from the Jackson Laboratory (Bar Harbor, ME, USA). Male mice were used at an age of ~ 3 months (~ 25 g) and were kept in standard housing conditions (22 ± 1°C; light/dark cycle of 12 h/12 h) with food and water available ad libitum. All mice were randomly assigned to different experimental groups using a random number table. All operations were carried out in accordance with the National Institutes of Health Guide for the Care and Use of Laboratory Animals (NIH Publication No. 8023) and its 1978 revision, and all experimental protocols were approved by the Institutional Animal Care and Use Committee of China Medical University (No. [2019]059).
Materials
Most chemicals, including BzATP [2′(3′)-O-(4-benzoylbenzoyl)adenosine 5′-triphosphate triethylammonium salt], DAPI [4′,6-diamidine-2-phenylindole) dihydrochloride], ARL67156 trisodium salt (6-N,N-diethyl-β-γ-dibromomethylene-D-adenosine-5-triphosphate FPL 67156), BW723C86 [α-methyl-5-(2-thienylmethoxy)-1H-indole-3-ethanamine monohydrochloride], and a primary antibody raised against β-actin were from Sigma (St. Louis, MO, USA). Other primary antibodies, Alexa Fluor-conjugated or horseradish peroxidase-conjugated secondary antibodies, were from Merck Millipore (Burlington, MA, USA). Stattic (6-nitrobenzo[b]thiophene 1,1-dioxide) was supplied by R&D Systems (Minneapolis, MN, USA). Chemicals for the preparation of cell-sorting medium were from Gibco Life Technology Invitrogen (Grand Island, NY, USA).
SD Protocol
As described previously [17], SD was maintained by “gentle handling” according to the standard protocols, gently touching the mouse with a brush to keep it awake in every cage. SD was maintained for 6 h, beginning at 07:00 and ending at 13:00. During SD, the mice had access to food and water ad libitum. Animals in the sham group were left undisturbed in a separate room with the same light/dark cycle as the SD group. The mice were exposed to sham conditions or SD stimulation for 3 or 4 weeks.
Microdialysis and ATP Measurements
Mice were anesthetized with ketamine [80 mg/kg, intraperitoneal injection (i.p.)] and xylazine (10 mg/kg, i.p.). As reported previously [18], a guide cannula (CMA 7, CMA Microdialysis, Stockholm, Sweden) was implanted into the right prefrontal cortex (coordinates: anteroposterior 1.75 mm, mediolateral 0.75 mm, dorsoventral 1.5 mm). A microdialysis probe (CMA 7; molecular weight cut-off, 6,000 Da) was inserted through the cannula 24 h before the start of experiments. All microdialysis samples were collected from 10:00 at 0, 1, 2, 3, and 4 weeks. Artificial cerebrospinal fluid (ACSF) was perfused through the microdialysis probe at 1 μL/min, and samples were collected 3 h after probe insertion. To minimize the rate of background ATP hydrolysis, each sample collection tube was pre-treated with ARL 67156, and the interstitial fluid ATP levels were measured immediately.
ATP levels were assessed with a luciferin-luciferase-based assay [19, 20] using a commercial ATP assay system with a bioluminescence detection kit (Enliten, Promega, Madison, WI, USA). ATP was measured according to the manufacturer’s protocol. In brief, weighed tissue samples were homogenized in 5% trichloroacetic acid and centrifuged at 5,000 rpm in the cold (4°C) for 5 min, then the supernatant was transferred to a fresh tube. A calibration curve was constructed from standard ATP solutions, samples were neutralized with Tris acetate buffer, and the luciferase reagent was used immediately before measurement in the luminometer.
Cell Dissociation and Fluorescence-Activated Cell Sorting (FACS)
B6.Cg-Tg(Thy1-YFP)HJrs/J and FVB/N-Tg(GFAP-GFP)14Mes/J mice were separately used for isolating neurons and astrocytes. A single-cell suspension of the cortex and hippocampus was prepared as previously described [16]. In brief, tissue from 3 mice was pooled for one sample. Wavelengths of 488 nm and 530 nm were used for yellow fluorescent protein (YFP) or green fluorescent protein (GFP) excitation and emission, respectively. YFP+ or GFP+ cells were sorted and collected, the purity of neuronal or astrocytic populations sorted has been ascertained by detecting mRNA level of cell specific markers as described previously [21]
Primary Culture of Astrocytes
As described previously [16, 22, 23], astrocytes isolated from the cerebral hemispheres of newborn C57BL/6 mice were cultured in Dulbecco’s modified Eagle’s medium (DMEM) with 7.5 mmol/L glucose. From the third week, dibutyryl cyclic AMP was added to the medium.
Immunohistochemistry
The brain tissue was fixed in 4% paraformaldehyde and cut at 100 µm. Immunohistochemistry was performed as previously described [16, 24]. In brief, the following primary antibodies were used: mouse anti-5-HT2BR (1:150), mouse anti-P2X7 (1:150), chicken anti-NeuN (1:250), rabbit anti-Glt1 (1:200), and rabbit anti-GFAP (1:250). The sections were incubated with Alexa Fluor-conjugated secondary antibodies for 2 h at room temperature (1:250). DAPI (1:2000) was used to stain cell nuclei. Immunofluorescence was imaged under a confocal scanning microscope (DMi8, Leica, Wetzlar, Germany). The background intensity of each image was calculated for cell-free parenchyma in the same field of view and subtracted from the total immunofluorescence intensity. The intensity of 5-HT2BR immunofluorescence from each group was normalized to the intensity in the sham group.
Western Blotting
As described previously [22, 24], the sections were blocked with powdered skim milk and incubated for 2 h with the primary antibodies at room temperature. After washing three times, specific binding was detected with horseradish peroxidase-conjugated secondary antibodies. Staining was visualized with enhanced chemiluminescence (ECL) detection reagents, and images were acquired with an electrophoresis gel imaging analysis system. Band density was measured in Windows Alpha Ease FC 32-bit software (Tanon; Shanghai, China).
Real-Time PCR (RT-PCR)
As described previously [16], total RNA was reverse-transcribed and PCR amplification was performed with a Thermo-cycler. The RNA quantities were normalized by glyceraldehyde 3-phosphate dehydrogenase (GAPDH) before calculating the relative expression of 5-HT2BRs. Values were first calculated as the ratios of the expression of 5-HT2BRs to GAPDH, then the values were normalized to the sham group.
Over-Expression of FoxO3a Using Adenoviral Vectors
As described previously [25, 26], replication-defective adenoviral vectors expressing dominant wild-type FoxO3a were designed by TaKaRa Biotechnology (Dalian, China). The wild-type FoxO3a had a hemagglutinin tag at the N-terminus and expressed GFP. Astrocytes were infected with recombinant adenovirus in DMEM for 8 h, after which the medium was replaced by fresh complete culture medium including 10% fetal bovine serum. The infection efficiency was close to 80%, as determined by GFP expression.
Assessment of Arachidonic Acid (AA) Mobilization
As described previously [27], the release of 3H from astrocytes pre-labelled with [3H]AA was used to monitor the response to serotonin. Confluent cultures were changed to quiescent medium for 24 h before they were labelled for 4 h with 1 μCi/mL [3H] AA (PerkinElmer Life Sciences, Shanghai, China). The cells were washed once with PBS containing 0.1% free fatty acid albumin and twice with PBS alone. Astrocytes were then incubated at 37°C in fresh Ham’s F-12 medium supplemented with 0.1% free fatty acid albumin plus serotonin or PBS. The astrocytes were washed with 5% Triton and scraped off. The radioactivity levels of astrocytes and medium were quantified by scintillation counting. The results were normalized and expressed as a percentage of the mean of basal release.
PGE2 Assays
As described previously [12, 27], PGE2 levels were monitored using an enzyme immunoassay kit (Cayman Chemical, Ann Arbor, MI, USA). The assays were run according to the manufacturer’s protocols. PGE2 production was evaluated in duplicate, and concentrations were calculated from a standard curve of PGE2 solutions. The sensitivity of the assay allowed detection of up to 15 pg/mL. When necessary, the samples were diluted in assay buffer.
Tail Suspension Test
This is a despair-based behavioral test. Each mouse was suspended by its tail ~ 2 cm from the tip as we previously described [4, 16] and behavior was recorded for 6 min. The duration of immobility was measured by an observer blinded to the treatment groups.
Forced Swimming Test
This is also a despair-based behavioral test. In brief, each mouse was trained to swim for 15 min before the formal measurement. Then the trained mouse was put into a glass cylinder that contained 30 cm deep water (25 ± 1°C) and left for 6 min. The immobility time was recorded during the last 4 min that followed 2 min of habituation [3, 16].
Sucrose Preference Test
As previously described [3, 16], the sucrose preference test is a reward-based test and a measure of anhedonia. Briefly, after 12 h of food and water deprivation, each mouse was provided with two pre-weighed bottles – one was filled with 2.5% sucrose and the other contained water – and left for 2 h. The percentage preference was calculated according to the formula: % preference = [sucrose intake/(sucrose + water intake)] × 100%.
Statistical Analysis
All measurements were performed by an investigator blinded to the experimental conditions. Differences between multiple groups were evaluated by analysis of variance followed by Fisher’s least significant difference or a Tukey-Kramer post hoc multiple comparison test for unequal replications using SPSS 19.0 (IBM, Armonk, NY, USA) or GraphPad Prism 5 (GraphPad Software Inc., La Jolla, CA, USA). All statistical data are expressed as the mean ± SEM; the level of significance was set at P < 0.05.
Results
SD Down-Regulates 5-HT2BR Expression in Astrocytes Through P2X7Rs
The effect of 4 weeks of SD on extracellular ATP levels in the prefrontal cortex was measured by microdialysis, which showed that SD resulted in a gradual increase (Fig. 1A). At the initial point (week 0), the baseline ATP was 326 ± 193.3 pg/mL in the sham group (n = 6). During sham treatment for 4 weeks, the levels did not change significantly. However, SD increased the level to 1226 ± 157.1 pg/mL at 1 week, 1670 ± 192.1 pg/mL at 2 weeks, 1922 ± 201.7 pg/mL at 3 weeks, and 2109 ± 178.4 pg/mL at 4 weeks (n = 6). Since SD gradually increased the release of ATP for 4 weeks, we chose 3 weeks for the duration of SD in the subsequent experiments.
Fig. 1.

P2X7 receptors mediate the selective decrease of 5-HT2BRs in astrocytes exposed to chronic SD. A Levels of extracellular ATP measured by microdialysis in the prefrontal cortex of wild-type mice with or without SD at 0, 1, 2, 3, and 4 weeks. Data are presented as the mean ± SEM (*P < 0.05 vs sham group at the same time point, **P < 0.05 vs other groups; n = 6). B RT-PCR analysis of 5-HT2BR mRNA expression in FACS-sorted cortical neurons and astrocytes, expressed as the 5-HT2BR/GAPDH ratio. C Immunolabeling of P2X7R (green) co-stained with Glt1 (red) and NeuN (blue) in the cortex of wild-type (WT) and P2X7R-KO mice (scale bar, 20 μm). D Immunolabeled 5-HT2BRs (green) co-stained with GFAP (red) and NeuN (blue) in frontal cortex from sham (Control) or SD (3 weeks) WT and P2X7R-KO mice (scale bar, 20 μm). E Immunolabeling intensity of 5-HT2BRs in neurons and astrocytes relative to cell-free parenchyma in cortex, normalized to the intensity in the sham group. F RT-PCR analysis of 5-HT2BR mRNA expression in WT and P2X7R-KO mice with or without SD for 3 weeks, expressed as the 5-HT2BR/GAPDH ratio. G Protein expression of 5-HT2BRs in WT and P2X7R-KO mice in the sham (Control) or SD (3 weeks) groups was calculated as the ratio of 5-HT2BR (55 kDa) to β-actin (42 kDa). H Average levels of protein expression (normalized to β-actin) of 5-HT2BRs in WT and P2X7R-KO mice. Data represent the mean ± SEM (*P < 0.05 vs sham group; n = 6).
The expression of 5-HT2BR mRNA in neurons and astrocytes FACS-sorted from Thy1-YFP and GFAP-GFP mice exposed to SD was determined by RT-PCR. The 5-HT2BR mRNA level was significantly suppressed by 70% ± 6.8% (P = 0.0066, n = 6) in astrocytes; however, SD marginally and non-significantly affected the expression of 5-HT2BR in neurons (Fig. 1B). Meanwhile, after SD for 3 weeks, the fluorescence intensity of 5-HT2BR immunoreactivity was significantly decreased by 73% ± 5.4% (P = 0.0001, n = 6) in astrocytes compared with the sham group; there was no difference in the 5-HT2BR expression in neurons between the sham and SD groups (Fig. 1D, E). However, the SD-induced down-regulation of 5-HT2BRs was completely eliminated in astrocytes from P2X7R-KO mice (P2X7R expression in P2X7R-KO mice was suppressed; Fig. 1C). The fluorescence intensity of 5-HT2BR immunoreactivity in astrocytes was 102% ± 10.4% (n = 6) of the sham group, while it was 91% ± 6.8% (P = 0.8764, n = 6) of the sham group in neurons (Fig. 1D, E).
The 5-HT2BR mRNA level measured by RT-PCR reflected the protein expression. Compared with the sham group, 5-HT2BR mRNA expression was down-regulated by 80% ± 4.4% (P = 0.004, n = 6) in the SD group of wild-type mice (Fig. 2F). However, SD decreased the expression of 5-HT2BR mRNA only by 6% ± 9.2% (P = 0.6976, n = 6) of the sham group in P2X7R-KO mice (Fig. 1F).
Fig. 2.

Signaling cascades involved in the regulation of 5HT2BR expression. A, B The ratios of p-AKT to AKT (60 kDa) (A), and p-FoxO3a to FoxO3a (97 kDa) (B) in wild-type (WT) and P2X7R-KO mice in the sham (Control) and SD (3 weeks) groups. C, D The levels of p-AKT/AKT (C) and p-FoxO3a/FoxO3a (D) in sorted neurons and astrocytes from Thy1-YFP and GFAP-GFP mice with or without SD (3 weeks). Data are presented as the mean ± SEM (*P < 0.05 vs sham group; n = 6).
The SD-related changes in protein expression of 5-HT2BRs quantified by western blotting were similarly absent in P2X7R-KO mice (Fig. 1G). SD significantly reduced the expression of 5-HT2BRs to 32% ± 3.3% (P < 0.0001, n = 6) of the sham group in wild-type mice, while their level in the SD group was 89% ± 4.8% (P = 0.3141, n = 6) of the sham group in P2X7R-KO mice, and there was no difference in the expression of 5-HT2BR in astrocytes from WT sham and P2X7R-KO mice (Fig. 1H). The above results showed that SD selectively down-regulates the expression of 5-HT2BRs via P2X7Rs in astrocytes, but not in neurons.
Involvement of AKT and FoxO3a in the Regulation of 5-HT2BRs by P2X7Rs In Vivo and In Vitro
In wild-type mice exposed to SD, the phosphorylation of AKT (Ser473) was reduced by 58% ± 3.3% (P = 0.0004, n = 6) of controls (Fig. 2A), and the phosphorylation of FoxO3a (Ser253) was decreased by 61% ± 5.4% (P < 0.0001, n = 6) compared with controls (Fig. 2B). On the contrary, in P2X7R-KO mice exposed to SD, the phosphorylation of AKT was 116% ± 16.4% (P = 0.2720, n = 6) of controls (Fig. 2A), while the level of p-FoxO3a was 123% ± 12.3% (P = 0.4503, n = 6) of controls (Fig. 2B); there was no significant difference between the control and SD groups.
We used SD Thy1-YFP and GFAP-GFP transgenic mice to measure the levels of p-AKT and p-FoxO3a in the FACS-sorted neurons and astrocytes. SD decreased the phosphorylation of AKT in astrocytes by 57% ± 4.7% (P = 0.0003, n = 6) of controls, while there was no difference between the control and SD groups in neurons (Fig. 2C). Similarly, SD suppressed the phosphorylation of FoxO3a by 69% ± 5.2% (P = 0.0011, n = 6) in astrocytes compared with controls, while no changes were found in neurons (Fig. 2D). In vivo, SD selectively decreased the phosphorylation of AKT and FoxO3a in astrocytes by stimulating P2X7Rs.
In primary cultured astrocytes, we used the P2X7R agonist BzATP to simulate the effects of ATP on P2X7Rs induced by SD. To probe the mechanism by which P2X7Rs regulate the expression of 5-HT2BRs in these astrocytes, we used siRNA duplex to interfere with the mRNA of P2X7Rs. This manipulation decreased the level of P2X7Rs by 88% ± 3.4% of controls (Fig. 3A). To determine the effect of transcription factor FoxO3a on the expression of 5-HT2BRs, we over-expressed FoxO3a in primary cultured astrocytes (Fig. 3B).
Fig. 3.

Role of P2X7Rs in regulating the expression of 5-HT2BRs in vivo. A qPCR analysis of P2X7R mRNA expression in negative control primary cultured astrocytes and those treated with P2X7R siRNA duplex for 3 days, expressed as the expression ratio normalized to the control group. Data are presented as the mean ± SEM (*P < 0.05 vs control group; n = 6). B Immunohistochemical staining of FoxO3a (green) co-stained with DAPI (blue) and GFAP (red) in astrocytes with or without recombinant adenovirus infection for 3 days (scale bars, 20 μm). C, D Ratios of p-AKT to AKT (C) and p-FoxO3a to FoxO3a (D) in primary cultured astrocytes pre-treated with P2X7R siRNA duplex for 3 days. Data represent the mean ± SEM (*P < 0.05 vs control group; n = 6). E Ratio of 5-HT2BR to β-actin protein expression in primary cultured astrocytes pre-treated with P2X7R siRNA duplex or over-expressing FoxO3a with recombinant adenovirus for 3 days. Data are presented as the mean ± SEM (*P < 0.05 vs PBS group, **P < 0.01 vs other groups; n = 6).
Administration of BzATP reduced the phosphorylation of AKT by 66% ± 4.3% (P < 0.0001, n = 6) of the PBS control group in astrocytes (Fig. 3C). In contrast, after treatment with siRNA, this effect was abolished, as there was no significant difference between the PBS and BzATP groups (Fig. 3C). Phosphorylation of FoxO3a was decreased by 52% ± 4.1% (P < 0.0001, n = 6) in the BzATP group compared with the PBS control (Fig. 3D). After 3 days of P2X7R siRNA treatment, the phosphorylation of FoxO3a treated with BzATP recovered to 94% ± 7.7% (P = 0.6482, n = 6) of the PBS group (Fig. 3D). In astrocytes, BzATP reduced the expression of 5-HT2BRs by 69% ± 3.2% (P < 0.0001, n = 6) of the PBS group (Fig. 3E). This effect was eliminated after siRNA treatment: in the presence of BzATP, the level of 5-HT2BR decreased insignificantly, to 91% ± 7.3% (P = 0.5739, n = 6) of the PBS group (Fig. 3E). After over-expressing FoxO3a, the basic level of 5-HT2BRs was reduced by 62% ± 4.7% (P = 0.0007, n = 6) compared with the PBS group without over-expression, but BzATP did not change the expression of 5-HT2BRs (Fig. 3E). In vitro, stimulating P2X7Rs down-regulated the expression of astrocytic 5-HT2BRs by suppressing the phosphorylation of AKT and FoxO3a.
Effects of P2X7Rs on the Phosphorylation of STAT3 and cPLA2 are Associated with 5-HT2BRs In Vivo and In Vitro
Exposure of mice to SD decreased the phosphorylation of STAT3 by 66% ± 5.4% (P = 0.0004, n = 6) of controls; however, this effect was abolished in P2X7R-KO mice – the level of p-AKT in the SD group was 97% ± 8.9% (P = 0.8371, n = 6) of controls (Fig. 4A). In contrast, SD had the opposite effect on the activation of cPLA2; the phosphorylation of cPLA2 in mice exposed to SD increased by 67% ± 8.7% (P = 0.0088, n = 6) compared with controls (Fig. 4B). This effect was absent from P2X7R-KO mice in which SD did not stimulate the activation of cPLA2 (Fig. 4B).
Fig. 4.

P2X7Rs regulate the 5-HT2BR-dependent activation of STAT3 and cPLA2. A, B The ratios of p-STAT3 to STAT3 (86 kDa) (A) and p-cPLA2 to cPLA2 (95 kDa) (B) in wild-type (WT) and P2X7R-KO sham (Control) and SD (3 weeks) groups. C–F The ratios of p-STAT3 to STAT3 (C) and p-cPLA2 to cPLA2 (D), and the release of 3H-AA (E) and PGE2 (F) from primary cultured astrocytes pre-treated with SB204741 (selective 5-HT2BR antagonist) or Stattic (STAT3 inhibitor) for 30 min, then treated with the specific 5-HT2BR agonist BW723C86 (BW) for 1 h. Data represent the mean ± SEM (*P < 0.05 vs other groups; n = 6).
In experiments in vitro, we used the 5-HT2BR agonist BW723C86 (BW) to stimulate 5-HT2BRs. In cultured astrocytes, BW induced the phosphorylation of STAT3 by 73% ± 10.7% (P = 0.0008, n = 6) of controls, and the 5-HT2BR-specific antagonist SB204741 totally suppressed the phosphorylation of STAT3 stimulated by BW (Fig. 4C). Treatment with BW decreased the level of p-cPLA2 by 57% ± 3.9% (P < 0.0001, n = 6) of controls, while the irreversible STAT3 activation inhibitor Stattic elevated the phosphorylation of cPLA2 to 96% ± 8.7% (P = 0.7767, n = 6) of controls; there was no difference between the control and Stattic groups (Fig. 4D).
BW decreased the level of AA by 31% ± 7.1% (P = 0.0216, n = 6) and that of PGE2 by 57% ± 3.3% (P = 0.0007, n = 6) compared with the control group (Fig. 4E, F). Exposure to Stattic increased the release of AA and PGE2 reduced by BW to 105% ± 12.2% (P = 0.7458, n = 6) and 116% ± 12.7% (P = 0.3743, n = 6) of control (Fig. 4E, F). These results demonstrated that SD increases the release of AA and PGE2 by increasing the activation of cPLA2 mediated by P2X7Rs and STAT3.
Effects of P2X7Rs on the Depression-Like Behaviors Induced by SD
We monitored depressive-like behaviors in P2X7R-KO mice (Fig. 5). There was no difference in body weight between the control and SD groups of wild-type and P2X7R-KO mice (Fig. 5A). In the sucrose preference test, SD decreased the percentage uptake of sucrose water by 47% ± 5.3% (P = 0.0019, n = 6) compared with controls in WT mice (Fig. 5B). The anhedonia induced by SD was abolished in P2X7R-KO mice; the uptake of sucrose water was 89% ± 4.7% (P = 0.3201, n = 6) of controls (Fig. 5B). In the tail suspension test, the immobility time of the SD group was prolonged to 155% ± 15.1% of controls (P = 0.0070, n = 6), while this time was reduced to 107% ± 11.2% (P = 0.6480, n = 6) of controls in P2X7R-KO mice (Fig. 5C). Similarly, the immobility time in the forced-swimming test was increased by 106% ± 11.7% (P = 0.0049, n = 6) of the control group, and the time was increased only to 113% ± 9.5% (P = 0.6330, n = 6) of the sham group in P2X7R-KO mice (Fig. 5D). The depression-like behaviors induced by prolonged SD were dependent on P2X7Rs.
Fig. 5.

The depression-like behaviors induced by SD are eliminated in P2X7R-KO mice. A–D Body weight (A), percentage sucrose preference (B), and immobility time in the tail suspension test (C) and forced-swimming test (D) in wild-type (WT) and P2X7R-KO mice in the sham (Control) and SD (3 weeks) groups. Values are expressed as the mean ± SEM (*P < 0.05 vs other groups; n = 6).
Discussion
Here we demonstrate that chronic SD gradually increases the extracellular levels of ATP that subsequently stimulate P2X7Rs, which decrease the astroglial expression of 5-HT2BRs. This effect does not occur in neurons. Stimulation of P2X7Rs triggered by SD suppresses the expression of 5-HT2BRs by inhibiting the phosphorylation of AKT (Ser473) and FoxO3a (Ser253) in astrocytes. Dephosphorylated FoxO3a translocates into the nucleus [15, 28], where it down-regulates the expression of 5-HT2BRs in astrocytes. The downregulation of 5-HT2BRs induced by SD is caused by the decrease in activation of STAT3 which inhibits the activation of cPLA2. As a result, chronic SD indirectly stimulates the phosphorylation of cPLA2 by down-regulating the expression of 5-HT2BRs in astrocytes. This increased activation of cPLA2 stimulates the release of AA and PGE2, which may be linked to the depression-like behaviors (Fig. 6).
Fig. 6.
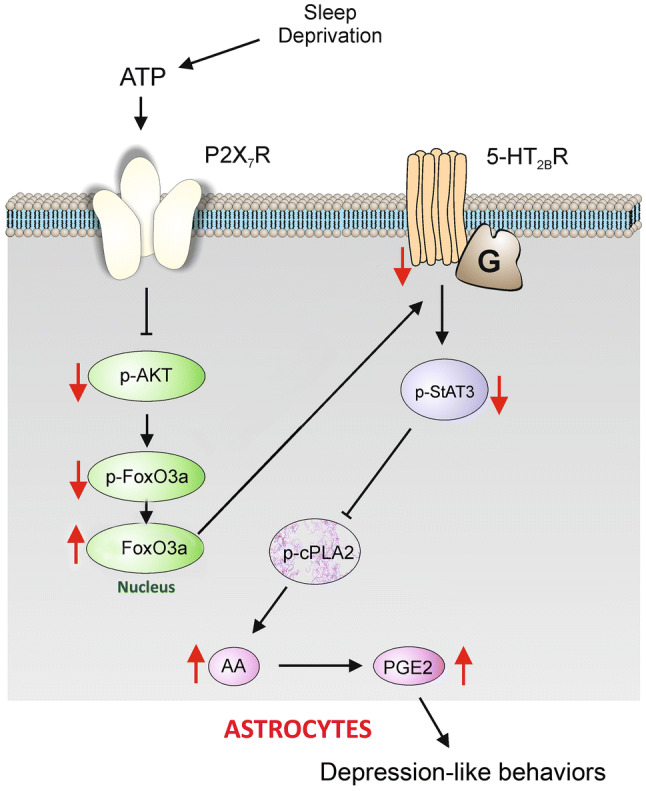
The expression and function of 5-HT2B receptors are selectively decreased by SD through P2X7 receptors in astrocytes. Prolonged SD stimulates P2X7Rs via ATP, the activated P2X7Rs suppress the phosphorylation of AKT and FoxO3a in the cytoplasm, and the dephosphorylated FoxO3a accumulates in the nucleus of astrocytes. The increased FoxO3a down-regulates the expression of 5-HT2BRs, and the phosphorylation of STAT3 is also decreased, which relieves the inhibition of the phosphorylation of cPLA2. The activated cPLA2 promotes the release of AA and PGE2, eventually causing depression-like behaviors.
The mechanisms of sleep are complex and sleep impairments have numerous negative impacts. In this study, we initially found that chronic SD gradually increased the extracellular concentration of ATP in the prefrontal cortex, while the depression-like behaviors induced by SD were mediated by P2X7Rs, a subtype of ionotropic purinoceptor [29]. This contrasts with some reports showing that decreased ATP levels accompany depression-like behaviors in mice [18]. Other reports, however, corroborate our findings. For example, psychological stress has been reported to promote depression-like behaviors by increasing the release of ATP from astrocytes and stimulating neuroinflammation [30]. The sleep-regulating signal triggered by extracellular ATP activates glial P2X7Rs, which stimulate the release of pro-inflammatory cytokines such as TNF-α and IL-1β [31], and potentiate neuroinflammation. Indeed, we found that the activation of NLRP3 inflammasomes induced by prolonged SD was abolished in P2X7R-KO mice, and the effects of prolonged SD on neuronal apoptosis were also eliminated by inhibiting the activation of inflammasomes [4].
In previous reports, we showed that astroglial 5-HT2BRs are the key target of selective serotonin reuptake inhibitors. In particular, fluoxetine directly stimulates astroglial 5-HT2BRs, which thus mediate the anti-depressant action [8, 9, 23, 32]. The elevation of 5-HT2BR expression by leptin enhances the positive effects of fluoxetine on the depressive-like behaviors induced by chronic SD [3]. In the present study, prolonged SD selectively blocked the expression of 5-HT2BRs by activating P2X7Rs in astrocytes (Fig. 1). The activation of P2X7Rs induced by SD decreased the phosphorylation of AKT selectively in astrocytes, but did not change the level of p-AKT in neurons (Fig. 2A, C). Likewise, BzATP induced the dephosphorylation of AKT in primary cultured astrocytes (Fig. 3C); the same effect of BzATP has also been reported in microglia [33]. However, BzATP does not change the activation of AKT in granule neurons [34]. Activated AKT phosphorylates FoxO3a at Ser253 in the cytoplasm [15, 28]. In contrast, dephosphorylation of FOXO3a causes its translocation from the cytoplasm into the nucleus, which triggers downstream gene expression [15, 28]. We demonstrated that stimulation of astrocytic P2X7Rs suppressed the phosphorylation of FoxO3a in vivo and in vitro (Figs. 2B, D, 3D), which promoted the translocation of FoxO3a into the nucleus and inhibited the expression of 5-HT2BRs. Over-expression of FoxO3a in the nucleus decreased the level of 5-HT2BRs (Fig. 3E), while FoxO3a-KO mice presented evident anti-depressive-like behaviors [15].
We previously reported that chronic SD decreases the phosphorylation of STAT3 in astrocytes [3]. In this study, we showed that this decrease was caused by the reduced expression of 5-HT2BRs, because the activation of 5-HT2BRs by an agonist (BW) increased the phosphorylation of STAT3 in astrocytes (Fig. 4C). Although treatment with ATP increases the activation of cPLA2 in spinal cord astrocytes, pre-treatment with leptin eliminates the phosphorylation of cPLA2 induced by ATP via increasing the level of p-STAT3 and caveolin-1, which in turn reduces the release of AA and PGE2 [24]. cPLA2 selectively acts on AA containing acyl chains in vitro [35] and cPLA2 is a crucial enzyme in AA-derived eicosanoid production [36]. PGE2 is metabolized from AA by cyclooxygenase (COX) and is an important regulator of chronic inflammation [37]. Prolonged SD induced the phosphorylation of cPLA2 and increased the release of AA and PGE2 via regulating 5-HT2BRs in astrocytes (Fig. 4).
Both cPLA2 and COX-2 have been associated with major depressive disorder [38, 39], the level of PGE2 increases in depression, and the use of COX-2 inhibitors as antidepressants has been suggested [40]. In this study, chronic SD induced the activation of cPLA2 which triggered the production of AA and PGE2 via P2X7Rs (Fig. 4), while the depression-like behaviors induced by long-term SD were abolished in P2X7R-KO mice (Fig. 5).
In summary, our study revealed the mechanism underlying the depressive-like behaviors induced by chronic SD, and revealed that the decreased expression of 5-HT2BRs induced by SD is mediated through P2X7Rs, the latter being stimulated by increased levels of extracellular ATP. The down-regulated 5-HT2BRs dephosphorylated STAT3 thus relieving the inhibitory effect of STAT3 on the activation of cPLA2. Our results suggest that selective agonists of 5-HT2BRs or reagents that up-regulate the expression of 5-HT2BRs may be considered as therapeutic agents for preventing depression triggered by sleep disorders.
Acknowledgements
This work was supported by the National Natural Science Foundation of China (81871852, 81200935, 81671862, and 81871529), Liaoning Revitalization Talents Program (XLYC1807137), the Scientific Research Foundation for Overseas Scholars of the Education Ministry of China (20151098), and the Natural Science Foundation of Liaoning Province, China (20170541030).
Conflict of interest
The authors report no financial interests or potential conflicts of interest.
Contributor Information
Alexei Verkhratsky, Email: Alexej.Verkhratsky@manchester.ac.uk.
Dawei Guan, Email: dwguan@cmu.edu.cn.
Baoman Li, Email: bmli@cmu.edu.cn.
References
- 1.Alvaro PK, Roberts RM, Harris JK, Bruni O. The direction of the relationship between symptoms of insomnia and psychiatric disorders in adolescents. J Affect Disord. 2017;207:167–174. doi: 10.1016/j.jad.2016.08.032. [DOI] [PubMed] [Google Scholar]
- 2.Goldstein AN, Walker MP. The role of sleep in emotional brain function. Annu Rev Clin Psychol. 2014;10:679–708. doi: 10.1146/annurev-clinpsy-032813-153716. [DOI] [PMC free article] [PubMed] [Google Scholar]
- 3.Li X, Liang S, Li Z, Li S, Xia M, Verkhratsky A, et al. Leptin increases expression of 5-HT2B receptors in astrocytes thus enhancing action of fluoxetine on the depressive behavior induced by sleep deprivation. Front Psychiatry. 2018;9:734. doi: 10.3389/fpsyt.2018.00734. [DOI] [PMC free article] [PubMed] [Google Scholar]
- 4.Xia M, Li X, Yang L, Ren J, Sun G, Qi S, et al. The ameliorative effect of fluoxetine on neuroinflammation induced by sleep deprivation. J Neurochem. 2018;146:63–75. doi: 10.1111/jnc.14272. [DOI] [PubMed] [Google Scholar]
- 5.Chennaoui M, Arnal PJ, Drogou C, Leger D, Sauvet F, Gomez-Merino D. Leukocyte expression of type 1 and type 2 purinergic receptors and pro-inflammatory cytokines during total sleep deprivation and/or sleep extension in healthy subjects. Front Neurosci. 2017;11:240. doi: 10.3389/fnins.2017.00240. [DOI] [PMC free article] [PubMed] [Google Scholar]
- 6.Illes P, Verkhratsky A, Burnstock G, Franke H. P2X receptors and their roles in astroglia in the central and peripheral nervous system. Neuroscientist. 2012;18:422–438. doi: 10.1177/1073858411418524. [DOI] [PubMed] [Google Scholar]
- 7.Backlund L, Lavebratt C, Frisén L, Nikamo P, Hukic Sudic D, Träskman-Bendz L, et al. P2RX7: expression responds to sleep deprivation and associates with rapid cycling in bipolar disorder type 1. PLoS One. 2012;7:e43057. doi: 10.1371/journal.pone.0043057. [DOI] [PMC free article] [PubMed] [Google Scholar]
- 8.Li B, Zhang S, Li M, Hertz L, Peng L. Chronic treatment of astrocytes with therapeutically relevant fluoxetine concentrations enhances cPLA2 expression secondary to 5-HT2B-induced, transactivation-mediated ERK1/2 phosphorylation. Psychopharmacology (Berl) 2009;207:1–12. doi: 10.1007/s00213-009-1631-3. [DOI] [PubMed] [Google Scholar]
- 9.Peng L, Song D, Li B, Verkhratsky A. Astroglial 5-HT2B receptor in mood disorders. Expert Rev Neurother. 2018;30:1–8. doi: 10.1080/14737175.2018.1458612. [DOI] [PubMed] [Google Scholar]
- 10.Qian Y, Cao Y, Deng B, Yang G, Li J, Xu R, et al. Sleep homeostasis regulated by 5HT2b receptor in a small subset of neurons in the dorsal fan-shaped body of drosophila. Elife. 2017;6:e26519. doi: 10.7554/eLife.26519. [DOI] [PMC free article] [PubMed] [Google Scholar]
- 11.Li B, Zhang S, Li M, Hertz L, Peng L. Serotonin increases ERK1/2 phosphorylation in astrocytes by stimulation of 5-HT2B and 5-HT2C receptors. Neurochem Int. 2010;57:432–439. doi: 10.1016/j.neuint.2010.04.017. [DOI] [PubMed] [Google Scholar]
- 12.Xia M, Zhu Y. Signaling pathways of ATP-induced PGE2 release in spinal cord astrocytes are EGFR transactivation-dependent. Glia. 2011;59:664–674. doi: 10.1002/glia.21138. [DOI] [PubMed] [Google Scholar]
- 13.Yue N, Huang H, Zhu X, Han Q, Wang Y, Li B, et al. Activation of P2X7 receptor and NLRP3 inflammasome assembly in hippocampal glial cells mediates chronic stress-induced depressive-like behaviors. J Neuroinflammation. 2017;14:102. doi: 10.1186/s12974-017-0865-y. [DOI] [PMC free article] [PubMed] [Google Scholar]
- 14.Kim JE, Ko AR, Hyun HW, Min SJ, Kang TC. P2RX7-MAPK1/2-SP1 axis inhibits MTOR independent HSPB1-mediated astroglial autophagy. Cell Death Dis. 2018;9:546. doi: 10.1038/s41419-018-0586-x. [DOI] [PMC free article] [PubMed] [Google Scholar]
- 15.Polter A, Yang S, Zmijewska AA, van Groen T, Paik JH, Depinho RA, et al. Forkhead box, class O transcription factors in brain: regulation and behavioral manifestation. Biol Psychiatry. 2009;65:150–159. doi: 10.1016/j.biopsych.2008.08.005. [DOI] [PMC free article] [PubMed] [Google Scholar]
- 16.Xia M, Yang L, Sun G, Qi S, Li B. Mechanism of depression as a risk factor in the development of Alzheimer’s disease: the function of AQP4 and the glymphatic system. Psychopharmacology (Berl) 2017;234:365–379. doi: 10.1007/s00213-016-4473-9. [DOI] [PubMed] [Google Scholar]
- 17.Franken P, Dijk DJ, Tobler I, Borbély AA. Sleep deprivation in rats: effects on EEG power spectra, vigilance states, and cortical temperature. Am J Physiol. 1991;261:R198–R208. doi: 10.1152/ajpregu.1991.261.1.R198. [DOI] [PubMed] [Google Scholar]
- 18.Cao X, Li LP, Wang Q, Wu Q, Hu HH, Zhang M, et al. Astrocyte-derived ATP modulates depressive-like behaviors. Nat Med. 2013;19:773–777. doi: 10.1038/nm.3162. [DOI] [PubMed] [Google Scholar]
- 19.Lundin A, Thore A. Analytical information obtainable by evaluation of the time course of firefly bioluminescence in the assay of ATP. Anal Biochem. 1975;66:47–63. doi: 10.1016/0003-2697(75)90723-X. [DOI] [PubMed] [Google Scholar]
- 20.McElroy WD, DeLuca MA. Firefly and bacterial luminescence: basic science and applications. J Appl Biochem. 1983;5:197–209. [PubMed] [Google Scholar]
- 21.Fu H, Li B, Hertz L, Peng L. Contributions in astrocytes of SMIT1/2 and HMIT to myo-inositol uptake at different concentrations and pH. Neurochem Int. 2012;61:187–194. doi: 10.1016/j.neuint.2012.04.010. [DOI] [PubMed] [Google Scholar]
- 22.Li B, Zhang S, Zhang H, Hertz L, Peng L. Fluoxetine affects GluK2 editing, glutamate-evoked Ca(2 +) influx and extracellular signal-regulated kinase phosphorylation in mouse astrocytes. J Psychiatry Neurosci. 2011;36:322–338. doi: 10.1503/jpn.100094. [DOI] [PMC free article] [PubMed] [Google Scholar]
- 23.Li B, Zhang S, Zhang H, Nu W, Cai L, Hertz L, et al. Fluoxetine-mediated 5-HT2B receptor stimulation in astrocytes causes EGF receptor transactivation and ERK phosphorylation. Psychopharmacology (Berl) 2008;201:443–458. doi: 10.1007/s00213-008-1306-5. [DOI] [PubMed] [Google Scholar]
- 24.Li B, Qi S, Sun G, Yang L, Han J, Zhu Y, et al. Leptin suppresses adenosine triphosphate-induced impairment of spinal cord astrocytes. J Neurosci Res. 2016;94:924–935. doi: 10.1002/jnr.23795. [DOI] [PubMed] [Google Scholar]
- 25.Ren J, Li X, Sun G, Li S, Liang S, Li Z, et al. Protective effect of leptin-mediated caveolin-1 expression on neurons after spinal cord injury. Cell Calcium. 2018;76:122–128. doi: 10.1016/j.ceca.2018.11.003. [DOI] [PubMed] [Google Scholar]
- 26.Xia M, Zhu Y. FOXO3a involvement in the release of TNF-α stimulated by ATP in spinal cord astrocytes. J Mol Neurosci. 2013;51:792–804. doi: 10.1007/s12031-013-0067-8. [DOI] [PubMed] [Google Scholar]
- 27.Xia M, Zhu Y. Fibronectin enhances spinal cord astrocyte proliferation by elevating P2Y1 receptor expression. J Neurosci Res. 2014;92:1078–1090. doi: 10.1002/jnr.23384. [DOI] [PubMed] [Google Scholar]
- 28.Li D, Luo L, Xu M, Wu J, Chen L, Li J, et al. AMPK activates FOXO3a and promotes neuronal apoptosis in the developing rat brain during the early phase after hypoxia-ischemia. Brain Res Bull. 2017;132:1–9. doi: 10.1016/j.brainresbull.2017.05.001. [DOI] [PubMed] [Google Scholar]
- 29.Zhou J, Zhang X, Zhou Y, Wu B, Tan ZY. Up-regulation of P2X7 Receptors Contributes to Spinal Microglial Activation and the Development of Pain Induced by BmK-I. Neurosci Bull. 2019;35:624–636. doi: 10.1007/s12264-019-00345-0. [DOI] [PMC free article] [PubMed] [Google Scholar]
- 30.Iwata M, Ota KT, Li XY, Sakaue F, Li N, Dutheil S, et al. Psychological stress activates the inflammasome via release of adenosine triphosphate and stimulation of the purinergic type 2X7 receptor. Biol Psychiatry. 2016;80:12–22. doi: 10.1016/j.biopsych.2015.11.026. [DOI] [PubMed] [Google Scholar]
- 31.Krueger JM, Huang YH, Rector DM, Buysse DJ. Sleep: a synchrony of cell activity-driven small network states. Eur J Neurosci. 2013;38:2199–2209. doi: 10.1111/ejn.12238. [DOI] [PMC free article] [PubMed] [Google Scholar]
- 32.Peng L, Gu L, Li B, Hertz L. Fluoxetine and all other SSRIs are 5-HT2B agonists - Importance for their therapeutic effects. Curr Neuropharmacol. 2014;12:365–379. doi: 10.2174/1570159X12666140828221720. [DOI] [PMC free article] [PubMed] [Google Scholar]
- 33.He Y, Taylor N, Fourgeaud L, Bhattacharya A. The role of microglial P2X7: modulation of cell death and cytokine release. J Neuroinflammation. 2017;14:135. doi: 10.1186/s12974-017-0904-8. [DOI] [PMC free article] [PubMed] [Google Scholar]
- 34.Ortega F, Pérez-Sen R, Delicado EG, Miras-Portugal MT. P2X7 nucleotide receptor is coupled to GSK-3 inhibition and neuroprotection in cerebellar granule neurons. Neurotox Res. 2009;15:193–204. doi: 10.1007/s12640-009-9020-6. [DOI] [PubMed] [Google Scholar]
- 35.Sundler R, Winstedt D, Wijkander J. Acyl-chain selectivity of the 85-kDa phospholipase A2 and of the release process in intact macrophages. Biochem J. 1994;15:455–458. doi: 10.1042/bj3010455. [DOI] [PMC free article] [PubMed] [Google Scholar]
- 36.Dennis EA, Cao J, Hsu Y, Magrioti V, Kokotos G. Phospholipase A2 enzymes: physical structure, biological function, disease implication, chemical inhibition, and therapeutic intervention. Chem Rev. 2011;111:6130–6185. doi: 10.1021/cr200085w. [DOI] [PMC free article] [PubMed] [Google Scholar]
- 37.Kalinski P. Regulation of immune responses by prostaglandin E2. J Immunol. 2012;188:21–28. doi: 10.4049/jimmunol.1101029. [DOI] [PMC free article] [PubMed] [Google Scholar]
- 38.Gałecki P, Florkowski A, Bieńkiewicz M, Szemraj J. Functional polymorphism of cyclooxygenase-2 gene (G-765C) in depressive patients. Neuropsychobiology. 2010;62:116–120. doi: 10.1159/000317284. [DOI] [PubMed] [Google Scholar]
- 39.Pae CU, Yu HS, Kim JJ, Lee CU, Lee SJ, Lee KU, et al. BanI polymorphism of the cytosolic phospholipase A2 gene and mood disorders in the Korean population. Neuropsychobiology. 2004;49:185–188. doi: 10.1159/000077364. [DOI] [PubMed] [Google Scholar]
- 40.Müller N. COX-2 inhibitors as antidepressants and antipsychotics: clinical evidence. Curr Opin Investig Drugs. 2010;11:31–42. [PubMed] [Google Scholar]