

Abstract
MAG3 scintigraphy with determination of split renal function (SRF) is a standard procedure in patients with metastasized castration-resistant prostate carcinoma (mCRPC) undergoing PSMA radioligand therapy (PSMA-RLT). These patients also receive frequent PSMA PET/CT scans for staging and follow up. PSMA is not only overexpressed in prostate cancer epithelial cells, but also physiologically overexpressed in the proximal tubular cells of the kidney. This study investigates the utility of PSMA-targeted imaging for determination of relative renal function. mCRPC patients (n = 97) having received 68Ga-PSMA-11 PET/CT and 99mTc-MAG3 scintigraphy in close temporal relationship were included in this retrospective study. PSMA-PET-derived SRF was calculated according to the bilateral renal PSMA content (total kidney PSMA = SUVmean × volume), MAG3-based SRF (SRFMAG3) using the common standard integral method of the renal secretion phase. The agreement of SRFPSMA and SRFMAG3 was statistically tested using Pearson correlation and Bland-Altman analysis. The correlation between both SRF assessment methods was highly significant (P < 0.001) with r=0.91. Bland-Altman analysis confirmed agreement of the measurements. High correlation and agreement were also observed in the subgroup analyses of patients with normal and reduced renal function (r=0.81, P < 0.001 and r=0.98, P < 0.001). Renal tubular PSMA expression allows assessment of split renal function by 68Ga-PSMA-11 PET/CT imaging. Additional MAG3 scintigraphy for the purpose of quantifying relative renal function contribution may be spared in settings where PSMA PET is performed; this insight could save time and unnecessary examinations.
Keywords: Split renal function, PSMA, MAG3, prostate cancer, PET/CT
Introduction
Prostate carcinoma is one of the most frequent malignant diseases in men [1]. Prostate specific membrane antigen (PSMA), a type II transmembrane protein [2], is commonly overexpressed on the surface of prostate carcinoma cells [3-5]. This makes PSMA an important target for diagnostic imaging and therapy [6]. PSMA imaging, particularly using 68Ga-PSMA-11 as PET/CT tracer, has proven its validity in staging of prostate cancer [7,8] and therapy monitoring in advanced disease [9,10]. Likewise, radioligand therapy (RLT) with 177Lu labelled PSMA ligands (PSMA-RLT) is becoming increasingly important, predominantly in late stage of metastasized castration-resistant prostate cancer (mCRPC). PSMA-RLT yields impressive results in the palliative setting [11,12]. However, renal tracer uptake due to physiologic overexpression of PSMA in the proximal tubules [13-15] leads to minor radiation doses of the kidney, and might at least theoretically induce radiation-related nephrotoxicity [16,17]. While recent studies have not confirmed significant short-term damage to the kidneys resulting from of PSMA-RLT [18], the risk for long-term complications has still to be investigated. This proves challenging in a cohort with a limited life-time expectancy and scarce follow up data.
Renal function is closely monitored in patients undergoing PSMA-RLT. The easiest method to assess renal function in clinical routine is estimating glomerular filtration rate (eGFR) using the modification of diet in renal disease (MDRD) formula [19], based on renal retention parameter creatinine. However, this method does not provide information on the relative (side-related) distribution of renal function and outflow conditions. The current standard and well-established method for assessment of split renal function (SRF) and outflow conditions is dynamic renal scintigraphy using 99mTc labelled MAG3 (mercaptoacetyltriglycine). MAG3 is almost exclusively excreted by secretion in the proximal tubules of the kidney [20], giving an accurate estimation of tubular renal function which can be used to determine split renal function. Split renal function, also known as differential renal function, describes the relative proportion of each kidney on total renal function. Issues with MAG3 scintigraphy may arise from its time-consuming nature with commonly 30-50 minutes per examination and potential distress to mCRPC patients often suffering from painful skeletal metastases.
The described clinical setting encouraged us to investigate the utility of PSMA-targeted imaging for determination of relative renal function by comparing PSMA-PET-derived SRF and standard MAG3-based SRF. We evaluate retrospectively this approach in a patient cohort of mCRPC patients having undergone both imaging modalities.
Materials and methods
In this retrospective study we calculated split renal function using PSMA PET/CT (SRFPSMA) and compared the results to MAG3 derived split renal function (SRFMAG3). The study was performed in accordance with the Declaration of Helsinki and with national regulations. Approval of the retrospective analysis was waived by the local ethics committee. All patients provided written informed consent for the examinations and for scientific analysis and publication of data.
Patients
In total, n=97 patients treated with 177Lu-PSMA-RLT in the advanced mCRPC setting were included in this study. Every patient obtained PSMA PET/CT and MAG3 scintigraphy in close temporal relationship within a period of 1 week. Table 1 gives a detailed overview of the patient cohort.
Table 1.
Patient characteristics
| Characteristics | |
|---|---|
| Number of patients | 97 |
| Age | (years) |
| min | 46 |
| max | 89 |
| mean | 70 |
| Metastases | (n) |
| bone | 90 |
| lymph nodes | 71 |
| liver | 20 |
| lung | 15 |
| others | 15 |
| Previous therapy | (n) |
| first line chemotherapy | 62 |
| second line chemotherapy | 22 |
| ADT | 95 |
| eGFR | (ml/min) |
| min | 26.8 |
| max | 118.9 |
| mean | 78.0 |
| < 60 ml/min | n=20 |
| ≥ 60 ml/min | n=77 |
| PSA | (ng/ml) |
| min | 0.21 |
| max | 4525 |
| mean | 477 |
| median | 217 |
Imaging methods
68Ga-PSMA-11 PET/CT
Each patient of this study (n=97) received a 68Ga-PSMA-11-PET/CT with a mean intravenously injected activity of 121 ± 15 MBq of a 68Ga-PSMA-11. The incubation time between injection and PET acquisition was 60 minutes. No additional contrast media or diuretics were applied. PET datasets were acquired on a Biograph 40 mCT PET/CT scanner (Siemens Medical Solutions, Knoxville, TN, USA) with an acquisition time of 3 min per bed position, covering an extended field of view (FOV) of 21.4 cm. The images were iteratively reconstructed using a 3-dimensional OSEM (ordered-subset expectation maximization) algorithm (3 iterations; 24 subsets) with 5 mm gaussian filtering and slice thickness of 5 mm. A standard low-dose spiral CT was acquired for attenuation correction and anatomical localization using an x-ray tube voltage of 120 keV and a modulation of the tube current using CARE Dose4D with a maximal tube current time product of 30 mAs. To calculate relative PSMA distribution in both kidneys volumes of interest were used (VOI), drawn and generated using the syngo.via software (Siemens Healthineers, Erlangen, Germany). Each VOI was manually drawn as to contain the kidney. Setting a threshold of 30% of the maximum standard uptake volume (SUVmax) was best suited to delineate the renal tissue in the selected area by autocontouring, as shown in Figure 1A. Accuracy of the auto-contouring tool was controlled visually by comparing the results with the actual kidney size on low-dose CT. If non-renal tissue was within the selection (i.e. tracer retention in the renal pelvis) it was cropped and removed manually. The volume and the mean standard uptake value (SUVmean) were then used for calculating of SRF: SRFright = (volumeright × SUVmeanright)/(volumeright × SUVmeanright + volumeleft × SUVmeanleft).
Figure 1.
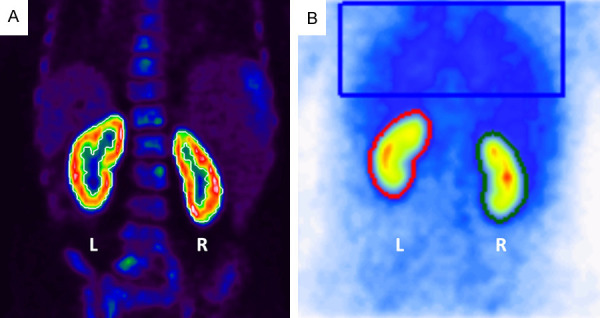
A. Renal PSMA quantification. SUV-threshold for selection of renal tissue was set at 30% of SUVmax using auto-contouring (white). Renal pelvic activity such as in obstructive nephropathy was manually excluded from analysis. B. Renal MAG3 with ROI placement (left kidney: red, right kidney: green, background: blue).
99mTc-MAG3 scintigraphy
Each patient of this study (n=97) received renal scintigraphy with a mean intravenously injected activity of 99.4 ± 13.4 MBq of 99mTc-MAG3. Dynamic images starting at time of injection were acquired using a Diacam Scintron (MiE medical imaging electronics, Seth, Germany) with a low energy high-resolution collimator (LEHR). MiE software was used for data analysis. Manual regions of interest (ROI) were drawn closely around each kidney. Background correction (rectangular ROI placed in the thorax region) was applied. SRFMAG3 was calculated based on the renal secretion phase (first 2 minutes) using integral method, which is described in detail in [21]. Standard furosemide administration after 30 min in cases of renal retention with subsequent 20 min imaging was performed to check for reno-ureteral obstruction.
Statistical analysis
For statistical analysis, Pearson’s correlation coefficient was used to measure the strength of the relationship of both methods of SRF calculation. A two-sided p-value < 0.05 was considered statistically significant. In addition, a Bland-Altman-Plot [22,23] was generated to assess the agreement between both methods. Limits of agreement were set with a confidence interval (CI) of 95%. Statistical analysis was conducted using IBM SPSS Statistics 25.
Results
Mean SRF of the right kidney was 50.5 % (range: 4.5-99.7%) and 50.3% (range: 11.4-96.8%) using PSMA PET/CT and MAG3 scintigraphy, respectively. Table 2 presents descriptive statistics of our data. The correlation between PSMA and MAG3 derived SRF was highly significant (P < 0.001) with a correlation coefficient of r=0.91 (Figure 2A). The Bland-Altman plot analysis (Figure 2B) shows an agreement of the highly correlated measurements with a mean difference of 0.002 [CI -0.110; 0.114]. This agreement was also observed visually; Figure 3 shows two representative cases.
Table 2.
Descriptive statistics of split renal function of the right kidney measured by PSMA PET imaging and by standard renal scintigraphy
| Type of Measurement | Mean (%) | SD (%) | Min (%) | Max (%) |
|---|---|---|---|---|
| 68Ga-PSMA-11 PET | 50.5 | 13.2 | 4.5 | 99.7 |
| 99mTc-MAG-3 scintigraphy | 50.3 | 13.0 | 11.4 | 96.8 |
Figure 2.
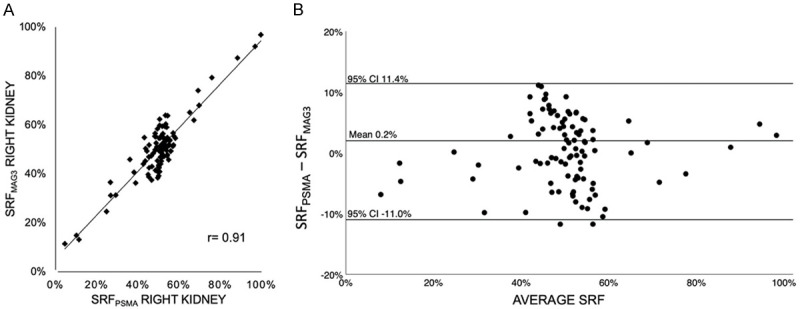
(A) Pearson correlation coefficient (r=0.91, P < 0.001) and (B) Bland-Altman-Plot of SRFPSMA and SRFMAG3 of the entire cohort (n=98).
Figure 3.
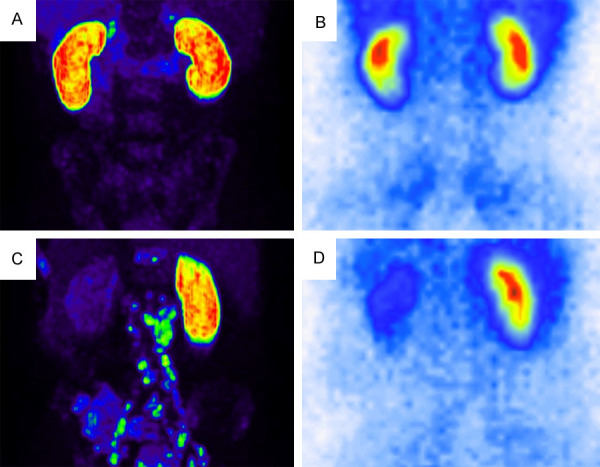
Example of two representative cases with bilaterally equal SRF (A) PSMA PET [SRFright: 49.9%], (B) MAG3 scintigraphy [SRFright: 48.4%]) and laterally different SRF (C) PSMA PET [SRFright: 79.3%], (D) MAG3 scintigraphy [SRFright: 76.0%]).
As illustrated in Figures 4 and 5, in both subgroup analyses of n=77 patients with normal renal function (eGFR ≥ 60 ml/min), and n=20 patients with reduced renal function (eGFR < 60 ml/min) a high correlation of both methods was seen (r=0.83, P < 0.001 and r=0.98, P < 0.001), as well as an agreement in the Bland-Altman analysis (mean: -0.002 [CI -0.118; 0.116], mean: 0.018 [CI -0.072; 0.108]). Unilateral reno-ureteral obstruction defined by standard criteria as > 50% renal tracer retention in MAG3 scintigraphy 20 min after furosemide administration was observed in 14 patients. In 13 of these 14 patients (92.9 %) obstruction was visually discernable on PSMA imaging. Figure 6 illustrates a representative case for this aspect.
Figure 4.
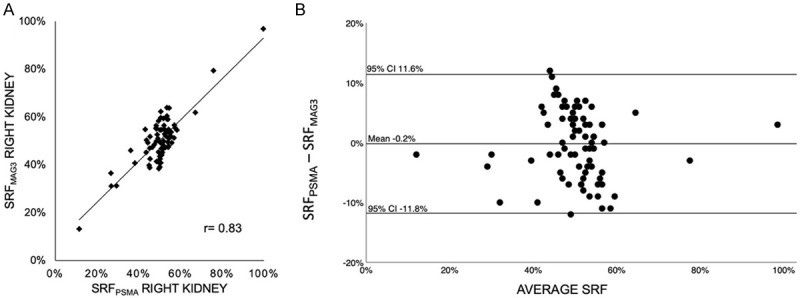
(A) Pearson correlation coefficient (r=0.83, P < 0.001) and (B) Bland-Altman-Plot of SRFPSMA and SRFMAG3 in patients (n=77) with normal renal function (GFR ≥ 60 ml/min).
Figure 5.
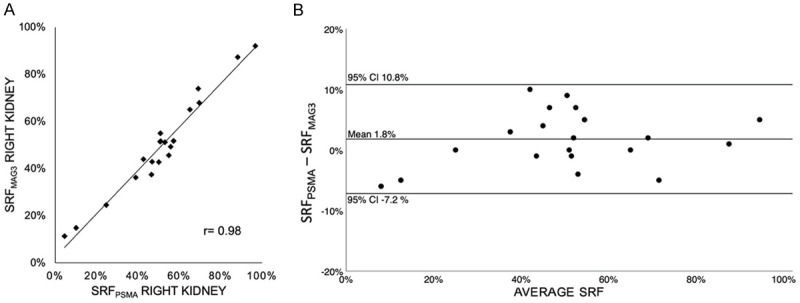
(A) Pearson correlation coefficient (r=0.98, P < 0.001) and (B) Bland-Altman-Plot of SRFPSMA and SRFMAG3 in patients (n=20) with reduced renal function (GFR < 60 ml/min).
Figure 6.
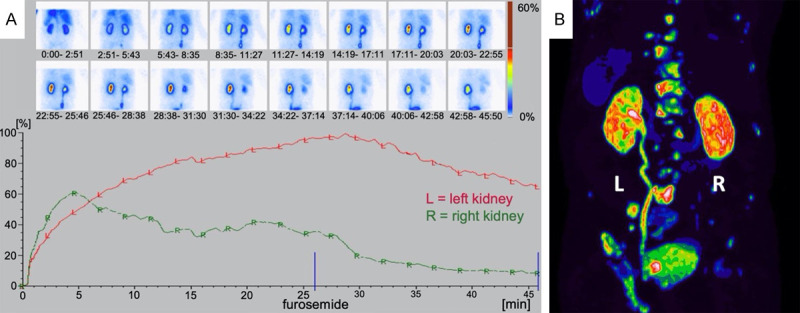
Example of reno-ureteral obstruction seen in a patient; A. MAG3 scintigraphy revealing tracer retention of > 50% on the left side after furosemide administration, B. PSMA PET showing intense tracer accumulation in the dilated left ureter and renal pelvis.
Discussion
As a proof of principle, this retrospective study on n=97 patients with dual assessment by 68Ga-PSMA-11 PET and standard renal scintigraphy with 99mTc-MAG3 demonstrates that PSMA-targeted radioligand imaging allows assessment of split renal function (SRF). We provide a preliminary first proof that renal PSMA expression in the proximal tubules of the kidney is a surrogate marker of functional renal tissue.
The calculated highly significant correlation (r=0.91, P < 0.001) of SRFPSMA and SRFMAG3 is similar to other established renal function assessment methods. 99mTc-DMSA and 99mTc-MAG3 scintigraphy achieved correlations in the range of r=0.82-0.99 [24-27]. Other reported approved methods of SRF assessment are within the same range of correlation [28-31]. Table 3 compiles SRF correlations between two different methods reported in literature. With a Bland-Altman analysis revealing a mean difference of 0.002 with 95%-CI of [-0.110; 0.114] our results suggest that PSMA-derived SRF is in good agreement with the established MAG3 scintigraphy-derived SRF. A variance up to in the order of 10% within the largely symmetrical bilateral renal function range (40-60% SRF) is clinically less relevant and seen within other historical comparison of established methods of SRF assessment [30,31]. Asymmetrical renal function distribution is very accurately quantified by PSMA imaging. In addition, the correlation and Bland-Altman agreement of SRFPSMA and SRFMAG3 is not affected by renal function, as indicated by our subgroup analysis of patients with normal and reduced renal function showing similar results.
Table 3.
Reported correlations between different methods of split renal function assessment
| Study | Year | N | Method 1 | Method 2 | Correlation |
|---|---|---|---|---|---|
| Piepsz et al. | 1978 | n=19 | Renal catheter | DTPA | 0.94 |
| Chanard et al. | 1982 | n=14 | Renal catheter | DTPA | 0.94 |
| Llams-Elvira et al. | 1989 | n=100 | MAG3 | DMSA | 0.97 |
| Bair et al. | 1995 | n=37 | MAG3 | DMSA | 0.82-0.99 |
| Ardela Díaz et al. | 2002 | n=138 | MAG3 | DMSA | 0.92-0.96 |
| Miyazaki et al. | 2010 | n=60 | DMSA | DTPA | 0.83 |
| Aktaş et al. | 2010 | n=19 | MAG3 | DMSA | 0.84 |
| Momin et al. | 2018 | n=50 | DMSA | DTPA | 0.99 |
| Present study | 2020 | n=97 | PSMA | MAG3 | 0.91 |
Another observation in our study was the depiction of reno-ureteral obstruction by PSMA imaging in most cases (92.9%), which encourages the thorough PET reading in this regard.
The presented results of this study are of particular interest in pre- and post-treatment management of mCRPC patients, in which PSMA PET/CT is a frequently performed imaging method for staging and restaging. With the presented new insights, these PSMA-PET/CTs can be used to calculate SRF at baseline of PSMA-RLT and to detect unilateral changes during follow-up, potentially induced by tumor-obstructive nephropathies or therapy-induced nephrotoxicity. Additional MAG3 scintigraphy might be dispensable, as shown by our study, sparing patients from unnecessary radiation exposure and distress.
Limitations
The retrospective nature and the number of patients (n=97) may limit the strength of conclusions. The study comprises no representative cross-section of normal population, as only men with advanced, metastasized castration-resistant prostate cancer were investigated. This may be seen as another limitation for generalizing conclusions. A larger confirmatory study would be highly warranted to confirm the results.
Conclusion
Renal tubular PSMA expression allows assessment of split renal function (SRF) by 68Ga-PSMA-11 PET/CT imaging. SRF derived by PSMA PET and MAG3 scintigraphy are in good agreement. Additional MAG3 scintigraphy in order to quantify relative renal function contribution may be spared; larger analyses are warranted to confirm our findings and establish this approach to save time, distress and unnecessary radiation exposure for the patients.
Disclosure of conflict of interest
None.
References
- 1.Torre LA, Bray F, Siegel RL, Ferlay J, Lortet-Tieulent J, Jemal A. Global cancer statistics, 2012. CA Cancer J Clin. 2015;65:87–108. doi: 10.3322/caac.21262. [DOI] [PubMed] [Google Scholar]
- 2.Beckett ML, Cazares LH, Vlahou A, Schellhammer PF, Wright GL. Prostate-specific membrane antigen levels in sera from healthy men and patients with benign prostate hyperplasia or prostate cancer. Clin Cancer Res. 1999;5:4034–40. [PubMed] [Google Scholar]
- 3.Ghosh A, Heston WD. Tumor target prostate specific membrane antigen (PSMA) and its regulation in prostate cancer. J Cell Biochem. 2004;91:528–39. doi: 10.1002/jcb.10661. [DOI] [PubMed] [Google Scholar]
- 4.Israeli RS, Powell CT, Corr JG, Fair WR, Heston WD. Expression of the prostate-specific membrane antigen. Cancer Res. 1994;54:1807–11. [PubMed] [Google Scholar]
- 5.Heston WD. Characterization and glutamyl preferring carboxypeptidase function of prostate specific membrane antigen: a novel folate hydrolase. Urology. 1997;49:104–12. doi: 10.1016/s0090-4295(97)00177-5. [DOI] [PubMed] [Google Scholar]
- 6.Afshar-Oromieh A, Babich JW, Kratochwil C, Giesel FL, Eisenhut M, Kopka K, Haberkorn U. The rise of PSMA ligands for diagnosis and therapy of prostate cancer. J Nucl Med. 2016;57:79S–89S. doi: 10.2967/jnumed.115.170720. [DOI] [PubMed] [Google Scholar]
- 7.Eissa A, Elsherbiny A, Coelho RF, Rassweiler J, Davis JW, Porpiglia F, Patel VR, Prandini N, Micali S, Sighinolfi MC, Puliatti S, Rocco B, Bianchi G. The role of 68Ga-PSMA PET/CT scan in biochemical recurrence after primary treatment for prostate cancer: a systematic review of the literature. Minerva Urol Nefrol. 2018;70:462–78. doi: 10.23736/S0393-2249.18.03081-3. [DOI] [PubMed] [Google Scholar]
- 8.Verburg FA, Pfestroff A. PSMA PET-CT in initial prostate cancer staging. Nat Rev Urol. 2016;13:498–9. doi: 10.1038/nrurol.2016.136. [DOI] [PubMed] [Google Scholar]
- 9.Ceci F, Herrmann K, Hadaschik B, Castellucci P, Fanti S. Therapy assessment in prostate cancer using choline and PSMA PET/CT. Eur J Nucl Med Mol Imaging. 2017;44:78–83. doi: 10.1007/s00259-017-3723-3. [DOI] [PubMed] [Google Scholar]
- 10.Heinzel A, Boghos D, Mottaghy FM, Gaertner F, Essler M, von Mallek D, Ahmadzadehfar H. 68Ga-PSMA PET/CT for monitoring response to 177Lu-PSMA-617 radioligand therapy in patients with metastatic castration-resistant prostate cancer. Eur J Nucl Med Mol Imaging. 2019;46:1054–62. doi: 10.1007/s00259-019-4258-6. [DOI] [PubMed] [Google Scholar]
- 11.Kim YJ, Kim Y. Therapeutic responses and survival effects of 177Lu-PSMA-617 radioligand therapy in metastatic castrate-resistant prostate cancer: a meta-analysis. Clin Nucl Med. 2018;43:728–34. doi: 10.1097/RLU.0000000000002210. [DOI] [PubMed] [Google Scholar]
- 12.Fendler WP, Rahbar K, Herrmann K, Kratochwil C, Eiber M. 177Lu-PSMA radioligand therapy for prostate cancer. J Nucl Med. 2017;58:1196–200. doi: 10.2967/jnumed.117.191023. [DOI] [PubMed] [Google Scholar]
- 13.Rajasekaran AK, Anilkumar G, Christiansen JJ. Is prostate-specific membrane antigen a multifunctional protein? Am J Physiol Cell Physiol. 2005;288:C975–81. doi: 10.1152/ajpcell.00506.2004. [DOI] [PubMed] [Google Scholar]
- 14.Kinoshita Y, Kuratsukuri K, Landas S, Imaida K, Rovito PM Jr, Wang CY, Haas GP. Expression of prostate-specific membrane antigen in normal and malignant human tissues. World J Surg. 2006;30:628–36. doi: 10.1007/s00268-005-0544-5. [DOI] [PubMed] [Google Scholar]
- 15.Silver DA, Pellicer I, Fair WR, Heston WD, Cordon-Cardo C. Prostate-specific membrane antigen expression in normal and malignant human tissues. Clin Cancer Res. 1997;3:81–5. [PubMed] [Google Scholar]
- 16.Forrer F, Rolleman E, Bijster M, Melis M, Bernard B, Krenning EP, de Jong M. From outside to inside? Dose-dependent renal tubular damage after high-dose peptide receptor radionuclide therapy in rats measured with in vivo 99mTc-DMSA-SPECT and molecular imaging. Cancer Biother Radiopharm. 2007;22:40–9. doi: 10.1089/cbr.2006.353. [DOI] [PubMed] [Google Scholar]
- 17.Violet J, Jackson P, Ferdinandus J, Sandhu S, Akhurst T, Iravani A, Kong G, Kumar AR, Thang SP, Eu P, Scalzo M, Murphy D, Williams S, Hicks RJ, Hofman MS. Dosimetry of 177Lu-PSMA-617 in Metastatic castration-resistant prostate cancer: correlations between pretherapeutic imaging and whole-body tumor dosimetry with treatment outcomes. J Nucl Med. 2019;60:517–23. doi: 10.2967/jnumed.118.219352. [DOI] [PubMed] [Google Scholar]
- 18.Yordanova A, Becker A, Eppard E, Kürpig S, Fisang C, Feldmann G, Essler M, Ahmadzadehfar H. The impact of repeated cycles of radioligand therapy using [177Lu]Lu-PSMA-617 on renal function in patients with hormone refractory metastatic prostate cancer. Eur J Nucl Med Mol Imaging. 2017;44:1473–9. doi: 10.1007/s00259-017-3681-9. [DOI] [PubMed] [Google Scholar]
- 19.Levey AS. A more accurate method to estimate glomerular filtration rate from serum creatinine: a new prediction equation. Ann Intern Med. 1999;130:461–70. doi: 10.7326/0003-4819-130-6-199903160-00002. [DOI] [PubMed] [Google Scholar]
- 20.Fritzberg AR, Kasina S, Eshima D, Johnson DL. Synthesis and biological evaluation of technetium-99m MAG3 as a hippuran replacement. J Nucl Med. 1986;27:111–6. [PubMed] [Google Scholar]
- 21.Piepsz A, Tondeur M, Ham H. Relative 99mTc-MAG3 renal uptake: reproducibility and accuracy. J Nucl Med. 1999;40:972–6. [PubMed] [Google Scholar]
- 22.Bland JM, Altman DG. Statistical methods for assessing agreement between two methods of clinical measurement. Lancet. 1986;1:307–10. [PubMed] [Google Scholar]
- 23.Giavarina D. Understanding bland altman analysis. Biochem Med. 2015;25:141–51. doi: 10.11613/BM.2015.015. [DOI] [PMC free article] [PubMed] [Google Scholar]
- 24.Llamas-Elvira JM, Martinez-Paredes M, Jimenez-Heffernan A, Sopena R, Requena MJ, Gonzalez FM, Torres M, Mateo A. 99Tcm-MAG3 for quantitation of differential renal function. Nucl Med Commun. 1989;10:759–64. doi: 10.1097/00006231-198910000-00008. [DOI] [PubMed] [Google Scholar]
- 25.Bair HJ, Becker W, Schott G, Kühn RH, Wolf F. Is there still a need for Tc-99m DMSA renal imaging? Clin Nucl Med. 1995;20:18–21. doi: 10.1097/00003072-199501000-00004. [DOI] [PubMed] [Google Scholar]
- 26.Ardela Díaz E, Miguel Martínez B, Gutiérrez Dueñas JM, Díez Pascual R, García Arcal D, Domínguez Vallejo FJ. Comparative study of differential renal function by DMSA and MAG-3 in congenital unilateral uropathies. Cir Pediatr. 2002;15:118–21. [PubMed] [Google Scholar]
- 27.Aktaş GE, Inanir S. Relative renal function with MAG-3 and DMSA in children with unilateral hydronephrosis. Ann Nucl Med. 2010;24:691–5. doi: 10.1007/s12149-010-0397-3. [DOI] [PubMed] [Google Scholar]
- 28.Piepsz A, Denis R, Ham HR, Dobbeleir A, Schulman C, Erbsmann F. A simple method for measuring separate glomerular filtration rate using a single injection of 99mTc-DTPA and the scintillation camera. J Pediatr. 1978;93:769–74. doi: 10.1016/s0022-3476(78)81074-9. [DOI] [PubMed] [Google Scholar]
- 29.Chanard J, Ruiz JC, Liehn JC, Lemaire P, Brunois JP, Lardennois B, Valeyre J. Assessment of divided renal function by renography. Validation in patients with separate urine collections from each kidney. Clin Nephrol. 1982;18:291–6. [PubMed] [Google Scholar]
- 30.Miyazaki C, Harada H, Shuke N, Okizaki A, Miura M, Hirano T. 99mTc-DTPA dynamic SPECT and CT volumetry for measuring split renal function in live kidney donors. Ann Nucl Med. 2010;24:189–95. doi: 10.1007/s12149-010-0349-y. [DOI] [PubMed] [Google Scholar]
- 31.Momin MA, Abdullah MNA, Reza MS. Comparison of relative renal functions calculated with 99m Tc-DTPA and 99m Tc-DMSA for kidney patients of wide age ranges. Phys Med. 2018;45:99–105. doi: 10.1016/j.ejmp.2017.12.005. [DOI] [PubMed] [Google Scholar]