

Abstract
Introduction: Red cell distribution (RDW) is associated with atrial fibrillation (AF) incidence. However, its relationship with precursors of AF has not been established. We aim to investigate if association exists between RDW and negative P wave amplitude in V1, a marker of left atrial abnormality. Methods: NHANES III is a complex, multistage, clustered design survey of noninstitutionalized United States population between 1988-94. A Sample of 6403 individuals was extracted after excluding missing demographic, laboratory, anthropometric and ECG data and major ECG abnormalities. Variables were selected and univariate analysis was done first with a level of significance at P<0.01 (99% confidence). All the significant variables were included in a multivariate linear regression model. Results: 53.58% of subjects were female. Racial distribution was caucasian 50.2%, hispanic 23.9% and african american 21.7%. Age, PR interval, heart rate, systolic blood pressure, red cell distribution width, glycated hemoglobin, serum cholesterol, serum ferritin, and body mass index showed a significant correlation with negative P wave amplitude in V1 (P<0.001). After including all these variables in a multivariate regression model, only age, body mass index, systolic blood pressure, PR interval, heart rate and red cell distribution width had a P≤0.001. Conclusions: Increased RDW is independently associated with negative P wave amplitude in V1 after correcting for other cardiovascular risk factors. Further studies are required to analyze the reason for this correlation.
Keywords: RDW, p-wave, NHANES III
Introduction
Red cell distribution width (RDW) expressed as a percentage is a measure of variation of red blood cell size (anisocytosis) [1]. RDW is the width of the erythrocyte volume histogram at one standard deviation divided by the mean corpuscular volume. Elevated RDW was initially used in the diagnosis of iron deficiency anemia [1]. However, there has been increased research interest since its association with increased all-cause mortality, heart failure mortality [2] cardiovascular mortality [3] and incidence of atrial fibrillation (AF) and its recurrence post-ablation was found [4,5]. Oxidative stress, an important mechanism for pathogenesis of AF, also increases RDW [5,6].
One of the electrocardiographic manifestations of left atrial conduction abnormality is increased amplitude in negative component of the biphasic P wave in lead V1 of the surface 12-lead ECG. This finding has been demonstrated to be a precursor of AF [7]. Studies have shown an association between increased negative P wave amplitude in V1 and increased mortality [8,9]. Given the fact, that both RDW and negative P wave amplitude in V1 have been associated with cardiovascular mortality, and inflammatory/oxidative stress is associated with AF and RDW, we hypothesize that RDW may be predictive of ECG abnormalities suggesting left atrial pathology and that RDW can provide important insights into the pathophysiology of AF. We used the NHANES III (National Health and Nutrition Examination Survey) to explore this hypothesis.
Clinical importance
Elevated RDW is a readily available biomarker may indicate left atrial pathology and patients at risk for AF.
Further research on RDW in combination with systolic blood pressure, age, body mass index and resting heart rate to risk stratify patients for the development of AF needs to be developed.
Methods
NHANES III is a survey of over 30000 individuals designed by National Center of Health Statistics (NCHS) conducted between 1988-1994 using a complex, multistage, clustered design to represent the civilian, community-based United States population. More information on survey methods is available at https://wwwn.cdc.gov/nchs/nhanes/nhanes3/default.aspx. ECGs were recorded at the NHANES III mobile examination centers by trained technicians and then transferred to a central ECG core lab for processing. Minnesota coding was performed including rhythm analysis, determination of major and minor ECG abnormalities, and selective averaging to obtain representative durations and amplitudes of ECG components. Institutional Review board of the Centers for Disease Control and Prevention approved NHANES survey.
Data belonging to 7,771 individuals was extracted after excluding missing demographic, laboratory, anthropometric and ECG data. Major ECG abnormalities were excluded and a final sample of 6403 was analyzed (Figure 1). Age, glycated hemoglobin (as an indicator of diabetes), systolic blood pressure, diastolic blood pressure, body mass index and ECG parameters PR interval, heart rate were analyzed. Serum iron, ferritin, hemoglobin and TIBC were included to reduce confounding from these hematologic parameters.
Figure 1.
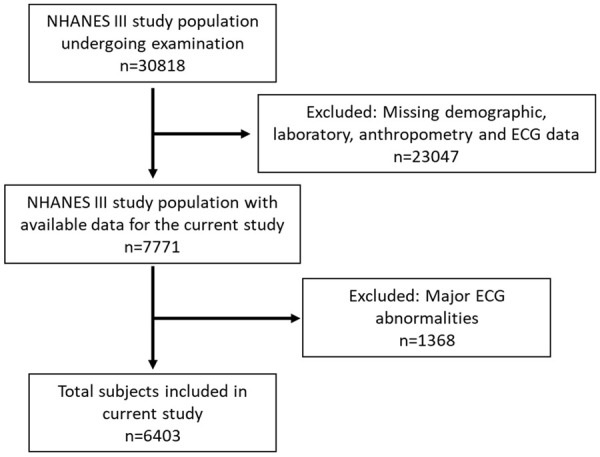
Patient flow diagram.
Statistical analysis
Statistical analysis were performed using IBM SPSS Statistics Version 25 (IBM Corp). All analysis adhered to the analytical guidelines published by NCHS. Continuous variables are presented as means with standard deviations and medians with interquartile range. Categorical variables were presented at proportions. All variables except sex and race were analyzed as continuous variables. Pearson correlation was used to find correlation between negative P wave amplitude and the other variables, p values <0.01 were considered statistically significant. After the univariate analysis, variables with a significant association in the unadjusted analysis were included in the multivariate model.
Results
Baseline characteristics
The study included a total of 6403 participants of which 53.58% were female. The majority of the study subjects were caucasian 50.2%, followed by hispanic 23.9% and african american 21.7%. The mean age was 59.3±13.1 years, BMI was 27.6±5.4 kg/m2 and systolic and diastolic blood pressures were 132±19 mmHg and 76±10 mmHg respectively (Table 1).
Table 1.
Baseline characteristics
| Normal Ranges | Mean ± SD | Median [Interquartile Range] | Count | |
|---|---|---|---|---|
| Age in months at interview (screener) | 712 ± 158 | 704 [568-834] | ||
| Female (sex) | 3431 (53.58%) | |||
| Race-White | 3214 (50.2%) | |||
| African American | 1387 (21.7%) | |||
| Mexican American | 1531 (23.9%) | |||
| Others | 271 (4.2%) | |||
| Red cell distribution width (%) | 12.5-14.5 | 13.27 ± 1.19 | 13.05 [12.60-13.65] | |
| Hemoglobin (g/dL) | Male: 13.5-17.5, female: 12.0-15.5 | 13.93 ± 1.46 | 13.95 [13.0-14.9] | |
| Serum iron (ug/dL) | 60-170 | 85 ± 35 | 81 [61-104] | |
| Serum TIBC (ug/dL) | 240-450 | 347 ± 55 | 342 [310-377] | |
| Serum cholesterol (mg/dL) | less than 170 | 219 ± 50 | 215 [189-244] | |
| Glycated hemoglobin: (%) | 4-5.6 | 5.77 ± 1.24 | 5.50 [5.2-5.9] | |
| Heart rate (beats per minute) | 60-100 | 69 ± 11 | 67 [61-76] | |
| PR interval (msec) | 120-200 | 163 ± 27 | 161 [145-179] | |
| Diastolic blood pressure (mmHg) | 60-80 | 76 ± 10 | 76 [70-82] | |
| Systolic blood pressure (mmHg) | 90-120 | 132 ± 19 | 129 [118-143] | |
| P amplitude, negative phase, lead V1 (uV) | Less than -100 | -40 ± 26 | -37 [-55--22] | |
| QRS interval (msec) | 80-100 | 96 ± 10 | 96 [89-102] | |
| Body mass index (kg/m2) | Less than 25 | 27.64 ± 5.47 | 26.90 [24.0-30.4] |
Factors correlating with negative P wave amplitude in V1
Age, PR interval, heart rate, systolic blood pressure, red cell distribution width, glycated hemoglobin, serum cholesterol, serum ferritin, and body mass index showed a significant univariate correlation (P<0.001) with negative P wave amplitude in V1 (Table 2).
Table 2.
Pearson correlation and Multivariate linear regression analysis
| Univariate correlation | Multivariate linear regression model* | |||||||
|---|---|---|---|---|---|---|---|---|
|
|
|
|||||||
| Pearson Correlation | P value | Parameter estimate | Standard error | t | P value | 95% Confidence Intervals | ||
| Intercept | 60.02511 | 4.83437 | 12.42 | <.0001 | 50.54812 | 69.50209 | ||
| Age (months) | -0.272 | <0.001 | -0.033 | 0.002 | -14.97 | <0.001 | -0.037 | -0.029 |
| Hemoglobin (g/dL) | -0.029 | 0.021 | - | - | - | |||
| Body mass index (kg/m2) | -0.051 | <0.001 | -0.19788 | 0.05828 | -3.40 | 0.0007 | -0.31212 | -0.08364 |
| Systolic Blood Pressure (mm Hg) | -0.048 | <0.001 | -0.11847 | 0.01810 | -6.54 | <.0001 | -0.15395 | -0.08298 |
| Diastolic Blood Pressure (mm Hg) | -0.020 | 0.11 | - | - | - | |||
| PR interval (msec) | -0.180 | <0.001 | -0.13542 | 0.01174 | -11.53 | <.0001 | -0.15843 | -0.11240 |
| Heart rate (beats per minute) | -0.071 | <0.001 | -0.18561 | 0.02776 | -6.69 | <.0001 | -0.24003 | -0.13120 |
| P axis, frontal plane (degrees) | 0.012 | 0.328 | - | - | - | |||
| Glycated hemoglobin (%) | -0.064 | <0.001 | -0.20182 | 0.25311 | -0.80 | 0.4253 | -0.69800 | 0.29436 |
| Serum cholesterol (mg/dL) | -0.063 | <0.001 | -0.01517 | 0.00690 | -2.20 | 0.0280 | -0.02870 | -0.00164 |
| Serum ferritin (ng/mL) | -0.047 | <0.001 | -0.00203 | 0.00188 | -1.08 | 0.2805 | -0.00571 | 0.00166 |
| Serum TIBC (umol/L) | -0.002 | 0.879 | - | - | - | |||
| Serum iron (umol/L) | 0.020 | 0.112 | - | - | - | |||
| Red cell distribution width (%) | -0.090 | <0.001 | -118.77155 | 26.00467 | -4.57 | <.0001 | -169.74942 | -67.79367 |
Dependent Variable: P amplitude, negative phase, lead V1 (uV).
Predictors of negative P wave amplitude in V1 on multivariate linear regression analysis
Further, on multivariate linear regression analysis only age, PR interval, heart rate, systolic blood pressure, red cell distribution width and body mass index were shown to have a significant correlation with negative P wave amplitude in V1 (P≤0.001). The t value was highest for age, followed by PR interval, systolic blood pressure, heart rate, red cell distribution width and finally body mass index. This shows the degree of independent influence of these factors on the body surface 12-lead ECG negative P wave amplitude with age being the most important factor followed by the rest.
Discussion
Our study confirms that red cell distribution width values have a significant independent correlation with negative P wave amplitude in lead V1 of the ECG, after correcting for all other variables having univariate correlation. Negative P wave amplitude in lead V1 is a known marker for left atrial abnormality, and has been found to be predictive of the development of AF [10]. Age, systolic blood pressure and body mass index are known risk-factors in the development of AF [11]; the association we found between these factors and negative P wave amplitude in lead V1 was expected. Indices known to influence red cell distribution width including hemoglobin, ferritin, TIBC and serum iron were studied; these variables did not have any significant correlation with negative P wave amplitude in lead V1.
Atrial depolarization is represented by the P wave in lead V1 of the body surface ECG by a positive deflection followed by a negative deflection [12]. The positive deflection reflects right atrial depolarization and the negative deflection reflects left atrial depolarization. An increase in amplitude of the negative P wave amplitude in lead V1, indicates delayed propagation of the electrical wave front as it spreads across the left atrium, a characteristic of left atrial abnormality [13].
Red cell distribution width, a measure the red cell size variation, was historically used in diagnosis of iron deficiency anemia [1]. However, recently found associations of RDW with multiple conditions has led researchers to believe that RDW could be affected by oxidative stress and chronic inflammatory conditions such as autoimmune diseases [14-18]. As the red blood cells do not have a nucleus, they are unable to repair damage to the membrane caused due to oxidation from free radicles [16].
Inflammation has been shown to play a major role in the development of AF [19,20]. In addition to prior studies demonstrating the association of an increased RDW and incidence of AF our study demonstrates that RDW is also associated with the precursor for the development of AF, vis-à-vis left atrial abnormality. To the best of our knowledge this association has not been previously published. Although the reason for this association is not clear our hypothesis is that elevated oxidative free radicals damage both the left atrium and the red cell membrane simultaneously causing elevation in RDW and left atrial electrical abnormality. This needs to be investigated further.
Currently, the United States Preventive Services Task Force advices against using ECGs as routine screening tools even in high risk individuals [21]. AF is a well-known cause of significant morbidity and mortality [22,23]. RDW is part of the standard complete blood count, which is readily available on most patients. With this association, further studies can be done to see if a combination of risk factors that is systolic blood pressure, age, RDW, body mass index and resting heart rate could be used to appropriately risk stratify for the development of AF. This could possibly lead to an increase in the use of body surface ECG surveillance on patients at high risk for the development of AF.
Limitations
Although all major cardiac abnormalities were excluded from the study to avoid any confounding results other disease states such as sleep disordered breathing remain as potential confounders. Cardiac abnormalities like HF are also risk factors for AF.
NHANES III (1988-1994) represents community-based populations of the United States, there have been changes in dietary practices, lifestyle and medications since data collection, the influence of these factors on the question being asked is unknown.
Conclusion
Our study has demonstrated that increased red cell distribution width is independently associated with negative P wave amplitude in lead V1 after correcting for other cardiovascular risk factors in a community-based multiethnic population highly representative of the general population of the United States. Further studies are required to analyze the reason for this correlation.
Disclosure of conflict of interest
None.
References
- 1.Evans TC, Jehle D. The red blood cell distribution width. J Emerg Med. 1991;9:71–74. doi: 10.1016/0736-4679(91)90592-4. [DOI] [PubMed] [Google Scholar]
- 2.Felker GM, Allen LA, Pocock SJ, Shaw LK, McMurray JJ, Pfeffer MA, Swedberg K, Wang D, Yusuf S, Michelson EL, Granger CB. Red cell distribution width as a novel prognostic marker in heart failure: data from the CHARM program and the Duke Databank. J Am Coll Cardiol. 2007;50:40–47. doi: 10.1016/j.jacc.2007.02.067. [DOI] [PubMed] [Google Scholar]
- 3.Perlstein TS, Weuve J, Pfeffer MA, Beckman JA. Red blood cell distribution width and mortality risk in a community-based prospective cohort. Arch Intern Med. 2009;169:588–594. doi: 10.1001/archinternmed.2009.55. [DOI] [PMC free article] [PubMed] [Google Scholar]
- 4.Adamsson Eryd S, Borne Y, Melander O, Persson M, Smith JG, Hedblad B, Engstrom G. Red blood cell distribution width is associated with incidence of atrial fibrillation. J Intern Med. 2014;275:84–92. doi: 10.1111/joim.12181. [DOI] [PubMed] [Google Scholar]
- 5.Weymann A, Ali-Hasan-Al-Saegh S, Sabashnikov A, Popov AF, Mirhosseini SJ, Liu T, Lotfaliani M, Sá MPBO, Baker WLL, Yavuz S, Zeriouh M, Jang JS, Dehghan H, Meng L, Testa L, D’Ascenzo F, Benedetto U, Tse G, Nombela-Franco L, Dohmen PM, Deshmukh AJ, Linde C, Biondi-Zoccai G, Stone GW, Calkins H Surgery And Cardiology-Group Imcsc-Group IMOC. Prediction of new-onset and recurrent atrial fibrillation by complete blood count tests: a comprehensive systematic review with meta-analysis. Med Sci Monit Basic Res. 2017;23:179–222. doi: 10.12659/MSMBR.903320. [DOI] [PMC free article] [PubMed] [Google Scholar]
- 6.Semba RD, Patel KV, Ferrucci L, Sun K, Roy CN, Guralnik JM, Fried LP. Serum antioxidants and inflammation predict red cell distribution width in older women: the Women’s Health and Aging Study I. Clin Nutr. 2010;29:600–604. doi: 10.1016/j.clnu.2010.03.001. [DOI] [PMC free article] [PubMed] [Google Scholar]
- 7.Tereshchenko LG, Henrikson CA, Sotoodehnia N, Arking DE, Agarwal SK, Siscovick DS, Post WS, Solomon SD, Coresh J, Josephson ME, Soliman EZ. Electrocardiographic deep terminal negativity of the P wave in V(1) and risk of sudden cardiac death: the Atherosclerosis Risk in Communities (ARIC) study. J Am Heart Assoc. 2014;3:e001387. doi: 10.1161/JAHA.114.001387. [DOI] [PMC free article] [PubMed] [Google Scholar]
- 8.Tereshchenko LG, Shah AJ, Li Y, Soliman EZ. Electrocardiographic deep terminal negativity of the P wave in V1 and risk of mortality: the National Health and Nutrition Examination Survey III. J Cardiovasc Electrophysiol. 2014;25:1242–1248. doi: 10.1111/jce.12453. [DOI] [PMC free article] [PubMed] [Google Scholar]
- 9.Junell A, Thomas J, Hawkins L, Sklenar J, Feldman T, Henrikson CA, Tereshchenko LG. Screening entire healthcare system ECG database: association of deep terminal negativity of P wave in lead V1 and ECG referral with mortality. Int J Cardiol. 2017;228:219–224. doi: 10.1016/j.ijcard.2016.11.128. [DOI] [PMC free article] [PubMed] [Google Scholar]
- 10.Ishida K, Hayashi H, Miyamoto A, Sugimoto Y, Ito M, Murakami Y, Horie M. P wave and the development of atrial fibrillation. Heart Rhythm. 2010;7:289–294. doi: 10.1016/j.hrthm.2009.11.012. [DOI] [PubMed] [Google Scholar]
- 11.Lau DH, Nattel S, Kalman JM, Sanders P. Modifiable risk factors and atrial fibrillation. Circulation. 2017;136:583–596. doi: 10.1161/CIRCULATIONAHA.116.023163. [DOI] [PubMed] [Google Scholar]
- 12.Jayaraman S, Gandhi U, Sangareddi V, Mangalanathan U, Shanmugam RM. Unmasking of atrial repolarization waves using a simple modified limb lead system. Anatol J Cardiol. 2015;15:605–610. doi: 10.5152/akd.2014.5695. [DOI] [PMC free article] [PubMed] [Google Scholar]
- 13.Rasmussen MU, Fabricius-Bjerre A, Kumarathurai P, Larsen BS, Domínguez H, Kanters JK, Sajadieh A. Common source of miscalculation and misclassification of P-wave negativity and P-wave terminal force in lead V1. J Electrocardiol. 2019;53:85–88. doi: 10.1016/j.jelectrocard.2019.01.088. [DOI] [PubMed] [Google Scholar]
- 14.Danese E, Lippi G, Montagnana M. Red blood cell distribution width and cardiovascular diseases. J Thorac Dis. 2015;7:E402–411. doi: 10.3978/j.issn.2072-1439.2015.10.04. [DOI] [PMC free article] [PubMed] [Google Scholar]
- 15.Pilling LC, Atkins JL, Kuchel GA, Ferrucci L, Melzer D. Red cell distribution width and common disease onsets in 240,477 healthy volunteers followed for up to 9 years. PLoS One. 2018;13:e0203504. doi: 10.1371/journal.pone.0203504. [DOI] [PMC free article] [PubMed] [Google Scholar]
- 16.Mozos I. Mechanisms linking red blood cell disorders and cardiovascular diseases. Biomed Res Int. 2015;2015:682054. doi: 10.1155/2015/682054. [DOI] [PMC free article] [PubMed] [Google Scholar]
- 17.Zhao Z, Liu T, Li J, Yang W, Liu E, Li G. Elevated red cell distribution width level is associated with oxidative stress and inflammation in a canine model of rapid atrial pacing. Int J Cardiol. 2014;174:174–176. doi: 10.1016/j.ijcard.2014.03.189. [DOI] [PubMed] [Google Scholar]
- 18.Yu XS, Chen ZQ, Hu YF, Chen JX, Xu WW, Shu J, Pan JY. Red blood cell distribution width is associated with mortality risk in patients with acute respiratory distress syndrome based on the Berlin definition: a propensity score matched cohort study. Heart Lung. 2020;49:641–645. doi: 10.1016/j.hrtlng.2020.04.008. [DOI] [PubMed] [Google Scholar]
- 19.Korantzopoulos P, Letsas KP, Tse G, Fragakis N, Goudis CA, Liu T. Inflammation and atrial fibrillation: a comprehensive review. J Arrhythm. 2018;34:394–401. doi: 10.1002/joa3.12077. [DOI] [PMC free article] [PubMed] [Google Scholar]
- 20.Guo Y, Lip GY, Apostolakis S. Inflammation in atrial fibrillation. J Am Coll Cardiol. 2012;60:2263–2270. doi: 10.1016/j.jacc.2012.04.063. [DOI] [PubMed] [Google Scholar]
- 21.US Preventive Services Task Force. Curry SJ, Krist AH, Owens DK, Barry MJ, Caughey AB, Davidson KW, Doubeni CA, Epling JW Jr, Kemper AR, Kubik M, Landefeld CS, Mangione CM, Silverstein M, Simon MA, Tseng CW, Wong JB. Screening for cardiovascular disease risk with electrocardiography: US preventive services task force recommendation statement. JAMA. 2018;319:2308–2314. doi: 10.1001/jama.2018.6848. [DOI] [PubMed] [Google Scholar]
- 22.Benjamin EJ, Wolf PA, D’Agostino RB, Silbershatz H, Kannel WB, Levy D. Impact of atrial fibrillation on the risk of death: the Framingham Heart Study. Circulation. 1998;98:946–952. doi: 10.1161/01.cir.98.10.946. [DOI] [PubMed] [Google Scholar]
- 23.Ruddox V, Sandven I, Munkhaugen J, Skattebu J, Edvardsen T, Otterstad JE. Atrial fibrillation and the risk for myocardial infarction, all-cause mortality and heart failure: a systematic review and meta-analysis. Eur J Prev Cardiol. 2017;24:1555–1566. doi: 10.1177/2047487317715769. [DOI] [PMC free article] [PubMed] [Google Scholar]