

Key Points
Question
Is the association between frailty and postoperative mortality consistent across noncardiac surgical specialties?
Findings
In this cohort study of over 2.7 million unique patients from 2 large, national data sets, frailty was associated with postoperative mortality across all noncardiac surgical specialties independent of operative stress. Frail patients in all surgical specialties had high mortality rates following low- and moderate-stress procedures.
Meaning
This study suggests that preoperative frailty assessment should be implemented across all specialties, regardless of case-mix, to facilitate risk stratification and shared decision-making.
Abstract
Importance
Frailty is an important risk factor for postoperative mortality. Whether the association between frailty and mortality is consistent across all surgical specialties, especially those predominantly performing lower stress procedures, remains unknown.
Objective
To examine the association between frailty and postoperative mortality across surgical specialties.
Design, Setting, and Participants
A cohort study was conducted across 9 noncardiac specialties in hospitals participating in the American College of Surgeons National Surgical Quality Improvement Program (NSQIP) and Veterans Affairs Surgical Quality Improvement Program (VASQIP) from January 1, 2010, through December 31, 2014, using multivariable logistic regression to evaluate the association between frailty and postoperative mortality. Data analysis was conducted from September 15, 2019, to April 30, 2020. Patients 18 years or older undergoing noncardiac procedures were included.
Exposures
Risk Analysis Index measuring preoperative frailty categorized patients as robust (Risk Analysis Index ≤20), normal (21-29), frail (30-39), or very frail (≥40). Operative Stress Score (OSS) categorized procedures as low (1-2), moderate (3), and high (4-5) stress. Specialties were categorized by case-mix as predominantly low intensity (>75% OSS 1-2), moderate intensity (50%-75%), or high intensity (<50%).
Main Outcomes and Measures
Thirty-day (both measures) and 180-day (VASQIP only) postoperative mortality.
Results
Of the patients evaluated in NSQIP (n = 2 339 031), 1 309 795 were women (56.0%) and mean (SD) age was 56.49 (16.4) years. Of the patients evaluated in VASQIP (n = 426 578), 395 761 (92.78%) were men and mean (SD) age was 61.1 (12.9) years. Overall, 30-day mortality was 1.2% in NSQIP and 1.0% in VASQIP, and 180-day mortality in VASQIP was 3.4%. Frailty and OSS distributions differed substantially across the 9 specialties. Patterns of 30-day mortality for frail and very frail patients were similar in NSQIP and VASQIP for low-, moderate-, and high-intensity specialties. Frailty was a consistent, independent risk factor for 30- and 180-day mortality across all specialties. For example, in NSQIP, for plastic surgery, a low-intensity specialty, the odds of 30-day mortality in very frail (adjusted odds ratio [aOR], 27.99; 95% CI, 14.67-53.39) and frail (aOR, 5.1; 95% CI, 3.03-8.58) patients were statistically significantly higher than for normal patients. This was also true in neurosurgery, a moderate-intensity specialty, for very frail (aOR, 9.8; 95% CI, 7.68-12.50) and frail (aOR, 4.18; 95% CI, 3.58-4.89) patients and in vascular surgery, a high-intensity specialty, for very frail (aOR, 10.85; 95% CI, 9.83-11.96) and frail (aOR, 3.42; 95% CI, 3.19-3.67) patients.
Conclusions and Relevance
In this study, frailty was associated with postoperative mortality across all noncardiac surgical specialties regardless of case-mix. Preoperative frailty assessment could be implemented across all specialties to facilitate risk stratification and shared decision-making.
This cohort study examines the association between frailty and mortality in patients undergoing noncardiac surgery.
Introduction
Frailty is increasingly recognized as an important risk factor for adverse postoperative outcomes.1 Frail patients experience higher rates of adverse outcomes such as complications, failure to rescue, nonhome discharge, and short- and long-term mortality across multiple surgical specialties.2,3,4,5,6,7,8,9 Even following low-risk or ambulatory procedures, frailty is an important risk factor for morbidity and mortality.10,11,12 Many frailty measurement tools have been developed for use in research studies, but the Risk Analysis Index (RAI) can be applied both to research and clinical practice.13,14,15,16,17,18,19,20,21,22,23,24 The RAI accurately measures patient frailty, reliably estimates suboptimal postoperative outcomes, and can be efficiently implemented as a preoperative screening tool in surgical clinics in a variety of practice settings.10,21,22,23,24,25 However, some questions remain regarding the utility of frailty screening in low-risk or ambulatory settings, which constitute a majority of US surgical procedures. The distribution of low- vs high-risk operations performed varies among surgical specialties.26 Because some specialties predominantly perform procedures that are considered low risk with low physiologic impact to patients, it is unclear whether frailty screening is useful in all specialty clinics/settings.
The Operative Stress Score (OSS) was recently developed to explore the associations between procedural physiologic stress and postoperative outcomes, categorizing surgeries according to the associated physiologic stress.10 Using the OSS, 30-day postoperative mortality rates for frail vs very frail patients were 1.6% vs 10.3% for patients undergoing a low-stress procedure, such as a cystoscopy, and 5.1% vs 18.7% for those undergoing a moderate-stress procedure, such as a laparoscopic cholecystectomy.10 Both of these rates exceed the 1% mortality rate previously used to indicate high-risk surgical procedures.12,26 This finding suggests that there is no such thing as a low-risk procedure for frail patients.
Although prior work has described the association of frailty and patient-level outcomes, it is unclear how this association translates to populations of patients treated by different specialties. Given the known differences in procedural risk distribution and case-mix across specialties, the degree to which frailty screening would be useful for perioperative risk stratification and the prevalence of frailty in each surgical specialty is unknown. We sought to describe the association between frailty and mortality at the specialty level by examining individual surgical procedures of varying levels of physiologic stress and surgical risk. We hypothesized that frailty is a significant risk factor for 30-day and 180-day mortality in all surgical specialties.
Methods
Patient Population and Measures
This national cohort study used data from the American College of Surgeons National Surgical Quality Improvement Program (NSQIP)27 and the Veterans Affairs Surgical Quality Improvement Program (VASQIP).28 We followed the Strengthening the Reporting of Observational Studies in Epidemiology (STROBE) reporting guideline. The Stanford University Institutional Review Board, Stanford, California, and the Veterans Affairs Pittsburgh Healthcare System Institutional Review Board, Pittsburgh, Pennsylvania, deemed this study to be exempt from review because deidentified NSQIP and VASQIP data were used.
We included all NSQIP and VASQIP records for patients 18 years or older who underwent noncardiac surgical procedures between January 1, 2010, and December 31, 2014, with available information on 30-day mortality for both measures and 180-day mortality for VASQIP only. Analysis through 2014 allowed for the most parity between data sets as NSQIP eliminated several RAI-relevant variables in 2015. Noncardiac surgical specialties included in the analysis were general, gynecologic, neurologic, orthopedic, otolaryngologic, plastic, thoracic, urologic, and vascular surgery. Data analysis was conducted from September 15, 2019, to April 30, 2020. Details regarding cohort creation are available in the eFigure in the Supplement.
Patient frailty was assessed using the RAI, which is a validated tool for measuring frailty in surgical and nonsurgical populations that is based on the accumulation of deficits model of frailty.22,23,24,25 Details of the RAI scoring have been previously described and are included in eTable 1 in the Supplement.23 Higher RAI scores indicate greater frailty; patients are categorized as robust (RAI≤20), normal (21-29), frail (30-39), and very frail (≥40).23
The OSS was previously developed using modified Delphi consensus methods to rate 565 surgical procedures according to associated physiologic stress (1 indicates least stress and 5 indicates greatest stress to the patient) across multiple specialties.10 We elected to use a 3-level OSS categorization of operative stress owing to the small number of cases categorized as OSS 1 and OSS 5 in several of the surgical specialties, and we experienced difficulty achieving multivariable model convergence. The final OSS categories were defined as low stress (OSS 1-2), moderate stress (OSS 3), and high stress (OSS 4-5).
Using the OSS categorization, each specialty was also categorized into 1 of 3 groups based on the proportion of Current Procedural Terminology codes performed by the specialty that qualified as low stress (OSS 1-2): (1) low-intensity specialty with greater than 75% low-stress cases, (2) moderate-intensity specialty with 50% to 75% low-stress cases, and (3) high-intensity specialty with less than 50% low-stress cases.
Patients with missing data on variables necessary to calculate an RAI score were excluded from the analysis. Patients undergoing procedures not defined by the OSS or a procedure defined by a Current Procedural Terminology code with less than 99 occurrences in the data set were excluded. A description of characteristics of included and excluded patients is provided in eTable 2 in the Supplement.
Statistical Analysis
The primary outcome was postoperative mortality ascertained at 30 days (NSQIP and VASQIP) and 180 days (VASQIP). Mean RAI was compared using 1-way analysis of variance. Thirty-day and 180-day mortality for the 3 specialty intensity categories were calculated after stratifying by frailty status and OSS. We also performed multivariable logistic regression to evaluate the association between frailty and mortality (30 and 180 days), adjusting for the surgical stress of the procedure measured by the OSS and whether the procedure was classified as an emergency. Similar to previous work,12,25 the models included only these 3 variables because many of the covariates that typically would be included in the model were already used in calculating the RAI and would be collinear. Separate regression models were built for 30-day mortality within the NSQIP and VASQIP cohorts. A third model was created for 180-day mortality in VASQIP. Stratified regression models were used to evaluate each outcome in each of the 9 surgical specialties within both data sets.
Statistical models were built using Stata Statistical Software, release 16 (StataCorp LLC). Descriptive statistics were generated with Stata, release 16 and SAS, version 9.4 (SAS Institute Inc).
Results
The cohort included a total of 2 339 031 patients in NSQIP and 426 578 patients in VASQIP who underwent noncardiac surgery during the 5-year study period. A total of 1 029 236 patients (44.0%) in NSQIP were men and 1 309 795 were women (56.0%); mean (SD) age was 56.49 (16.4) years. In the VASQIP cohort, 395 761 patients (92.8%) were men and 30 817 were women (7.2%); mean (SD) age was 61.1 (12.9) years. Other demographic characteristics, exposures, and outcomes for the overall cohorts and each of the surgical specialties are provided in eTable 3 in the Supplement for NSQIP and eTable 4 in the Supplement for VASQIP. Patients in NSQIP were younger vs those in VASQIP (mean [SD], 56.5 [16.4] vs 61.1 [12.9] years; P < .001) with more sex parity compared with VASQIP (44.0% vs 92.2% men, P < .001). The mean (SD) RAI score was statistically significantly higher in VASQIP compared with NSQIP (21.3 [7.3] vs 18.0 [7.9]; P < .001). There was also a greater percentage of frail and very frail patients in VASQIP (frail, 8.4%; very frail, 2.1%) compared with NSQIP (frail, 5.3%; very frail, 0.8%) (P < .001). In both data sets, OSS 2 procedures were the most commonly performed (NSQIP, 47.3%; VASQIP, 52.4%) followed by OSS 3 (NSQIP, 41.7%; VASQIP, 30.2%). The NSQIP data set had double the proportion of emergent procedures compared with VASQIP (10.4% vs 5.1%, P < .001). Overall, 30-day mortality was 1.2% (27 938 patients) in NSQIP and 1.0% (4415 patients) in VASQIP (P < .001). In VASQIP, 14 382 patients (3.4%) had died at 180 days (mortality beyond 30 days is not available in NSQIP).
The distribution of frailty and OSS differed significantly across 9 specialties (general, gynecologic, neurologic, orthopedic, otolaryngologic, plastic, thoracic, urologic, and vascular surgery) in both NSQIP and VASQIP. Some specialties were classified in different intensity categories between the databases (Table 1). Low-intensity specialties were otolaryngology and plastic surgery in NSQIP and otolaryngology, plastic surgery, orthopedic surgery, and urology in VASQIP. Moderate-intensity specialties in NSQIP included neurosurgery, orthopedic surgery, and urology, but only neurosurgery and general surgery in VASQIP. In NSQIP, general surgery was considered a high-intensity specialty along with gynecology, thoracic surgery, and vascular surgery, but only the latter 3 were the high-intensity specialties in VASQIP.
Table 1. Categorization of Surgical Specialties (Intensity) Based on Percentage of Low-Stress (OSS 1-2) Cases Performeda.
| Specialty | NSQIP | VASQIP | ||||||
|---|---|---|---|---|---|---|---|---|
| % OSS 1-2 cases | Intensity category | % Frail | % Very frail | % OSS 1-2 cases | Intensity category | % Frail | % Very frail | |
| Plastic surgery | 92.5 | Low | 1.6 | 0.2 | 89.9 | Low | 7.2 | 1.2 |
| Otolaryngology | 87.2 | Low | 3.0 | 0.3 | 78.3 | Low | 7.7 | 1.6 |
| Orthopedic surgery | 64.0 | Moderate | 4.0 | 0.5 | 75.6 | Low | 5.0 | 1.5 |
| Urology | 57.1 | Moderate | 7.5 | 0.7 | 75.6 | Low | 11.8 | 1.3 |
| Neurosurgery | 53.6 | Moderate | 5.8 | 0.7 | 53.6 | Moderate | 8.6 | 2.4 |
| General surgery | 47.5 | High | 5.0 | 0.9 | 57.2 | Moderate | 6.5 | 1.6 |
| Gynecology | 29.2 | High | 1.3 | 0.1 | 49.0 | High | 0.4 | 0.0 |
| Vascular surgery | 32.6 | High | 11.2 | 1.9 | 27.0 | High | 15.6 | 4.4 |
| Thoracic surgery | 11.8 | High | 14.1 | 1.4 | 19.9 | High | 13.5 | 4.7 |
Abbreviations: NSQIP, National Surgical Quality Improvement Program; OSS, Operative Stress Score; VASQIP, Veterans Affairs Surgical Quality Improvement Program.
Percentage frail and very frail indicate the proportion of the within-specialty records with Risk Analysis Index 30 to 39 (frail) and greater than or equal to 40 (very frail). Differences in proportions of frail and very frail patients among specialties were all significant at P < .001.
The 3 surgical specialty intensity categories were stratified by frailty and OSS status for 30-day mortality (Figure 1). High mortality rates were observed in frail patients, even after low-stress procedures and even in predominantly low-intensity specialties. For example, in NSQIP (Figure 1A), the 30-day mortality rate in very frail patients was 14.6% after low-stress procedures performed in low-intensity specialties, which was similar to moderate-intensity (13.1%) and high-intensity (18.6%) specialties. A similar pattern was seen in VASQIP (Figure 1B): 30-day mortality rates in very frail patients undergoing low-stress procedures were 9.6% for low-intensity, 10.9% for moderate-intensity, and 11.4% for high-intensity specialties. For very frail patients, 30-day mortality rates were greater than 10% following moderate-stress procedures (OSS 3) in all specialty intensity categories. For the highest stress procedures (OSS 4-5), 30-day mortality rates were 5% to 10% in frail patients and 10% to 30% in very frail patients in both data sets, regardless of the specialty intensity. Robust and normal patients had uniformly low 30-day mortality rates following low- and moderate-stress procedures and less than 5% mortality following high-stress procedures in all specialty intensity categories.
Figure 1. Thirty-Day Mortality After Surgery in 9 Noncardiac Surgical Specialties Stratified by Frailty Status (Risk Analysis Index) and Operative Stress Score (OSS).
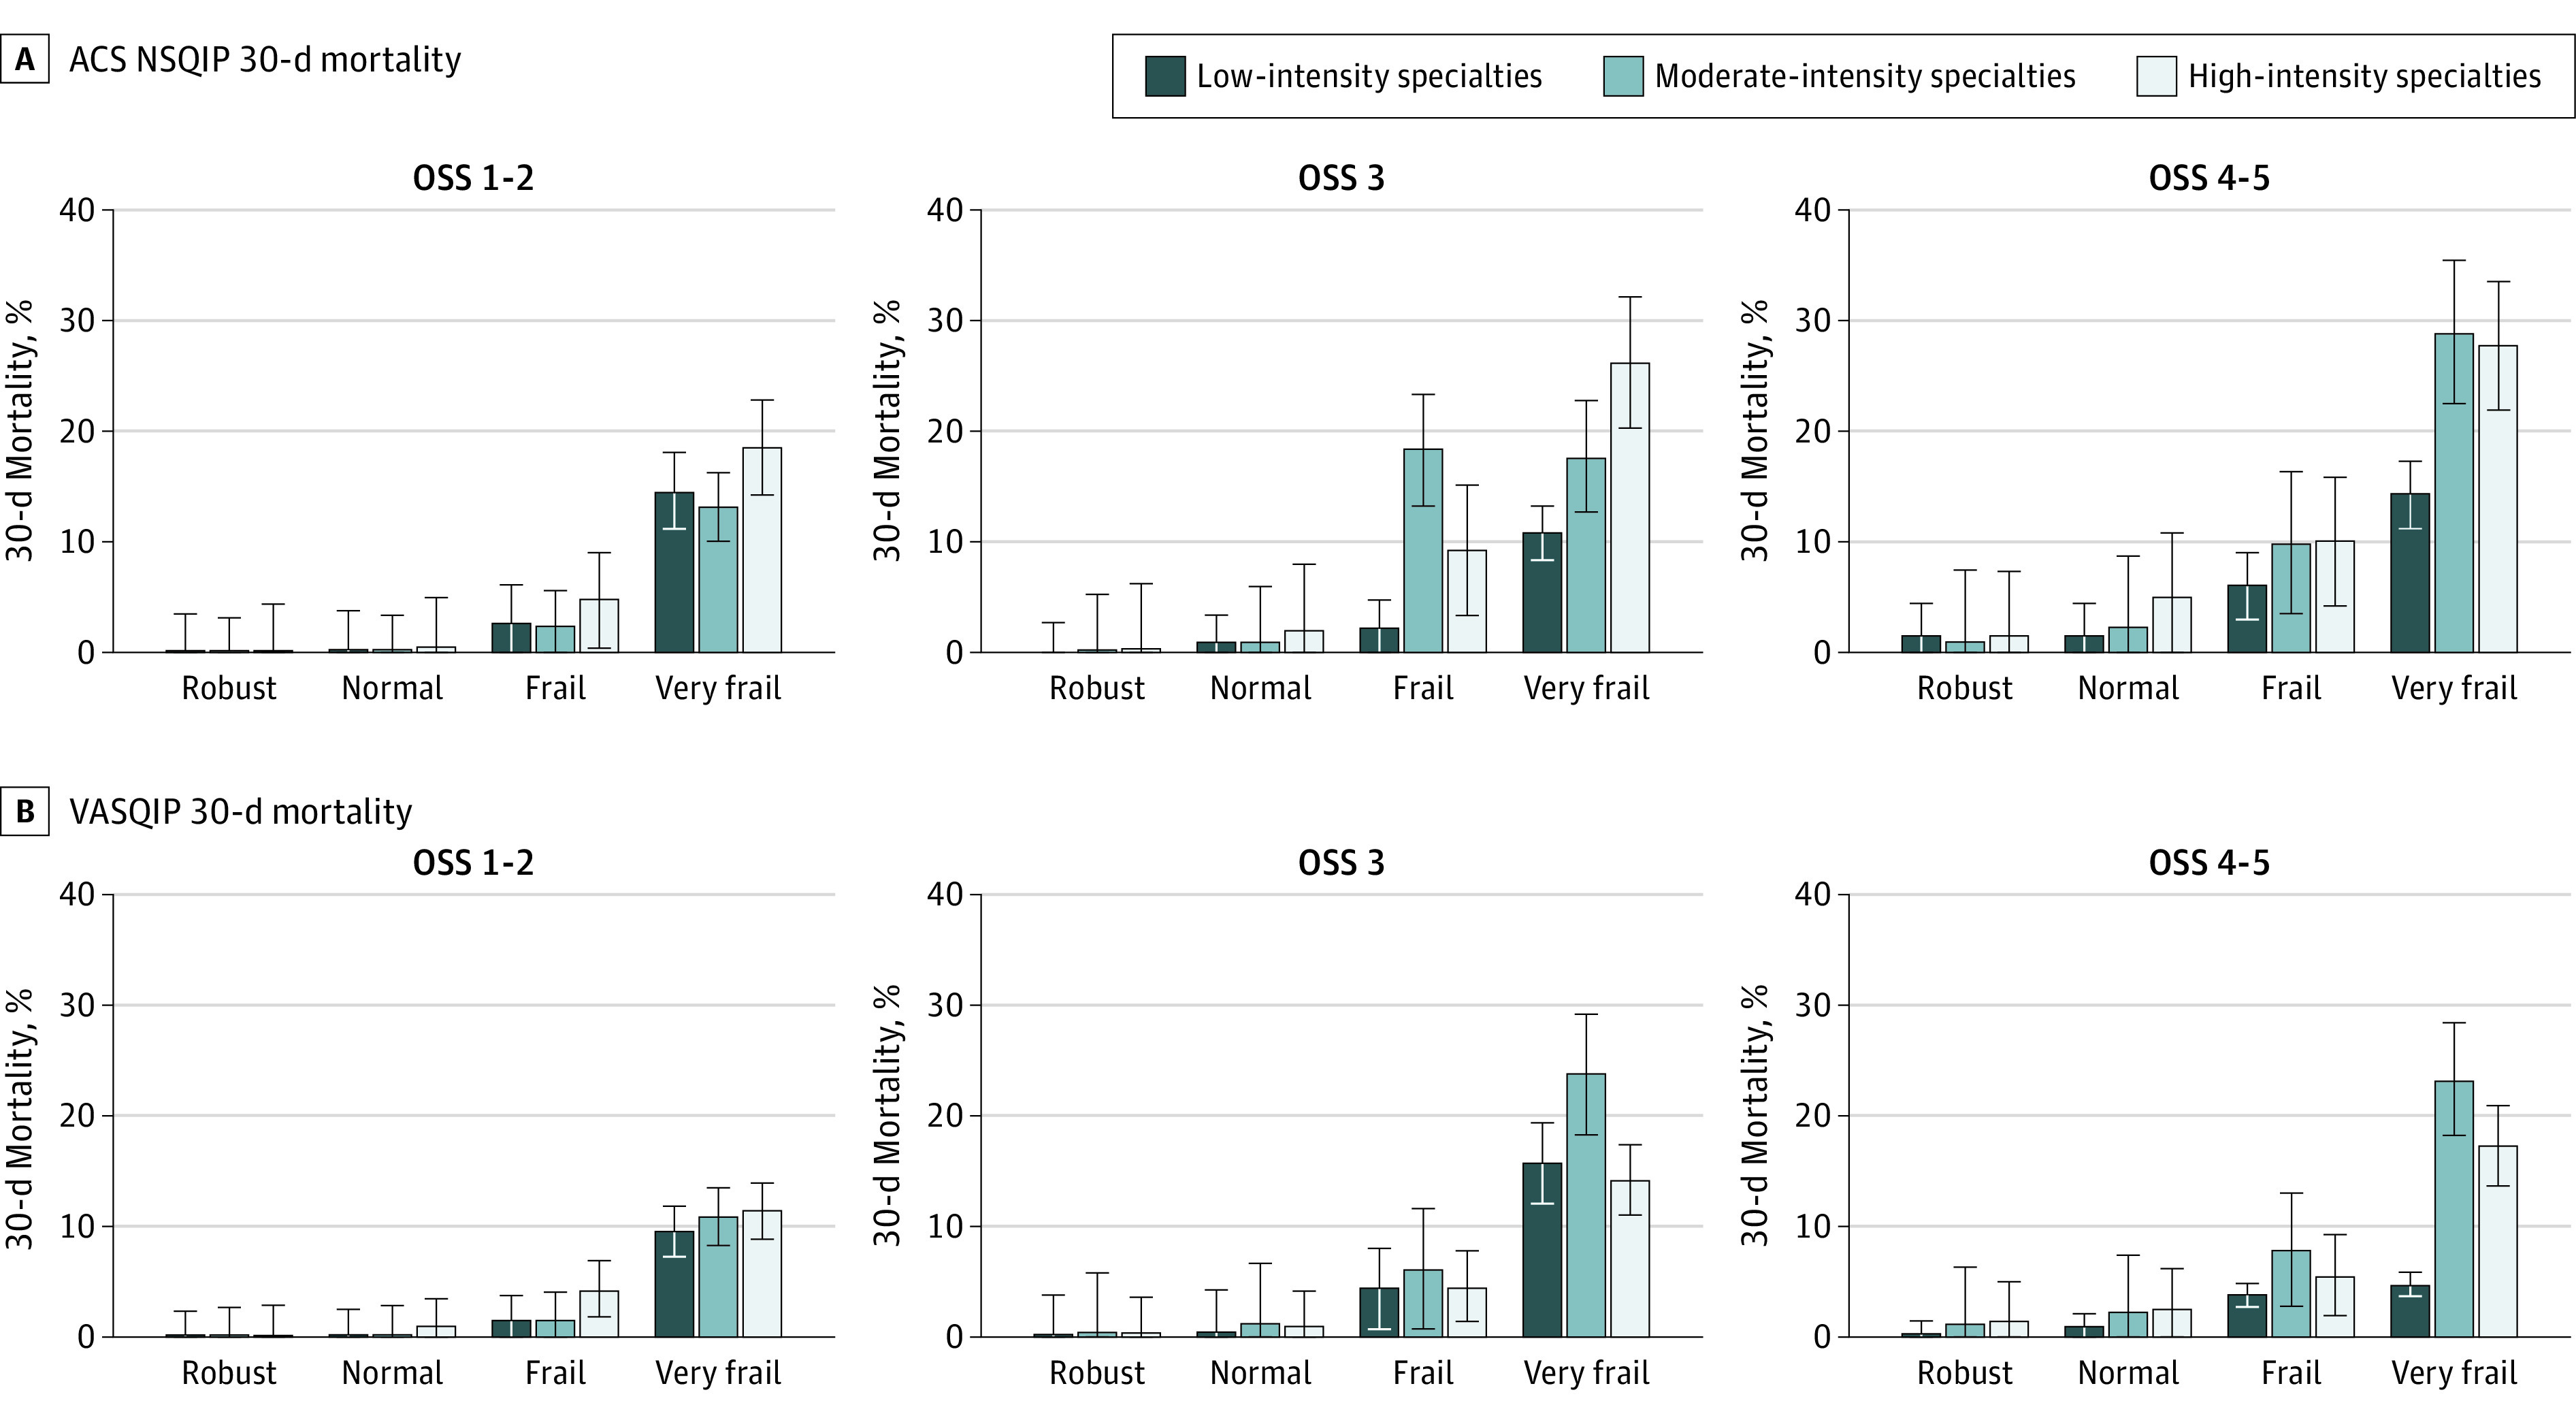
Specialties were categorized for the American College of Surgeons (ACS) National Surgical Quality Improvement Program (NSQIP) (A) and the Veterans Affairs Surgical Quality Improvement Program (VASQIP) (B) by the percentage of low-stress (OSS 1 and 2) procedures performed. Frail and very frail patients experienced high mortality rates following low- and moderate-stress procedures in all specialties. Error bars represent the SEs.
The 180-day mortality rates for very frail patients in VASQIP were greater than 25% following any level OSS procedure, regardless of specialty intensity (Figure 2). Frail patients in all specialty categories had 15% to 18% mortality following OSS 3 procedures and 7% to 17% mortality after OSS 1-2 procedures. Counterintuitively, high-intensity specialties had lower mortality than moderate-intensity specialties following moderate- and high-stress (OSS 3 and 4-5, respectively) procedures performed in frail and very frail patients.
Figure 2. Veterans Affairs Surgical Quality Improvement Program (VASQIP) 180-Day Mortality Following Surgery in 9 Noncardiac Surgical Specialties Stratified by Frailty Status (Risk Analysis Index) and Operative Stress Score (OSS).

Specialties were categorized by the percentage of low-stress (OSS 1 and 2) procedures performed. Frail and very frail patients experienced high mortality rates following low- and moderate-stress procedures in all specialties. Error bars represent the SEs.
After adjusting for OSS and emergency status, frailty was a consistent, independent risk factor for 30- and 180-day mortality in the overall cohort in both data sets, similar to what has been demonstrated in prior work (eTable 5 in the Supplement).10 The patterns in the overall VASQIP and NSQIP cohorts in the multivariable models were representative of the patterns within each specialty: frail and very frail patients had significantly higher odds of 30- and 180-day mortality compared with normal patients in all specialties (Table 2). We used plastic surgery for an example of a low-intensity specialty, neurosurgery for moderate intensity, and vascular surgery for high intensity in both the NSQIP and VASQIP data sets. For plastic surgery in NSQIP, the odds of 30-day mortality in very frail (adjusted odds ratio [aOR], 27.99; 95% CI, 14.67-53.39) and frail patients (aOR, 5.1; 95% CI, 3.03-8.58) were statistically significantly higher than for normal patients. The association between frailty and 30-day mortality was also observed for neurosurgery in very frail (aOR, 9.8; 95% CI, 7.68-12.50) and frail patients (aOR, 4.18; 95% CI, 3.58-4.89), and for vascular surgery in very frail (aOR, 10.85; 95% CI, 9.83-11.96) and frail patients (aOR, 3.42; 95% CI, 3.19-3.67). In VASQIP, an association with 30-day mortality was noted in very frail (aOR, 14.15; 95% CI, 4.19-47.77) and frail patients (aOR, 3.68; 95% CI, 1.21-11.21) after plastic surgery, very frail (aOR, 32.1; 95% CI, 20.95-49.16) and frail patients (aOR, 5.22; 95% CI, 3.43-7.96) after neurosurgery, and very frail (aOR, 12.66; 95% CI, 10.31-15.55) and frail patients (aOR, 4.23; 95% CI, 3.51-5.10) after vascular surgery.
Table 2. Multivariable Logistic Regression Models Evaluating the Association Between Frailty and Mortality Stratified by Specialtya.
| Specialty | Model | aOR (95% CI) | ||
|---|---|---|---|---|
| NSQIP, 30-d mortality | VASQIP, 30-d mortality | VASQIP, 180-d mortality | ||
| General | RAI robust | 0.17 (0.16-0.18) | 0.33 (0.28-0.40) | 0.31 (0.28-0.34) |
| RAI normal | 1 [Reference] | 1 [Reference] | 1 [Reference] | |
| RAI frail | 3.41 (3.29-3.55) | 4.15 (3.67-4.71) | 4.32 (4.02-4.65) | |
| RAI very frail | 10.3 (9.77-10.86) | 15.48 (13.63-17.59) | 15.86 (14.53-17.31) | |
| OSS 1-2 | 1 [Reference] | 1 [Reference] | 1 [Reference] | |
| OSS 3 | 3.91 (3.71-4.12) | 4.32 (3.72-5.02) | 2.82 (2.62-3.05) | |
| OSS 4-5 | 6.42 (6.07-6.79) | 5.76 (4.89-6.78) | 3.8 (3.47-4.15) | |
| Emergency | 5.6 (5.42-5.78) | 3.6 (3.27-3.98) | 2.61 (2.44-2.80) | |
| Gynecologyb | RAI robust | 0.07 (0.05-0.10) | ||
| RAI normal | 1 [Reference] | 1 [Reference] | 1 [Reference] | |
| RAI frail | 3.8 (2.47-5.86) | |||
| RAI very frail | 18.29 (9.92-33.74) | |||
| OSS 1-2 | 1 [Reference] | 1 [Reference] | 1 [Reference] | |
| OSS 3 | 1.63 (1.06-2.50) | 0.98 (0.06-16.06) | 0.96 (0.19-4.78) | |
| OSS 4-5 | 4.72 (2.55-8.73) | |||
| Emergency | 4.25 (2.36-7.66) | 185.6 (11.26-3058.58) | 37.08 (4.17-329.93) | |
| Neurosurgery | RAI robust | 0.36 (0.30-0.43) | 0.29 (0.16-0.49) | 0.34 (0.26-0.43) |
| RAI normal | 1 [Reference] | 1 [Reference] | 1 [Reference] | |
| RAI frail | 4.18 (3.58-4.89) | 5.22 (3.43-7.96) | 6.82 (5.53-8.39) | |
| RAI very frail | 9.8 (7.68-12.50) | 32.1 (20.95-49.16) | 30.54 (23.34-39.97) | |
| OSS 1-2 | 1 [Reference] | 1 [Reference] | 1 [Reference] | |
| OSS 3 | 4.46 (3.59-5.52) | 1.28 (0.88-1.86) | 1.93 (1.58-2.35) | |
| OSS 4-5 | 18.21 (13.77-24.09) | 2.48 (1.37-4.51) | 1.86 (1.23-2.80) | |
| Emergency | 3.73 (3.11-4.47) | 1.58 (1.01-2.48) | 1.12 (0.83-1.51) | |
| Orthopedicb | RAI robust | 0.2 (0.17-0.23) | 0.27 (0.20-0.38) | 0.31 (0.27-0.36) |
| RAI normal | 1 [Reference] | 1 [Reference] | 1 [Reference] | |
| RAI frail | 7.12 (6.49-7.82) | 8.84 (7.12-11.00) | 9.06 (8.05-10.20) | |
| RAI very frail | 20.31 (17.79-23.18) | 33.94 (27.12-42.46) | 36.8 (32.18-42.07) | |
| OSS 1-2 | 1 [Reference] | 1 [Reference] | 1 [Reference] | |
| OSS 3 | 3.41 (3.05-3.81) | 2.28 (1.89-2.75) | 2.35 (2.12-2.61) | |
| OSS 4-5 | 39.66 (10.54-149.19) | |||
| Emergency | 2.46 (2.23-2.71) | 1.79 (1.44-2.23) | 1.7 (1.46-1.97) | |
| ENT | RAI robust | 0.21 (0.12-0.34) | 0.3 (0.12-0.74) | 0.38 (0.28-0.52) |
| RAI normal | 1 [Reference] | 1 [Reference] | 1 [Reference] | |
| RAI frail | 3.83 (2.37-6.21) | 5.3 (2.89-9.69) | 3.33 (2.58-4.30) | |
| RAI very frail | 15.74 (8.35-29.68) | 7.81 (3.44-17.73) | 6.27 (4.33-9.07) | |
| OSS 1-2 | 1 [Reference] | 1 [Reference] | 1 [Reference] | |
| OSS 3 | 2.36 (1.51-3.68) | 2.82 (1.58-5.02) | 2.95 (2.31-3.76) | |
| OSS 4-5 | 5.15 (2.92-9.09) | 3.04 (1.42-6.51) | 5.38 (4.03-7.17) | |
| Emergency | 7.89 (3.94-15.83) | 4.25 (1.79-10.05) | 3.62 (2.27-5.77) | |
| Plastic | RAI robust | 0.09 (0.05-0.16) | 0.52 (0.16-1.63) | 0.36 (0.20-0.64) |
| RAI normal | 1 [Reference] | 1 [Reference] | 1 [Reference] | |
| RAI frail | 5.1 (3.03-8.58) | 3.68 (1.21-11.21) | 7.13 (4.35-11.69) | |
| RAI very frail | 27.99 (14.67-53.39) | 14.15 (4.19-47.77) | 24.77 (13.38-45.88) | |
| OSS 1-2 | 1 [Reference] | 1 [Reference] | 1 [Reference] | |
| OSS 3 | 1.53 (0.96-2.42) | 2.53 (1.01-6.29) | 1.46 (0.94-2.27) | |
| OSS 4-5 | 24.94 (6.13-101.45) | 9.02 (1.02-79.89) | 6.58 (1.56-27.77) | |
| Emergency | 7.44 (4.10-13.51) | 3.33 (0.93-11.91) | 0.91 (0.35-2.41) | |
| Thoracic | RAI robust | 0.3 (0.23-0.37) | 0.5 (0.33-0.75) | 0.54 (0.44-0.65) |
| RAI normal | 1 [Reference] | 1 [Reference] | 1 [Reference] | |
| RAI frail | 2.05 (1.71-2.45) | 2.87 (2.14-3.84) | 2.88 (2.45-3.38) | |
| RAI very frail | 9.98 (7.63-13.05) | 9.48 (6.96-12.92) | 6.42 (5.19-7.93) | |
| OSS 1-2 | 1 [Reference] | 1 [Reference] | 1 [Reference] | |
| OSS 3 | 1.35 (1.00-1.81) | 1.48 (1.00-2.20) | 0.8 (0.66-0.97) | |
| OSS 4-5 | 1.36 (1.03-1.80) | 1.36 (0.96-1.93) | 0.65 (0.44-0.76) | |
| Emergency | 3.65 (2.79-4.79) | 1.4 (0.93-2.10) | 1.16 (0.87-1.55) | |
| Urology | RAI robust | 0.33 (0.25-0.43) | 0.36 (0.23-0.56) | 0.39 (0.33-0.47) |
| RAI normal | 1 [Reference] | 1 [Reference] | 1 [Reference] | |
| RAI frail | 6.14 (5.20-7.24) | 4.35 (3.33-5.70) | 5.01 (4.50-5.58) | |
| RAI very frail | 27.41 (21.56-34.85) | 30.47 (22.56-41.15) | 23.07 (19.52-27.27) | |
| OSS 1-2 | 1 [Reference] | 1 [Reference] | 1 [Reference] | |
| OSS 3 | 0.95 (0.78-1.15) | 1.53 (1.09-2.15) | 0.8 (0.66-0.96) | |
| OSS 4-5 | 2.63 (2.21-3.13) | 3.13 (2.34-4.18) | 1.51 (1.31-1.76) | |
| Emergency | 4.28 (3.27-5.60) | 6.46 (4.43-9.42) | 3.41 (2.65-4.40) | |
| Vascular | RAI robust | 0.41 (0.37-0.45) | 0.52 (0.38-0.71) | 0.5 (0.42-0.59) |
| RAI normal | 1 [Reference] | 1 [Reference] | 1 [Reference] | |
| RAI frail | 3.42 (3.19-3.67) | 4.23 (3.51-5.10) | 4.2 (3.79-4.65) | |
| RAI very frail | 10.85 (9.83-11.96) | 12.66 (10.31-15.55) | 12.76 (11.25-14.48) | |
| OSS 1-2 | 1 [Reference] | 1 [Reference] | 1 [Reference] | |
| OSS 3 | 1.18 (1.10-1.26) | 1.3 (1.07-1.57) | 1.06 (0.95-1.17) | |
| OSS 4-5 | 3.25 (2.91-3.64) | 3.46 (2.59-4.63) | 1.45 (1.19-1.78) | |
| Emergency | 5.83 (5.46-6.23) | 3.35 (2.78-4.04) | 2.33 (2.05-2.64) | |
Abbreviations: aOR, adjusted odds ratio; ENT, ear, nose, and throat; NSQIP, National Surgical Quality Improvement Program; OSS, Operative Stress Score; RAI, Risk Analysis Index; VASQIP, Veterans Affairs Surgical Quality Improvement Program.
Frailty was measured with the RAI, which uses 14 variables from the registry data set to generate scores ranging from 0 to 81, with higher scores indicating more frailty. There are 4 levels: robust (≤20), normal (21-29), frail (30-39), and very frail (≥40); the reference group is normal. The OSS categories are 1 to 2 (low stress), 3 (moderate stress), and 4 to 5 (high stress); reference group is OSS 1 to 2. Emergency was categorized as yes or no and emergent or nonemergent; reference group was nonemergent.
Empty cells indicate that the factors could not be estimated in the model.
The association between frailty and mortality persisted at 180 days for every specialty. Using the same specialties as examples, compared with normal patients, the aOR of 180-day mortality after plastic surgery was greater in very frail (aOR, 24.77; 95% CI, 13.38-45.88) and frail patients (aOR, 7.13; 95% CI, 4.35-11.69). The odds of 180-day mortality were also significantly increased for very frail (aOR, 30.54; 95% CI, 23.34-39.97) and frail (aOR, 6.82; 95% CI, 5.53-8.39) patients who underwent neurosurgery and for very frail patients (aOR, 12.76; 95% CI, 11.25-14.48) and frail patients (aOR, 4.2; 95% CI, 3.79-4.65) who underwent vascular surgery.
Discussion
In this retrospective study of more than 2.7 million patients, frailty status was associated with 30- and 180-day mortality in all 9 specialties in 2 large, national surgical cohorts. Although the distribution of frailty and OSS differed substantially across surgical specialties, the patterns of mortality for frail and very frail patients were similar for low-, moderate-, and high-intensity specialties in NSQIP and VASQIP. More specifically, very frail patients experienced greater than 10% 30-day mortality and 30% 180-day mortality after undergoing a low-stress procedure in all 3 specialty intensity categories. Despite the varying case-mix, frailty appeared to be a consistent, independent risk factor for 30- and 180-day mortality in all surgical specialties.
Most procedures performed at hospitals are categorized as low stress, and frailty is associated with adverse outcomes even after these commonly performed ambulatory surgeries.10,12 Surgeons in specialties routinely performing low-stress procedures may not consider frailty in their treatment algorithm. However, the fact that approximately 1 of 10 frail patients and 1 of 3 very frail patients die 6 months following low-, moderate-, and high-stress procedures in all specialties merits thoughtful consideration. Prior work that analyzed data at the patient and procedural stress level described how the presence of frailty may contribute to the outcomes of patients undergoing both major and minor procedures.10,23,24,25 In the present study, we conducted a specialty-level analysis and added 2.3 million patients from the NSQIP database to improve the generalizability of the results. We found a statistically significant difference among specialties regarding the percentage of frail and very frail patients treated. Low- or moderate-intensity specialties saw, on average, 1.3% to 8.8% frail and 0.1% to 1.6% very frail patients; high-intensity specialties included, on average, 5.6% to 13.6% frail and 0.9% to 4.1% very frail patients. Low- and moderate-intensity specialties may not be as attuned to recognizing frailty compared with high-intensity specialties that operate on a greater proportion of frail/high-risk patients. Subjective assessments by surgical clinicians misclassify up to 50% of frail patients and usually identify disability rather than frailty.29,30 In the Cardiovascular Health Study, 27% of frail older adults in the community did not have major comorbidities or evident disability.17 We contend that these data are sufficiently important to warrant implementation of universal, objective preoperative frailty screening in all surgical specialty clinics, regardless of the planned procedure or care setting. We suggest that these results be used by specialties that perform predominantly low-stress surgeries, as no specialty is exempt from the deleterious effects of frailty on surgical outcomes.
The RAI’s predictive power is similar to that of other published frailty indexes; however, these indexes have been used primarily in either retrospective studies or in a controlled research setting and have not proven to be feasible for universal point-of-care testing in predominantly robust populations.15,17,20 In contrast, clinician- and patient-reported versions of the RAI require no special equipment and can be calculated in less than 60 seconds without disrupting the workflow of busy outpatient clinics.24 As such, the RAI is intended to provide point-of-care risk stratification in real time.21,22 In the setting of the surgical clinic, a diagnosis of frailty in the face of life-limiting illness may shift a patient’s priorities away from surgery and toward earlier implementation of palliative care measures, a transition that has repeatedly been associated with improvements in quality of life, decreased health care expenditures, and increased satisfaction with care.31,32,33,34,35,36 The rapid questionnaire screening is especially useful for low- and moderate-intensity specialties that treat patients with a low prevalence of frailty, because comprehensive geriatric assessments require a trained geriatrician to spend 60 to 90 minutes to complete and may not be feasible in such specialty clinics. Prior work demonstrates not only the RAI’s validity in estimating outcomes after surgery in a number of settings (high-risk, low-risk, inpatient, and ambulatory surgery), but also feasibility for pragmatic, system-wide implementation for a wide range of surgical specialties and referral to more specialized services, such as geriatrics, palliative care, or multidisciplinary perioperative surgical homes.10,23,24,25
There are several potential benefits of including frailty screening as part of routine surgical risk assessment in all surgical specialties. Frailty assessment helps surgeons to appropriately risk stratify patients and counsel frail patients regarding the increased risk of adverse outcomes following even relatively minor, low-stress procedures. Clinicians and frail patients can make informed, patient-centered, collaborative decisions about the utility of invasive procedures, balancing risks vs potential improvements in quality of life in the setting of a limited life span. By assessing how the planned intervention is consistent with a patient’s overarching goals, surgeons can adjust their operative plans to better align with the hopes, fears, and expectations of patients and their care partners. Frailty is also associated with higher health care costs after surgery.37 Routine frailty screening decreases health care costs and use by identifying patients who would benefit most from resource allocation.38
In addition, we found a nonstepwise association: patients of moderate-intensity specialties experienced higher mortality following moderate- and high-stress procedures than patients of high-intensity specialties. We propose a 2-fold hypothesis for this observation. First, as described earlier, there may be a lack of recognizing frailty or at-risk patients without standardized screening by low- and moderate-intensity specialties because they treat a low volume of frail and very frail patients. Second, the phenomenon of failure to rescue may contribute to this association at the hospital and service-line level. For high-intensity specialties there may be greater vigilance by the medical staff and standard protocols in place that may aid in swiftly identifying complications and promoting rescue in patients undergoing high operative stress procedures. The same caution may not be automatically observed following low- or moderate-stress procedures. Early awareness of patient frailty can help surgeons and members of the care team implement mitigation strategies to prevent and rescue patients from surgical complications associated with frailty.39,40,41 For example, low- and moderate-intensity specialties could choose to offer inpatient or observation stays to frail patients for otherwise outpatient, low-stress procedures, or admit patients to a higher level of care for inpatient surgery. Early follow-up or home-based check-ins could be additionally implemented for frail patients to reduce readmissions and mitigate the consequences of postoperative complications.
Limitations
This study has limitations. The underlying data were deidentified at the case level, thereby preventing analysis at the patient level. The NSQIP is limited to 30-day outcomes; caution is indicated before generalizing VASQIP outcomes to the general population, especially given VASQIP’s predominantly male composition. However, it is unlikely that findings would be substantially different with more balanced cohorts, especially considering the longer-term outcomes associated with RAI observed in a private sector hospital system representative of the general population.24,25 The VASQIP and NSQIP also do not distinguish between all-cause mortality and deaths directly related to the surgical procedure. However, we contend that the cause of frailty-related mortality is less important than the awareness that mortality risks of any cause are substantial and thus relevant to setting realistic goals of care, especially in circumstances when patient frailty may preclude living long enough to garner the expected benefits of surgery.
Conclusions
This study supported the hypothesis that frailty is universally associated with survival outcomes across surgical specialties with varying case-mix, independent of operative stress and emergency status. A strength of this study is its ability to look beyond 30-day outcomes to 6-month results, and there was greater than 10% 180-day mortality for frail patients following even low-stress procedures in low-intensity specialties. Thus, preoperative frailty assessment should be implemented for all specialties regardless of the planned procedure to facilitate risk stratification and shared decision-making.
eTable 1. Crosswalk of Risk Analysis Index (RAI) variables to Veterans Affairs National Surgical Quality Improvement Program (VASQIP) and American College of Surgeons National Surgical Quality Improvement Program (NSQIP) and revised RAI-A scoring system as described in Arya et al
eTable 2. A total of 2 720 730 surgical procedures in NSQIP and 486 669 surgical procedures in VASQIP were performed during the five-year period between 2010 and 2014.
eTable 3. Demographic Characteristics of American College of Surgeons National Surgical Quality Improvement Program (NSQIP).
eTable 4. Demographic Characteristics of Veterans Affairs National Surgical Quality Improvement Program (VASQIP).
eTable 5. Model fit statistics for multivariable logistic regression models evaluating the association between frailty as measured by the Risk Analysis Index (RAI) and operative stress as measured by the Operative Stress Score (OSS) on 30- and 180-day mortality adjusted for emergency case status and stratified by surgical specialty.
eFigure. Cohort creation flow diagram in NSQIP and VASQIP.
References
- 1.Abellan van Kan G, Rolland Y, Houles M, Gillette-Guyonnet S, Soto M, Vellas B. The assessment of frailty in older adults. Clin Geriatr Med. 2010;26(2):275-286. doi: 10.1016/j.cger.2010.02.002 [DOI] [PubMed] [Google Scholar]
- 2.Arya S, Kim SI, Duwayri Y, et al. Frailty increases the risk of 30-day mortality, morbidity, and failure to rescue after elective abdominal aortic aneurysm repair independent of age and comorbidities. J Vasc Surg. 2015;61(2):324-331. doi: 10.1016/j.jvs.2014.08.115 [DOI] [PubMed] [Google Scholar]
- 3.George EL, Chen R, Trickey AW, et al. Variation in center-level frailty burden and the impact of frailty on long-term survival in patients undergoing elective repair for abdominal aortic aneurysms. J Vasc Surg. 2020;71(1):46-55.e4. doi: 10.1016/j.jvs.2019.01.074 [DOI] [PMC free article] [PubMed] [Google Scholar]
- 4.McIsaac DI, Bryson GL, van Walraven C. Association of frailty and 1-year postoperative mortality following major elective noncardiac surgery: a population-based cohort study. JAMA Surg. 2016;151(6):538-545. doi: 10.1001/jamasurg.2015.5085 [DOI] [PubMed] [Google Scholar]
- 5.Farhat JS, Velanovich V, Falvo AJ, et al. Are the frail destined to fail? frailty index as predictor of surgical morbidity and mortality in the elderly. J Trauma Acute Care Surg. 2012;72(6):1526-1530. doi: 10.1097/TA.0b013e3182542fab [DOI] [PubMed] [Google Scholar]
- 6.George EM, Burke WM, Hou JY, et al. Measurement and validation of frailty as a predictor of outcomes in women undergoing major gynaecological surgery. BJOG. 2016;123(3):455-461. doi: 10.1111/1471-0528.13598 [DOI] [PMC free article] [PubMed] [Google Scholar]
- 7.Suskind AM, Walter LC, Jin C, et al. Impact of frailty on complications in patients undergoing common urological procedures: a study from the American College of Surgeons National Surgical Quality Improvement database. BJU Int. 2016;117(5):836-842. doi: 10.1111/bju.13399 [DOI] [PMC free article] [PubMed] [Google Scholar]
- 8.Augustin T, Burstein MD, Schneider EB, et al. Frailty predicts risk of life-threatening complications and mortality after pancreatic resections. Surgery. 2016;160(4):987-996. doi: 10.1016/j.surg.2016.07.010 [DOI] [PubMed] [Google Scholar]
- 9.Adams P, Ghanem T, Stachler R, Hall F, Velanovich V, Rubinfeld I. Frailty as a predictor of morbidity and mortality in inpatient head and neck surgery. JAMA Otolaryngol Head Neck Surg. 2013;139(8):783-789. doi: 10.1001/jamaoto.2013.3969 [DOI] [PubMed] [Google Scholar]
- 10.Shinall MC Jr, Arya S, Youk A, et al. Association of preoperative patient frailty and operative stress with postoperative mortality. JAMA Surg. 2019;155(1):e194620-e194620. doi: 10.1001/jamasurg.2019.4620 [DOI] [PMC free article] [PubMed] [Google Scholar]
- 11.Seib CD, Rochefort H, Chomsky-Higgins K, et al. Association of patient frailty with increased morbidity after common ambulatory general surgery operations. JAMA Surg. 2018;153(2):160-168. doi: 10.1001/jamasurg.2017.4007 [DOI] [PMC free article] [PubMed] [Google Scholar]
- 12.Shah R, Attwood K, Arya S, et al. Association of frailty with failure to rescue after low-risk and high-risk inpatient surgery. JAMA Surg. 2018;153(5):e180214. doi: 10.1001/jamasurg.2018.0214 [DOI] [PMC free article] [PubMed] [Google Scholar]
- 13.Walston J, Bandeen-Roche K, Buta B, et al. Moving frailty toward clinical practice: NIA Intramural Frailty Science Symposium Summary. J Am Geriatr Soc. 2019;67(8):1559-1564. doi: 10.1111/jgs.15928 [DOI] [PMC free article] [PubMed] [Google Scholar]
- 14.Rockwood K, Mitnitski A. Frailty defined by deficit accumulation and geriatric medicine defined by frailty. Clin Geriatr Med. 2011;27(1):17-26. doi: 10.1016/j.cger.2010.08.008 [DOI] [PubMed] [Google Scholar]
- 15.Rockwood K, Song X, MacKnight C, et al. A global clinical measure of fitness and frailty in elderly people. CMAJ. 2005;173(5):489-495. doi: 10.1503/cmaj.050051 [DOI] [PMC free article] [PubMed] [Google Scholar]
- 16.Velanovich V, Antoine H, Swartz A, Peters D, Rubinfeld I. Accumulating deficits model of frailty and postoperative mortality and morbidity: its application to a national database. J Surg Res. 2013;183(1):104-110. doi: 10.1016/j.jss.2013.01.021 [DOI] [PubMed] [Google Scholar]
- 17.Fried LP, Tangen CM, Walston J, et al. ; Cardiovascular Health Study Collaborative Research Group . Frailty in older adults: evidence for a phenotype. J Gerontol A Biol Sci Med Sci. 2001;56(3):M146-M156. doi: 10.1093/gerona/56.3.M146 [DOI] [PubMed] [Google Scholar]
- 18.Podsiadlo D, Richardson S. The timed “up & go”: a test of basic functional mobility for frail elderly persons. J Am Geriatr Soc. 1991;39(2):142-148. doi: 10.1111/j.1532-5415.1991.tb01616.x [DOI] [PubMed] [Google Scholar]
- 19.Bohannon RW. Hand-grip dynamometry predicts future outcomes in aging adults. J Geriatr Phys Ther. 2008;31(1):3-10. doi: 10.1519/00139143-200831010-00002 [DOI] [PubMed] [Google Scholar]
- 20.Rolfson DB, Majumdar SR, Tsuyuki RT, Tahir A, Rockwood K. Validity and reliability of the Edmonton Frail Scale. Age Ageing. 2006;35(5):526-529. doi: 10.1093/ageing/afl041 [DOI] [PMC free article] [PubMed] [Google Scholar]
- 21.Hall DE, Arya S, Schmid KK, et al. Association of a frailty screening initiative with postoperative survival at 30, 180, and 365 days. JAMA Surg. 2017;152(3):233-240. doi: 10.1001/jamasurg.2016.4219 [DOI] [PMC free article] [PubMed] [Google Scholar]
- 22.Hall DE, Arya S, Schmid KK, et al. Development and initial validation of the Risk Analysis Index for measuring frailty in surgical populations. JAMA Surg. 2017;152(2):175-182. doi: 10.1001/jamasurg.2016.4202 [DOI] [PMC free article] [PubMed] [Google Scholar]
- 23.Arya S, Varley P, Youk A, et al. Recalibration and external validation of the Risk Analysis Index: a surgical frailty assessment tool. Ann Surg. 2019. Published online March 19, 2019. doi: 10.1097/SLA.0000000000003276 [DOI] [PMC free article] [PubMed] [Google Scholar]
- 24.Varley PR, Borrebach JD, Arya S, et al. Clinical utility of the Risk Analysis Index as a prospective frailty screening tool within a multi-practice, multi-hospital integrated healthcare system. Ann Surg. 2020. doi: 10.1097/SLA.0000000000003808 [DOI] [PubMed] [Google Scholar]
- 25.Shah R, Borrebach JD, Hodges JC, et al. Validation of the Risk Analysis Index for evaluating frailty in ambulatory patients. J Am Geriatr Soc. 2020;68(8):1818-1824. doi: 10.1111/jgs.16453 [DOI] [PMC free article] [PubMed] [Google Scholar]
- 26.Schwarze ML, Barnato AE, Rathouz PJ, et al. Development of a list of high-risk operations for patients 65 years and older. JAMA Surg. 2015;150(4):325-331. doi: 10.1001/jamasurg.2014.1819 [DOI] [PMC free article] [PubMed] [Google Scholar]
- 27.Raval MV, Pawlik TM. Practical guide to surgical data sets: National Surgical Quality Improvement Program (NSQIP) and pediatric NSQIP. JAMA Surg. 2018;153(8):764-765. doi: 10.1001/jamasurg.2018.0486 [DOI] [PubMed] [Google Scholar]
- 28.Massarweh NN, Kaji AH, Itani KMF. Practical guide to surgical data sets: Veterans Affairs Surgical Quality Improvement Program (VASQIP). JAMA Surg. 2018;153(8):768-769. doi: 10.1001/jamasurg.2018.0504 [DOI] [PubMed] [Google Scholar]
- 29.Sorajja P, Ahmed A, Pai A, et al. Prospective evaluation of the “eyeball” test for assessing frailty in elderly patients with valvular heart disease. J Am Coll Cardiol. 2016;67(13 suppl):2181. doi: 10.1016/S0735-1097(16)32182-9 [DOI] [PubMed] [Google Scholar]
- 30.George EL, Kashikar A, Rothenberg KA, et al. Comparison of surgeon assessment to frailty measurement in abdominal aortic aneurysm repair. J Surg Res. 2020;248:38-44. doi: 10.1016/j.jss.2019.11.005 [DOI] [PMC free article] [PubMed] [Google Scholar]
- 31.Fried TR, Bradley EH, Towle VR, Allore H. Understanding the treatment preferences of seriously ill patients. N Engl J Med. 2002;346(14):1061-1066. doi: 10.1056/NEJMsa012528 [DOI] [PubMed] [Google Scholar]
- 32.Murphy DJ, Burrows D, Santilli S, et al. The influence of the probability of survival on patients’ preferences regarding cardiopulmonary resuscitation. N Engl J Med. 1994;330(8):545-549. doi: 10.1056/NEJM199402243300807 [DOI] [PubMed] [Google Scholar]
- 33.The SUPPORT Principal Investigators A controlled trial to improve care for seriously ill hospitalized patients: the Study to Understand Prognoses and Preferences for Outcomes and Risks of Treatments (SUPPORT). JAMA. 1995;274(20):1591-1598. doi: 10.1001/jama.1995.03530200027032 [DOI] [PubMed] [Google Scholar]
- 34.Zimmermann C, Swami N, Krzyzanowska M, et al. Early palliative care for patients with advanced cancer: a cluster-randomised controlled trial. Lancet. 2014;383(9930):1721-1730. doi: 10.1016/S0140-6736(13)62416-2 [DOI] [PubMed] [Google Scholar]
- 35.Bakitas M, Lyons KD, Hegel MT, et al. Effects of a palliative care intervention on clinical outcomes in patients with advanced cancer: the Project ENABLE II randomized controlled trial. JAMA. 2009;302(7):741-749. doi: 10.1001/jama.2009.1198 [DOI] [PMC free article] [PubMed] [Google Scholar]
- 36.Lebrett WG, Roeland E, Bruggeman A, Yeung H, Murphy JD. Economic impact of palliative care among elderly cancer patients. J Clin Oncol. 2017;35(31). doi: 10.1200/JCO.2017.35.31_suppl.91 [DOI] [Google Scholar]
- 37.Wilkes JG, Evans JL, Prato BS, Hess SA, MacGillivray DC, Fitzgerald TL. Frailty cost: economic impact of frailty in the elective surgical patient. J Am Coll Surg. 2019;228(6):861-870. doi: 10.1016/j.jamcollsurg.2019.01.015 [DOI] [PubMed] [Google Scholar]
- 38.Bleijenberg N, Drubbel I, Neslo REJ, et al. Cost-effectiveness of a proactive primary care program for frail older people: a cluster-randomized controlled trial. J Am Med Dir Assoc. 2017;18(12):1029-1036.e3. doi: 10.1016/j.jamda.2017.06.023 [DOI] [PubMed] [Google Scholar]
- 39.Massarweh NN, Kougias P, Wilson MA. Complications and failure to rescue after inpatient noncardiac surgery in the Veterans Affairs health system. JAMA Surg. 2016;151(12):1157-1165. doi: 10.1001/jamasurg.2016.2920 [DOI] [PubMed] [Google Scholar]
- 40.Ghaferi AA, Birkmeyer JD, Dimick JB. Complications, failure to rescue, and mortality with major inpatient surgery in Medicare patients. Ann Surg. 2009;250(6):1029-1034. doi: 10.1097/SLA.0b013e3181bef697 [DOI] [PubMed] [Google Scholar]
- 41.Anaya DA, Johanning J, Spector SA, et al. Summary of the panel session at the 38th Annual Surgical Symposium of the Association of VA Surgeons: what is the big deal about frailty? JAMA Surg. 2014;149(11):1191-1197. doi: 10.1001/jamasurg.2014.2064 [DOI] [PubMed] [Google Scholar]
Associated Data
This section collects any data citations, data availability statements, or supplementary materials included in this article.
Supplementary Materials
eTable 1. Crosswalk of Risk Analysis Index (RAI) variables to Veterans Affairs National Surgical Quality Improvement Program (VASQIP) and American College of Surgeons National Surgical Quality Improvement Program (NSQIP) and revised RAI-A scoring system as described in Arya et al
eTable 2. A total of 2 720 730 surgical procedures in NSQIP and 486 669 surgical procedures in VASQIP were performed during the five-year period between 2010 and 2014.
eTable 3. Demographic Characteristics of American College of Surgeons National Surgical Quality Improvement Program (NSQIP).
eTable 4. Demographic Characteristics of Veterans Affairs National Surgical Quality Improvement Program (VASQIP).
eTable 5. Model fit statistics for multivariable logistic regression models evaluating the association between frailty as measured by the Risk Analysis Index (RAI) and operative stress as measured by the Operative Stress Score (OSS) on 30- and 180-day mortality adjusted for emergency case status and stratified by surgical specialty.
eFigure. Cohort creation flow diagram in NSQIP and VASQIP.