

Abstract
The nucleoside reverse transcriptase inhibitor zidovudine (AZT) induces genotoxic damage that includes centrosomal amplification (CA>2 centrosomes/cell) and micronucleus (MN) formation. Here we explored these end points in mice deficient in DNA repair and tumor suppressor function to evaluate their effect on AZT-induced DNA damage. We used mesenchymal-derived fibroblasts cultured from C57BL/6J mice that were null and wild type (WT) for Xpa, and WT, haploinsufficient and null for p53 (6 different genotypes). Dose-responses for CA formation, in cells exposed to 0, 10, and 100 μM AZT for 24 hr, were observed in all genotypes except the Xpa(+/+)p53(+/−) cells, which had very low levels of CA, and the Xpa(−/−)p53(−/−) cells, which had very high levels of CA. For CA there was a significant three-way interaction between Xpa, p53, and AZT concentration, and Xpa(−/−) cells had significantly higher levels of CA than Xpa(+/+) cells, only for p53(+/−) cells. In contrast, the MN and MN + chromosomes (MN + C) data showed a lack of AZT dose response. The Xpa(−/−) cells, with p53(+/+) or (+/−) genotypes, had levels of MN and MN + C higher than the corresponding Xpa(+/+) cells. The data show that CA is a major event induced by exposure to AZT in these cells, and that there is a complicated relationship between AZT and CA formation with respect to gene dosage of Xpa and p53. The loss of both genes resulted in high levels of damage, and p53 haploinsufficicency strongly protected Xpa(+/+) cells from AZT-induced CA damage.
Keywords: zidovudine, micronuclei, micronuclei with whole chromosomes, centrosomal amplification, Xpa
INTRODUCTION
Nucleotide excision repair (NER) removes DNA damage caused by many chemicals and ultraviolet (UV) radiation [Hanawalt, 1995]. Individuals with defects in NER, who suffer from xeroderma pigmentosum (Xpa), are not able to repair sunlight-induced DNA damage, and develop skin cancer at a young age when exposed to sunlight without protection [Hanawalt, 1994]. The XPA protein, an essential early component of the NER pathway, is involved in damage recognition, and initiation and stabilization of the NER complex.
Considered to be a tumor-suppressor protein, p53 is known to arrest DNA replication, in the aftermath of genotoxic damage, to allow DNA repair to occur, and thus avoid replication of DNA on a damaged template. This protein is involved in many other cellular pathways, such as apoptosis, development, differentiation, transcription, DNA recombination, chromosomal segregation and senescence [Oren and Rotter, 1999], and has a proofreading activity in mitochondria [Bakhanashvili et al., 2009].
Zidovudine (AZT) was the first nucleoside reverse transcriptase inhibitor (NRTI) approved for HIV-1 therapy. It has been shown to act as a transplacental carcinogen in mice [Olivero et al., 1997], and becomes incorporated into DNA [Poirier et al., 2004]. In vitro and in vivo, AZT-DNA incorporation induces mutations, MN, chromosomal instability, telomere shortening, and centrosomal deregulation, which leads to changes in cell cycle regulation and gene expression [Olivero, 2007]. A predicted consequence of these events is genomic instability. It has been hypothesized that NRTI-induced DNA damage is repaired by the base excision repair pathway [Sampath et al., 2003]. However, recent reports also suggest the involvement of Xpc, a component of NER in the removal of high concentrations of AZT [Wu et al., 2013]. In addition, mice deficient in p53 are more susceptible to mutagenesis [Dobrovolsky et al., 2007] and tumorigenesis induced by exposure to AZT, compared with wild type (WT) mice [Olivero et al., 1997; NTP, 2012].
In these experiments we focused on the processing of AZT-induced DNA damage in mesenchymal fibroblasts grown from mice of the following six genotypes: Xpa(+/+) p53(+/+); Xpa(+/+) p53(+/−); Xpa(+/+)p53(−/−); Xpa(−/−)p53(+/+); Xpa(−/−)p53(+/−); and Xpa(−/−)p53(−/−). The genotoxic end points examined included CA, MN, and MN + C. Overall the data has shown a complicated picture of interactions between cells with differing Xpa and p53 capabilities and the processing of AZT-induced DNA damage.
MATERIALS AND METHODS
Animal Model
Transgenic Xpa(−/−)p53(+/−) C57BL/6J mice have previously been shown to be more susceptible to DNA damage [John et al., 2012] and cancer induction by benzo[a]pyrene, than their WT counterparts [Hoogervorst et al., 2003]. These mice (provided by H. van Steeg of the Laboratory of Toxicology, Bilthoven, The Netherlands) were originally generated on a C57BL/6 background [de Vries et al., 1995; van Steeg et al., 2001; Divi et al., 2002]. In our laboratory they were bred to obtain the genotypes of interest: Xpa(−/−) p53(+/+); Xpa(−/−) p53(+/−); and Xpa(−/−) p53(−/−). C57BL/6J Xpa(+/+) p53(+/−) were obtained from the Immune Regulation Section of the Experimental Immunology Branch, NCI. C57BL/6 mice, Xpa(+/+) p53(−/−), were obtained from the Jackson Laboratory (Bar Harbor, ME). Although all mice were generated using the same background the authors cannot confirm pure isogenicity.
Mouse offspring were paw tattooed and tail clipped 8–10 days following birth. DNA from the tail clips was used to genotype the mice, using published primer sequences for Xpa and p53 [de Vries et al., 1997; Divi et al., 2002]. Animals were bred at the NCI Animal Facility under conditions specified by the Association for the Assessment and Accreditation of Laboratory Animal Care in accordance with humane principles for laboratory animal care, and under a protocol approved by the NCI Animal Care and Use Committee.
Culture and Treatment of Mesenchymal Bone Marrow Cells
Bone marrow cells from two to four C57BL/6J mice/genotype were rinsed from the femur and tibia using a disposable LO-DOSE 1/2 cc U-100 Insulin Syringe with a permanently attached 28G 1/2 needle (Becton Dickinson, Franklin Lakes, NJ). The material was resuspended in RPMI media (ATCC, Manassas, VA) containing 10% fetal bovine serum (ATCC) and grown in T-75 Falcon flasks (BD Falcon, Bedford, MA) until they reached 95% confluency. To remove cells from flasks the monolayer was washed with Dulbecco’s phosphate buffered saline (DPBS, Gibco Invitrogen, Carlsbad, CA) without Ca and Mg, twice and incubated with 0.05% Trypsin (Gibco Invitrogen) for 4 minutes at 37°C. After neutralizing with an equal volume of media and centrifuging at 2,000 rpm for 4 minutes, cells were resuspended and distributed into 4-well culture slides (BD Falcon). Following a 4-hr attachment period, the media was replaced with media containing 0, 10, or 100 μM AZT (Sigma-Aldrich Co, St. Louis, MO) and cells were incubated for 24 hr. To prepare a stock solution, AZT was dissolved in DPBS and the final concentration was calculated using an extinction coefficient of 11,500 m2/mol at an absorbance wavelength of 266 nm.
Experimental Design for Centrosomal Amplification (CA) Analysis
To analyze CA, two to four mice were used per genotype, and from each mouse 2 to 10 slides were examined (Table I). The total numbers of cells scored is also shown in Table I. Since the cells were cultured on four chamber slides, control and treated cells could be grown and exposed on the same slide.
TABLE I.
Experimental Protocol Showing Number of Mice, Number of Slides, and Number of Cells Scored for the Genotoxicity Biomarkers, CA, MN, and MN + C
| Total number of scored cells |
||||||
|---|---|---|---|---|---|---|
| Endpoint | Genotype | Number of mice | Number of slidesa | Control | AZT 10 μM | AZT 100 μM |
| CA | XPA−/− P53+/− | 3 | 7 | 1,464 | 1,447 | 1,304 |
| XPA−/− P53−/− | 2 | 3–5 | 1,059 | 806 | 761 | |
| XPA+/+ P53−/− | 2 | 3 | 843 | 960 | 866 | |
| XPA−/− P53+/+ | 3 | 5 | 1,226 | 1,148 | 1,249 | |
| XPA+/+ P53+/+ | 4 | 9–10 | 2,092 | 2,118 | 2,091 | |
| XPA+/+ P53+/− | 2 | 2 | 1,030 | 1,056 | 1,042 | |
| MN and MN+C | XPA−/− P53+/− | 1 | 2 | 1,060 | 1,139 | 1,075 |
| XPA−/− P53−/− | 1 | 2 | 1,094 | 1,058 | 1,050 | |
| XPA+/+ P53−/− | 1 | 2 | 1,138 | 1,023 | 1,065 | |
| XPA−/− P53+/+ | 1 | 2 | 1,125 | 1,158 | 1,124 | |
| XPA+/+ P53+/+ | 1 | 2 | 1,031 | 1,167 | 1,093 | |
| XPA+/+ P53+/− | 1 | 2 | 1,049 | 1,113 | 1,057 | |
Varies by concentration.
Experimental Design for Micronucleus (MN) and MN + Chromosomes (MN + C) Analysis
One mouse/genotype was used to evaluate the incidence of MN and MN + C. Two cell lines/genotype were grown on two separate slides, and controls and treated cells were scored on the same slide (Table I). There were 1,023–1,158 cells scored/genotype, and because MN + C is a subset of MN, both were scored using the same four chamber slide (Table I).
Cell Proliferation and Viability
Mesenchymal derived cells from mice of the following genotypes: Xpa(+/+)p53(+/+), Xpa(+/+)p53(+/−), Xpa(+/+)p53(−/−), Xpa(−/−)p53(+/+), and Xpa(−/−)p53(−/−) were used to evaluate proliferation and viability. Cells, obtained as described, were seeded in 12-well plates containing fresh media. One 12-well plate was used per genotype, and triplicate wells were used to examine each treatment and each genotype. At 24 hr after seeding, media was replaced with fresh media containing 0, 10, or 100 μM AZT. Cells were grown for an additional 24 hr, at which time the plates were trypzinized and cells counted twice in a Coulter Counter. The three control wells were averaged and considered 100%, and the three wells treated with 10 or 100 μM AZT were averaged and designated as percentage of the control. The termination of the mouse colony precluded evaluation of Xpa(−/−)p53(+/−) cells.
Immunofluorescence Staining of Centrosomes and Centromeres (Kinetochores)
Mesenchymal derived bone marrow fibroblasts, cultured in slide chambers and exposed as described above, were fixed with ice-cold methanol for 20 minutes at −20°C, washed two times for 5 minutes with 0.1% Tween-PBS and permeabilized for 4 minutes with 0.1% Triton X-100-PBS. Cells were washed three times with Tween-PBS and immersed in 1.25% bovine serum albumin (BSA) in DPBS blocking solution for 2 hr at 37°C in a humidifying chamber.
To identify the centrosomes and CA, a dilution of 1:500 rabbit anti-pericentrin antibody (Covance, Emeryville, CA) in blocking solution was used for 2 hr at 37°C in a humidifying chamber. After washing with Tween-PBS, the secondary antibody, anti-rabbit Alexa 488 (Invitrogen, Life Technologies, Grand Island, NY) was applied at a 1:750 dilution in blocking buffer for 45 minutes at 37°C. Using this approach the centrosomes were stained green.
To identify the kinetochores, chromosomal proteins at the site of microtubule attachment to the centromere, slides were incubated in a 1:1,000 dilution of human anti-CREST (calcinosis, Raynaud’s phenomenon, esophageal dysfunction, sclerodactyly, and telangiectasia) antibody-FITC conjugated (Antibodies Incorporated, Davis, CA) for 1.5 hr at 37°C in a humidifying chamber. The kinetochores appeared as light blue dots localized within the nucleus. Cells were stained with DAPI to identify nuclei and MN (blue).
Immunofluorescence Imaging Via Confocal Microscopy
Stained cells were visualized and scored using a Nikon Eclipse E-400 (Nikon, Inc, Melville, NY) microscope fitted with a Plan Apo 100× objective with a 1.40 numerical aperture. Cells were photographed on a Zeiss Axiovert 100M microscope equipped with a Zeiss Plan Apochromat 100×/1.4 oil Dichromic objective. Confocal images were generated using a Zeiss LSM 510 scanning laser microscope. The LSM 510 zoom software was used to produce a final magnification of 2,000×. Images shown are three-dimensional maximal projections generated from a series of images through the Z-plane. Approximately 1,000 cells per genotype were evaluated for the presence of CA and MN using fluorescent microscopy. Cells containing greater than two centrosomes were considered positive for CA. MN were blue (DAPI) circular fragments separated from the whole nucleus. MN stained positive for CREST antiserum contained whole chromosomes (MN + C), while the parent nucleus was considered to be aneuploid.
Statistical Methods
A three-factor factorial mixed model analysis of variance (ANOVA) was performed on the CA data using a binomial distribution (CA cells/total cells). The three factors considered were Xpa, p53, and AZT dose. Random effects were included to account for mouse and slide variation. For all ANOVAs, residuals were examined for homogeneity and were partitioned if found to be heterogeneous. All reported P-values are two-tailed, and Holm’s or Dunnett’s method was used to adjust pair-wise comparison P-values. In view of the large number of tests performed, we consider P < 0.005 to be statistically significant, while those for which 0.005 < P < 0.05 would be considered trends.
RESULTS
Representative Examples of CA, MN, and MN + C
Confocal micrographs showing the cellular aberrations CA, MN, and MN + C are presented in Figure 1. Panel (a) shows normal centrosomes (arrows) in untreated interphase nuclei from Xpa(+/+)p53(+/−) mesenchymal fibroblasts. Panel (b) shows a likely recent mitosis (two nuclei) in Xpa(+/+)p53(+/−) cells exposed to 100 μM AZT, where multiple centrosomes are shown in green (arrows). Panels (c) and (d) show two MN (arrows) in Xpa(+/+)p53(+/+) cells exposed to 100 μM AZT, as well as punctate light blue nuclear signals representing CREST staining for centromeres (kinetochores). In Figure 1d, the MN inside the circle, and in the insert, stained positive for CREST and therefore contained centromeric material considered to be a whole functional chromosome (MN + C), while the parent nucleus is considered to have lost a functional chromosome.
Fig. 1.

Confocal photomicrographs showing examples of CA, MN, and MN + C. DAPI (blue) stains nuclei. (a, b) Xpa(+/+)p53(+/−) mouse mesenchymal-derived fibroblasts where pericentrin antibody stains centrosomes green (arrows) in unexposed cells (a), and (b) cells exposed to 100 μM AZT for 24 hr (arrows). (c, d) show Xpa(+/+)p53(+/+) cells with kinetochores (centromeres) stained light blue with anti-CREST antiserum. (c) MN (arrow) in an unexposed cell. (d) A cell exposed to 100 μM AZT for 24 hr shows MN (arrow) and MN + C (circle and insert).
Cell Proliferation and Viability
Analysis of cell proliferation and viability for five of the genotypes used in this study (Table II) revealed that the unexposed cell types proliferated at about the same rate. In addition we observed moderate decreases in growth and viability in cultures exposed for 24 hr to either 10 or 100 μM AZT for the following five genotypes: Xpa(+/+)p53(+/+), Xpa(−/−)p53(+/+), Xpa(+/+)p53(−/−), Xpa(+/+)p53(+/−), and Xpa(−/−)p53(−/−).
TABLE II.
Index of Cell Growth During the 24 hr of AZT Exposure in Unexposed Cells, and Mean Percentage of Viable Cells Treated with 10 or 100 μM AZT During the Same 24 hr, Based on One Mouse and Triplicate Samples
| % survival with AZT dose (μM) |
||||||
|---|---|---|---|---|---|---|
| Genotype | Time 0a | Time 1a | Cell growth indexb | 0 | 10 | 100 |
| Xpa(+/+)p53(+/+) | 39,102 | 86,691 | 2.20 | 100 | 77.6 | 65.5 |
| Xpa(+/+)p53(+/−) | 9,513 | 16,733 | 1.76 | 100 | 94.1 | 145.0 |
| Xpa(+/+)p53(−/−) | 63,276 | 136,787 | 2.16 | 100 | 84.9 | 75.1 |
| Xpa(−/−)p53(+/+) | 22,522 | 30,369 | 1.35 | 100 | 92.3 | 88.6 |
| Xpa(−/−)p53(−/−) | 20,102 | 35,286 | 1.75 | 100 | 93.0 | 92.1 |
At (T0) AZT was added, and at (T1), 24 hr later the experiment was terminated.
cell growth index T1/T0.
Centrosomal Amplification (CA)
Values for CA in mouse fibroblasts exposed to 0, 10, and 100 μM AZT for 24 hr, are shown in Figure 2. Analysis of the factorial treatment structure revealed a three-way interaction effect, for percentage of cells with CA, among the factors tested (Xpa, p53, and AZT concentration) with P = 0.013. There were two particular aspects of note with respect to this data: first, the varying dose response effect; and second, the extent of CA formation in Xpa(−/−) cells, which were hypothesized to sustain more damage than their Xpa(+/+) counterparts. Dose-related increases in CA were found with AZT in cells of most genotypes (Fig. 2a). The two exceptions were the Xpa(+/+)p53(+/−) cells and the Xpa(−/−)p53(−/−) cells, neither of which showed an AZT dose-response. Figure 2b shows the least squares (LS)-means (±95% confidence intervals [CI]) for Xpa, p53, and the different AZT doses for Xpa(+/+) mice (solid line) and Xpa(−/−) mice (broken line). For Xpa(+/+) cells, the figure shows dose responses among the AZT concentration means for p53(+/+) and p53(−/−) (F-test P = 0.0057 and P < 0.0001, respectively), but not for the p53(+/−) cells (F-test P = 0.099). Figure 2b also shows dose responses, among the AZT concentration means, for Xpa(−/−) cells from p53(+/+) and p53(+/−) mice (both F-test P = 0.0002), but not for cells from the p53(−/−) mice (F-test P = 0.50).
Fig. 2.
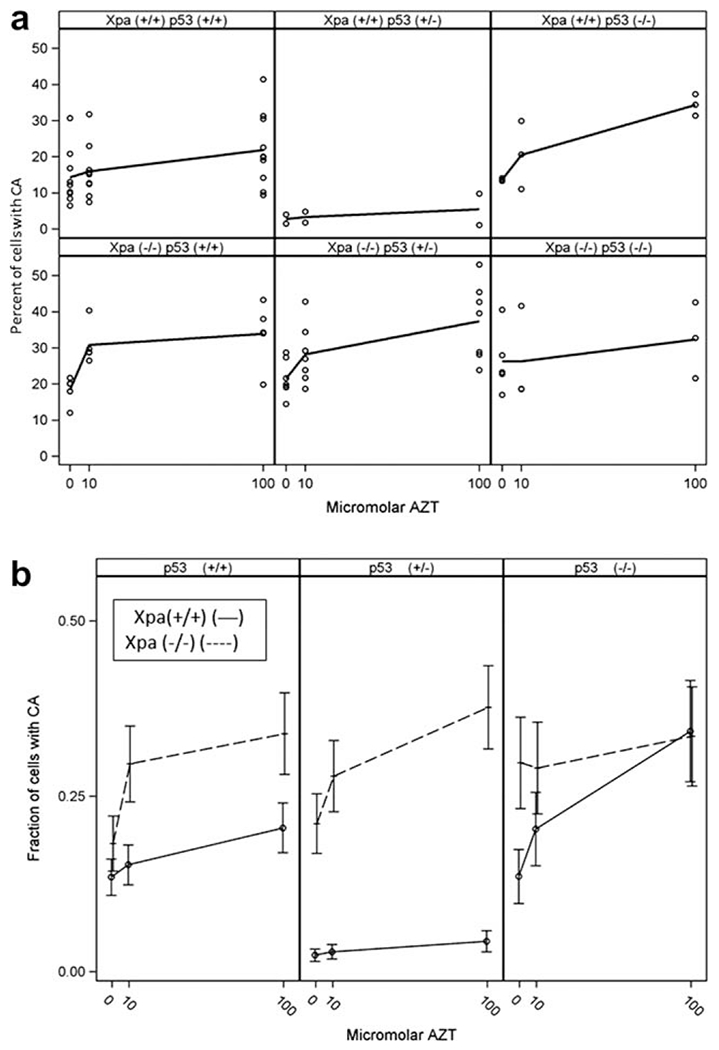
CA analysis of Xpa, p53, and AZT dose by Factorial ANOVA. Analysis revealed a three-way interaction effect with P = 0.013. (a) Percent of cells with CA (and loess lines), in mesenchymal cells taken from two to four mice of each of the six different genotypes and exposed to 0, 10, or 100 μM AZT. (b) Mean fraction of cells (±95% CI) of different genotypes [Xpa(+/+),—0—, and Xpa(−/−), --+--] plotted on the ordinate, with AZT dose (0, 10, and 100 μM) plotted on the abscissa. The p53 genotypes (+/+, +/−, −/−) are shown in the left, middle, and right panels, respectively.
As mentioned above, cells of two genotypes, the Xpa(+/+)p53(+/−) and the Xpa(−/−)p53(−/−), showed no dose response for CA formation (Figs. 2a and 2b). There was, however, a marked difference between the two genotypes. The Xpa(−/−)p53(−/−) cells had high CA levels and the Xpa(+/+)p53(+/−) cells had low CA levels. The high CA levels were presumably due to the loss of both genes, which may have had more than an additive effect in protecting the cellular genome. In contrast, the Xpa(+/+)p53(+/−) cells, appeared to be protected from CA damage by their p53 haploinsufficient status.
Table III shows the pair-wise P-values for these comparisons, confirming the graphic observations represented in Figure 2b. Only in the p53(+/−) mice was there a significant increase in CA in the Xpa(−/−) cells, compared with the Xpa(+/+) cells (all P ≤ 0.0001). This may be because of the extra protection provided by the p53(+/−) genotype [see also Fig. 2b, p53(+/−) panel].
TABLE III.
Pair-Wise P-Values for %CA in Xpa(+/+) Versus Xpa(−/−) Mice by p53 Status and Dose of AZT
| μM AZT |
|||
|---|---|---|---|
| Genotype | 0 | 10 | 100 |
| Xpa(+/+) p53(+/+) vs. Xpa(−/− p53(+/+) | 0.31a | 0.074 | 0.12 |
| Xpa(+/+) p53(+/−) vs. Xpa(−/− p53(+/−) | <0.0001 | <0.0001 | <0.0001 |
| Xpa(+/+) p53(−/− vs. Xpa(−/− p53(−/−) | 0.13 | 0.63 | 0.94 |
All p values are two-tailed and adjusted using Holm’s method.
MN and MN + C
Both MN (Fig. 3a) and MN+C (Fig. 3b) reflect loss of genetic material occurring as a result of genotoxic damage. Cells with MN have sustained the loss of part of a chromosome, which does not include the kinetochore. Cells with MN + C are a subset of cells with MN where the MN contains a centromere and presumably a whole functioning chromosome. The resulting chromosomal loss, or aneuploidy, in the parent nucleus is a biologically challenging event. In this study our profiles for MN and MN + C were very similar. Figure 3a, shows the percentage of cells with MN in each of the six genotypes, and Figure 3b shows the incidence of MN + C in each of the six genotypes. (Supplementary Information Table I shows the frequencies of both MN and MN + C.) The prediction here was that Xpa(−/−) cells would have higher damage levels than Xpa(+/+) cells. For both MN and MN + C, values appeared higher in the Xpa(−/−)p53(+/+) and Xpa(−/−)p53(+/−) cells compared with the Xpa(+/+)p53(+/+) and Xpa(+/+)p53(+/−) cells, respectively. Only for the Xpa(+/+)p53(−/−) cells did the damage appear higher than for the Xpa(−/−)p53(−/−) cells for both MN and MN + C.
Fig. 3.
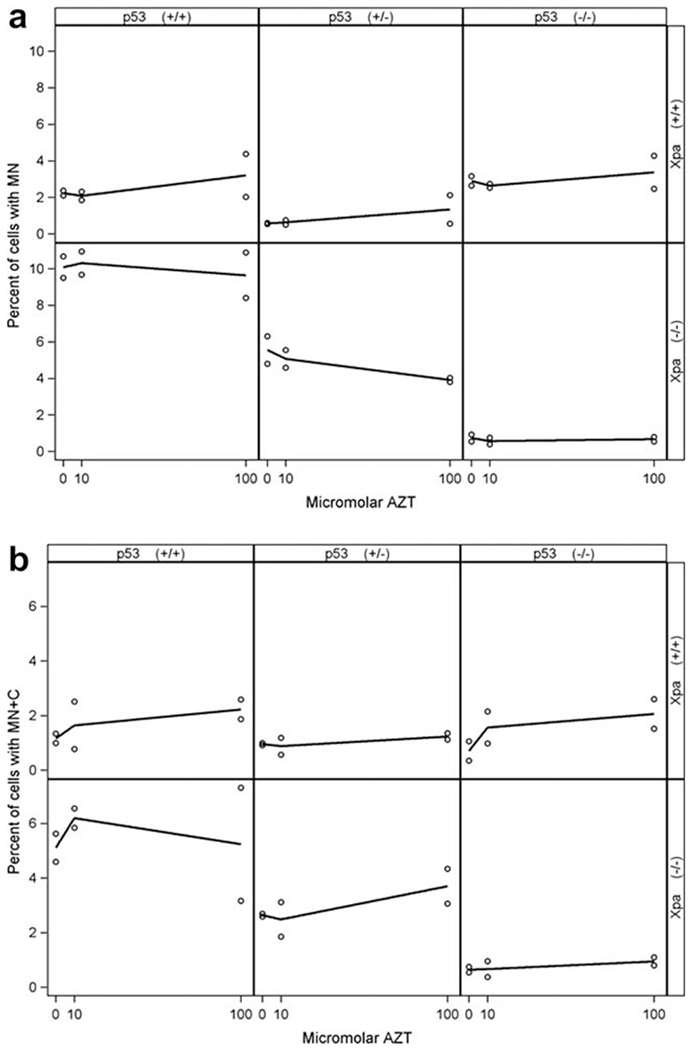
Percent of cells with MN (a ordinate) and MN + C (b) plotted as a function of AZT dose (abscissa), by mouse genotype, as dot plots with loess lines. Similar MN + C incidence is observed in cells of the Xpa(+/+) genotype (- - -) for the three p53 genotypes, but this is not the case for Xpa(−/−) cells (o). There was one mouse per genotype, and two slides (cell lines) per mouse.
Overall the data suggest that, whereas AZT induces marginal dose-related MN + C effects in these cells, there are significant differences in endogenous damage levels, related to cellular protective capacity provided by Xpa and p53 status. Additionally, chromosomal breaks and losses are influenced by intact NER capacity. However unlike CA which was observed at high levels in the Xpa(−/−)p53(−/−) cells, these same cells had very low levels of MN and MN + C. Although the percentage MN + C and MN are highly correlated, the percentage MN + C does not vary much among the three p53 genotypes when Xpa is (+/+). Conversely, the percentage MN + C varies considerably among the three p53 levels within the Xpa null genotype.
DISCUSSION
This study was designed to address the interaction between Xpa and p53 in the disposition of AZT in cultured mesenchymal cells taken from mice of six different genotypes. The genotoxic end points evaluated included: CA, which occurs frequently in almost all types of cancer and is a major contributing factor to chromosome instability in cancer cells; MN, comprising loss of chromosomal fragments that do not contain a centromere; and MN + C, defined as MN containing chromosomal fragments, which include a centromere, resulting in aneuploidy in the parent cell. The overall conclusion here is that both Xpa and p53 contribute to the protection of cells from AZT-induced genotoxic damage, but the type and extent of protection also depend on the end point being examined. For CA it is clear that there is an interaction between AZT dose, Xpa status and p53 status, and that in cells haploinsufficient for p53 the Xpa(+/+) protection is more effective than even in the WT cells. In addition, in Xpa(−/−)p53(+/−) cells there were high levels of CA damage in the absence of an AZT dose-response. For the MN and MN + C endpoints, there was no dose response for AZT, so the effects observed are presumably due to endogenous events. Loss of both Xpa alleles resulted in increased levels of MN when p53 was either (+/+) or (+/−). However in p53(−/−) cells, Xpa null status resulted in lower levels of both MN and MN + C, compared with the corresponding Xpa(+/+) mice. The data suggest that events required for the formation of MN and MN + C are somehow impaired in the Xpa(−/−)p53(−/−) cells.
For the CA endpoint, the data showed increases with dose of AZT for four of the six genotypes. There was no dose response with the Xpa(−/−)p53(−/−) cells, which also sustained the highest levels of endogenous CA damage. In addition, the Xpa(+/+)p53(+/−) cells showed no dose-response and had very low levels of damage, suggesting that, compared with the WT cells, p53 haploinsufficiency is protective against AZT-induced damage when paired with the Xpa(+/+) genotype. Interestingly the Xpa(−/−)p53(+/−) cells had significantly higher levels of CA damage than their Xpa(+/+) counterparts, and this was the only combination in which CA incidence significantly increased in the absence of the Xpa gene. Although the protective role of p53 haploinsufficiency remains obscure, a similar phenomenon has been reported [van Gijssel et al., 2007]. These investigators found low levels of cisplatin-DNA adducts in mouse p21 (WAF/Cip1) heterozygous keratinocytes, compared with their WT or null counterparts. Apparently DNA replication arrest and apoptosis do not completely explain the low levels of cisplatin-DNA adducts in the p21(+/−) cells, suggesting that this genotype results in either low cisplatin-DNA adduct formation or enhanced cisplatin-DNA adduct removal. In our study p53 haploinsufficiency was protective against AZT-induced DNA damage suggesting that these interactions may be worthy of further investigation. Also, because p53 plays a role in centrosomal cycle regulation, lack of both p53 alleles may result in unregulated centrosome replication, leading to centrosome amplification and chromosome instability [Fukasawa, 2008].
There is cross talk between the cell cycle, DNA damage signaling and the centrosomal cycle. Recent studies have shown that several DNA repair proteins localize to the centrosome and are involved in the regulation of centrosome number, possibly through cell cycle checkpoints or direct modification of centrosome proteins [Shimada and Komatsu, 2009; Smith and Costanzo, 2009]. It has been hypothesized that one of the mechanisms for CA formation is the lack of synchronization between centrosomal cycle and cell cycle regulation. Hence, DNA damage signaling resulted in an arrest of the cell cycle and amplification of centrosomes [Rai et al., 2008; Saladino et al., 2009]. Additionally it has been shown that centrin-2, a structural protein located on microtubules binds to XPC, most probably regulating the dynamic of both, cell and centrosomal cycles [Nishi et al., 2005; Thompson et al., 2006; Yang et al., 2006; Miron et al., 2008; Sugasawa, 2008; Acu et al., 2010; Clement et al., 2010]. Interestingly, direct interaction between centrosomal proteins and DNA damage has been reported [Acu et al., 2010], and mounting evidence suggests that the cell and centrosomal cycles are regulated in order to prevent abnormal cells from progressing into cell division [Fukasawa, 2005]. Following DNA damage, MCF-7 cells experience a translocation of the centrosome protein centrin-2 from the cytoplasm to the nucleus reducing the cytoplasmic availability of the protein and preventing CA [Acu et al., 2010]. There is evidence that individuals with Seckel syndrome, a disorder of markedly reduced brain and body size, have a mutation in pericentrin, a protein associated to centrosomes, that abrogates the signaling checkpoint ATR (ataxia-telangiectasia mutated and RAD3-related [Cimprich and Cortez, 2008] damage [Griffith et al., 2008]. Furthermore, cells of individuals with Seckel syndrome due to mutations in pericentrin have defects in ATR-dependent checkpoint signaling, providing the first evidence linking a structural centrosomal protein with DNA damage signaling [Griffith et al., 2008].
Overall this study, performed in cells cultured from mice of different Xpa and p53 genotypes and treated with AZT, shows that CA induced by AZT can be elevated in cells that lack an intact NER pathway, and that p53 also plays a role in protection against some manifestations of AZT-induced DNA damage. Because NRTI-induced DNA damage is currently considered to be repaired by base excision repair (BER) [Sampath et al., 2003], with just one report indicating the potential role of NER in the removal of molar amounts of AZT in transformed hepatic cells [Wu et al., 2013], we found these findings unexpected and worthy of further investigation.
Supplementary Material
ACKNOWLEDGMENTS
The authors would like to thank Karen Hathcock and Masashi Watanabe from the Immune Regulation Section of the Experimental Immunology Branch, CCR, NCI, NIH for providing the Xpa (+/+)p53(+/−) mice used in this study.
Grant sponsors: Intramural Research Program of the NIH, National Cancer Institute, Center for Cancer Research (CCR).
Abbreviations
- ATR
ataxia-telangiectasia mutated and RAD3-related
- AZT
3′-azidoG′-deoxythymidine, Zidovudine, Retrovir®
- BSA
Bovine serum albumin
- CA
centrosome amplification defined as greater than two centrosomes/cell
- CI
95% confidence interval
- CREST antiserum
calcinosis, Raynaud’s phenomenon, esophageal dysfunction, sclerodactyly, and telangiectasia antiserum
- DAPI
4′,6-diamidino-2-phenylindole
- DPBS
Dulbecco’s phosphate-buffered saline
- LS
least squares
- MN
micronucleus
- MN + C
micronucleus containing ≥1 whole chromosome(s)
- NER
nucleotide excision repair
- NRTI
nucleoside reverse transcriptase inhibitor
- PBS
phosphate buffered saline
- RPMI
Roswell Park Memorial Institute
- WT
Wild type
- Xpa
xeroderma pigmentosum complementation group A
Footnotes
This article is a U.S. Government work and is in the public domain in the USA.
Additional Supporting Information may be found in the online version of this article.
REFERENCES
- Acu ID, Liu T, Suino-Powell K, Mooney SM, D’Assoro AB, Rowland N, Muotri AR, Correa RG, Niu Y, Kumar R, et al. 2010. Coordination of centrosome homeostasis and DNA repair is intact in MCF-7 and disrupted in MDA-MB 231 breast cancer cells. Cancer Res 70(8):3320–3328. [DOI] [PMC free article] [PubMed] [Google Scholar]
- Bakhanashvili M, Grinberg S, Bonda E, Rahav G. 2009. Excision of nucleoside analogs in mitochondria by p53 protein. AIDS 23(7): 779–788. [DOI] [PubMed] [Google Scholar]
- Cimprich KA, Cortez D. 2008. ATR: An essential regulator of genome integrity. Nat Rev Mol Cell Biol 9(8):616–627. [DOI] [PMC free article] [PubMed] [Google Scholar]
- Clement FC, Camenisch U, Fei J, Kaczmarek N, Mathieu N, Naegeli H. 2010. Dynamic two-stage mechanism of versatile DNA damage recognition by xeroderma pigmentosum group C protein. Mutat Res 685(1-2):21–28. [DOI] [PubMed] [Google Scholar]
- de Vries A, Dolle ME, Broekhof JL, Muller JJ, Kroese ED, van Kreijl CF, Capel PJ, Vijg J, van Steeg H. 1997. Induction of DNA adducts and mutations in spleen, liver and lung of XPA-dehcient/lacZ transgenic mice after oral treatment with benzo[a]pyrene: Correlation with tumour development. Carcinogenesis 18(12): 2327–2332. [DOI] [PubMed] [Google Scholar]
- de Vries A, van Oostrom CT, Hofhuis FM, Dortant PM, Berg RJ, de Gruijl FR, Wester PW, van Kreijl CF, Capel PJ, van Steeg H, et al. 1995. Increased susceptibility to ultraviolet-B and carcinogens of mice lacking the DNA excision repair gene XPA. Nature 377(6545):169–173. [DOI] [PubMed] [Google Scholar]
- Divi RL, Beland FA, Fu PP, Von Tungeln LS, Schoket B, Camara JE, Ghei M, Rothman N, Sinha R, Poirier MC. 2002. Highly sensitive chemiluminescence immunoassay for benzo[a]pyrene-DNA adducts: Validation by comparison with other methods, and use in human biomonitoring. Carcinogenesis 23(12):2043–2049. [DOI] [PubMed] [Google Scholar]
- Dobrovolsky VN, Shaddock JG, Mittelstaedt RA, Bishop ME, Lewis SM, Lee FW, Aidoo A, Leakey JE, Dunnick JK, Heflich RH. 2007. Frequency of Hprt mutant lymphocytes and micronucleated erythrocytes in p53-haplodehcient mice treated perinatally with AZT and AZT in combination with 3TC. Environ Mol Mutagen 48(3-4):270–282. [DOI] [PubMed] [Google Scholar]
- Fukasawa K 2005. Centrosome amplification, chromosome instability and cancer development. Cancer Lett 230(1):6–19. [DOI] [PubMed] [Google Scholar]
- Fukasawa K 2008. P53, cyclin-dependent kinase and abnormal amplification of centrosomes. Biochim Biophys Acta 1786(1):15–23. [DOI] [PMC free article] [PubMed] [Google Scholar]
- Griffith E, Walker S, Martin CA, Vagnarelli P, Stiff T, Vernay B, Al Sanna N, Saggar A, Hamel B, Earnshaw WC, et al. 2008. Mutations in pericentrin cause Seckel syndrome with defective ATR-dependent DNA damage signaling. Nat Genet 40(2):232–236. [DOI] [PMC free article] [PubMed] [Google Scholar]
- Hanawalt PC. 1994. Transcription-coupled repair and human disease. Science 266:1957–1958. [DOI] [PubMed] [Google Scholar]
- Hanawalt PC. 1995. DNA repair comes of age. Mutat Res 336:101–113. [DOI] [PubMed] [Google Scholar]
- Hoogervorst EM, de Vries A, Beems RB, van Oostrom CT, Wester PW, Vos JG, Bruins W, Roodbergen M, Cassee FR, Vijg J, et al. 2003. Combined oral benzo[a]pyrene and inhalatory ozone exposure have no effect on lung tumor development in DNA repair-deficient Xpa mice. Carcinogenesis 24(3):613–619. [DOI] [PubMed] [Google Scholar]
- John K, Pratt MM, Beland FA, Churchwell MI, McMullen G, Olivero OA, Pogribny IP, Poirier MC. 2012. Benzo[a]pyrene (BP) DNA adduct formation in DNA repair-deficient p53 haploinsufficient [Xpa(−/−)p53(+/−)] and wild-type mice fed BP and BP plus chlorophyllin for 28 days. Carcinogenesis 33(11):2236–2241. [DOI] [PMC free article] [PubMed] [Google Scholar]
- Miron S, Duchambon P, Blouquit Y, Durand D, Craescu CT. 2008. The carboxy-terminal domain of xeroderma pigmentosum complementation group C protein, involved in TFIIH and centrin binding, is highly disordered. Biochemistry 47(5):1403–1413. [DOI] [PubMed] [Google Scholar]
- Nishi R, Okuda Y, Watanabe E, Mori T, Iwai S, Masutani C, Sugasawa K, Hanaoka F. 2005. Centrin 2 stimulates nucleotide excision repair by interacting with xeroderma pigmentosum group C protern. Mol Cell Biol 25(13):5664–5674. [DOI] [PMC free article] [PubMed] [Google Scholar]
- NTP. 2012. Toxicology and Carcinogenesis of 3′-Azido-3′-Deoxythymidine (AZT) (CAS No. 30516-87-1) Genetically Modified C3B6.129F1-Trp53tm1Brd N12 Haploinsufficient Mice (in utero and postnatal gavage studies). [PMC free article] [PubMed] [Google Scholar]
- Olivero OA. 2007. Mechanisms of genotoxicity of nucleoside reverse transcriptase inhibitors. Environ Mol Mutagen 48(3-4):215–223. [DOI] [PubMed] [Google Scholar]
- Olivero OA, Anderson LM, Diwan BA, Haines DC, Harbaugh SW, Moskal TJ, Jones AB, Rice JM, Riggs CW, Logsdon D, et al. 1997. Transplacental effects of 3’-azido-2’,3’-dideoxythymidine (AZT): Tumorigenicity in mice and genotoxicity in mice and monkeys. J Natl Cancer Inst 89:1602–1608. [DOI] [PubMed] [Google Scholar]
- Oren M, Rotter V. 1999. Introduction: p53--the first twenty years. Cell Mol Life Sci 55(1):9–11. [DOI] [PMC free article] [PubMed] [Google Scholar]
- Poirier MC, Olivero OA, Walker DM, Walker VE. 2004. Perinatal genotoxicity and carcinogenicity of anti-retroviral nucleoside analog drugs. Toxicol Appl Pharmacol 199(2):151–161. [DOI] [PubMed] [Google Scholar]
- Rai R, Phadnis A, Haralkar S, Badwe RA, Dai H, Li K, Lin SY. 2008. Differential regulation of centrosome integrity by DNA damage response proteins. Cell Cycle 7(14):2225–2233. [DOI] [PMC free article] [PubMed] [Google Scholar]
- Saladino C, Bourke E, Conroy PC, Morrison CG. 2009. Centriole separation in DNA damage-induced centrosome amplification. Environ Mol Mutagen 50(8):725–732. [DOI] [PubMed] [Google Scholar]
- Sampath D, Rao VA, Plunkett W. 2003. Mechanisms of apoptosis induction by nucleoside analogs. Oncogene 22(56):9063–9074. [DOI] [PubMed] [Google Scholar]
- Shimada M, Komatsu K. 2009. Emerging connection between centrosome and DNA repair machinery. J Radiat Res 50(4):295–301. [DOI] [PubMed] [Google Scholar]
- Smith E, Costanzo V. 2009. Responding to chromosomal breakage during M-phase: insights from a cell-free system. Cell Div 4:15. [DOI] [PMC free article] [PubMed] [Google Scholar]
- Sugasawa K 2008. XPC: Its product and biological roles. Adv Exp Med Biol 637:47–56. [DOI] [PubMed] [Google Scholar]
- Thompson JR, Ryan ZC, Salisbury JL, Kumar R. 2006. The structure of the human centrin 2-xeroderma pigmentosum group C protein complex. J Biol Chem 281(27):18746–18752. [DOI] [PubMed] [Google Scholar]
- van Gijssel HE, Leil TA, Weinberg WC, Divi RL, Olivero OA, Poirier MC. 2007. Cisplatin-DNA damage in p21WAF1/Cip1 deficient mouse keratinocytes exposed to cisplatin. Mutagenesis 22(1):49–54. [DOI] [PubMed] [Google Scholar]
- van Steeg H, de VA, van Oostrom CT, van BJ, Beems RB, van Kreijl CF. 2001. DNA repair-deficient Xpa and Xpa/p53+/− knock-out mice: Nature of the models. Toxicol Pathol 29 Suppl:109–116. [DOI] [PubMed] [Google Scholar]
- Wu Q, Beland FA, Chang CW, Fang JL. 2013. Role of dna repair pathways in response to zidovudine-induced DNA damage in immortalized human liver THLE2 Cells. Int J Biomed Sci 9(1):18–25. [PMC free article] [PubMed] [Google Scholar]
- Yang A, Miron S, Mouawad L, Duchambon P, Blouquit Y, Craescu CT. 2006. Flexibility and plasticity of human centrin 2 binding to the xeroderma pigmentosum group C protein (XPC) from nuclear excision repair. Biochemistry 45(11):3653–3663. [DOI] [PubMed] [Google Scholar]
Associated Data
This section collects any data citations, data availability statements, or supplementary materials included in this article.