

Abstract
Human monocytic cells in blood have important roles in host defense and express the enzyme carboxylesterase 1 (CES1). This metabolic serine hydrolase plays a critical role in the metabolism of many molecules, including lipid mediators called prostaglandin glyceryl esters (PG-Gs), which are formed during cyclooxygenase-mediated oxygenation of the endocannabinoid 2-arachidonoylglycerol. Some PG-Gs have been shown to exhibit anti-inflammatory effects; however, they are unstable compounds, and their hydrolytic breakdown generates pro-inflammatory prostaglandins. We hypothesized that by blocking the ability of CES1 to hydrolyze PG-Gs in monocytes/macrophages, the beneficial effects of anti-inflammatory prostaglandin D2-glyceryl ester (PGD2-G) could be augmented. The goals of this study were to determine whether PGD2-G is catabolized by CES1, evaluate the degree to which this metabolism is blocked by small-molecule inhibitors, and assess the immunomodulatory effects of PGD2-G in macrophages. A human monocytic cell line (THP-1 cells) was pretreated with increasing concentrations of known small-molecule inhibitors that block CES1 activity [chlorpyrifos oxon (CPO), WWL229, or WWL113], followed by incubation with PGD2-G (10 μM). Organic solvent extracts of the treated cells were analyzed by liquid chromatography with tandem mass spectrometry to assess levels of the hydrolysis product PGD2. Further, THP-1 monocytes with normal CES1 expression (control cells) and “knocked-down” CES1 expression (CES1KD cells) were employed to confirm CES1’s role in PGD2-G catabolism. We found that CES1 has a prominent role in PGD2-G hydrolysis in this cell line, accounting for about 50% of its hydrolytic metabolism, and that PGD2-G could be stabilized by the inclusion of CES1 inhibitors. The inhibitor potency followed the rank order: CPO > WWL113 > WWL229. THP-1 macrophages co-treated with WWL113 and PGD2-G prior to stimulation with lipopolysaccharide exhibited a more pronounced attenuation of pro-inflammatory cytokine levels (interleukin-6 and TNFα) than by PGD2-G treatment alone. In contrast, prostaglandin E2-glyceryl ester (PGE2-G) had opposite effects compared to those of PGD2-G, which appeared to be dependent on the hydrolysis of PGE2-G to PGE2. These results suggest that the anti-inflammatory effects induced by PGD2-G can be further augmented by inactivating CES1 activity with specific small-molecule inhibitors, while pro-inflammatory effects of PGE2-G are attenuated. Furthermore, PGD2-G (and/or its downstream metabolites) was shown to activate the lipid-sensing receptor PPARγ, resulting in altered “alternative macrophage activation” response to the Th2 cytokine interleukin-4. These findings suggest that inhibition of CES1 and other enzymes that regulate the levels of pro-resolving mediators such as PGD2-G in specific cellular niches might be a novel anti-inflammatory approach.
1. Introduction
Carboxylesterases (CESs) are members of the serine hydrolase superfamily1 and exhibit broad substrate specificity toward exogenous and endogenous substrates containing carboxylic ester functional groups.2 These include diverse groups of molecules including pesticides (malathion and permethrin), drugs (irinotecan and clopidogrel), and lipids [triacylglycerol, 2-arachidonoylglycerol (2-AG), and their oxygenated metabolites].3−5 They are best known for being vital degradative enzymes of ester-containing toxicants and drugs that are absorbed into the body.6 In humans, CESs are expressed abundantly at portals of entry for xenobiotics, such as the small intestine and liver.7 In addition, they also have roles in mobilizing triacylglycerol onto very low-density lipoproteins (VLDLs) in the liver for subsequent VLDL secretion into the circulation.8 Humans contain 4 protein-encoding CES genes, whereas mice have at least 20 Ces genes caused by multiple gene duplication events during their evolutionary history.9 CES1 is the most abundant isoform in human liver and also expressed in human monocyte-derived macrophages and human alveolar macrophages.10,11 One putative function of CES1 in macrophages is to mobilize free cholesterol from neutral lipid droplets for their eventual efflux onto nascent high-density lipoprotein particles.10 Previously, we found that CES1 activity in macrophages could be inhibited by organophosphate toxicants, thereby preventing the efflux of cholesterol from these cells.4 Furthermore, inactivation of CES1 function led to increased endocannabinoid (2-AG) levels in macrophages.12 2-AG is known to exhibit several immunomodulatory activities, including anti-inflammatory and possibly anti-oxidative effects.13 For example, we reported that a cell line that overexpresses Nox2, the main nicotinamide adenine dinucleotide phosphate oxidase isoform in phagocytic cells, synthesizes significantly larger quantities of 2-AG than its parental cell line following stimulation by inflammatory fatty acids, suggesting that 2-AG may exert homeostatic effects that counteract oxyradical stress.14 2-AG and its cyclooxygenase (COX)-derived oxygenated metabolites,15,16 that is, the prostaglandin glyceryl esters (PG-Gs; Figure 1 illustrates the production of one of these lipid compounds), might influence the linkages that exist between oxidative stress and inflammatory diseases.5,17 Thus, chemical compounds that can prevent the degradation of 2-AG and PG-Gs in biological systems by inhibiting the hydrolytic enzymes that catabolize these bioactive lipid mediators could be useful tools to increase their local concentrations, thereby attenuating oxidative and inflammatory stress.14,18,19
Figure 1.

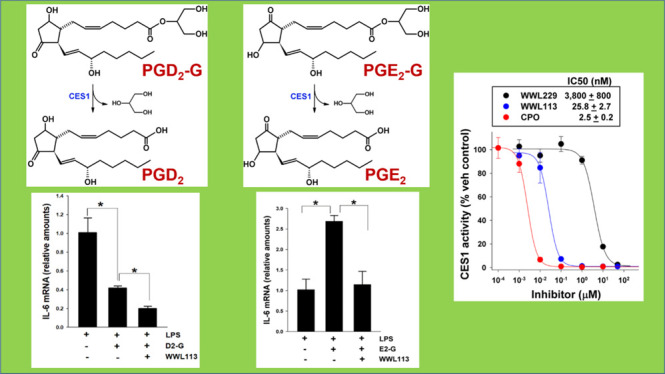
PGD2-G biosynthesis and catabolism. The production of PGD2-G via oxygenation of 2-AG by COX enzymes and its hydrolytic degradation are shown.
PG-Gs can exert biological activity through their direct interaction with cellular receptors, triggering Ca2+ mobilization, inositol 1,4,5-trisphosphate synthesis, and activation of protein kinase C.20,21 However, the study of these lipid mediators is complicated because some of their biological effects are due to the action of their corresponding free prostaglandins.20,22 These issues increase the importance of better understanding the cellular effects of PG-Gs in various contexts. In this vein, prostaglandin D2-glyceryl ester (PGD2-G) was shown to have pronounced anti-inflammatory effects in mouse macrophages, whereas its regioisomer prostaglandin E2-glyceryl ester (PGE2-G) exhibited pro-inflammatory effects.23 Furthermore, in vivo generation of PG-Gs has been reported in the hind paw of a rat model of carrageenan-induced inflammation24 and during lipopolysaccharide (LPS)-induced inflammation in the brain of a mouse model that overexpresses COX2 in this tissue.25 In the current study, we have further examined the metabolism and immunoregulatory effects of PGD2-G and PGE2-G (and their corresponding free prostaglandins) in THP-1 monocytes/macrophages, a human cell line that expresses CES1, and to a more limited extent in mouse macrophages. We evaluated the effects of these two lipid mediators on LPS- and interleukin-4 (IL-4)-mediated responses of macrophages in the presence and absence of CES1 small-molecule inhibitors. Inflammatory readouts were assessed by measuring “classical” pro-inflammatory cytokines or “alternative macrophage activation” markers.
2. Results
2.1. Inhibition of CES1 Activity by WWL113 and WWL229
We first assessed the potency of two small-chemical inhibitors of CES1 activity, WWL113 and WWL229, and chlorpyrifos oxon (CPO), an organophosphate poison that inhibits CES1 among other serine hydrolases.12 Using recombinant human CES1 enzyme and the substrate para-nitrophenol valerate (p-NPV), we determined IC50s for each compound (Figure 2A), which showed that WWL113 was more potent than WWL229 but not as potent as CPO. Next, we used cell lysates and intact cells to assess the degree of inhibition these compounds exerted on CES activity (Figure 2B). WWL113 and WWL229, each at a nominal concentration of 1 μM, inhibited ∼70% of the CES1 activity in living monocytes, indicating good bioavailability of the inhibitor at the enzyme active site in intact cells. Engagement of CES1 by WWL229 in intact cells was further shown by gel-based activity-based protein profiling (ABPP) using either the fluorophosphonate (FP)–biotin probe (Figure 2C) or the FP–TAMRA probe (Figure 2G). The diminished band intensity at 60 kDa (molecular weight of CES1) indicated that CES1 activity in living cells was reduced by the compound in a concentration-dependent manner, whereas CES1 protein levels remained unchanged. These ABPP results for WWL229 are similar to those for WWL113 in THP-1 cells, which we previously reported.18
Figure 2.

CES1 inhibition by small-molecule inhibitors. (A) Potencies of inhibitors against recombinant human CES1 enzyme activity are indicated. The ester-containing substrate was p-NPV. (B) THP-1 cell lysates or intact monocytes were preincubated with the indicated inhibitor (1 μM) for 15 min and then treated with p-NPV to assess CES activity. (C) ABPP using the probe FP–biotin shows that WWL229 can inactivate CES1 activity in intact monocytes. Immunoblot indicates that CES1 protein levels are unaltered by inhibitor treatment; however, the reduced band intensity in the gel-based ABPP indicates that CES1 activity could be blocked in situ by WWL229. At 10 and 30 μM inhibitor treatments, minimal CES1 activity remains in the cells. (D,E) Monocytes were preincubated with the indicated amount of inhibitor and then treated with exogenous PGD2-G (10 μM, D; 0.1 μM, E). (F) Immunoblot and gel-based ABPP of control (scrambled shRNA) and CES1KD (CES1 shRNA) monocyte lysates confirms that CES1 expression and its enzymatic activity are ablated in CES1KD cells (left). Intact CES1KD and control monocytes incubated with exogenous PGD2-G (10 μM, 1 h). The extent of PGD2-G hydrolysis in CES1KD cells was ∼50% of that in control cells (right). Knockdown of CES1 expression was efficient because the addition of WWL113 to CES1KD lysates did not further diminish PGD2-G hydrolysis activity (inset). There is still residual hydrolytic activity, however, in the CES1KD cells; thus other enzymes besides CES1 must also metabolize PGD2-G. (G) Gel-based ABPP using the probe FP–TAMRA further indicated that CES1 in intact monocytes could be selectively inhibited by WWL229 treatment (only the CES1 band intensity is reduced in concentration-dependent manner). The full gel and the cropped CES1 region are both shown. Recombinant CES1 was used as a positive control. Gel lane designated as heat represents an aliquot of monocytes that was heat killed (95 °C, 5 min) before treating with FP–TAMRA. Data in bar graphs in figure represent the mean ± SD (n = 3–4); *p < 0.05, one-way ANOVA with SNK post hoc test or t-test. ns, not significant.
2.2. Inhibition of PGD2-G Catabolism in Intact Cells
Intact monocytic cells and recombinant human CES1 can catabolize exogenous PGD2-G, liberating free PGD2 in the process (time courses are given in Figure S1A,B). We used the three different chemical inhibitors (CPO, WWL229, and WWL113) to pretreat intact cells before adding exogenous PGD2-G (10 μM). As shown in Figure 2D, all three compounds prevented the hydrolysis of PGD2-G to PGD2 in a concentration-dependent manner. The rank order of potency was CPO > WWL113 > WWL229, which is the same as that for recombinant CES1 treated with the same compounds (Figure 2A). The degree of inhibition by WWL229 was even more pronounced when exogenous PGD2-G was added at a low concentration (0.1 μM; Figure 2E). Furthermore, when control and CES1 knockdown monocytic cells (knockdown confirmed by immunoblot and gel-based ABPP, Figure 2F, left) were treated with exogenous PGD2-G, its hydrolytic metabolism was reduced by 50% in CES1KD cells compared to control cells (Figure 2F, right). Addition of WWL113 to the CES1KD cells did not further decrease PGD2-G hydrolysis (Figure 2F, inset), suggesting that CES1 knockdown was complete and that WWL113 did not inhibit other enzymes that hydrolyze PGD2-G. Collectively, these results suggested that PGD2-G is a labile lipid mediator and can be stabilized in THP-1 monocytes/macrophages by inclusion of CES1 inhibitors, an approach that might enhance the anti-inflammatory actions of this lipid mediator.
2.3. Treatment of Macrophages with PG-Gs and PGs Modulates LPS-Induced Inflammatory Responses
To verify that PGD2-G exhibits anti-inflammatory activity in our hands, we treated mouse resident peritoneal macrophages with LPS and combinations of PGD2-G and WWL113 or WWL70. (WWL70 is an inhibitor of ABHD6 and known to enhance PGD2-G’s effects23). PGD2-G significantly attenuated LPS-induced IL1b and IL6 messenger RNA (mRNA) levels but did not affect TNFa levels (Figure 3A), although they did trend downward. Inclusion of either WWL113 or WWL70 potentiated the effect of PGD2-G on IL6 mRNA levels. On the other hand, WWL70 but not WWL113 augmented the effect of PGD2-G on IL1b levels, whereas WWL113 but not WWL70 augmented the effect on TNFa levels. Thus, the addition of serine hydrolase small-molecule inhibitors appeared to enhance the anti-inflammatory activity of PGD2-G in mouse macrophages, which confirmed a previous study.23 The effects of these inhibitors on IL6 expression in mouse macrophages are likely caused by ABHD6 inhibition because it is an off target of WWL113 and the primary target of WWL70.26,27 In contrast, the strong response of WWL113 on TNFa levels appears to be independent of ABHD6 inactivation because WWL70 had no impact on this cytokine.
Figure 3.

Cytokine modulating effects of PG-Gs in macrophages. (A) LPS-induced cytokine levels in mouse resident peritoneal macrophages were attenuated by PGD2-G, an effect augmented by the indicated serine hydrolase inhibitors. Freshly isolated peritoneal macrophages were treated with LPS in the absence and presence of combinations of PGD2-G and WWL113 (CES1 inhibitor) or WWL70 (ABHD6 inhibitor). (B,C) LPS-induced IL-6 mRNA (RT-qPCR, B) and IL-6 protein (ELISA, C) in human macrophages were diminished by addition of exogenous PGD2-G (abbreviated as D2-G). This reduction was potentiated further by WWL113. The small-molecule inhibitor appears to stabilize the labile PGD2-G, thus enhancing the anti-inflammatory effects of this lipid mediator. (D,E) LPS-induced IL-6 levels mRNA (RT-qPCR, D) and IL-6 protein (ELISA, E) in human macrophages were potentiated by addition of exogenous PGE2-G (abbreviated E2-G). This effect was prevented by including WWL113. (F) LC–MS/MS targeted analysis of extracts of culture medium. The relative levels of PGE2 are indicated. Data represents the mean ± SD (n = 3–4); *p < 0.05, one-way ANOVA with SNK post hoc test.
We next used the human THP-1 macrophage cell line to evaluate the effects of PG-Gs and WWL113 on LPS-induced cytokine production. ABHD6 is not expressed to any significant degree in this cell line, whereas CES1 is strongly expressed;12 thus, we chose WWL113 because the inhibition studies (Figure 2A) demonstrated that it was a more potent CES1 inhibitor than WWL229. In terms of cytokine levels, THP-1 macrophages responded to LPS stimulus as expected (Figure S2). Moreover, when macrophages were treated concurrently with LPS and PGD2-G, the levels of IL6 mRNA and interleukin-6 (IL-6) protein were significantly attenuated as compared to those after LPS treatment alone (Figure 3B,C). The reduction in IL-6 levels was augmented further by the inclusion of WWL113. This result suggested that inhibiting the degradation of PGD2-G might potentiate its anti-inflammatory activity. PGD2-G also attenuated TNFa mRNA levels but not IL1b (Figure S3A). On the other hand, when macrophages were treated concurrently with LPS and PGE2-G, the levels of IL6 mRNA and IL-6 protein were significantly increased compared to those after LPS treatment alone (Figure 3D,E). However, the effects of PGE2-G on LPS-induced IL-6 levels were prevented by the inclusion of WWL113, which suggested that the hydrolysis of PGE2-G to PGE2 was in part responsible for its augmented pro-inflammatory effect. Support for this comes from liquid chromatography with tandem mass spectrometry (LC–MS/MS) analyses of extracts of the conditioned culture media after concurrent treatment of cells with LPS and PGE2-G in the absence and presence of WWL113 (Figure 3F). When WWL113 was present, the level of free PGE2 was reduced compared to that when it was absent. In addition, PGE2-G had no effect on LPS-induced TNFa and IL1b mRNA levels (Figure S3B), suggesting a degree of specificity in its ability to alter the levels of LPS-induced cytokines.
When macrophages were treated concurrently with LPS and free PGE2, the level of IL6 mRNA was markedly increased compared to that after LPS treatment alone (Figure 4A). Similar effects were seen on TNFa and IL1b mRNA levels (Figure S3C). In addition, WWL113 seemed to enhance the PGE2-augmented cytokine levels even further. In contrast, when macrophages were treated concurrently with LPS and PGD2, the level of IL6 mRNA was significantly attenuated compared to that after LPS treatment alone (Figure 4B), and inclusion of WWL113 had no further effect on IL6 mRNA levels. Similar effects by PGD2 were also seen on TNFa and IL1b mRNA levels (Figure S3D). Together, these findings indicate that exogenous PGE2 exerts pro-inflammatory effects that augment LPS-induced cytokine production, an effect that was potentiated by the CES1 inhibitor (WWL113). Conversely, exogenous PGD2 appeared to exert an anti-inflammatory effect by attenuating LPS-induced cytokine production, an effect that was not further altered by WWL113.
Figure 4.

(A) LPS-induced IL6 mRNA levels in human macrophages were potentiated by addition of exogenous PGE2, an effect made greater by WWL113. (B) On the other hand, PGD2 attenuated LPS-induced IL6 mRNA, an effect that was not altered by WWL113. Data represent the mean ± SD (n = 3–4); *p < 0.05, one-way ANOVA with SNK post hoc test.
WWL113 also potentiated the anti-inflammatory effects of exogenous 2-AG in the setting of LPS-mediated IL6 and TNFa mRNA production by THP-1 macrophages (Figure S4A). 2-AG did not affect LPS-induced IL1b levels, although combining 2-AG with WWL113 seemed to enhance its expression. The attenuating effect of 2-AG on IL6 expression appears to be mediated by the CB1 receptor because the inverse agonist rimonabant could block this effect (Figure S4B). WWL113 and WWL229 both attenuated the levels of LPS-induced IL6 (Figure S4C) and TNFa (data not shown) in the absence of exogenous 2-AG. Thus, CES1 inhibitors by themselves attenuate LPS-induced IL6 and TNFa mRNA levels, mimicking the effects of exogenous 2-AG.
2.4. Possible Role of PPARγ in the Immunomodulatory Effects Mediated by PGD2-G and PGD2 during M(IL-4) Activation of Macrophages
The anti-inflammatory effects elicited by PGD2 (Figures 4 and S2D) may be related to its ability to directly or indirectly activate the nuclear receptor PPARγ, as indicated by a PPAR-RE reporter assay (Figure 5A). Of the PGs and PG-Gs examined, PGD2 was the most potent activator of PPARγ reporter activity, and PGD2-G was more potent than PGE2-G (Figure 5A, inset). Moreover, in the setting of IL-4 exposure (where PPARγ has an important functional role28), PGD2 strongly induced the expression of FABP4 mRNA, a canonical PPARγ ligand-regulated gene (Figure 5B, left). This effect, however, was strongly attenuated when PPARg gene expression was knocked down, implicating the need for PPARγ in this induction. Similarly, PGD2-induced FABP4 expression was attenuated in macrophages treated with the PPARγ antagonist GW9662 (Figure 5C, left). These findings are consistent with the idea that PGD2, or a downstream metabolite of it (e.g., 15-deoxy-Δ12,14-PGJ2), can activate the nuclear receptor PPARγ. Additionally, it was of interest that M(IL-4)-induced ALOX15 mRNA expression was attenuated in PPARg KD macrophages relative to that in control macrophages (Figure 5B, right), and in THP-1 macrophages treated with GW9662 (Figure 5C, right). The addition of exogenous PGD2 in the setting of IL-4 exposure further attenuated the expression of ALOX15 in both the control and PPARg KD macrophages relative to those treated with IL-4 only (Figure 5B, right). It was also notable that GW9662 did not block the attenuating effect of PGD2 on ALOX15 expression (Figure 5C, right), suggesting a complex PPARγ-independent regulation of ALOX15. Our current data indicates that PGD2 disrupts the phosphorylation of STAT6 caused by IL-4/IL-4Rα-mediated stimulation of JNKs, resulting in decreased ALOX15 expression (Scheaffer et al., in preparation). At this stage, we do not understand the mechanisms responsible for this effect, although it appears to be independent of either PPARγ or the D-type prostanoid receptor 1 (DP1) (data not shown).
Figure 5.

(A) PG-Gs and free PGs can to varying degrees activate PPARγ transcriptional activity—each lipid mediator was assessed at a concentration of 10 μM. Concentration-dependent responses of PGD2-G and PGE2-G on PPARγ activity indicated that PGD2-G was more potent than PGE2-G (inset). (B) FABP4 is a prototypical PPARγ regulated gene and induced by the addition of exogenous PGD2 to control THP-1 macrophages in the context of IL-4 stimulation, an effect that is blunted in THP-1 PPARg KD macrophages. ALOX15 is an “alternatively activated” gene marker induced by IL-4, an effect that is attenuated in PPARg KD macrophages relative to that in control macrophages. Addition of PGD2 blunts the level of ALOX15 expression. (C) FABP4 and ALOX15 expression in THP-1 macrophages are similarly altered by inclusion of the PPARγ antagonist GW9662. (D) Concentration-dependent induction and repression of FABP4 and ALOX15 mRNA expression, respectively, by PGD2-G in the context of IL-4 stimulation. (E) FABP4 and (F) ALOX15 mRNA expression in THP-1 macrophages during exposure to various combinations of IL-4, PG-G, and WWL113 treatments. Data represent the mean ± SD (n = 3–4); ***p < 0.001, *p < 0.05, comparisons are indicated; ###p < 0.001, #p < 0.05, relative to its corresponding non-PGD2-treated group; one- or two-way ANOVA with SNK post hoc test.
PGD2-G was shown to induce FABP4 and attenuate ALOX15 expression in a concentration-dependent manner in the setting of IL-4 exposure (Figure 5D), an effect attenuated by WWL113 (FABP4 expression shown in Figure 5E, left). In contrast, PGE2-G did not alter FABP4 mRNA levels in the setting of IL-4 stimulation, whereas including WWL113 caused an increase in its expression (Figure 5E, right), indicating divergent effects between PGD2-G and PGE2-G. PGE2-G did, however, attenuate ALOX15 levels, although not to the extent that PGD2-G did (Figure 5F). Overall, based on the reporter assay and FABP4 expression results, our findings suggest that PGD2-G can activate PPARγ (either directly or due to its hydrolytic metabolism) and is more potent than PGE2-G. However, more work will be required to understand the mechanistic effects of these lipid mediators on ALOX15 expression in the context of IL-4 exposure.
2.5. Modulation of IL-4-Evoked “Alternative Macrophage Activation” Marker Genes by PGD2-G
To further assess the role of PGD2-G in the setting of IL-4 exposure, we treated human and mouse macrophages with this lipid mediator in the presence and absence of IL-4 (Figure 6). PGD2-G was shown to attenuate the expression of three M(IL-4) gene markers in human THP-1 macrophages: ENPP2, ALOX15, and CCL17 (Figure 6A). In addition, PGD2-G induced the PPARγ target genes FABP4 and CD36, while it also augmented IL-4-induced FABP4 levels (Figure 6B). On the other hand, it did not significantly impact PPARg mRNA levels in the presence or absence of IL-4. Furthermore, PGD2-G significantly attenuated M(IL-4)-induced gene expression in murine bone marrow-derived macrophages (BMDMs), such as that for “alternative macrophage activation” markers Mrc1, Arg1, Ym1, and Fizz1 (Figure 6C). At a concentration of 10 μM, PGD2-G attenuated FABP4 in BMDMs, which is notably different from the augmentation of FABP4 seen in human THP-1 macrophages (Figure 6D). Il10 expression was also attenuated by PGD2-G in the presence and absence of IL-4, whereas Anptl4 levels were induced. These results further demonstrate that PGD2-G can strongly modulate the effects of IL-4 on gene expression markers in both human and mouse macrophages.
Figure 6.

PGD2-G modulates the gene expression program induced by IL-4 in macrophages. (A) M(IL-4)-induced expression of M2 marker genes and (B) PPARγ target genes in human THP-1 macrophages. Data represent the mean ± SD (n = 3); *p < 0.05, comparisons are indicated; two-way ANOVA with SNK post hoc test. (C) M(IL-4)-induced expression of M2 marker genes and (D) PPARγ target genes in mouse BMDMs. Data represent the mean ± SD (n = 2–5); ***p < 0.001, **p < 0.01, and *p < 0.05, comparisons between −IL-4 and +IL-4 groups; #p < 0.05, comparisons are indicated; two-way ANOVA with SNK post hoc test.
3. Discussion
Macrophages are key cells of the immune system and frontline defenders against pathogenic infections and other noxious agents. When activated by these stimuli an “inflamed milieu” of chemicals that include lipid mediators, reactive oxygen species, and small proteins (cytokines) are induced in order to rid the body of these harmful agents.29,30 However, if inflammation is unremitting, chronic unresolving inflammation becomes a harbinger of future disease. In these instances, physiological or pharmacological processes that resolve the inflammatory response and return it to a homeostatic equilibrium can help reduce disease severity. This study explored these issues using a model of M(LPS) macrophage inflammation and M(IL-4) “alternative macrophage polarization.”
The main findings in this study are the following. First, PGD2-G is an unstable lipid mediator that can be catabolized by the hydrolytic enzyme CES1; about 50% of its hydrolytic metabolism in human THP-1 monocytes/macrophages can be attributed to this enzyme. Second, addition of small-molecule inhibitors that inactivate CES1 in this cell line can prevent PGD2-G metabolism in a concentration-dependent manner, thus stabilizing this anti-inflammatory lipid mediator. Third, the anti-inflammatory effects mediated by PGD2-G could be augmented by adding CES1 inhibitors. Fourth, in a complementary way, the inactivation of CES1-mediated hydrolysis of pro-inflammatory PGE2-G was shown to attenuate the biosynthesis of LPS-induced IL-6, suggesting that hydrolysis of PGE2-G to PGE2 was responsible for its pro-inflammatory effects. The pro-inflammatory effects observed after adding exogenous PGE2, instead of PGE2-G, to the cells supported this last finding. Finally, some of the anti-inflammatory effects of PGD2-G are due in part to the activation of PPARγ, probably via free PGD2 and/or its downstream non-enzymatic metabolites. The significance of these findings is that the selective inactivation of macrophage CES1 activity by small-molecule inhibitors could be a novel approach to increase and decrease anti-inflammatory and pro-inflammatory lipid mediators, respectively, to mitigate inflammatory conditions and diseases.
WWL229 and WWL113 are selective small-molecule inhibitors containing a carbamate chemotype that covalently binds to the catalytic serine residue in CES1, thus causing a mechanism-based inactivation of its enzymatic activity.27 Alhouayek and co-workers had shown that WWL70, an ABHD6 inhibitor, could reduce the hydrolysis of PGD2-G by murine peritoneal macrophages,23 implicating ABHD6 as the responsible enzyme in these macrophages. In addition, Turcotte and co-workers showed that PGE2-G can be hydrolyzed by multiple enzymes in human leukocytes (neutrophils, eosinophils, lymphocytes, and monocytes), including but not limited to MAGL, ABHD6, LYPLA2, and CES1.19,22 Furthermore, it was reported that WWL113 could partially inhibit PGE2-G hydrolysis in human monocytes and neutrophils,19 which is consistent with our previous study that indicated a role for CES1 in this degradative pathway in human cells.12 Our present data extends these findings by showing that WWL229 and WWL113 can inactivate CES1 and prevent the catabolism of PGD2-G. Our data on the immunomodulatory effects of PGD2-G in macrophages in the setting of LPS-induced inflammation are also consistent with those of Muccioli’s group.23,31 The 2013 study was the first to suggest that PGD2-G could reduce LPS-induced IL-1β production by murine peritoneal macrophages, an effect that was augmented by a selective inhibitor of ABHD6 (i.e., WWL70). ABHD6 is expressed at higher levels than MAGL in mouse macrophages23 and it is a bona fide 2-AG hydrolytic enzyme.32 On the other hand, human THP-1 cells do not express ABHD6 to any significant extent,12 whereas on the basis of chemoproteomic experiments, active CES1 is found at significantly higher levels than MAGL.5 Thus, the cellular context chosen to examine the metabolism and cellular effects of PG-Gs is a critical determinant of these studies. In line with this, we have shown by flow cytometric analysis that CES1 and MAGL are abundantly expressed in monocytic cells of human peripheral blood mononuclear cells but that MAGL was the dominant enzyme responsible for 2-AG hydrolytic metabolism.33 Nevertheless, our current results provide new evidence showing that human THP-1 macrophages can catabolize PGD2-G and that CES1 accounts for a substantial proportion of this metabolism. Moreover, we present evidence that the PG-G regioisomers, PGD2-G and PGE2-G, exert diverging effects on macrophages in the settings of LPS and IL-4 exposure. Because of the transient nature of these bioactive lipids, the molecular and cellular basis for these differences is currently unknown.
Our data indicates that PGD2-G/PGD2 is a substrate/product dyad for CES1. In addition, both compounds could stimulate the transactivating function of PPARγ, as was evident from a reporter assay, and both induce the expression of the canonical PPARγ target gene FABP4. Although the mechanistic connection between CES1 and PPARγ is uncertain, our data indicates that PGD2-G and free PGD2 both exert anti-inflammatory effects, at least in the context of our cell model where both compounds attenuate the levels of LPS-evoked IL-6 production. Based on this, it is feasible that some of PGD2-G’s effects may occur following its hydrolysis to PGD2. However, this cannot be the only cause of its activity because preventing PGD2-G hydrolysis seemed to enhance rather than reduce its anti-inflammatory activity. Whereas PGD2-G’s anti-inflammatory effects appear to be due in part to direct activation of undefined cellular receptors, PGE2-G seems to exert its pro-inflammatory effects following its hydrolysis to free PGE2. This is supported by the data where inhibition of PGE2-G hydrolytic degradation strongly attenuated LPS-evoked IL-6 production. In other words, it seems that when PGE2-G is hydrolyzed, the released PGE2 enhances LPS-induced cytokine levels. This idea is supported by the fact that addition of free PGE2 to the cells strongly augmented LPS-induced IL-6 levels, whereas free PGD2 attenuated them. There is precedence for the cellular hydrolysis of PGE2-G being required to exert cellular effects. For example, Turcotte et al.(22) had shown that the hydrolysis of PGE2-G to PGE2 resulted in the inactivation of human neutrophil function. Taken together, PGD2-G appears to directly act on human macrophage-like cells to induce anti-inflammatory effects, as originally shown in mouse macrophages by Alhouayek et al. (2013). Moreover, preventing its hydrolytic degradation could promote or enhance these effects. Our data also indicates that PGE2 and PGD2 can exert opposite pro-inflammatory and anti-inflammatory effects, respectively, in our cell model of LPS-induced inflammation.
Regarding the cellular receptors activated by PG-Gs, it was previously shown that anti-inflammatory effects elicited by PGD2-G in a murine model of colitis could be blocked by antagonists of both DP1 (G protein-coupled receptor that interacts with PGD2) and PPARγ.31 Furthermore, PGD2-G was shown in this study to activate DP1 in Chinese hamster ovary (CHO) cells;31 however, it was not clear whether the CHO cells had the capacity to hydrolyze PGD2-G. Thus, it is feasible that PGD2-G and/or PGD2 could be interacting with DP1 in our cell model, although this has yet to be established. PGE2-G, on the other hand, appears to activate P2Y6 nucleotide receptors in cells,34 but it is unclear whether our THP-1 cell model expresses P2Y6. As for PPARγ, we found that macrophages with silenced PPARg expression exhibited a heightened IL6 gene induction response after treatment with TNFα/IFNγ compared to control macrophages with normal PPARg expression (Crow et al., unpublished data), consistent with the idea that PPARγ can exert an attenuating effect on inflammation. Moreover, our present results suggest that PGD2-G and/or its downstream metabolites—such as free PGD2 and 15-deoxy-Δ12,14-PGJ235—are activating ligands of this nuclear receptor. Thus, some of the modulating effects observed for PGD2-G on the LPS- and IL-4-induced responses in macrophages might be through its interaction with PPARγ. However, more in-depth studies will be required to assess this possibility. Although the exact mechanisms remain to be elucidated, our data suggests that PGD2-G can strongly attenuate both LPS-induced cytokine production and M(IL-4)-mediated gene markers in macrophages, whereas PGE2-G has opposite effects, especially in regard to the production of LPS-induced cytokines.
4. Conclusions
PGD2-G can inhibit macrophage inflammation induced by LPS, while it also attenuates the macrophage’s response to the “anti-inflammatory” cytokine IL-4. Therefore, it seems that the specific nature of the macrophage stimulus, whether it be caused by a danger-associated molecular pattern (e.g., LPS) or immune modulating cytokines (e.g., IL-4), is an important determinant of PGD2-G’s cellular effects. Because of the “tempering” effects of PGD2-G in settings of LPS or IL-4 stimulation, this underscores the idea that PGD2-G is an important homeostatic molecule in macrophages.
Our findings suggest that inhibition of CES1 and other enzymes that regulate the levels of pro-resolving mediators, such as PGD2-G, can modulate the responses of macrophages after exposure to molecules that stimulate the immune system, such as LPS and IL-4, in profound ways. The attenuating effect of PGD2-G on LPS-induced cytokine production has obvious implications for inflammation resolution programs. Although the impact of its attenuating effects on genes that signify an “alternative macrophage activation” program is perhaps less clear, it might serve to dampen the activity of M2 macrophages during overzealous wound repair processes that occur during pathologies such as pulmonary fibrosis. Thus, the significance of the present findings is that the inhibition of CES1 and other enzymes that regulate the levels of endogenous pro-resolving mediators in specific niches could be a novel anti-inflammatory approach to explore further.
5. Experimental Section
5.1. Cells, Chemicals, and Reagents
Human THP-1 monocytes and high-glucose RPMI-1640 medium were purchased from American Type Culture Collection (Manassas, VA). Gentamicin sulfate solution (50 mg/mL) and low endotoxin-containing fetal bovine serum (FBS) were from Gibco, Life Technologies Corporation (Grand Island, NY), and phorbol 12-myristate 13-acetate (PMA) was from Fisher Scientific (Houston, TX). Lentiviral particles containing CES1 shRNA and scrambled (nonspecific) shRNA constructs and puromycin hydrochloride were from Santa Cruz Biotechnology (Dallas, TX). CES1 inhibitors (WWL113, WWL229), LPS, pNPV, and recombinant human CES1 enzyme were from Sigma (St. Louis, MO). CPO was a kind gift from Dr. Howard Chambers (MSU). PGD2-G, PGE2-G, 8-iso-PGF2α-d4, PGE2-d4, PGD2, and PGE2 were from Cayman Chemical (Ann Arbor, MI). The RNA isolation kits and SYBR Green real-time quantitative polymerase chain reaction (RT-qPCR) master mix were from Qiagen (Valencia, CA), and the complementary DNA (cDNA) first-strand synthesis reagents were from Thermo Fisher Scientific (Waltham, MA). The pre-validated QuantiTect primer assays for RT-qPCR experiments were from Qiagen (Valencia, CA), and the self-designed custom oligonucleotides were from Invitrogen (Carlsbad, CA). FP–biotin was from AdooQ Biosciences (Irvine, CA), and the enzyme-linked immunosorbent assay (ELISA) IL-6 antibodies, avidin–horseradish peroxidase (HRP), and 3,3′,5,5′-tetramethylbenzidine reagent were purchased from BioLegend (San Diego, CA).
5.2. Cell Culture Conditions
THP-1 monocytes were cultured in RPMI-1640 medium containing 10% FBS, 2 mM l-glutamine, 10 mM N-(2-hydroxyethyl)piperazine-N′-ethanesulfonic acid, 1 mM sodium pyruvate, 4500 mg/L glucose, 1500 mg/L sodium bicarbonate, and 50 μg/mL gentamicin (complete growth medium) and maintained at 37 °C and 5% CO2 at a density of 1 × 10⁶ cells/mL with medium changes every 48–72 h. THP-1 monocytes were differentiated into macrophages by the addition of PMA (final concentration, 100 nM) to the complete growth medium for 24 or 72 h.18 For simplicity, THP-1 monocytes/macrophages are henceforth termed “monocytes” when not treated with PMA or “macrophages” when treated with PMA. In some experiments, primary mouse macrophages were used instead of THP-1 cells; their isolation and treatments are described below.
CES1 and PPARγ expression was knocked down in THP-1 monocytes using lentiviral particles containing either CES1 and PPARγ shRNA constructs and subjected to puromycin selection, as described previously;5,18 these are termed “CES1KD” or “PPARgKD” cells, respectively. Monocytes were also transduced using lentiviral particles containing scrambled shRNA constructs and termed “control” cells. Silencing of CES1 expression and activity in monocytes was verified by western blot analysis, RT-PCR, and a pNPV esterase assay. Control and CES1KD monocytes were cultured in complete growth medium with 5 μg/mL puromycin hydrochloride. Only puromycin-resistant cells were used for subsequent experiments. In this report, wildtype (WT) cells, control cells, and CES1KD cells refer to cells that were non-transduced, transduced with scrambled shRNA, or transduced with CES1-specific shRNA, respectively.
5.3. Activity of Recombinant CES1 Enzyme in the Presence of an Inhibitor
Recombinant CES1 (final concentration, ≤4.2 μg/mL) in 50 mM Tris-HCl (pH 7.4) was aliquoted into a 96-well plate. The inhibitor WWL229 was added to the CES1 enzyme in triplicate to create an inhibitor concentration gradient between 0.001 and 50 μM. The enzyme–inhibitor mixture was preincubated for 15 min at 37 °C, followed by addition of the substrate p-NPV. The CES1 activity was measured using a SpectraMax M5 spectrophotometer at 405 nm, and the IC50 value was determined for WWL229. This was repeated for the inhibitors WWL113 and CPO. CPO is a more potent inhibitor than the other two compounds; therefore, it was tested at concentrations between 10–5 and 10 μM.
5.4. LC–MS/MS Analysis of PGD2 Levels in THP-1 Monocytes
WT monocytes were harvested, washed, and resuspended in serum-free RPMI-1640 media (which does not contain supplemented FBS or antibiotics). The resuspended cells were aliquoted into 10 samples (500,000 cells per sample), each in 0.5 mL of the media. Samples were treated in duplicate with a different concentration of the WWL229 inhibitor, creating five groups with the following final concentrations of inhibitor: 0, 1, 3, 10, and 30 μM. The monocytes were preincubated with the inhibitor for 30 min at 37 °C before adding PGD2-G (final concentration, 10 or 0.1 μM) and incubated for 1 h at 37 °C. An equal volume of ice-cold methanol (containing 8-iso-PGF2α-d4, 2.665 μM) was added to each sample to stop the reactions, and the samples were stored at −20 °C for 15 min. Each sample was then extracted with 1:1 hexane/ethyl acetate + 0.2% (v/v) acetic acid. After evaporation of organic solvents to dryness, the residues were resuspended in 100 μL of methanol. The extracts were analyzed by LC–MS/MS to determine the amount of PGD2 present in each sample. Analysis was conducted on an Acquity UPLC system (Waters, Milford, MA) coupled to a TSQ Quantum tandem mass spectrometer, as previously described.5
These experiments were also repeated using the inhibitors WWL113 and CPO. When testing the inhibitor CPO, the final concentrations of inhibitor were 0.0, 0.003, 0.01, 0.1, and 1.0 μM. All other procedures were the same as above.
5.5. ABPP and Western Blot Analysis of Cell Proteomes after Treatment with the WWL229 Inhibitor
To assess cellular CES1 activity in the presence and absence of an inhibitor, control monocytes were treated with increasing concentrations of WWL229 (final concentrations: 0.1, 1.0, and 10.0 μM). After a 30 min incubation, cell lysates (proteomes) were prepared in ice-cold 50 mM Tris-HCl (pH 7.4) buffer by sonication (3 × 10 s, on ice), followed by protein quantification (BCA reagent, Thermo Pierce). Proteomes (1 mg/mL of lysate protein in 50 mM Tris-HCl) were incubated with FP–biotin (5 μM final concentration) at room temperature for 1 h. 6× sodium dodecyl sulfate polyacrylamide gel electrophoresis (SDS-PAGE) loading buffer (reducing) was added to each sample, and all samples were heated at 90 °C for 5 min to end all reactions. The proteomes were separated by electrophoresis in a 10% SDS-PAGE gel and transferred to an Immuno-Blot poly(vinylidene difluoride) (PVDF) membrane (Bio-Rad, Hercules, CA). The membrane was blocked in a 5% non-fat milk solution in Tween buffer at 4 °C overnight. Next, the membrane was incubated in a 1% non-fat milk solution with a 1:2000 (v/v) dilution of avidin–HRP for approximately 2 h at room temperature. After washing the membrane with Tween buffer at least 4 times, it was incubated with SuperSignal West Pico Chemiluminescent Substrate (Thermo Scientific, Rockford, IL) for 10 min, and chemiluminescent signals were captured on X-ray film (LabScientific, Inc., Highlands, NJ).
The same membrane was also used for western blot analysis of CES1 protein. After washing the membrane in Tween buffer and incubation in stripping buffer (∼5 min), it was blocked in a 5% non-fat milk solution for 1 h. The membrane was incubated with an anti-CES1 antibody (1:25,000 v/v in 5% non-fat milk solution in Tween buffer) for 1.5 h and then washed at least 4 times with Tween buffer. This was followed by incubation with a 1:8000 (v/v) goat anti-rabbit secondary antibody for 1 h, followed by membrane washes. Finally, the membrane was incubated with SuperSignal West Pico Chemiluminescent Substrate solution (Thermo Scientific) for 10 min, and chemiluminescent signals were captured on X-ray film.
In a separate experiment, monocytes were collected, rinsed in 1× PBS, and resuspended in fresh 1× PBS. The intact cells were treated with increasing concentration of the WWL229 inhibitor (final concentrations: 0.0, 0.1, 0.3, 1.0, and 3 μM). One sample served as the negative control, and the final served as a vehicle control. Three additional samples were prepared with recombinant CES1 enzyme (final concentration, 1 μg/mL) to serve as a positive control for WWL229 (final concentration, 3 μM), negative control (heat denatured), and vehicle (dimethyl sulfoxide) control. The samples were incubated in an Eppendorf ThermoMixer at 37 °C, 450 rpm for 30 min, while negative controls were heated for 5 min at 92 °C to denature proteins. After this pre-incubation period, all samples were treated with FP–TAMRA (2 μM) and incubated in the dark at room temperature for 1 h. 6× SDS-PAGE loading buffer (reducing) was added to stop all reactions, and all were heated for 5 min at 92 °C. Samples were loaded onto a pre-cast Mini-PROTEAN TGX gel (Bio-Rad), and the proteins were separated by electrophoresis. The gel was imaged by a ChemiDoc MP imaging system (Bio-Rad) for analysis using the DyLight 550 fluorescent filter.
5.6. Gel-Based ABPP of Control and CES1KD Cell Lysates
Control and CES1KD monocytes were harvested and washed. Proteomes were prepared by sonication (3 × 10 s, on ice) in 50 mM Tris-HCl (pH 7.4) buffer. After measuring the protein concentration of the lysates (BCA reagent, Thermo Pierce), one of the control lysates and one of the CES1KD lysates were boiled (5 min, 90 °C) to denature all protein and serve as negative controls. All samples were incubated with FP–biotin (5 μM) for 1 h at room temperature, and the reaction terminated with 6× SDS-PAGE loading buffer (reducing). All samples were heated for 5 min at 90 °C. After separation by electrophoresis in a 10% SDS-PAGE gel, the proteins were transferred to Immuno-Blot PVDF membrane (Bio-Rad) and visualized as detailed above.
5.7. Hydrolysis of PGD2-G in Control and CES1KD Cells
Control and CES1KD monocytes were harvested, washed, and resuspended in serum-free RPMI. The suspended cells were divided into four samples for each cell type, giving a total of eight samples, each at a cell density of 5 × 10⁵ per 0.5 mL media. PGD2-G (final concentration, 0.1 μM) was then added to the cell suspensions. After a 1 h incubation at 37 °C, 0.5 mL of ice-cold methanol containing internal standard (2 μM PGE2-d4) was added, and all samples were placed at −20 °C for 15 min to ensure the reaction had stopped. Each sample was extracted twice with 1:1 hexane/ethyl acetate + 0.2% acetic acid. The extracts were then analyzed by LC–MS/MS to quantify the levels of PGD2.
5.8. Treatment of Murine Macrophages (Resident Peritoneal Macrophages or BMDMs) with PGD2-G
Adult C57BL/6 mice of at least 8 weeks of age were obtained from a breeding colony established using mice purchased from Jackson Laboratories (Bar Harbor, ME). Mice were housed in temperature- and humidity-controlled AAALAC-approved facility (20–25 °C and 40–60% humidity) under a 12 h light cycle and were used in accordance with the Mississippi State University Institutional Animal Care and Use Committee. Mice were sacrificed by cervical dislocation and resident peritoneal macrophages harvested in PBS containing 3% FBS, washed in PBS, and resuspended in Dulbecco’s modified Eagle’s medium (DMEM) media containing 10% FBS and antibiotics (penicillin/streptomycin). The cells were seeded into a 12-well plate (2 × 10⁶ cells/well) and incubated overnight at 37 °C. The culture medium and non-attached cells were aspirated, and the attached cells were washed with PBS. The plated macrophages were divided into four treatment groups: group 1 received LPS only (final concentration, 100 ng/mL); group 2, LPS and PGD2-G (final concentrations, 100 ng/mL and 10 μM, respectively); group 3, LPS and PGD2-G plus WWL113 (final inhibitor concentration, 3 μM); and group 4, LPS and PGD2-G plus WWL70 (final inhibitor concentration, 3 μM). Macrophages were pretreated with WWL113 or WWL70 in serum-free DMEM media for 30 min at 37 °C, followed by addition of PGD2-G. After 1 h incubation with PGD2-G, LPS was added to the media, and cells were incubated for an additional 8 h at 37 °C. Supernatants were removed, and total RNA was isolated using the RNeasy Plus Mini Kit (Qiagen). RNA was quantified using a NanoDrop ND-1000 spectrophotometer (Thermo Fisher Scientific), and cDNA was created according to the manufacturer’s protocol (RevertAid First Strand cDNA Synthesis Kit, Thermo Fisher Scientific). RT-qPCR was conducted with QuantiFast SYBR Green PCR master mix (Qiagen) using QuantiTect primers (Qiagen) or self-designed custom oligonucleotides (Invitrogen) on a Stratagene Mx3005P thermal cycler (see Table 1 for for primer sequences). The thermo-cycler program used for all target genes is described below. Dissociation curve analysis was used to assess PCR product quality. Differential expression of target genes was assessed by the ΔΔCT method36 using GAPDH as the reference gene. Results are presented relative to the vehicle or control samples run within each blocked experiment.
Table 1. Human Primer Sequences and Source of Commercial Primers Used for RT-qPCR Analysis.
| gene | forward sequence | reverse sequence |
|---|---|---|
| ALOX15 | 5′-TCAGGTTCCCTTGTTACCGC-3′ | 5′-GTTTCCCCACCGGTACAACT-3′ |
| CCL17 | 5′-CCAGGGATGCCATCGTTTTT-3′ | 5′-ATCTCCCTCACTGTGGCTCT-3′ |
| CD36 | 5′-AGGACTTTCCTGCAGAATACCA-3′ | 5′-ACAAGCTCTGGTTCTTATTCACA-3′ |
| FABP4 | 5′-AAACTGGTGGTGGAATGCGT-3′ | 5′-GCGAACTTCAGTCCAGGTCA-3′ |
| IL6 | 5′-AGCCACTCACCTCTTCAGAAC-3′ | 5′-GCCTCTTTGCTGCTTTCACAC |
| IL1b | 5′-GCAAGGGCTTCAGGCAGGCCGCG-3′ | 5′-GGTCATTCTCCTGGAAGGTCTGTGGGC-3′ |
| PPARg | 5′-GCCGTGGCCGCAGATTT-3′ | 5′-GGGAGTGGTCTTCCATTACGG-3′ |
| TNFa | 5′-CCCATGTTGTAGCAAACCCT-3′ | 5′-TGAGGTACAGGCCCTCTGAT-3′ |
| ENPP2 | ENPP2_1_SG QuantiTect primer assay—QT00044387 | |
| GAPDH | GAPDH_1_SG QuantiTect primer assay—QT00079247 | |
Murine BMDMs were obtained by flushing the femurs of adult C57BL/6 mice with PBS containing 3% FBS; the bone marrow cells were differentiated into macrophages in DMEM media containing 10% FBS, antibiotics, and 10 ng/mL M-CSF for 7 days with a media change after the first 3 days in culture. The resulting BMDMs were treated as described in the figure legend, and total RNA was isolated as described above.
5.9. RT-qPCR Analysis of IL6, TNFa, and IL1b mRNA Expression
THP-1 monocytes (1 × 10⁶ per well of a 12-well plate) were differentiated in complete RPMI by the addition of PMA for either 24 or 72 h. After differentiation, the media was removed and replaced with 1 mL of serum-free RPMI. These macrophages were divided into 3 groups, the first treated with LPS only (final concentration, 100 ng/mL), the second treated with LPS plus PGD2-G or PGE2-G (final concentration, 10 μM), and the third treated with LPS, PG-G, plus WWL113 inhibitor (final concentration, 3 μM). Cells were pretreated with WWL113 for 30 min, followed by addition of PG-G and incubation for 1 h. Then, without removing the other compounds, the cells received LPS and were incubated for an additional 8 h. The cell media was collected and used for IL-6 ELISA (see below). Total RNA was isolated from the cells using the RNeasy Plus Mini Kit (Qiagen) according to the provided protocol. Total purified RNA amounts were determined using a NanoDrop ND-1000 spectrophotometer (Thermo Fisher Scientific), and cDNA was synthesized using protocol and reagents provided in the RevertAid First Strand cDNA Synthesis Kit (Thermo Fisher Scientific). RT-PCR of the cDNA products was performed on a Stratagene Mx3005P thermal cycler with QuantiFast SYBR Green PCR master mix (Qiagen) using QuantiTect primers (Qiagen) or self-designed custom oligonucleotides (Invitrogen). The thermocycler program used for all target genes consisted of a 5 min hot start at 95 °C prior to 40 cycles of 10 s at 95 °C, followed by 30 s at 60 °C, as recommended by the manufacturer. PCR product quality was assessed via dissociation curve analysis immediately following amplification. Differential expression of target genes was assessed by the ΔΔCT method36 using GAPDH as the reference gene. Results are presented relative to the vehicle or control samples run within each experiment.
5.10. IL-6 ELISA in Control Cell Macrophages
These assays were conducted using the cell media collected from LPS-, PGD2-G/PGE2-G-, and WWL113-treated control macrophages. The collected media was assessed by ELISA without dilution or after a 1:5 dilution in 3% (w/v) BSA in 1× PBS. The ELISA protocol used is described in detail.33
5.11. PPARγ Luciferase Reporter Gene Assay
COS-7 cells were transfected with a PPRE-luciferase reporter plasmid (PPRE × 3 firefly luciferase), a PPARγ expression plasmid, and a Renilla-luciferase plasmid (transfection efficiency control)—all plasmids were obtained from Addgene. Cells were treated with the following lipid mediators: PGD2, PGE2, PGD2-G, and PGE2-G. After 24 h, the extent of luminescence was assessed in cell lysates. Firefly luciferase readings were normalized on Renilla luciferase readings.
5.12. Statistical Analysis
SigmaPlot version 11.0 was used to perform all statistical analyses, and results are presented as means ± standard deviation (SD). For RT-qPCR gene expression results, data were converted to linearized ΔΔCT values, as described.36 Statistical comparison between cell types and treatment groups was performed through the Student’s t-test and one- or two-way analysis of variance (ANOVA) with Student–Newman–Keuls post hoc testing. In most cases, a p-value of less than 0.05 (p < 0.05) between groups was considered to indicate significant statistical difference.
Acknowledgments
This work was supported by NIH 1R15GM128206-01. The content is solely the responsibility of the authors and does not necessarily represent the official views of the National Institutes of Health or Mississippi State University.
Supporting Information Available
The Supporting Information is available free of charge at https://pubs.acs.org/doi/10.1021/acsomega.0c03961.
Time course of PGD2-G hydrolysis to PGD2 by recombinant CES1 enzyme and THP-1 monocytes; induction of LPS-evoked pro-inflammatory cytokines in THP-1 macrophages; effects of PG-Gs and PGs on LPS-induced TNFa and IL1b cytokines in THP-1 macrophages; and LPS-induced IL6 and TNFa mRNA levels in THP-1 macrophages attenuated by addition of exogenous 2-AG, an effect augmented by WWL113 (PDF)
Author Contributions
M.K.R. and H.L.S. conceptualized the study. H.L.S. and A.B. performed all experiments using human THP-1 macrophages; B.N.S. isolated peritoneal macrophages and BMDMs from mice and performed the experiments utilizing these cells; H.L.S. and B.N.S. performed ELISAs; M.K.R. performed the LC–MS/MS analysis; H.L.S., A.B., B.N.S., and M.K.R. interpreted data; H.L.S. and M.K.R. wrote the manuscript; M.K.R. supervised and funded the study.
The authors declare no competing financial interest.
Supplementary Material
References
- Long J. Z.; Cravatt B. F. The metabolic serine hydrolases and their functions in mammalian physiology and disease. Chem. Rev. 2011, 111, 6022–6063. 10.1021/cr200075y. [DOI] [PMC free article] [PubMed] [Google Scholar]
- Ross M. K.; Streit T. M.; Herring K. L.; Xie S. Carboxylesterases: Dual roles in lipid and pesticide metabolism. J. Pestic. Sci. 2010, 35, 257–264. 10.1584/jpestics.r10-07. [DOI] [PMC free article] [PubMed] [Google Scholar]
- Bencharit S.; Morton C. L.; Hyatt J. L.; Kuhn P.; Danks M. K.; Potter P. M.; Redinbo M. R. Crystal structure of human carboxylesterase 1 complexed with the Alzheimer’s drug tacrine: from binding promiscuity to selective inhibition. Chem. Biol. 2003, 10, 341–349. 10.1016/s1074-5521(03)00071-1. [DOI] [PubMed] [Google Scholar]
- Ross M. K.; Borazjani A.; Mangum L. C.; Wang R.; Crow J. A. Effects of toxicologically relevant xenobiotics and the lipid-derived electrophile 4-hydroxynonenal on macrophage cholesterol efflux: silencing carboxylesterase 1 has paradoxical effects on cholesterol uptake and efflux. Chem. Res. Toxicol. 2014, 27, 1743–1756. 10.1021/tx500221a. [DOI] [PMC free article] [PubMed] [Google Scholar]
- Wang R.; Borazjani A.; Matthews A. T.; Mangum L. C.; Edelmann M. J.; Ross M. K. Identification of palmitoyl protein thioesterase 1 in human THP1 monocytes and macrophages and characterization of unique biochemical activities for this enzyme. Biochemistry 2013, 52, 7559–7574. 10.1021/bi401138s. [DOI] [PMC free article] [PubMed] [Google Scholar]
- Hatfield M. J.; Umans R. A.; Hyatt J. L.; Edwards C. C.; Wierdl M.; Tsurkan L.; Taylor M. R.; Potter P. M. Carboxylesterases: General detoxifying enzymes. Chem.-Biol. Interact. 2016, 259, 327–331. 10.1016/j.cbi.2016.02.011. [DOI] [PMC free article] [PubMed] [Google Scholar]
- Ross M. K.; Crow J. A. Human carboxylesterases and their role in xenobiotic and endobiotic metabolism. J. Biochem. Mol. Toxicol. 2007, 21, 187–196. 10.1002/jbt.20178. [DOI] [PubMed] [Google Scholar]
- Quiroga A. D.; Lehner R. Pharmacological intervention of liver triacylglycerol lipolysis: The good, the bad and the ugly. Biochem. Pharmacol. 2018, 155, 233–241. 10.1016/j.bcp.2018.07.005. [DOI] [PubMed] [Google Scholar]
- Lian J.; Nelson R.; Lehner R. Carboxylesterases in lipid metabolism: from mouse to human. Protein Cell 2018, 9, 178–195. 10.1007/s13238-017-0437-z. [DOI] [PMC free article] [PubMed] [Google Scholar]
- Ghosh S. Cholesteryl ester hydrolase in human monocyte/macrophage: cloning, sequencing, and expression of full-length cDNA. Physiol. Genomics 2000, 2, 1–8. 10.1152/physiolgenomics.2000.2.1.1. [DOI] [PubMed] [Google Scholar]
- Munger J. S.; Shi G. P.; Mark E. A.; Chin D. T.; Gerard C.; Chapman H. A. A serine esterase released by human alveolar macrophages is closely related to liver microsomal carboxylesterases. J. Biol. Chem. 1991, 266, 18832–18838. [PubMed] [Google Scholar]
- Xie S.; Borazjani A.; Hatfield M. J.; Edwards C. C.; Potter P. M.; Ross M. K. Inactivation of lipid glyceryl ester metabolism in human THP1 monocytes/macrophages by activated organophosphorus insecticides: role of carboxylesterases 1 and 2. Chem. Res. Toxicol. 2010, 23, 1890–1904. 10.1021/tx1002194. [DOI] [PMC free article] [PubMed] [Google Scholar]
- Gallelli C. A.; Calcagnini S.; Romano A.; Koczwara J. B.; de Ceglia M.; Dante D.; Villani R.; Giudetti A. M.; Cassano T.; Gaetani S. Modulation of the Oxidative Stress and Lipid Peroxidation by Endocannabinoids and Their Lipid Analogues. Antioxidants 2018, 7, 93. 10.3390/antiox7070093. [DOI] [PMC free article] [PubMed] [Google Scholar]
- Matthews A. T.; Lee J. H.; Borazjani A.; Mangum L. C.; Hou X.; Ross M. K. Oxyradical stress increases the biosynthesis of 2-arachidonoylglycerol: involvement of NADPH oxidase. Am. J. Physiol.: Cell Physiol. 2016, 311, C960–C974. 10.1152/ajpcell.00251.2015. [DOI] [PMC free article] [PubMed] [Google Scholar]
- Kozak K. R.; Rowlinson S. W.; Marnett L. J. Oxygenation of the endocannabinoid, 2-arachidonylglycerol, to glyceryl prostaglandins by cyclooxygenase-2. J. Biol. Chem. 2000, 275, 33744–33749. 10.1074/jbc.m007088200. [DOI] [PubMed] [Google Scholar]
- Rouzer C. A.; Marnett L. J. Endocannabinoid oxygenation by cyclooxygenases, lipoxygenases, and cytochromes P450: cross-talk between the eicosanoid and endocannabinoid signaling pathways. Chem. Rev. 2011, 111, 5899–5921. 10.1021/cr2002799. [DOI] [PMC free article] [PubMed] [Google Scholar]
- Buisseret B.; Guillemot-Legris O.; Muccioli G. G.; Alhouayek M. Prostaglandin D2-glycerol ester decreases carrageenan-induced inflammation and hyperalgesia in mice. Biochim. Biophys. Acta, Mol. Cell Biol. Lipids 2019, 1864, 609–618. 10.1016/j.bbalip.2019.01.009. [DOI] [PubMed] [Google Scholar]
- Mangum L. C.; Hou X.; Borazjani A.; Lee J. H.; Ross M. K.; Crow J. A. Silencing carboxylesterase 1 in human THP-1 macrophages perturbs genes regulated by PPARγ/RXR and RAR/RXR: down-regulation of CYP27A1-LXRα signaling. Biochem. J. 2018, 475, 621–642. 10.1042/bcj20180008. [DOI] [PMC free article] [PubMed] [Google Scholar]
- Turcotte C.; Dumais É.; Archambault A. S.; Martin C.; Blanchet M. R.; Bissonnette É.; Boulet L. P.; Laviolette M.; Di Marzo V.; Flamand N. Human leukocytes differentially express endocannabinoid-glycerol lipases and hydrolyze 2-arachidonoyl-glycerol and its metabolites from the 15-lipoxygenase and cyclooxygenase pathways. J. Leukocyte Biol. 2019, 106, 1337–1347. 10.1002/jlb.3a0919-049rrr. [DOI] [PubMed] [Google Scholar]
- Kingsley P. J.; Rouzer C. A.; Morgan A. J.; Patel S.; Marnett L. J. Aspects of Prostaglandin Glycerol Ester Biology. Adv. Exp. Med. Biol. 2019, 1161, 77–88. 10.1007/978-3-030-21735-8_8. [DOI] [PubMed] [Google Scholar]
- Nirodi C. S.; Crews B. C.; Kozak K. R.; Morrow J. D.; Marnett L. J. The glyceryl ester of prostaglandin E2 mobilizes calcium and activates signal transduction in RAW264.7 cells. Proc. Natl. Acad. Sci. U.S.A. 2004, 101, 1840–1845. 10.1073/pnas.0303950101. [DOI] [PMC free article] [PubMed] [Google Scholar]
- Turcotte C.; Zarini S.; Jean S.; Martin C.; Murphy R. C.; Marsolais D.; Laviolette M.; Blanchet M.-R.; Flamand N. The Endocannabinoid Metabolite Prostaglandin E2 (PGE2)-Glycerol Inhibits Human Neutrophil Functions: Involvement of Its Hydrolysis into PGE2 and EP Receptors. J. Immunol. 2017, 198, 3255–3263. 10.4049/jimmunol.1601767. [DOI] [PubMed] [Google Scholar]
- Alhouayek M.; Masquelier J.; Cani P. D.; Lambert D. M.; Muccioli G. G. Implication of the anti-inflammatory bioactive lipid prostaglandin D2-glycerol ester in the control of macrophage activation and inflammation by ABHD6. Proc. Natl. Acad. Sci. U.S.A. 2013, 110, 17558–17563. 10.1073/pnas.1314017110. [DOI] [PMC free article] [PubMed] [Google Scholar]
- Hu S. S.-J.; Bradshaw H. B.; Chen J. S.-C.; Tan B.; Walker J. M. Prostaglandin E2 glycerol ester, an endogenous COX-2 metabolite of 2-arachidonoylglycerol, induces hyperalgesia and modulates NFκB activity. Br. J. Pharmacol. 2008, 153, 1538–1549. 10.1038/bjp.2008.33. [DOI] [PMC free article] [PubMed] [Google Scholar]
- Morgan A. J.; Kingsley P. J.; Mitchener M. M.; Altemus M.; Patrick T. A.; Gaulden A. D.; Marnett L. J.; Patel S. Detection of Cyclooxygenase-2-Derived Oxygenation Products of the Endogenous Cannabinoid 2-Arachidonoylglycerol in Mouse Brain. ACS Chem. Neurosci. 2018, 9, 1552–1559. 10.1021/acschemneuro.7b00499. [DOI] [PMC free article] [PubMed] [Google Scholar]
- Chang J. W.; Cognetta A. B. 3rd; Niphakis M. J.; Cravatt B. F. Proteome-wide reactivity profiling identifies diverse carbamate chemotypes tuned for serine hydrolase inhibition. ACS Chem. Biol. 2013, 8, 1590–1599. 10.1021/cb400261h. [DOI] [PMC free article] [PubMed] [Google Scholar]
- Dominguez E.; Galmozzi A.; Chang J. W.; Hsu K.-L.; Pawlak J.; Li W.; Godio C.; Thomas J.; Partida D.; Niessen S.; O’Brien P. E.; Russell A. P.; Watt M. J.; Nomura D. K.; Cravatt B. F.; Saez E. Integrated phenotypic and activity-based profiling links Ces3 to obesity and diabetes. Nat. Chem. Biol. 2014, 10, 113–121. 10.1038/nchembio.1429. [DOI] [PMC free article] [PubMed] [Google Scholar]
- Daniel B.; Nagy G.; Horvath A.; Czimmerer Z.; Cuaranta-Monroy I.; Poliska S.; Hays T. T.; Sauer S.; Francois-Deleuze J.; Nagy L. The IL-4/STAT6/PPARγ signaling axis is driving the expansion of the RXR heterodimer cistrome, providing complex ligand responsiveness in macrophages. Nucleic Acids Res. 2018, 46, 4425–4439. 10.1093/nar/gky157. [DOI] [PMC free article] [PubMed] [Google Scholar]
- Mosser D. M.; Edwards J. P. Exploring the full spectrum of macrophage activation. Nat. Rev. Immunol. 2008, 8, 958–969. 10.1038/nri2448. [DOI] [PMC free article] [PubMed] [Google Scholar]
- Valledor A. F.; Comalada M.; Santamaría-Babi L. F.; Lloberas J.; Celada A. Macrophage proinflammatory activation and deactivation: a question of balance. Adv. Immunol. 2010, 108, 1–20. 10.1016/b978-0-12-380995-7.00001-x. [DOI] [PubMed] [Google Scholar]
- Alhouayek M.; Buisseret B.; Paquot A.; Guillemot-Legris O.; Muccioli G. G. The endogenous bioactive lipid prostaglandin D2-glycerol ester reduces murine colitis via DP1 and PPARgamma receptors. FASEB J. 2018, 32, 5000–5011. 10.1096/fj.201701205r. [DOI] [PubMed] [Google Scholar]
- Blankman J. L.; Simon G. M.; Cravatt B. F. A comprehensive profile of brain enzymes that hydrolyze the endocannabinoid 2-arachidonoylglycerol. Chem. Biol. 2007, 14, 1347–1356. 10.1016/j.chembiol.2007.11.006. [DOI] [PMC free article] [PubMed] [Google Scholar]
- Szafran B. N.; Lee J. H.; Borazjani A.; Morrison P.; Zimmerman G.; Andrzejewski K. L.; Ross M. K.; Kaplan B. L. F. Characterization of Endocannabinoid-Metabolizing Enzymes in Human Peripheral Blood Mononuclear Cells under Inflammatory Conditions. Molecules 2018, 23, 3167. 10.3390/molecules23123167. [DOI] [PMC free article] [PubMed] [Google Scholar]
- Brüser A.; Zimmermann A.; Crews B. C.; Sliwoski G.; Meiler J.; Konig G. M.; Kostenis E.; Lede V.; Marnett L. J.; Schoneberg T. Prostaglandin E2 glyceryl ester is an endogenous agonist of the nucleotide receptor P2Y6. Sci. Rep. 2017, 7, 2380. 10.1038/s41598-017-02414-8. [DOI] [PMC free article] [PubMed] [Google Scholar]
- Burstein S. H. The chemistry, biology and pharmacology of the cyclopentenone prostaglandins. Prostaglandins Other Lipid Mediators 2020, 148, 106408. 10.1016/j.prostaglandins.2020.106408. [DOI] [PubMed] [Google Scholar]
- Schmittgen T. D.; Livak K. J. Analyzing real-time PCR data by the comparative C(T) method. Nat. Protoc. 2008, 3, 1101–1108. 10.1038/nprot.2008.73. [DOI] [PubMed] [Google Scholar]
Associated Data
This section collects any data citations, data availability statements, or supplementary materials included in this article.