

Abstract
Introduction
Electrocardiographic characteristics in COVID‐19‐related mortality have not yet been reported, particularly in racial/ethnic minorities.
Methods and Results
We reviewed demographics, laboratory and cardiac tests, medications, and cardiac rhythm proximate to death or initiation of comfort care for patients hospitalized with a positive SARS‐CoV‐2 reverse‐transcriptase polymerase chain reaction in three New York City hospitals between March 1 and April 3, 2020 who died. We described clinical characteristics and compared factors contributing toward arrhythmic versus nonarrhythmic death. Of 1258 patients screened, 133 died and were enrolled. Of these, 55.6% (74/133) were male, 69.9% (93/133) were racial/ethnic minorities, and 88.0% (117/133) had cardiovascular disease. The last cardiac rhythm recorded was VT or fibrillation in 5.3% (7/133), pulseless electrical activity in 7.5% (10/133), unspecified bradycardia in 0.8% (1/133), and asystole in 26.3% (35/133). Most 74.4% (99/133) died receiving comfort measures only. The most common abnormalities on admission electrocardiogram included abnormal QRS axis (25.8%), atrial fibrillation/flutter (14.3%), atrial ectopy (12.0%), and right bundle branch block (11.9%). During hospitalization, an additional 17.6% developed atrial ectopy, 14.7% ventricular ectopy, 10.1% atrial fibrillation/flutter, and 7.8% a right ventricular abnormality. Arrhythmic death was confirmed or suspected in 8.3% (11/133) associated with age, coronary artery disease, asthma, vasopressor use, longer admission corrected QT interval, and left bundle branch block (LBBB).
Conclusions
Conduction, rhythm, and electrocardiographic abnormalities were common during COVID‐19‐related hospitalization. Arrhythmic death was associated with age, coronary artery disease, asthma, longer admission corrected QT interval, LBBB, ventricular ectopy, and usage of vasopressors. Most died receiving comfort measures.
Keywords: arrhythmia, cardiac death, COVID‐19, electrocardiography, epidemiology, sudden death
1. INTRODUCTION
Since the first cluster of cases in Wuhan, China, 1 the 2019 novel coronavirus (SARS‐CoV‐2) has rapidly spread to pandemic proportions, affecting the United States since January 19, 2020 in Washington DC with the first case of the resultant clinical syndrome, COVID‐19. 2 Since that time, New York City has become an epicenter of disease with 197 351 total cases, 51 380 hospitalizations, and 21 362 deaths resulting from confirmed or probable SARS‐CoV‐2 infection as of May 27, 2020. 3
Initial findings from the Chinese cohorts described acute respiratory distress syndrome (ARDS), myocardial injury, and death in 4.3%–15%. 4 , 5 , 6 Findings from a large cohort of patients in the New York City and its surrounding suburbs recently reported a death rate of 21%. 7 Older age, racial and ethnic minority status, pre‐existing cardiovascular disease (CVD), and secondary infections have been associated with increased mortality. 8 , 9 Studies describing the cardiac rhythm most proximate to death in COVID‐19 patients have reported ventricular tachycardia (VT) or ventricular fibrillation (VF) in approximately 6% with the majority having asystole or pulseless electrical activity (PEA), consistent with respiratory failure or massive pulmonary embolism as the primary cause of death. 10 , 11 , 12 However, the specific electrocardiogram (ECG) and rhythm changes that develop in those that die of COVID‐19 have not been reported. Additionally, although myocardial injury as defined by elevated serum troponin has been seen in those with arrhythmic death, other contributing factors have yet to be reported. 12
The present study investigated demographics, comorbidities, and electrocardiographic characteristics of a large cohort of hospitalized patients in the New York‐Presbyterian Hospital Network in New York City who died from complications of COVID‐19. We also performed an exploratory analysis assessing the frequency and associated factors of arrhythmic death.
2. METHODS
2.1. Data collection
Patients 18 years or older admitted to the Columbia University Irving Medical Center, New York‐Presbyterian Allen Hospital, or New York‐Presbyterian Morgan Stanley Children's Hospital with a positive nasopharyngeal or oropharyngeal SARS‐CoV‐2 reverse‐transcriptase polymerase chain reaction (RT‐PCR) assay between March 1, 2020 and April 3, 2020 were eligible for enrollment. Those who died during the index hospitalization within this period were retrospectively enrolled. The study was approved by the Columbia University Irving Medical Center Institutional Review Board. Of 1258 patients admitted with a positive SARS‐CoV‐2 RT‐PCR test, 133 (10.6%) died and were included in the study.
Demographics, comorbidities, laboratory findings, medication records, ECGs, echocardiograms, and telemetry recordings were reviewed manually. Assessed comorbidities included CVD (hypertension, hyperlipidemia, heart failure with preserved or reduced ejection fraction [EF]), coronary artery disease (CAD), valvular heart disease, and atrial fibrillation (AF), diabetes mellitus (DM), body mass index (BMI), chronic obstructive pulmonary disease (COPD), asthma, and Stage 3–5 chronic kidney disease (CKD).
Laboratory values analyzed included potassium, calcium, bicarbonate, glucose, creatinine, arterial pH, arterial pCO2, arterial lactate, high‐sensitivity troponin T (hs‐TpnT), N‐terminal pro‐B type natriuretic peptide (NT‐pro‐BNP), interleukin‐6 (IL‐6), erythrocyte sedimentation rate (ESR), C‐reactive protein (CRP), ferritin, and D‐dimer. The first tests done within 24 h of admission were considered admission values, if present. Admission, minimum, and maximum values for each test were recorded for each patient's hospitalization. (See Supporting Information for details.)
2.2. ECGs
ECGs were collected for each patient using the electronic medical record system. ECGs done within 2 years of admission were considered baseline ECGs. The first ECG done at the time of presentation was considered the admission ECG. Subsequent ECGs were recorded as follow‐up ECGs. All ECGs were analyzed by board‐certified electrophysiologists (E. Y. W., J. M. D., J. P. M., H. Y., F. E., A. B., and D. S.) using a standardized comprehensive ECG reading protocol which included intervals, rate, rhythm, axis, QRS morphology (including bundle branch block and strain), voltage, ST or T‐wave abnormalities. (See Supporting Information for details.) ECGs deemed not suitable for analysis because of artifact or lead misplacement were discarded.
2.3. Cause of death analysis
Cause of death was categorized as either arrhythmic or nonarrhythmic based on telemetry strips, ECGs, and hospital documentation. The authors were not blinded to arrhythmic or nonarrhythmic death during chart review and reading of ECGs. Arrhythmic deaths were adjudicated by a second investigator. Confirmed arrhythmic death was defined as sudden death due to documented tachyarrhythmia or bradyarrhythmia. Bradyarrhythmias were only considered arrhythmic death when not judged to be secondary to hypoxic respiratory failure. When cardiac rhythm was not recorded, documented sudden death without other identified cause was considered suspected arrhythmic death. Patients with confirmed or suspected arrhythmic death were categorized in the arrhythmic group. Nonarrhythmic death was defined as death due to other than arrhythmic causes or as the initiation of comfort care measures only.
2.4. Statistical analysis
Continuous data were assessed for normality using the Shapiro–Wilks test. Normally distributed data is presented as mean ± SD and non‐normally distributed data as median with interquartile range. Categorical data are presented as a percentage. Unpaired comparisons between continuous variables were assessed by the Student t test or Mann–Whitney U test, as applicable. Paired comparisons were performed using a paired Student's t test or Wilcoxon signed‐rank test. Categorical differences were assessed by Fisher's exact test. All p values are two‐tailed. p ≤ .05 was considered significant. All statistical tests were performed using Prism v8.4.1 (GraphPad Software).
3. RESULTS
Two analyses were performed in accordance with our methods: a descriptive analysis of the entire cohort and a comparative analysis investigating clinical and electrocardiographic factors related to arrhythmic death.
3.1. Total cohort
Demographics and hospitalization characteristics of the 133 patient deaths that occurred during the study period are summarized in Table 1. Self‐reported race/ethnicity were 53.4% (71/133) Hispanic, 15.0% (20/133) Non‐Hispanic Black, 14.3% (19/133) Non‐Hispanic White, 0.8% (1/133) Pacific Islander, 0.8% (1/133) multiracial, 0.8% (1/133) other, and 0% (0/133) Asian with 15.0% (20/133) declining to respond. Patients were 55.6% (74/133) male with a median BMI of 27.2 (23.5, 31.1) and 97.0% (129/133) had at least one pre‐existing medical condition. Hypertension was present in 82.7% (110/133), hyperlipidemia in 36.8% (49/133), CAD in 26.3% (35/133), heart failure (reduced or preserved EF) in 23.3% (31/133), AF in 23.3% (31/133), diabetes in 52.6% (70/133), CKD in 26.3% (35/133), COPD in 16.5% (22/133), and asthma in 4.5% (6/133).
Table 1.
Demographics and characteristics of COVID‐19 mortalities
| All (n = 133) | Arrhythmic death (n = 11) | Nonarrhythmic death (n = 122) | p value | |
|---|---|---|---|---|
| Male | 74 (55.6%) | 9 (82%) | 65 (53.3%) | .11 |
| Median age (25%, 75%) | 81.0 (70.5, 88.0) | 64.0 (58.0, 72.0) | 82.0 (71.8, 89.0) | <.001 |
| Race/ethnicity | ||||
| Hispanic | 71 (53.4%) | 6 (55%) | 65 (53.3%) | >.99 |
| Non‐Hispanic White | 19 (14.3%) | 1 (9%) | 18 (14.8%) | >.99 |
| Non‐Hispanic Black | 20 (15.0%) | 3 (27%) | 17 (13.9%) | .37 |
| Pacific Islander | 1 (0.8%) | 0 (0%) | 1 (0.8%) | >.99 |
| Multiracial | 1 (0.8%) | 0 (0%) | 1 (0.8%) | >.99 |
| Other | 1 (0.8%) | 0 (0%) | 1 (0.8%) | >.99 |
| Asian | 0 (0.0%) | 0 (0%) | 0 (0.0%) | N/A |
| Declined | 20 (15.0%) | 1 (9%) | 19 (15.6%) | >.99 |
| Cardiac | ||||
| Hypertension | 110 (82.7%) | 8 (73%) | 10 (83.6%) | .40 |
| Hyperlipidemia | 49 (36.8%) | 4 (36%) | 45 (36.9%) | >.99 |
| Coronary artery disease | 35 (26.3%) | 6 (55%) | 29 (23.8%) | .04 |
| Congestive heart failure | 31 (23.3%) | 2 (18%) | 29 (23.8%) | >.99 |
| Median ejection fraction (25%, 75%) | 55% (43.0%, 60.0%) | 55% (25.0%, 65.0%) | 55% (44.5%, 60.0%) | .96 |
| Atrial fibrillation | 31 (23.3%) | 1 (9%) | 30 (24.6%) | .46 |
| Valvular heart disease | 6 (4.5%) | 1 (9%) | 5 (4.1%) | .41 |
| Pacemaker | 10 (7.5%) | 0 (0%) | 10 (8.2%) | >.99 |
| Internal cardioverter defibrillator | 4 (3.0%) | 1 (9%) | 3 (2.5%) | .32 |
| Endocrine | ||||
| Diabetes mellitus | 70 (52.6%) | 7 (64%) | 63 (51.6%) | .05 |
| Median body mass index (25%, 75%) | 27.2 (23.5, 31.1) | 30.3 (26.7, 41.6) | 26.6 (23.1, 30.5) | .06 |
| Renal | ||||
| Chronic kidney disease | 35 (26.3%) | 2 (18%) | 33 (27.0%) | .73 |
| Pulmonary | ||||
| Chronic obstructive pulmonary disease | 22 (16.5%) | 1 (9%) | 21 (17.2%) | .69 |
| Asthma | 6 (4.5%) | 3 (27%) | 3 (2.5%) | .008 |
| Obstructive sleep apnea | 6 (4.5%) | 2 (18%) | 4 (3.3%) | .08 |
| Hospitalization | ||||
| Median length of stay (days (25%, 75%)) | 4 (2, 7) | 5 (2, 8) | 4 (2, 7) | .76 |
| Mechanically ventilated | 45 (33.8%) | 7 (64%) | 38 (31.1%) | .04 |
| Comfort care | 99 (74.4%) | 1 (9%) | 95 (77.9%) | <.0001 |
| Hospital medications | ||||
| Hydroxychloroquine | 75 (56.4%) | 7 (64%) | 68 (55.7%) | .76 |
| Azithromycin | 71 (53.4%) | 6 (55%) | 65 (53.3%) | >.99 |
| Hydroxychloroquine and azithromycin | 62 (46.6%) | 6 (55%) | 64 (52.5%) | >.99 |
| Quinolones | 4 (3.0%) | 0 (0%) | 4 (3.3%) | >.99 |
| Opioids | 107 (80.5%) | 8 (73%) | 99 (81.1%) | .45 |
| Beta blocker | 4 (3.0%) | 0 (0%) | 4 (3.3%) | >.99 |
| Amiodarone | 11 (8.3%) | 2 (18%) | 9 (7.4%) | .29 |
| Other antiarrhythmics | 25 (18.8%) | 1 (9%) | 24 (18.7%) | .69 |
| Vasopressors | 50 (37.6%) | 8 (73%) | 42 (34.4%) | .02 |
| Beta agonist inhalers | 16 (12.0%) | 2 (18%) | 14 (11.5%) | .62 |
Note: Baseline data on demographics and hospitalizations of the total cohort as well as divided between those who died of arrhythmic death or not with p values for comparison. Median with interquartile ranges are provided for non‐normally distributed data.
The median length of stay was 4 days (2, 7) with a range of 0–31 days. Hydroxychloroquine, azithromycin, or both were received by 56.4% (75/133), 53.4% (71/133), and 46.6% (62/133) of patients, respectively. Beta blockers were used in 3.0% (4/133) of patients. At end of life, 74.4% (99/133) died receiving comfort care measures only and 33.8% (45/133) died while on mechanical ventilation. The last recorded rhythm was VT or VF in 5.3% (7/133; four with VF, two with VT, and one with unspecified VT/VF), PEA in 7.5% (10/133), unspecified bradycardia in 0.8% (1/133), and asystole in 26.3% (35/133). In 60.2% (80/133), the final rhythm was not specified.
3.2. Laboratory values
Laboratory values are reported in Tables 2 and S1. Admission values showed potassium of 4.5 mmol/L (4.2, 5.3), calcium of 8.7 mg/dl (8.4, 9.2), bicarbonate of 22 mmol/L (19, 25), glucose of 145 mg/dl (115, 248), and creatinine of 1.6 mg/dl (1.1, 2.5). Admission arterial blood gas had a pH of 7.40 (7.30, 7.40), pCO2 of 43 mmHg (35, 49), and lactate of 1.4 mmol/L (1, 2.5). Admission hs‐TpnT and NT‐pro‐BNP were elevated at 44 ng/L (28, 99) and 2183 pg/ml (593, 5028), respectively. Admission inflammatory markers were elevated with IL‐6 of 27 pg/ml (12, 116), ESR of 71 mm/h (32), CRP of 157 mg/L (96, 243), ferritin of 684 ng/ml (237, 1082), and D‐dimer of 1.5 µg/ml (1.2, 3.7). Elevated hs‐TpnT on admission was seen in 80.5% (91/113) of patients in whom it was checked.
Table 2.
Admission laboratory values
| Total | Arrhythmic | Non‐arrhythmic | p value | |
|---|---|---|---|---|
| Chemistries | ||||
|
Potassium (mmol/L) |
4.5 (4.2, 5.3) n = 129 |
4.9 (0.8) n = 10 |
4.5 (4.2, 5.2) n = 119 |
.41 |
|
Calcium (mg/dl) |
8.7 (8.4, 9.2) n = 129 |
8.6 (8.4, 8.9) n = 10 |
8.7 (8.4, 9.2) n = 119 |
.51 |
|
Bicarbonate (mmol/L) |
22 (19, 25) n = 129 |
23.5 (21.8, 26) n = 10 |
21.7 (4.9) n = 119 |
.40 |
|
Glucose (mg/dl) |
145 (115, 248) n = 129 |
149 (111, 353) n = 10 |
142 (115, 250) n = 119 |
.84 |
|
Creatinine (mg/dl) |
1.6 (1.1, 2.5) n = 129 |
1.93 (1.31, 3.51) n = 10 |
1.6 (1.0, 2.5) n = 119 |
.28 |
| Arterial blood gas | ||||
| pH |
7.40 (7.30, 7.40) n = 41 |
7.42 (0.12) n = 3 |
7.35 (7.25, 7.43) n = 38 |
.25 |
|
pCO2 (mmHg) |
43 (35, 49) n = 41 |
42 (13.9) n = 3 |
43 (35, 49) n = 38 |
.76 |
|
Lactate (mmol/L) |
1.4 (1, 2.5) n = 28 |
1.4 (0.5) n = 3 |
1.4 (1.1, 2.6) n = 25 |
.64 |
| Cardiac | ||||
|
hs‐TpnT (ng/L) |
44 (28, 99) n = 113 |
36.3 (11.6) n = 7 |
45 (27, 111) n = 106 |
.29 |
|
NT‐pro‐BNP (pg/ml) |
2183 (593, 5028) n = 74 |
295 (124, 5694) n = 6 |
2260 (752, 5114) n = 68 |
.11 |
| Inflammatory markers | ||||
|
IL‐6 (pg/ml) |
27 (12, 116) n = 50 |
38 (6, 108) n = 7 |
24 (12.3, 118) n = 43 |
.81 |
|
ESR (mm/h) |
71 (32) n = 82 |
74.2 (40.6) n = 5 |
71.3 (31.7) n = 77 |
.89 |
|
CRP (mg/L) |
157 (96, 243) n = 99 |
203 (132) n = 8 |
157 (93.8, 238) n = 91 |
.41 |
|
Ferritin (ng/ml) |
684 (237, 1082) n = 92 |
972 (638, 2065) n = 8 |
529 (331, 1006) n = 84 |
.07 |
|
D‐dimer (µg/ml) |
1.5 (1.2, 3.7) n = 63 |
1.4 (0.8, 4.6) n = 6 |
1.54 (1.25, 3.74) n = 57 |
.48 |
Note: Admission laboratory values for the total cohort and separated by arrhythmic and nonarrhythmic death with a p value for comparison. Normally distributed data are reported as mean ± SD and non‐normally distributed data are reported as median and interquartile range. Reference ranges for less common tests are as follows: arterial lactate (normal, 0.5–1.6 mmol/L), high‐sensitivity troponin T (normal ≤ 22 ng/L), N‐terminal pro‐B type natriuretic protein (normal, 0.0–852.0 pg/ml), interleukin‐6 (normal ≤ 5.0 pg/ml), ferritin (normal, 30–400 µg/L), and D‐dimer (normal, 0.00–0.80 µg/ml). SI conversion factors: to convert calcium to mmol/L, multiply by 0.25; to convert glucose to mmol/L, multiply by 0.0555; to convert creatinine to µmol/L, multiply by 88.4; to convert ferritin to µg/L, multiply by 1; and to convert D‐dimer to nmol/L, multiply by 5.476.
Abbreviations: CRP, C‐reactive protein; ESR, erythrocyte sedimentation rate; hs‐TpnT, high sensitivity troponin‐T; IL‐6, interleukin‐6; NT‐pro‐BNP, N‐terminal pro‐B type natriuretic peptide.
3.3. Cardiac assessments
A total of 354 ECGs from the 133 patients were retrieved, 334 (93.4%) of which were of diagnostic quality and retained. Baseline ECGs taken 179 (86, 346) days before admission were assessed in 44 patients. Admission ECGs were recorded the day of hospitalization and were assessed in 126 patients. A total of 164 follow‐up ECGs were assessed in 82 patients. The last follow‐up ECG was recorded 2 (1, 3) days before death. The characteristics of baseline (n = 44), admission (n = 126), and the last ECG recorded before death (n = 82) are presented in Figure 1 and Table 3. Certain ECG diagnoses excluded the ability to make other ECG diagnoses (e.g., the diagnosis of left ventricular hypertrophy in patients with left bundle branch block [LBBB]). The total number of ECGs analyzed in each category below include only those tracings in which the diagnosis could be made (see Supporting Information for details).
Figure 1.
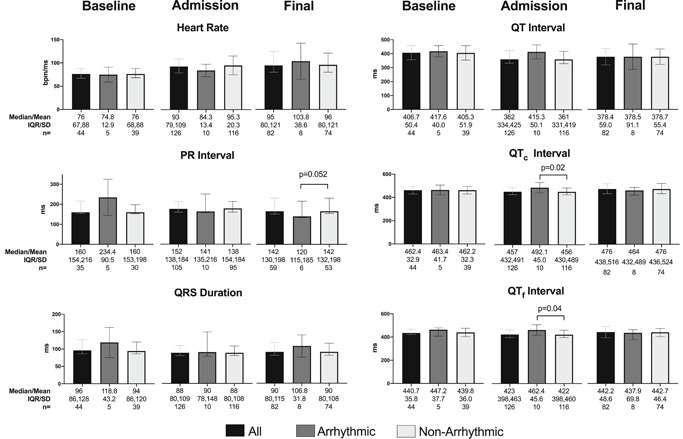
Pooled electrocardiogram (ECG) comparison at baseline, admission, and before death. Comparisons between the total cohort, arrhythmic death cohort, and nonarrhythmic death cohort for heart rate, PR interval, QRS duration, QT interval, QTc interval, and QTf interval among baseline, admission, and final ECGs. Longer QTc and QTf intervals were associated with arrhythmic death. Statistically significant differences are annotated with p values. Other comparisons were not statistically significant. Normally distributed data as assessed by the Shapiro–Wilks test were reported as a mean with SD. Non‐normally distributed data were reported as a median with interquartile range (IQR). Unpaired comparisons were assessed by the Student t test or the Mann–Whitney U test, as applicable. All p values are two‐tailed
Table 3.
Electrocardiographic characteristics
| Present at baseline | New on admission | Developed after admission | |
|---|---|---|---|
| Paced QRS Only | 1/44 (2%) | 0/44 (0%) | 0/81 (0%) |
| Left bundle branch block | 4/43 (9.3%) | 2/44 (4.5%) | 0/79 (0%) |
| Right bundle branch block | 6/43 (14%) | 1/44 (2.3%) | 1/72 (1%) |
| Intraventricular conduction delay | 1/43 (2%) | 5/44 (11.4%) | 0/78 (0%) |
| Low voltage | 3/32 (9%) | 0/44 (0%) | 2/64 (3%) |
| Right ventricular abnormality | 1/32 (3%) | 1/44 (2.3%) | 5/64 (7.8%) |
| Abnormal axis | 12/43 (28%) | 7/44 (15.9%) | 4/127 (3.2%) |
| Significant ST depression | 0/39 (0%) | 10/37 (27.0%) | 6/118 (5.1%) |
| Significant ST elevation | 0/39 (0%) | 0/37 (0%) | 0/118 (0.0%) |
| Significant T‐wave abnormality | 4/39 (10%) | 12/37 (32.4%) | 8/118 (6.8%) |
| Atrial fibrillation/flutter | 9/44 (21%) | 4/44 (9.1%) | 13/129 (10.1%) |
| Atrial ectopya | 1/35 (3%) | 7/44 (15.9%) | 19/108 (17.6%) |
| Ventricular ectopy | 5/44 (4%) | 8/44 (18.2%) | 19/129 (14.7%) |
Note: Electrocardiographic characteristics from baseline through hospitalization for the entire cohort. New findings on admission were based on a paired comparison of patients with both baseline and admission ECGs. New findings that developed after admission were based on comparison of patients with both admission and any subsequent follow‐up ECGs during hospitalization. Paced ECGs were excluded from analysis of LBBB, RBBB, or IVCD. Patients with paced, LBBB, and IVCD QRSs were excluded from analysis of ST and T‐wave abnormalities. All wide QRSs were excluded from analysis of QRS voltage or RV abnormality.
Abbreviations: ECG, electrocardiogram; IVCD, intraventricular conduction delay; LBBB, left bundle branch block; RBBB, right bundle branch block.
Excludes atrial fibrillation and flutter.
Among the 44 available baseline ECGs, the most common abnormalities were an abnormal axis in 28% (12/43), AF or flutter in 21% (9/44), a right bundle branch block (RBBB) in 14% (6/43), and an LBBB in 9.3% (4/43). Of the 126 admission ECGs assessed, the most common abnormalities present included nonsustained atrial ectopy (13/108, 12.0%), AF/flutter (18/126, 14.3%), RBBB (15/126, 11.9%), and abnormal axis (32/124, 25.8%).
Among 44 patients with both baseline and admission ECGs, a paired comparison showed that admission ECGs had a shorter PR interval, QRS duration, QT interval, and corrected QT interval by Fridericia (QTf), faster heart rate, and longer corrected QT interval by Bazett (QTc) compared with baseline. This paired comparison also demonstrated new diagnoses of T‐wave abnormalities in 32.4% (12/37 excluding pre‐existing LBBB and intraventricular conduction delay), ST depressions in 27.0% (10/37 excluding pre‐existing LBBB and intraventricular conduction delay), ventricular ectopy in 18.2% (8/44), atrial ectopy in 15.9% (7/44), QRS axis change in 15.9% (7/44), wide QRS in 11.4% (5/44), AF or flutter in 9.1% (4/44), LBBB in 4.6% (2/44), RBBB in 2.3% (1/44), and right ventricular (RV) strain pattern in 2.3% (1/44). There were no patients found to have new ST elevations, PR depressions, or low voltage on admission.
Among 79 patients with both admission and at least one follow‐up ECG, there were significant increases in heart rate and significant decreases in PR interval between admission and the last recorded ECG (Figure 2). Among all patients with admission ECGs, the most common new ECG findings that developed after admission (recorded on ECG or telemetry monitoring) were atrial ectopy in 17.6% (19/108), ventricular ectopy in 14.7% (19/129), AF or flutter in 10.1% (13/129), RV abnormality in 7.8% (5/64), and T‐wave abnormalities in 6.8% (8/118).
Figure 2.
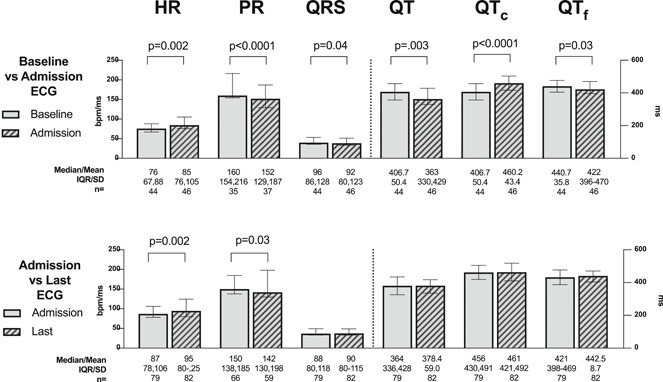
Paired electrocardiogram (ECG) comparison between admission versus baseline and versus last ECG before death. In those for whom the respective ECGs were available, the heart rate, PR interval, QRS duration, QT interval, QTc interval, and QTf interval were compared between admission and baseline (top) and between admission and the last recorded ECG before death (bottom). Statistically significant differences are annotated with p values. Other comparisons were not statistically significant. Normally distributed data as assessed by the Shapiro–Wilks test were reported as a mean with SD. Non‐normally distributed data were reported as a median with interquartile range (IQR). Paired comparisons were assessed by the paired Student's t test or the Wilcoxon signed‐rank test, as applicable. All p values are two‐tailed
Among 30.8% (41/133) of patients with echocardiograms performed before admission, the median EF was 55% (43%, 60%). Of the 9.8% (13/133) who had echocardiograms during hospitalization, there was a median EF of 45% (27.5%, 60%). The scope of echocardiograms performed during hospitalization given the critically ill state of patients was generally limited. Out of the 13 with echocardiographic assessments, 4 were bedside echocardiograms performed only for assessment of LVEF. Of the remaining nine, six had assessments of RV size (five normal, one mildly increased) and eight had assessments of RV function (four normal, one mildly reduced, two moderately reduced, and one severely reduced). RV peak systolic pressure was estimated in seven patients and had a mean of 26.8 mmHg (8.3) with a range of 14–41 mmHg plus the right atrial pressure.
3.4. Arrhythmic versus nonarrhythmic death
There was confirmed (n = 9) or suspected (n = 2) arrhythmic death in 11 patients (8.3%). Of those with confirmed arrhythmic death, eight were due to VT or VF and one was due to bradycardia. Arrhythmic death was suspected in the other two due to sudden death without other attributable etiology. Among 122 patients with nonarrhythmic death, 8.2% (10/122) had PEA and 28.7% (35/122) had asystole. For 80/122 (66.4%), the last rhythm before death was not specified. In 73/80 (91.3%), patients received comfort measures only. The cause of death in the remaining 7/80 (87.5%) was determined by clinical documentation.
Compared to patients with nonarrhythmic death, those with arrhythmic death were more likely to be older, have CAD (odds ratio [OR], 3.848; 95% confidence interval [CI], 1.003–12.14), asthma (OR, 14.88; 95% CI, 2.947–68.61), receive vasopressor medications (OR, 5.079; 95% CI, 1.419–18.22), require mechanical ventilation (OR, 3.9; 95% CI, 1.2–12.3), and trended toward having a higher BMI (p = .06). Only 16/133 (12.0%) had received albuterol, 2/11 (18.2%) of whom died of arrhythmic death (p = .62). Of the patients with arrhythmic death, seven received hydroxychloroquine, six received azithromycin, and six received both.
ECG differences between the two groups are outlined in Figure 1. There were no differences in basic measurements in baseline ECGs, although the number of baseline tracings in the arrhythmic group was limited. Patients with arrhythmic death were, however, more likely to have a baseline LBBB than those with nonarrhythmic death (OR, 18.4; 95% CI, 1.8–147.6). On admission, patients with arrhythmic death had longer QTc and QTf (492.1 vs. 456 ms, p = .02 for QTc and 462.4 vs. 422 ms, p = .04 for QTf), more ventricular ectopy (OR, 4.52; 95% CI, 1.35–15.0), and PR depression, a finding only seen in this group (OR, 0.0; 95% CI, 0.0–0.21).
3.5. QT changes with medications
There were no significant differences between QT, QTc, or QTf among those given hydroxychloroquine (n = 75) or not (n = 58), between those given azithromycin (n = 71) or not (n = 62), and between those given both (n = 62) compared with neither (n = 71). Paired comparisons of QT intervals between those who received hydroxychloroquine (n = 32), azithromycin (n = 33), and both (n = 24) demonstrated no significant differences between admission and the final ECG obtained before death (Figure 3). No cases of torsades de pointes were documented.
Figure 3.
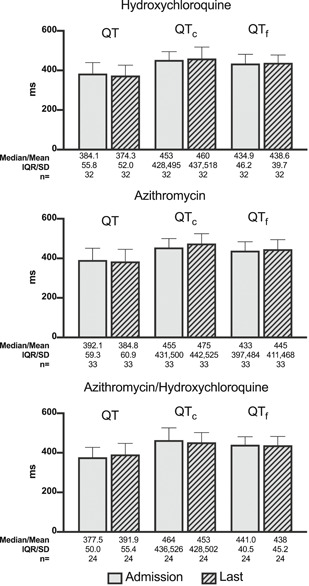
Paired comparison of QT Intervals in patients receiving hydroxychloroquine, azithromycin, and both. This paired comparison demonstrates no significant differences in QT, QTc, or QTf intervals between admission and the last electrocardiogram before death in patients receiving hydroxychloroquine, azithromycin, and both. Normally distributed data as assessed by the Shapiro–Wilks test were reported as a mean with SD. Non‐normally distributed data were reported as a median with interquartile range (IQR). Paired comparisons were performed using a paired Student's t test or a Wilcoxon signed‐rank test. All p values are two‐tailed
3.6. Echocardiographic differences
The overall baseline EF was normal. There were no differences between patients with arrhythmic versus non‐arrhythmic death, although those with arrhythmic death had few baseline echocardiograms limiting comparison (see Table 1).
3.7. Laboratory differences
There were no significant differences in admission laboratory tests between the arrhythmic and nonarrhythmic death groups. Those who died of arrhythmias did have significantly higher minimum NT‐pro‐BNP levels (7220 vs. 964 pg/ml; p = .026) and significantly higher minimum ferritin levels (1456 vs. 529 ng/ml; p = .038) during hospitalization, but no significant difference in maximums (Table S1).
4. DISCUSSION
While several studies have examined factors associated with mortality from COVID‐19 infection, this study describes one of the largest cohorts of inpatient deaths related to COVID‐19 infection to date. A majority of patients in this study died receiving comfort measures only after a median of 4 days. Confirmed or suspected arrhythmic death occurred in 8.3% of patients and was inversely associate with age, but directly associated with ventricular ectopy, mechanical ventilation, vasopressor use, longer admission corrected QT intervals, and LBBB on admission.
Prior studies have noted an association between mortality and comorbid conditions, particularly CVD. 8 , 13 Compared with previously reported Chinese, 4 , 5 , 6 , 14 , 15 Italian, 16 and United States cohorts, 7 ours has more pre‐existing CVD (117/133, 88.0%). Only 3.0% (4/133) of patients had no pre‐existing conditions. Compared with other studies of COVID‐19 mortalities, ours has a higher rate of hypertension (82.5% vs. 23.3%–48.6%), 13 , 15 CKD (26.3% vs. 4%), 13 and DM (52.6% vs. 11.6%–31%), 13 , 14 , 15 but similar rates of pulmonary disease. Patients were mostly male (55.6%), elderly, and of racial and ethnic minorities (69.9%), consistent with the diverse, urban population our hospital network serves. 17 Recent studies have highlighted worse outcomes in minority groups, 9 possibly linked to increased baseline comorbidities, decreased access to care, and limited health resources.
The median time from admission to death was 4 days, with 33.8% of patients requiring mechanical ventilation. Comfort measures only were received by 74.4% in accordance with patients' goals of care, consistent with prior reports and highlighting the rapid progression of the disease in many patients. 13 The relatively low rates of intubation and mechanical ventilation were likely a result of the implementation of palliative care teams to the emergency department to discuss patients' goals of care at the time of presentation, thus avoiding unwanted invasive ventilator support.
4.1. Cardiac evaluations
ECG and rhythm abnormalities were commonly encountered on admission and during hospitalization. Abnormalities were more common on baseline ECGs, perhaps reflecting a bias in cardiac testing of patients with known abnormalities.
Atrial ectopy, AF/flutter, RBBB, and significant ST depressions were the most common ECG abnormalities on admission. Atrial and ventricular ectopy, AF/flutter, and RV abnormality were the most common ECG abnormalities that developed during hospitalization.
RBBB, present in 11.9% (15/126) patients on admission, developed in 60% (9/15) during hospitalization. RV abnormality developed in 7.8% (5/64) during hospitalization. This could be consistent with acutely increased pulmonary vascular resistance from hypoxic pulmonary vasoconstriction of ARDS or from pulmonary embolism given the increased thrombotic risk in COVID‐19 infection. 18 Although pulmonary embolism was not diagnosed in any of the patients in this cohort, this is biased by the disruption of conducting the required diagnostic tests due to changes in hospital operations.
AF was present on 14.3% (18/126) of admission ECGs and developed in another 10.1% (13/129) during hospitalization. The ARDS Network Albuterol for Treatment of Acute Lung Injury trial showed that new AF was associated with increased 90‐day mortality (43% vs. 19%) among patients with ARDS, but the mechanism remains unclear. 19 However, a much higher incidence of atrial arrhythmias has been noted in COVID‐19‐infected patients requiring mechanical ventilation (17.7% vs. 1.9%), which may be a marker for severity of illness. 20 As systemic inflammation has been associated with the development of AF and severe COVID‐19 infection has been associated with a marked inflammatory state, this could explain our findings. 21
4.2. Laboratory assessment
Admission laboratory tests were generally revealing for a critically ill population with elevated creatinine, hs‐TpnT, NT‐pro‐BNP, and inflammatory markers. Compared with limited laboratory data available in previously published laboratory data of nonsurvivors of COVID‐19, our cohort's median troponin, creatinine, and inflammatory markers (IL‐6, D‐dimer, and CRP) suggest a higher acuity of illness on presentation. 13 , 15
4.3. Effect of hydroxychloroquine and azithromycin
Hydroxychloroquine and azithromycin, either alone or in combination were used in over 50% of patients. We found no significant effect of these medications alone or in combination on QT interval, possibly due to a small sample size, lack of standardization in timing of obtaining ECGs during treatment, and lack of dose tracking. We found no documented torsades de pointe, consistent with other studies. 22 , 23 This suggests that while the efficacy of these medications for clinical use in COVID‐19 is in question, 24 , 25 their administration could be safely considered in accordance with appropriate monitoring guidelines. 26
4.4. Etiology of cardiac arrest
While the presence of atrial and ventricular arrhythmias may be a marker for more critically ill patients or myocarditis, 4 , 27 we found that patients who died of arrhythmias were more likely to be younger, receive mechanical ventilation, have pre‐existing asthma and CAD, have a baseline LBBB, display ventricular ectopy, and have a longer QTc and QTf on admission. They trended toward having a higher BMI and more DM. Increased arrhythmic risk and mild QT prolongation with higher BMI is consistent with prior studies. 28 , 29 Although not statistically significant, the trend toward increased arrhythmic deaths among non‐Hispanic Blacks could be supported by a genetic susceptibility to sudden death among African Americans with COVID‐19. 30
The paired analysis ECG data suggest a progressive increase in a catecholaminergic state, as would be expected in a severely ill population. Catecholamines were likely to be higher in the arrhythmia group, which was more likely to receive mechanical ventilation and exogenous catecholamines, previously shown to be associated with arrhythmias, 31 than the nonarrhythmic group, many of whom were receiving only comfort measures. Likewise, ventricular ectopy was also more frequent in the arrhythmic death group (45.5% vs. 15.6%) despite similar rates of structural heart disease, which is associated with sudden death in other populations. 32
While malignant arrhythmias have been associated with myocardial injury in COVID‐19 as evidenced by elevated troponin values, 12 and the arrhythmic death cohort had more PR depressions (n = 2) possibly related to myopericarditis, we found no significant differences in biomarkers of inflammation, troponin, or electrolytes between groups. Furthermore, while there is not yet a consensus on the etiology and pathophysiology of myocardial involvement and myocarditis in COVID‐19 infection, troponin elevation was common in the total cohort.
Prolonged QT interval is known to be associated with arrhythmic death and corrected QT intervals were longer in the arrhythmic group on admission, but no longer so before death. 33 The QTc and QTf interval differences between groups may represent a predisposition to malignant arrhythmias due to underlying CVD or LBBB, which was more frequent in the arrhythmic group. 34
4.5. Study limitations
Hospital operations have been significantly altered resulting from the COVID‐19 crisis, as previously documented. 35 To mitigate the risk of spread, performance of diagnostic testing including assessments for structural heart disease and ECGs after admission was limited and not standardized. In those without baseline ECGs, the chronicity of newly observed abnormalities may have been overestimated. As the timing of follow‐up ECGs varied and 74.4% of patients died receiving comfort measures only, changes in electrocardiographic characteristics before death may have been underestimated. Given the small number of arrhythmic deaths we identified, conclusions regarding factors influencing its frequency must be considered exploratory and should be confirmed in a larger cohort. Lastly, due to the racial/ethnic diversity and a highly comorbid population, our interpretations may have limited external validity. Additional studies should focus on validating these patient mortality characteristics in COVID‐19‐infected patients to further delineate the associated risk factors and mechanisms leading to their demise.
5. CONCLUSIONS
This study represents one of the largest COVID‐19 mortality cohorts to date. Patients died after a median of only 4 days with a third of them requiring mechanical ventilation and a grand majority dying with comfort measures only. Myocardial injury, acute kidney injury, hyperglycemia, and elevated inflammatory markers were common laboratory findings. Suspected or confirmed arrhythmic death occurred in 8.3% of patients and was associated with younger age, ventricular ectopy, mechanical ventilation, vasopressor use, longer QTc and QTf intervals on admission, and LBBB on admission. Additional studies should prospectively validate these findings to improve COVID‐19 mortality, particularly in racial and ethnic minority populations.
Supporting information
Supplementary information.
Abrams MP, Wan EY, Waase MP, et al. Clinical and cardiac characteristics of COVID‐19 mortalities in a diverse New York City Cohort. J Cardiovasc Electrophysiol. 2020;31:3086–3096. 10.1111/jce.14772
Disclosures: Angelo Biviano is on the medical advisory boards for Boston Scientific and Biosense Webster. Timothy J. Poterucha owns stock in Abbott Laboratories, Abbvie Inc., Baxter International, and Edwards Lifesciences. Other authors: No disclosures.
REFERENCES
- 1. Zhu N, Zhang D, Wang W, et al. A novel coronavirus from patients with pneumonia in China, 2019. N Engl J Med. 2020;382(8):727‐733. [DOI] [PMC free article] [PubMed] [Google Scholar]
- 2. Holshue ML, DeBolt C, Lindquist S, et al. First case of 2019 novel coronavirus in the United States. N Engl J Med. 2020;382(10):929‐936. [DOI] [PMC free article] [PubMed] [Google Scholar]
- 3. COVID‐19 Data ; 2020. https://www1.nyc.gov/site/doh/covid/covid-19-data.page. Accessed May 28, 2020.
- 4. Wang D, Hu B, Hu C, et al. Clinical characteristics of 138 hospitalized patients with 2019 novel coronavirus‐infected pneumonia in Wuhan, China. JAMA. 2020;323:1061. [DOI] [PMC free article] [PubMed] [Google Scholar]
- 5. Huang C, Wang Y, Li X, et al. Clinical features of patients infected with 2019 novel coronavirus in Wuhan, China. Lancet. 2020;395(10223):497‐506. [DOI] [PMC free article] [PubMed] [Google Scholar]
- 6. Chen N, Zhou M, Dong X, et al. Epidemiological and clinical characteristics of 99 cases of 2019 novel coronavirus pneumonia in Wuhan, China: a descriptive study. Lancet. 2020;395(10223):507‐513. [DOI] [PMC free article] [PubMed] [Google Scholar]
- 7. Richardson S, Hirsch JS, Narasimhan M, et al. Presenting characteristics, comorbidities, and outcomes among 5700 patients hospitalized with COVID‐19 in the New York City area. JAMA. 2020;323:2052. [DOI] [PMC free article] [PubMed] [Google Scholar]
- 8. Ruan Q, Yang K, Wang W, Jiang L, Song J. Clinical predictors of mortality due to COVID‐19 based on an analysis of data of 150 patients from Wuhan, China. Intensive Care Med. 2020;46:846‐848. [DOI] [PMC free article] [PubMed] [Google Scholar]
- 9. Khunti K, Singh AK, Pareek M, Hanif W. Is ethnicity linked to incidence or outcomes of COVID‐19? BMJ. 2020;369:m1548. [DOI] [PubMed] [Google Scholar]
- 10. Shao F, Xu S, Ma X, et al. In‐hospital cardiac arrest outcomes among patients with COVID‐19 pneumonia in Wuhan, China. Resuscitation. 2020;151:18‐23. [DOI] [PMC free article] [PubMed] [Google Scholar]
- 11. Parish DC, Goyal H, Dane FC. Mechanism of death: there's more to it than sudden cardiac arrest. J Thorac Dis. 2018;10(5):3081‐3087. [DOI] [PMC free article] [PubMed] [Google Scholar]
- 12. Guo T, Fan Y, Chen M, et al. Cardiovascular implications of fatal outcomes of patients with coronavirus disease 2019 (COVID‐19). JAMA Cardiol. 2020;5:811. [DOI] [PMC free article] [PubMed] [Google Scholar]
- 13. Zhou F, Yu T, Du R, et al. Clinical course and risk factors for mortality of adult inpatients with COVID‐19 in Wuhan, China: a retrospective cohort study. Lancet. 2020;395(10229):1054‐1062. [DOI] [PMC free article] [PubMed] [Google Scholar]
- 14. Yang X, Yu Y, Xu J, et al. Clinical course and outcomes of critically ill patients with SARS‐CoV‐2 pneumonia in Wuhan, China: a single‐centered, retrospective, observational study. Lancet Respir Med. 2020;8:475‐481. [DOI] [PMC free article] [PubMed] [Google Scholar]
- 15. Jin J‐M, Bai P, He W, et al. Gender differences in patients with COVID‐19: focus on severity and mortality. Front Public Health. 2020;8:152. [DOI] [PMC free article] [PubMed] [Google Scholar]
- 16. Grasselli G, Zangrillo A, Zanella A, et al. Baseline characteristics and outcomes of 1591 patients infected with SARS‐CoV‐2 admitted to ICUs of the Lombardy Region, Italy. JAMA. 2020;323:1574. [DOI] [PMC free article] [PubMed] [Google Scholar]
- 17. Wadhera RK, Wadhera P, Gaba P, et al. Variation in COVID‐19 hospitalizations and deaths across New York City boroughs. JAMA. 2020;323:2192. [DOI] [PMC free article] [PubMed] [Google Scholar]
- 18. Bikdeli B, Madhavan MV, Jimenez D, et al. COVID‐19 and thrombotic or thromboembolic disease: implications for prevention, antithrombotic therapy, and follow‐up. J Am Coll Cardiol. 2020;75:2950‐2973. [DOI] [PMC free article] [PubMed] [Google Scholar]
- 19. Ambrus DB, Benjamin EJ, Bajwa EK, Hibbert KA, Walkey AJ. Risk factors and outcomes associated with new‐onset atrial fibrillation during acute respiratory distress syndrome. J Crit Care. 2015;30(5):994‐997. [DOI] [PMC free article] [PubMed] [Google Scholar]
- 20. Goyal P, Choi JJ, Pinheiro LC, et al. Clinical characteristics of Covid‐19 in New York City. N Engl J Med. 2020;382:2372‐2374. [DOI] [PMC free article] [PubMed] [Google Scholar]
- 21. Guo Y, Lip GY, Apostolakis S. Inflammation in atrial fibrillation. J Am Coll Cardiol. 2012;60(22):2263‐2270. [DOI] [PubMed] [Google Scholar]
- 22. Saleh M, Gabriels J, Chang D, et al. The effect of chloroquine, hydroxychloroquine and azithromycin on the corrected QT interval in patients with SARS‐CoV‐2 infection. Circ Arrhythm Electrophysiol. 2020;13:e008662. [DOI] [PMC free article] [PubMed] [Google Scholar]
- 23. Borba MGS, Val FFA, Sampaio VS, et al. Effect of high vs low doses of chloroquine diphosphate as adjunctive therapy for patients hospitalized with severe acute respiratory syndrome coronavirus 2 (SARS‐CoV‐2) infection: a randomized clinical trial. JAMA Netw Open. 2020;3(4):e208857. [DOI] [PMC free article] [PubMed] [Google Scholar]
- 24. Rosenberg ES, Dufort EM, Udo T, et al. Association of treatment with hydroxychloroquine or azithromycin with in‐hospital mortality in patients with COVID‐19 in New York State. JAMA. 2020;323:2493. [DOI] [PMC free article] [PubMed] [Google Scholar]
- 25. Geleris J, Sun Y, Platt J, et al. Observational study of hydroxychloroquine in hospitalized patients with Covid‐19. N Engl J Med. 2020;382:2411‐2418. [DOI] [PMC free article] [PubMed] [Google Scholar]
- 26. Giudicessi JR, Noseworthy PA, Friedman PA, Ackerman MJ. Urgent guidance for navigating and circumventing the QTc‐prolonging and torsadogenic potential of possible pharmacotherapies for coronavirus disease 19 (COVID‐19). Mayo Clin Proc. 2020;95:1213‐1221. [DOI] [PMC free article] [PubMed] [Google Scholar]
- 27. Driggin E, Madhavan MV, Bikdeli B, et al. Cardiovascular considerations for patients, health care workers, and health systems during the coronavirus disease 2019 (COVID‐19) pandemic. J Am Coll Cardiol. 2020;75:2352‐2371. [DOI] [PMC free article] [PubMed] [Google Scholar]
- 28. Ramirez AH, Schildcrout JS, Blakemore DL, et al. Modulators of normal electrocardiographic intervals identified in a large electronic medical record. Heart Rhythm. 2011;8(2):271‐277. [DOI] [PMC free article] [PubMed] [Google Scholar]
- 29. Homan EA, Reyes MV, Hickey KT, Morrow JP. Clinical overview of obesity and diabetes mellitus as risk factors for atrial fibrillation and sudden cardiac death. Front Physiol. 2019;9:1847. [DOI] [PMC free article] [PubMed] [Google Scholar]
- 30. Giudicessi JR, Roden DM, Wilde AAM, Ackerman MJ. Genetic susceptibility for COVID‐19‐associated sudden cardiac death in African Americans. Heart Rhythm. 2020;17:1487‐1492. [DOI] [PMC free article] [PubMed] [Google Scholar]
- 31. Tisdale JE, Patel RV, Webb CR, Borzak S, Zarowitz BJ. Proarrhythmic effects of intravenous vasopressors. Ann Pharmacother. 1995;29(3):269‐281. [DOI] [PubMed] [Google Scholar]
- 32. Dukes JW, Dewland TA, Vittinghoff E, et al. Ventricular ectopy as a predictor of heart failure and death. J Am Coll Cardiol. 2015;66(2):101‐109. [DOI] [PMC free article] [PubMed] [Google Scholar]
- 33. O'Neal WT, Singleton MJ, Roberts JD, et al. Association between QT‐interval components and sudden cardiac death: the ARIC study (Atherosclerosis Risk in Communities). Circ Arrhythm Electrophysiol. 2017;10(10):e005485. [DOI] [PMC free article] [PubMed] [Google Scholar]
- 34. Montanez A, Ruskin JN, Hebert PR, Lamas GA, Hennekens CH. Prolonged QTc interval and risks of total and cardiovascular mortality and sudden death in the general population: a review and qualitative overview of the prospective cohort studies. Arch Intern Med. 2004;164(9):943‐948. [DOI] [PubMed] [Google Scholar]
- 35. Rubin GA, Wan EY, Saluja D, et al. Restructuring electrophysiology during the COVID‐19 pandemic: a practical guide from a New York City Hospital Network. Crit Pathw Cardiol. 2020;19:105‐111. [DOI] [PMC free article] [PubMed] [Google Scholar]
Associated Data
This section collects any data citations, data availability statements, or supplementary materials included in this article.
Supplementary Materials
Supplementary information.