Abstract
Oily sludge is a hazardous waste. If not handled properly, it can not only pollute the environment but also endanger human health. This study is the first to use a response surface method to optimize the main parameters of rhamnolipid-based recovery of oil from oily sludge. Using rhamnolipids as the cleaning agent and the oil recovery fraction as the evaluation index, the factors affecting the cleaning efficiency of oily sludge were optimized. The aforementioned sludge was obtained from the Tarim Oilfield. A single-factor experiment was conducted to determine the optimal range of the dosage, liquid–solid ratio, pH value, and time. The Box–Behnken response surface method was used to investigate the influence of each variable on the residual oil fraction of the oily sludge, and the dosage, pH value, and time were found to have a significant impact. The model optimization results show that the best process conditions for rhamnolipid-based recovery of oil are as follows: rhamnolipid dosage = 167.785 mg/L; liquid–solid ratio = 4.589:1; pH = 9.618; time = 1.627 h. Under optimal conditions, the model-predicted oil recovery fraction and the actual oil recovery fraction were 85.15 and 82.56%, respectively; the relative error between the predicted and the actual values was 2.59%. These results indicate that the model results are reliable. The solid residue after the cleaning was also analyzed to gain an in-depth understanding of the cleaning process. This study determined the feasibility of a rhamnolipid-based solution for the treatment of oily sludge and oil-contaminated soil.
1. Introduction
Oily sludge is produced during oil production, refining, tank cleaning, transportation, and storage processes.1 It is a highly persistent mixture mainly composed of water, petroleum hydrocarbons (PHCs), and solids and represents a relatively stable suspension emulsion.2 Commonly used oily sludge treatment technologies include cleaning, incineration, extraction, photocatalytic, and biological treatment methods.3 However, most of these methods are costly, or they require complex and sophisticated equipment, which are challenges associated with their adoption.
Because oily sludge contains high concentrations of petroleum hydrocarbons, recovery methods are highly preferred.4 The cleaning method has been widely employed because it requires simple equipment and offers facile operation and a high oil recovery rate. Duan et al.5 used thermochemical methods to clean oily sludge and explored the effects of the cleaning agent dosage, liquid–solid ratio, cleaning time, and cleaning temperature on treatment efficiency. Jin et al.6 identified the most suitable cleaning agent for use in ultrasonic and thermal cleaning to treat oily sludge and determined the impact of various factors on oil recovery.
The application of the cleaning method involves washing the oily sludge multiple times using an aqueous solution, which contains a cleaning agent, and achieving solid–liquid separation after centrifugal precipitation.7 The choice of the cleaning agent is the main factor determining the effectiveness of oil recovery by the cleaning method.5 The commonly used cleaning agents are chemical surfactants, i.e., anionic surfactants (such as Tween 20) and nonionic surfactants (such as N-methyl pyrrolidone).8 Although chemical surfactants exhibit high oil recovery rates, they have the disadvantages of a long degradation cycle and potential biological toxicity. Compared with the traditional chemically synthesized surfactants, biosurfactants have high biocompatibility and biodegradability, low toxicity, environmental friendliness, more stable emulsification of oil and water, diverse structures, and wide applications. Zhang et al.9 showed that biosurfactants are more efficient at recovering crude oil than traditional chemical surfactants. Lima et al.10 showed that biosurfactants are highly effective in treating oily sludge, with oil recovery rates reaching 95%.
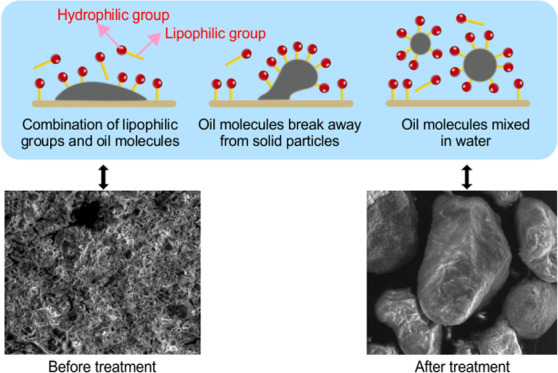
Rhamnolipids, which are biological surfactants, have significant application prospects for oil recovery.11 They can effectively reduce the surface tension of the interface between water and oil molecules and enhance the solubility of oily substances in water.8 The mechanism of oil recovery using rhamnolipids is illustrated in Figure 1. Liu et al.12 used rhamnolipids to successfully recover oil in the bottom sludge of a crude oil tank, thus demonstrating their broad application potential.
Figure 1.

Mechanism of oil recovery by rhamnolipids.
The response surface method is a statistical experiment design, which identifies the best combination of each factor level by searching for a quantitative relationship between the test index and each factor.13,14 Using this method, a model can be established through computer operations by utilizing a continuous variable surface model to evaluate the factors affecting the crude oil recovery process and their interactions.15 The response surface method requires relatively few test groups, which can save labor and material resources.16 However, at present, only a few studies have conducted single-factor analysis on the process parameters of rhamnolipid treatment of oily sludge, and there are no reports on the use of a response surface methodology for optimizing rhamnolipid-based recovery of oil from oily sludge.
This study aims to determine the optimal range of rhamnolipid dosage, liquid–solid ratio, pH value, and contact time between rhamnolipid and oily sludge using single-factor experiments, the Box–Behnken response surface method for obtaining the optimal process parameters, and the petroleum hydrocarbon (PHC) fraction and scanning electron microscopy (SEM) analyses. The experimental results provide important references for further research on oil recovery from oily sludge using rhamnolipids.
2. Materials and Methods
2.1. Materials
2.1.1. Rhamnolipids
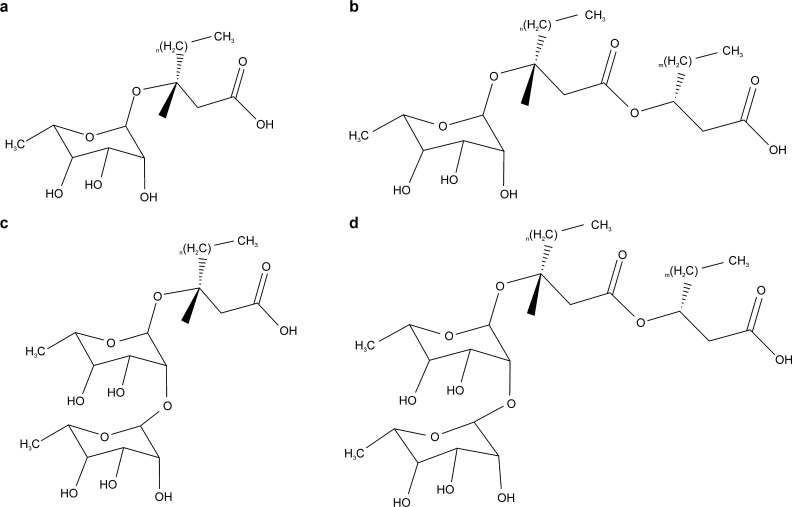
Rhamnolipids (Huzhou Zijin Biotechnology Co., Ltd., China.) are a type of glycolipid biosurfactant secreted by Pseudomonas or Burkholderia, among other organisms.17 Based on the number of rhamnoglycans, rhamnolipids can be divided into monosaccharide rhamnolipids and disaccharide rhamnolipids.18 The sugar group in rhamnolipids is a hydrophilic group, and the ester is a hydrophobic group that can be ionized in an aqueous solution.8 The structure of rhamnolipids is illustrated in Figure 2.
Figure 2.
Monosaccharide rhamnolipid (a, b) homologs and disaccharide rhamnolipid (c, d) homologs.
2.1.2. Oily Sludge
Oily sludge was obtained from the ground sludge in the operation area of the PetroChina Tarim Oilfield, located in XinJiang, Northwest China. The sample was stored in a sealed glass jar that was kept at 21–25 °C and thoroughly stirred manually prior to being used in the experiments.19Table 1 lists the sample properties. The Chinese method HJ637-2018 was used to measure oil concentration, and distillation was used to measure the water content.20 Moreover, the solid content was determined by the oil and water content.21 Inductively coupled plasma (ICP) analytical measurements were used to evaluate the presence of metal elements.22,23
Table 1. Characteristics of Oily Sludge Sample.
| parameter | value |
|---|---|
| oil (mass percentage) | 25.23% |
| water (mass percentage) | 46.85% |
| solid (mass percentage) | 27.92% |
| pH | 7.2 |
| zinc (Zn) (mg/kg) | 21.3 |
| copper (Cu) (mg/kg) | 18.3 |
| chromium (Cr) (mg/kg) | 17.5 |
| arsenic (As) (mg/kg) | 13.1 |
| lead (Pb) (mg/kg) | 8.4 |
| nickel (Ni) (mg/kg) | 10.6 |
2.2. Experimental Design
2.2.1. Single-Factor Test Experiments
Rhamnolipid solutions were prepared with the concentrations listed in Table 2, and 3 g of oily sludge was added to the rhamnolipid solution based on the liquid–solid ratios listed in the table to adjust the pH value.24 After the mixture was sealed, it was placed on a shaker, treated for the listed time periods, and then centrifuged (5000 rpm). Finally, the oil content of the tailings was measured.
Table 2. Experimental Factors and Values.
| factors | levels | ||||
|---|---|---|---|---|---|
| dosage (mg/L) | 50 | 100 | 150 | 200 | 250 |
| liquid–solid ratio (mL/g) | 1:1 | 3:1 | 5:1 | 7:1 | 9:1 |
| pH | 5 | 7 | 9 | 11 | 13 |
| time (h) | 0.5 | 1.0 | 1.5 | 2.0 | 2.5 |
2.2.2. Response Surface Test Design
The Box–Behnken response surface (Design-Expert 11.04) method25 was used to optimize the rhamnolipid treatment of the oily sludge. The significance of the factors and the interactions between them were analyzed using analysis of variance (ANOVA). Based on the single-factor experiment, the optimal conditions for rhamnolipid treatment of oily sludge were obtained using the response surface methodology. Rhamnolipid dosage (A), liquid–solid ratio (B), pH value (C), and time (D) were selected as independent variables, and the oil recovery fraction was the response value. Table 3 lists the factor levels.
Table 3. Response Surface Analysis Factor Levels.
| levels |
|||
|---|---|---|---|
| factors | –1 | 0 | 1 |
| dosage (mg/L) | 100 | 150 | 200 |
| liquid–solid ratio (mL/g) | 3:1 | 5:1 | 7:1 |
| pH | 7 | 9 | 11 |
| time (h) | 1 | 1.5 | 2 |
2.3. Sample Analysis
2.3.1. Oil Content Analysis
The oil content was measured using the Chinese method HJ637-2012 “Water quality—determination of petroleum and animal and plant oils—infrared spectrophotometry.” An aliquot of 5 g of oily sludge was weighed and mixed with 5 g of anhydrous sodium sulfate. After adding 10 mL of CCl4 reagent, the sample was shaken to ensure an even dispersal and then subjected to ultrasonic treatment for 10 min. Next, the sample was centrifuged at low speed, 800 rpm for 10 min, to separate the sludge sediment from the liquid. The process was repeated three times for each sample, resulting in three extracts from the same 5 g sample of oil sludge. After the three extracts were mixed, the mixed extract was dried over anhydrous sodium sulfate, filtered through an ordinary funnel, and transferred to a 50 mL volumetric flask. An infrared oil-measuring instrument (Oil-480 Huaxia Science and Technology, China) was used to determine the oil content of the extract.
2.3.2. Oil Recovery Fraction
The oil recovery fraction was calculated using eq 1.
| 1 |
where Rrecovered oil is the oil recovery fraction (%), Moriginal is the mass of oil in the original sludge, and Mresidue is the mass of oil in the residual sludge.
2.3.3. PHC Fraction Analysis
A group of PHCs from C10 to C16, C16 to C34, and C34 to C50 were defined as F2, F3, and F4, respectively.22 A gas chromatograph equipped with a flame ionization detector (Varian 6800N, Varian Technology China Co., Ltd., Shanghai, China) was used to measure the PHCs. The significant instrument parameters included a 5 m × 0.53 mm × 0.09 μm ZB-capillary column (Phenomenex Torrance, CA), 99.999% helium carrier gas, 50 Hz frequency, and 1 μL injection volume. The temperature was increased from 100 to 430 °C at a rate of 15 °C/min.
2.3.4. SEM Analysis
One sample of sludge was prepared before and after treatment. Moisture from the sludge sample was removed to bring it to a semidry state, which was the natural state. To prepare the sample for testing, a thin layer of the sample was placed on the tape of the sample holder and then into the ring scanning electron microscope (FEI Quanta 200F, Changhai Baihe Instrument Technology Co., Ltd., China). The conditions for the SEM were an accelerating voltage of 200 V–30 kV, a resolution of 1.2 nm, and a magnification of 600 K; the scanning mode was a low-vacuum mode.
3. Results and Discussion
3.1. Single-Factor Test
3.1.1. Impact of Rhamnolipid Dosage
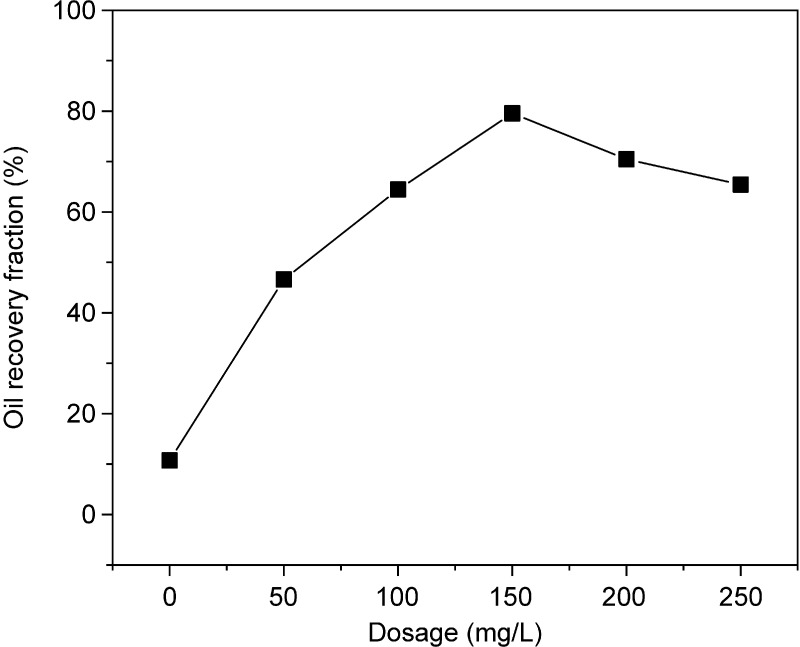
With the addition of rhamnolipids at concentrations of 0–150 mg/L, the oil recovery fraction increased from 10.73 to 79.56% (Figure 3); at a rhamnolipid concentration of 150 mg/L, the oil recovery fraction reached 79.56%. When the rhamnolipid comes in contact with oily sludge, rhamnolipid molecules adsorb oil molecules and reduce the tension of the solid–liquid interface, thereby promoting the migration of oil molecules from solid particles to the aqueous phase.10 In this study, at higher rhamnolipid doses (i.e., ≥150 mg/L), the oil recovery fraction began to decline. Whang et al.26 and Zhu et al.27 showed that excessive amounts of certain surfactants (such as rhamnolipids) may cause the viscosity of the mixture of oily sludge and the surfactant solution to increase. However, an increase in viscosity is not conducive to the separation of oil molecules and solid particles. The suitable range for the dosage of rhamnolipids was found to be 100–200 mg/L in this study.
Figure 3.
Impact of rhamnolipid dosage. Experiment conditions: liquid–solid ratio = 5:1, pH = 9, and time = 1.5 h.
3.1.2. Impact of Liquid–Solid Ratio
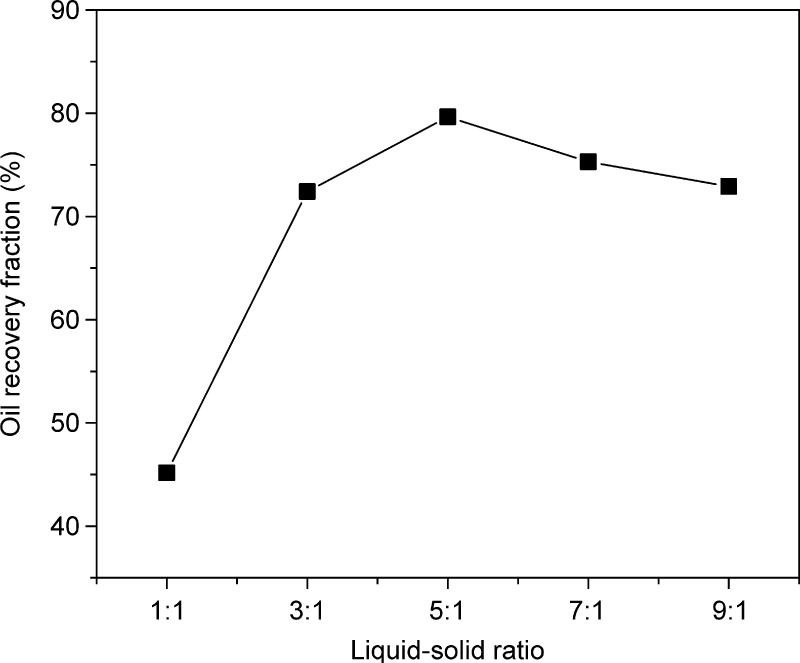
In Figure 4, as the liquid–solid ratio increases from 1:1 to 5:1, the oil recovery fraction of rhamnolipid increases from 45.17 to 79.65%. At low liquid–solid ratios, the mass transfer of the system is affected by the high content of solids, which is not conducive to oil recovery.28 At liquid–solid ratios higher than 5:1, the oil recovery fraction drops significantly because an oil-in-water emulsion easily forms during shaking at the constant temperature. This causes rhamnolipid molecules to be adsorbed on the surface of the solid particles and the eluted oil molecules to re-integrate into the solid particles, resulting in a decrease in oil recovery.29 Therefore, the optimum range of the liquid–solid ratio is 3:1–7:1.
Figure 4.
Impact of liquid–solid ratio. Experiment conditions: dosage = 150 mg/L, pH = 9, and time = 1.5 h.
3.1.3. Impact of pH
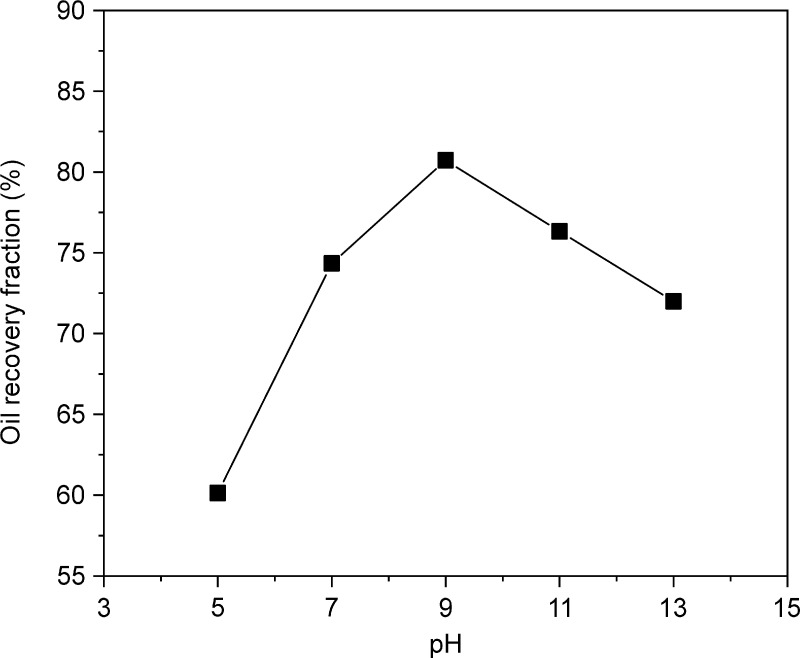
In Figure 5, when the pH is between 5 and 9, the oil recovery fraction increases from 60.13 to 80.72%. Previous studies showed that an alkaline environment is ideal for oil recovery because the carboxyl groups in rhamnolipids dissociate in an alkaline environment and form a hydrophilic film on the oil surface by enrichment, thereby reducing the adhesion between solid particles and oil molecules and promoting oil separation.30 This is in line with many reports that highlight that alkaline conditions are conducive to the desorption of crude oil from oily sludge.20 However, at pH > 9, there is excess OH–, which reduces the recovered fraction of the oil.30,31 Therefore, the optimum pH range was determined as 7–11.
Figure 5.
Impact of pH value. Experiment conditions: dosage = 150 mg/L, liquid–solid ratio = 5:1, and time = 1.5 h.
3.1.4. Impact of Time
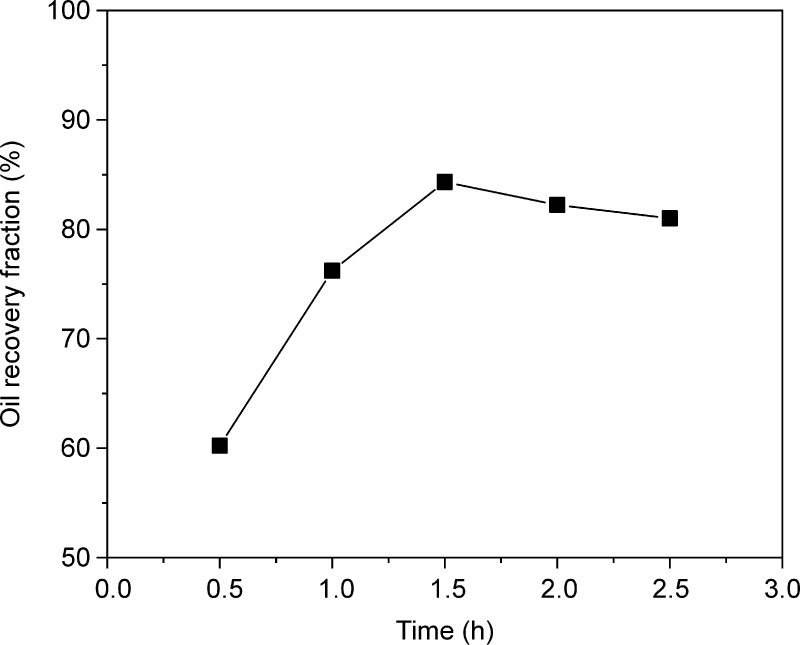
In Figure 6, as the experiment duration increases from 0.5 to 1.5 h, the oil recovery fraction increases from 60.23 to 84.32% because oil recovery improves when the oily sludge has sufficient time to come into contact with rhamnolipids.32 However, when the experiment duration increases from 1.5 to 2.5 h, the oil recovery fraction reduces from 84.32 to 81.00%. This is because further contact causes the oil and water to form an oil-in-water emulsion, thereby inhibiting the separation of oil and water, resulting in a decrease in oil recovery.33 Therefore, the optimal contact time range is 1.0–2.0 h. This is similar to the experimental results of Bao et al., who used rhamnolipids to treat oily sludge and found that the best reaction time was approximately 1.5 h.34
Figure 6.
Impact of time. Experiment conditions: dosage = 150 mg/L, liquid–solid ratio = 5:1, and pH = 9.
3.2. Response Surface Analysis
3.2.1. Box–Behnken Central Composite Experiment and Variance Analysis
The response surface analysis results are presented in Table 4. Using variance analysis, the experimental data were fitted to multiple quadratic regression models (Table 5). The P-value of the model was less than 0.0001, which indicates that the probability that differences between the model and the experimental results will occur owing to the random errors are less than 1%.35 The P-values of A, C, and D in Table 5 were all under 0.05, which indicates that A, C, and D had a significant influence on the response values.36 This is consistent with the conclusion of Xiao et al., who used the response surface method to study the ozone process parameters of oily sludge and found that the pH value and time had a significant effect on the response value.30 The P-value of the lack of fit was 0.3118; thus, data derived from the model demonstrated a good fit with the experimental data. The comparison of the F values shows that the order of influence is C > A > D > B. The R2 value (0.9805) is close to 1, and R2 and Radj2 are close to each other, indicating that the model (linear eq 2) shows a high degree of fitting. The comparison between the predicted and actual values is presented in Figure 7 and Table 4. According to the results of ANOVA, the multiple quadratic regression model designed using the response surface fits well with the experimental data.
Table 4. Response Surface Experiments.
| number | A | B | C | D | predicted | actual |
|---|---|---|---|---|---|---|
| 1 | 0 | 0 | 0 | 0 | 83.16 | 84.59 |
| 2 | 0 | –1 | 1 | 0 | 78.42 | 79.11 |
| 3 | –1 | –1 | 0 | 0 | 69.05 | 66.89 |
| 4 | 0 | 1 | 1 | 0 | 76.84 | 76.26 |
| 5 | 0 | 0 | 0 | 0 | 83.16 | 82.39 |
| 6 | 1 | –1 | 0 | 0 | 80.41 | 78.54 |
| 7 | –1 | 0 | 1 | 0 | 69.03 | 70.04 |
| 8 | 0 | –1 | 0 | –1 | 72.11 | 72.92 |
| 9 | 0 | 0 | 0 | 0 | 83.16 | 82.08 |
| 10 | 0 | 1 | –1 | 0 | 68.18 | 68.35 |
| 11 | 0 | 1 | 0 | 1 | 77.87 | 78.01 |
| 12 | 0 | 0 | –1 | –1 | 61.58 | 60.23 |
| 13 | –1 | 1 | 0 | 0 | 70.61 | 70.67 |
| 14 | 1 | 1 | 0 | 0 | 77.17 | 77.52 |
| 15 | 0 | 0 | 0 | 0 | 83.16 | 84.00 |
| 16 | –1 | 0 | 0 | 1 | 71.83 | 71.65 |
| 17 | 1 | 0 | 0 | –1 | 74.19 | 75.23 |
| 18 | 0 | 1 | 0 | –1 | 71.98 | 71.84 |
| 19 | 0 | 0 | 1 | –1 | 72.24 | 71.02 |
| 20 | 1 | 0 | –1 | 0 | 68.59 | 68.52 |
| 21 | 0 | 0 | –1 | 1 | 69.44 | 68.85 |
| 22 | 0 | –1 | 0 | 1 | 79.42 | 80.51 |
| 23 | 0 | 0 | 0 | 0 | 83.16 | 82.76 |
| 24 | –1 | 0 | –1 | 0 | 60.36 | 60.75 |
| 25 | 0 | –1 | –1 | 0 | 68.28 | 69.73 |
| 26 | 1 | 0 | 1 | 0 | 78.73 | 79.29 |
| 27 | 1 | 0 | 0 | 1 | 77.96 | 77.95 |
| 28 | 0 | 0 | 1 | 1 | 77.59 | 77.13 |
| 29 | –1 | 0 | 0 | –1 | 62.39 | 63.26 |
Table 5. Analysis of Variance Results.
| source | sum of squares | df | mean square | F-value | P-value |
|---|---|---|---|---|---|
| model | 1261.33 | 14 | 90.10 | 50.41 | <0.0001 |
| A | 241.11 | 1 | 241.11 | 134.92 | <0.0001 |
| B | 2.13 | 1 | 2.13 | 1.19 | 0.2939 |
| C | 265.27 | 1 | 265.27 | 148.43 | <0.0001 |
| D | 130.68 | 1 | 130.68 | 73.12 | <0.0001 |
| AB | 5.76 | 1 | 5.76 | 3.22 | 0.0942 |
| AC | 0.5476 | 1 | 0.5476 | 0.3064 | 0.5886 |
| AD | 8.04 | 1 | 8.04 | 4.50 | 0.0523 |
| BC | 0.5402 | 1 | 0.5402 | 0.3023 | 0.5911 |
| BD | 0.5041 | 1 | 0.5041 | 0.2821 | 0.6037 |
| CD | 1.58 | 1 | 1.58 | 0.8813 | 0.3638 |
| A2 | 257.82 | 1 | 257.82 | 144.26 | <0.0001 |
| B2 | 42.16 | 1 | 42.16 | 23.59 | 0.0003 |
| C2 | 382.91 | 1 | 382.91 | 214.26 | <0.0001 |
| D2 | 180.03 | 1 | 180.03 | 100.74 | <0.0001 |
| residual | 25.02 | 14 | 1.79 | ||
| lack of fit | 20.35 | 10 | 2.03 | 1.74 | 0.3118 |
| pure error | 4.67 | 4 | 1.17 | ||
| cor total | 1286.35 | 28 | |||
| R2 = 0.9805 | RAdj2 = 0.9611 | CV% = 1.80 |
Figure 7.
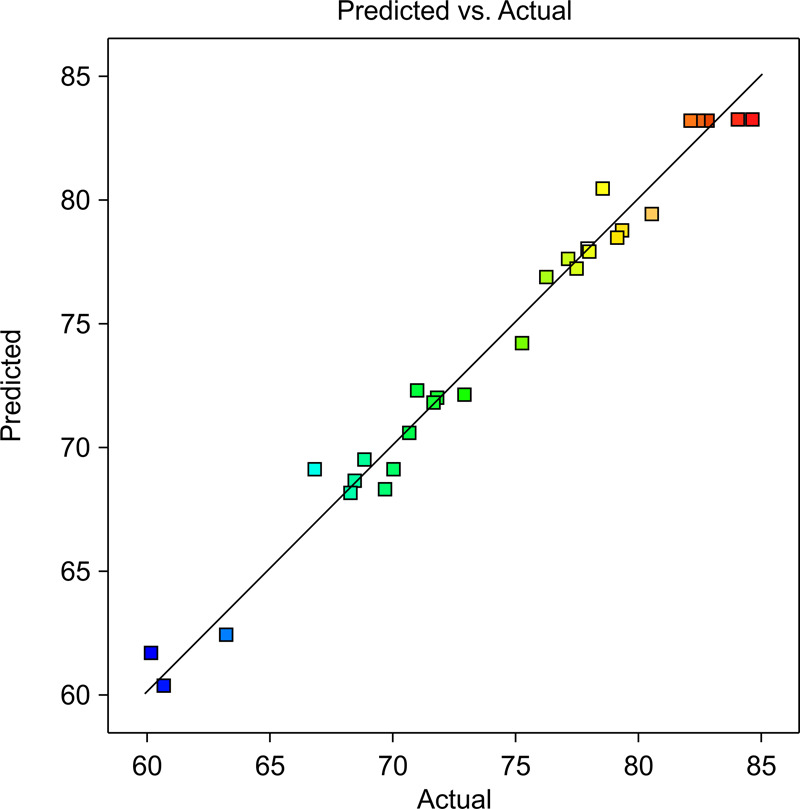
Comparison of the predicted and actual oil recovery fractions.
Each factor was fitted as follows to obtain a linear equation
 |
2 |
where Y is the Oil recovery fraction response value; A is the factor value of dosage; B is the factor value of liquid to solid ratio; C is the factor value of pH; D is the factor value of time.
3.2.2. Response Surface Interaction Analysis
In Figure 8, when the pH is 9 and the time is 1.5 h, the interaction between the dosage and the liquid–solid ratio affects oil recovery. At dosages of 160–180 mg/L and liquid–solid ratios of 5:1–6:1, the recovery fraction of oil is the highest. When the liquid–solid ratio is kept in the optimal range, increasing the dosage of rhamnolipids improves the recovery fraction of oil; however, excessive dosage of rhamnolipids may cause the viscosity of the mixture of solutions to increase, which is not conducive to the separation of oil molecules. The slope of the curved surface in Figure 8 shows that regardless of how the dosage changes, the oil recovery fraction does not change significantly with an increase in the liquid–solid ratio. Therefore, the liquid–solid ratio of 5:1–6:1 has little effect on the recovery fraction of oil, which is consistent with the model results.
Figure 8.
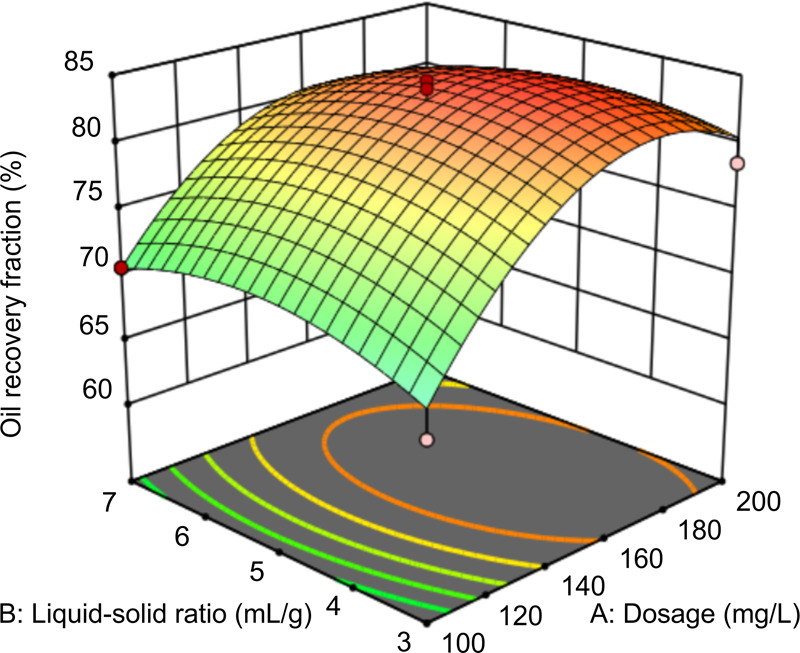
Response surface graph of the effect of liquid–solid ratio and dosage on oil recovery.
In Figure 9, at a liquid–solid ratio of 5:1 and a time of 1.5 h, the interaction between pH and dosage affects oil recovery. When the pH value is in the range of 9–10 and the dosage is in the range of 140–200 mg/L, the recovery fraction of oil is the highest. The likely mechanisms driving these findings are as follows. Under alkaline conditions, the carboxyl groups in rhamnolipids, which exhibit strong hydrophilicity, are released; they form a hydrophilized film on the oil surface by enrichment, thereby reducing the adhesion between solid particles and oil molecules and promoting oil separation. At pH > 10, OH– surplus occurs and negatively affects oil recovery. Under weakly alkaline conditions, increasing the rhamnolipid dosage increases the probability of the contact between carboxyl groups in the rhamnolipid and oily sludge, resulting in an increase in oil recovery. However, the continuous increase in the rhamnolipid dosage leads to an increase in the viscosity between the oily sludge and the rhamnolipid solution and reduces the oil recovery rate. The slope of the curved surface indicates that the pH value has a significant influence on oil recovery, which is consistent with the model results.
Figure 9.
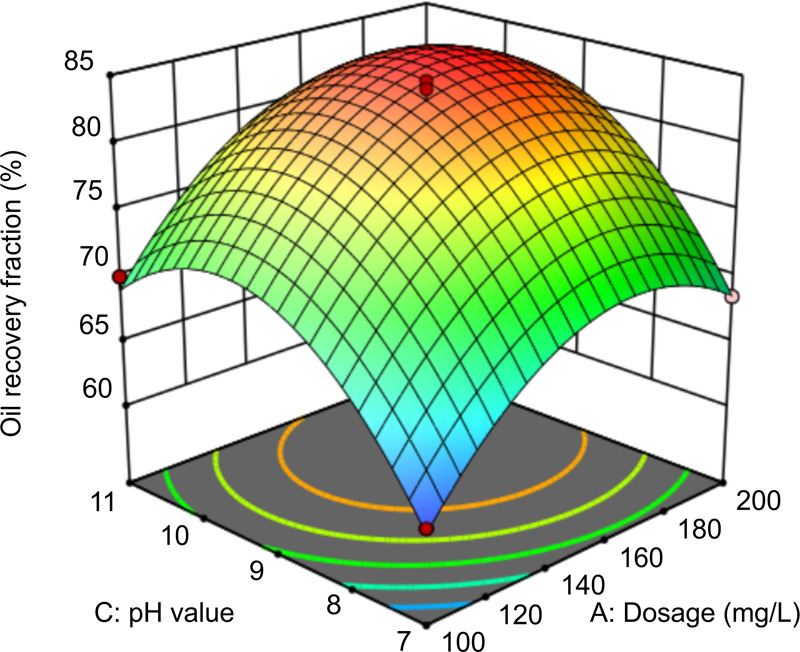
Response surface graph of the effect of pH and dosage on oil recovery.
In Figure 10, at the liquid–solid ratio of 5:1 and pH of 9, the interaction between time and dosage affects oil recovery. At dosages of 160–200 mg/L and in the time range of 1.6–1.8 h, the oil recovery fraction and the treatment efficiency are the highest. At an appropriate dosage, increasing the time increases the probability of contact between rhamnolipids and oily sludge, which helps separate the oil molecules. However, under longer contact durations, the oil recovery fraction decreases because of the formation of an oil-in-water emulsion, which further hinders oil–water separation. Increasing the dosage can increase the number of rhamnolipid molecules and improve oil recovery. The slope of the curved surface implies that time has a significant impact on oil recovery, which is consistent with the model results.
Figure 10.
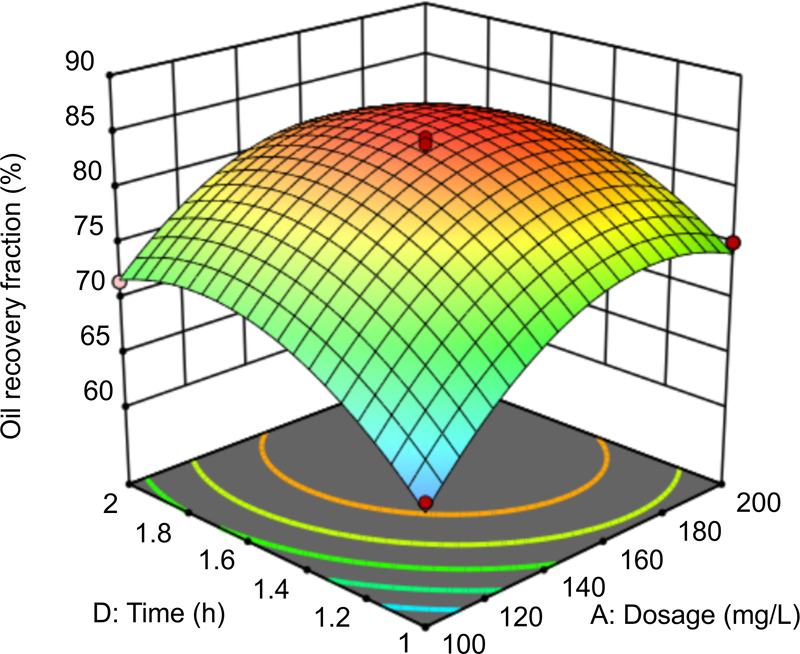
Response surface graph of the effect of time and dosage on oil recovery.
Xiao et al.30 used ozonation to treat oily sludge and studied the interaction between the solid–liquid ratio and pH. However, they only briefly introduced the experimental results. Figure 11 shows the interaction between the pH and the liquid–solid ratio when the dosage is 150 mg/L and the time is 1.5 h. When the pH value is in the range of 9.2–10.2 and the liquid–solid ratio is in the range of 4:1–6:1, the oil recovery fraction is the highest. At an optimal solid–liquid ratio, increasing the pH helps the carboxyl group in the glycolipid to dissociate. In an alkaline environment, the oil recovery fraction remains unchanged under a liquid–solid ratio between 4:1 and 6:1. This shows that the liquid–solid ratio does not have a significant impact on oil recovery under alkaline conditions, which is consistent with the model results.
Figure 11.
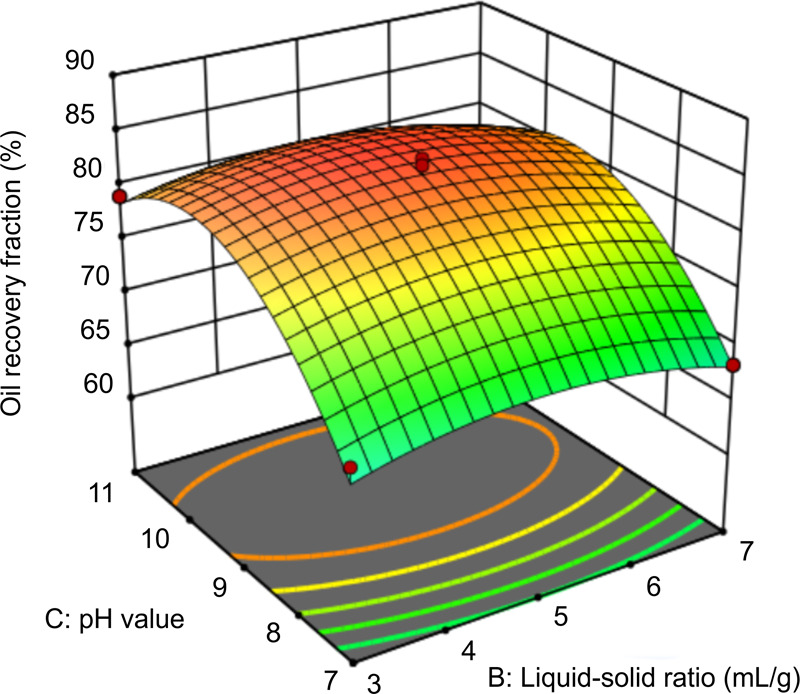
Response surface graph of the effect of pH and liquid–solid ratio on oil recovery.
Figure 12 shows the effect of the interaction of time and solid–liquid ratio on oil recovery at a dosage of 150 mg/L and pH of 9. When the time is in the range of 1.4–2.0 h and the liquid–solid ratio is in the range of 4:1–6:1, the oil recovery fraction is the highest. As the reaction time and the liquid–solid ratio increase, the contact efficiency between the rhamnolipids in the mixture and the oily sludge increases, improving oil recovery.37 However, when the liquid–solid ratio is too high, rhamnolipids are adsorbed on the surface of the solid particles of the oily sludge, which causes the desorbed oil to be re-incorporated into the solid particles, resulting in reduced oil recovery. An excessively prolonged period of time results in the formation of an oil-in-water emulsion, thereby inhibiting the separation of oil and water. In Figure 12, the lower slope of the curved surface indicates weak interaction between these two factors.
Figure 12.
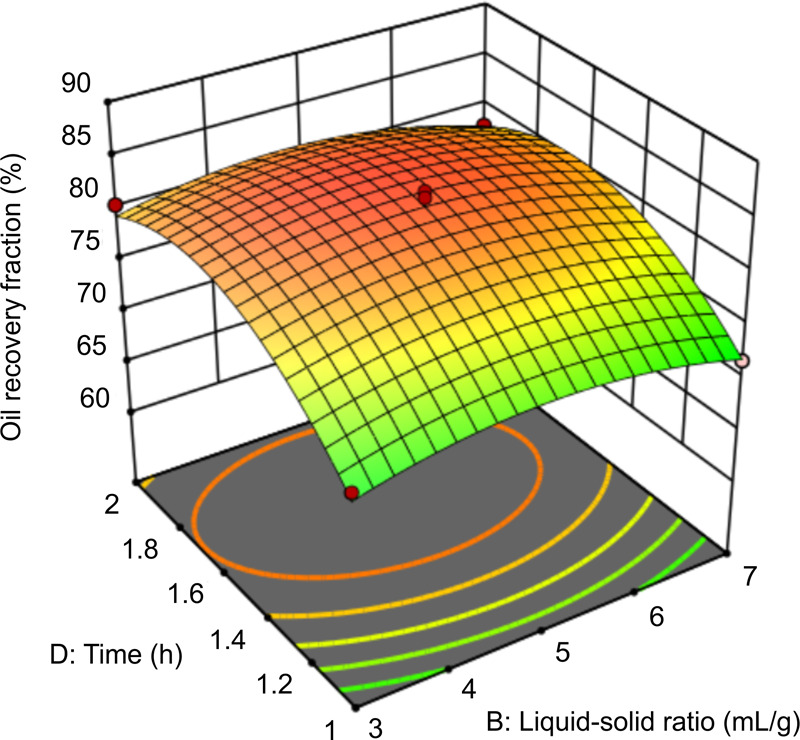
Response surface graph of the effect of time and liquid–solid ratio on oil recovery.
Figure 13 shows the effect of the interaction between time and pH at a dosage of 150 mg/L and a liquid–solid ratio of 5:1. The oil recovery fraction is the highest when pH is in the range of 8.8–10.8 and time is in the range of 1.4–2.0 h. With increasing time and pH, the amount of OH– in the mixture increases, and the carboxyl groups in rhamnolipids dissociate in the alkaline environment; thus, the solid particles and oil molecules in the oily sludge separate. However, as the pH continues to increase, there is excess OH–, which reduces oil recovery. The slope of the curved surface indicates that time and pH have a significant effect on oil recovery, which is consistent with the model results.
Figure 13.
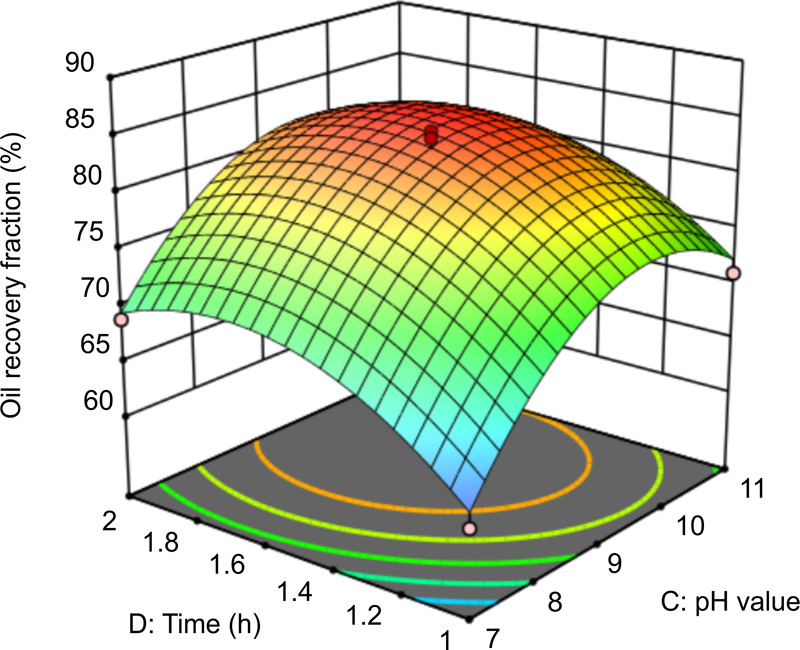
Response surface graph of the effect of time and pH on oil recovery.
3.3. Optimal Response Values
The experimental conditions of oily sludge treatment were optimized using the optimization function of the Box–Behnken response surface method. The optimal conditions for the response value (oil recovery) can be summarized as follows: dosage = 167.785 mg/L, liquid–solid ratio = 4.589:1, pH = 9.618, and time = 1.627 h. Under these conditions, the predicted oil recovery reached 85.15%. The experimental results are presented in Table 6.
Table 6. Model Reliability Verification.
| run # | A | B | C | D | response |
|---|---|---|---|---|---|
| 1 | 166.5 | 4.5 | 9.5 | 1.5 | 83.14 |
| 2 | 167.9 | 4.7 | 9.4 | 1.6 | 81.62 |
| 3 | 168.3 | 4.6 | 9.5 | 1.6 | 82.93 |
| average value | 167.6 | 4.6 | 9.5 | 1.6 | 82.56 |
According to the model reliability verification results, under the optimal test conditions, the oil recovery fraction was 82.56%, which differed from the predicted value of the response surface design only by 2.59%; the experimental results were in good agreement with the expected values. The reproducibility of the three parallel experiments was satisfactory, indicating that the response surface analysis method and model were accurate and reliable for the optimization and prediction of oil recovery from oily sludge by rhamnolipids.
3.4. PHC Fraction Analysis
When rhamnolipids were used to treat the oily sludge under the optimal test conditions, the recovery fractions F2, F3, and F4 reached 14.9, 69.3, and 13.8%, respectively (Table 7). Compared to fresh oil, recovered oil contained greater portions of F3 and F4 (28.8 and 10.4%) but lower F2 (39.9%). The results of this experiment suggest that the recovered oil can be used as a raw material for heavy oil production.
Table 7. Distribution of PHC Fractions in Recovered Oil and Fresh Oil.
| F2 | F3 | F4 | |
|---|---|---|---|
| recovered oil (%) | 14.9 | 69.1 | 13.8 |
| fresh oil (%) | 54.7 | 40.3 | 3.4 |
3.5. SEM Analysis
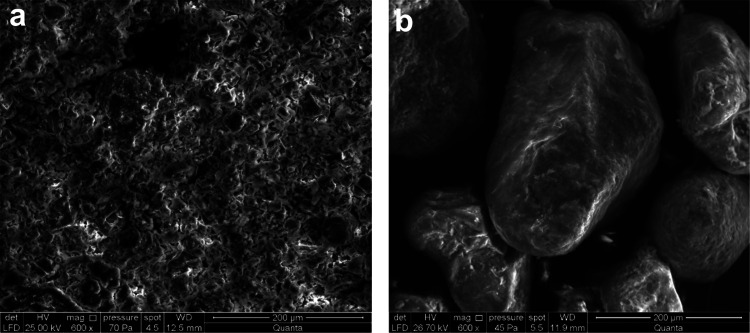
Figure 14 shows that the oily sludge exhibited a continuous structure before the rhamnolipid cleaning treatment, and oil–water–sludge exhibited a continuous phase. Rhamnolipids had a dispersed structure after cleaning, with most of them in a dispersed granular solid phase. This shows the effectiveness of using rhamnolipids to treat oily sludge and the suitability of the rhamnolipid sludge treatment method for resource utilization.
Figure 14.
Scanning electron microscopy images of sludge and residue (a: original sample 600×, b: sludge residue 600×).
4. Conclusions
The results of this study can be summarized as follows:
-
(1)
The optimal experimental range was determined for each parameter using the single-factor experiment method: dosage = 100–200 mg/L, liquid–solid ratio = 3:1–7:1, pH = 7–9, and time = 1–2 h.
-
(2)
The fitted second-order regression model was statistically significant and showed a high fitting degree; thus, it can be used to predict oil recovery from oily sludge using rhamnolipids. Through orthogonal experiments, the order of influence was obtained as follows: pH > dosage > time > liquid–solid ratio.
-
(3)
The optimal process conditions predicted by the model were as follows: dosage = 167.785 mg/L, liquid–solid ratio = 4.589:1, pH = 9.618, and time = 1.627 h. The relative error between the predicted and experimental values was 2.59%, which further demonstrates the accuracy of the quadratic polynomial model.
-
(4)
The recovered oil can be used as heavy oil. The experimental data provide a basis for future pilot projects.
Acknowledgments
The authors are grateful to Zhengjie Liu for providing assistance with the experiments and to Guangxu Yan for the valuable discussions.
Glossary
Abbreviations Used
- PHC
petroleum hydrocarbon
- SEM
scanning electron microscopy
- ANOVA
analysis of variance
Author Contributions
C.L., Q.X., and X.H. contributed to the conception of the study; C.L., S.Z., P.Z., and Q.X. performed the experiments; C.L., X.H., and Q.X. contributed significantly to the analysis and manuscript preparation; Y.Y., S.Z., Q.X., and C.L. performed the data analyses and wrote the manuscript; and P.Z., Y.Y., and X.H. helped direct the analysis with constructive discussions.
This work was supported by the National Natural Science Foundation of China (No. 21767025) and the Alar Science and Technology Project Fund of the First Division of Xinjiang Production and Construction Corps (No. 2018TF02).
The authors declare no competing financial interest.
References
- Das S.; Kuppanan N.; Channashettar V. A.; Lal B.. Remediation of Oily Sludge- and Oil-contaminated Soil from Petroleum Industry: Recent Developments and Future Prospects. In Advances in Soil Microbiology: Recent Trends and Future Prospects. Microorganisms for Sustainability; Springer, 2018; pp 165–177. [Google Scholar]
- Chen L.; Zhang X.; Sun L.; Xu H.; Si H.; Mei N. Study on the fast pyrolysis of oil sludge and its product distribution by PY-GC/MS. Energy Fuels 2016, 30, 10222–10227. 10.1021/acs.energyfuels.6b01991. [DOI] [Google Scholar]
- Hu G.; Li J.; Huang S.; Li Y. Oil recovery from petroleum sludge through ultrasonic assisted solvent extraction. J. Environ. Sci. Health, Part A 2016, 51, 921–929. 10.1080/10934529.2016.1191308. [DOI] [PubMed] [Google Scholar]
- Liang J.; Zhao L.; Hou W. Solid effect in chemical cleaning treatment of oily sludge. Colloids Surf., A 2017, 522, 38–42. 10.1016/j.colsurfa.2017.02.038. [DOI] [Google Scholar]
- Duan M.; Wang X.; Fang S.; Zhao B.; Li C.; Xiong Y. Treatment of Daqing Oily Sludge by Thermochemical Cleaning Method. Colloids Surf., A 2018, 554, 272–278. 10.1016/j.colsurfa.2018.06.046. [DOI] [Google Scholar]
- Jin Y.; Zheng X.; Chu X.; Chi Y.; Yan J.; Cen K. Oil recovery from oil sludge through combined ultrasound and thermochemical cleaning treatment. Ind. Eng. Chem. Res. 2012, 51, 9213–9217. 10.1021/ie301130c. [DOI] [Google Scholar]
- Ma Z.; Tuo C. Review: Recent development of the treatment of oily sludge in petroleum industry. Guangdong Chem. Ind. 2016, 43, 146–147. [Google Scholar]
- Zhang W. Batch Washing of saturated hydrocarbons and polycyclic aromatic hydrocarbons from crude oil contaminated soils using bio-surfactant. J. Cent. South Univ. 2015, 22, 895–903. 10.1007/s11771-015-2599-2. [DOI] [Google Scholar]
- Zhang X.; Li J.; Huang Y.; Thring R. Surfactant enhanced biodegradation of petroleum hydrocarbons in oil refinery tank bottom sludge. J. Can. Pet. Technol. 2010, 49, 34–39. 10.2118/137211-PA. [DOI] [Google Scholar]
- Lima T. M. S.; Fonseca A. F.; A. Leão B.; Mounteer A. H. M. Oil recovery from fuel oil storage tank sludge using biosurfactants. J. Biorem. Biodegrad. 2011, 02, 125. 10.4172/2155-6199.1000125. [DOI] [Google Scholar]
- Yan P.; Lu M.; Yang Q.; Zhang H. L.; Zhang Z. Z.; Chen R. Oil recovery from refinery oily sludge using a rhamnolipid biosurfactant-producing pseudomonas. Bioresour. Technol. 2012, 116, 24–28. 10.1016/j.biortech.2012.04.024. [DOI] [PubMed] [Google Scholar]
- Liu C.; Zhang Y.; Sun S.; Huang L.; Yu L.; Liu X.; Lai R.; Luo Y.; Zhang Z.; Zhang Z. Oil recovery from tank bottom sludge using rhamnolipids. J. Pet. Sci. Eng. 2018, 170, 14–20. 10.1016/j.petrol.2018.06.031. [DOI] [Google Scholar]
- Wang Y.; Guo L.; Zhang J.; She Z.; Jin C.; Gao M.; Zhao Y. Optimization of operating conditions for the acidification metabolites production with waste sludge using response surface methodology (RSM). Environ. Sci. Pollut. Res. 2019, 26, 30303–30312. 10.1007/s11356-019-06088-9. [DOI] [PubMed] [Google Scholar]
- Ji L.; Fu X.; Wang M.; Xu C.; Chen G.; Song F.; Guo S.; Zhang Q. Enzyme cocktail containing NADH regeneration system for efficient bioremediation of oil sludge contamination. Chemosphere 2019, 233, 132–139. 10.1016/j.chemosphere.2019.05.253. [DOI] [PubMed] [Google Scholar]
- Nayak M. G.; Vyas A. P. Optimization of microwave-assisted biodiesel production from papaya oil using response surface methodology. Renewable Energy 2019, 138, 18–28. 10.1016/j.renene.2019.01.054. [DOI] [Google Scholar]
- Karimifard S.; Alavi Moghaddam M. R. Application of response surface methodology in physicochemical removal of dyes from wastewater: A critical review. Sci. Total Environ. 2018, 640–641, 772–797. 10.1016/j.scitotenv.2018.05.355. [DOI] [PubMed] [Google Scholar]
- Twigg M. S.; Tripathi L.; Zompra A.; Salek K.; Irorere V. U.; Gutierrez T.; Spyroulias G. A.; Marchant R.; Banat I. M. Identification and characterisation of short chain rhamnolipid production in a previously uninvestigated, non-pathogenic marine pseudomonad. Appl. Microbiol. Biotechnol. 2018, 102, 8537–8549. 10.1007/s00253-018-9202-3. [DOI] [PMC free article] [PubMed] [Google Scholar]
- Abdel-Mawgoud A. M.; Lépine F.; Déziel E. Rhamnolipids: diversity of structures, microbial origins and roles. Appl. Microbiol. Biotechnol. 2010, 86, 1323–1336. 10.1007/s00253-010-2498-2. [DOI] [PMC free article] [PubMed] [Google Scholar]
- Zhao R.; Zhang C.; Liu B.; Wang Q.; Liu C. Recovery of crude oil from oil sludge in shengli oil field by water-assisted solvent extraction method. Oilfield Chem. 2015, 32, 132–136. [Google Scholar]
- He S.; Tan X.; Hu X.; Gao Y. Effect of ultrasound on oil recovery from crude oil containing sludge. Environ. Technol. 2019, 40, 1401–1407. 10.1080/09593330.2017.1422553. [DOI] [PubMed] [Google Scholar]
- Srinivasarao Naik B.; Mishra I. M.; Bhattacharya S. D. Biodegradation of total petroleum hydrocarbons from oily sludge. Biorem. J. 2011, 15, 140–147. 10.1080/10889868.2011.598484. [DOI] [Google Scholar]
- Zubaidy E. A. H.; Abouelnasr D. M. Fuel recovery from waste oily sludge using solvent extraction. Process Saf. Environ. Prot. 2010, 88, 318–326. 10.1016/j.psep.2010.04.001. [DOI] [Google Scholar]
- Hu G.; Li J.; Hou H. A. Combination of solvent extraction and freeze thaw for oil recovery from petroleum refinery wastewater treatment pond sludge. J. Hazard. Mater. 2015, 283, 832–840. 10.1016/j.jhazmat.2014.10.028. [DOI] [PubMed] [Google Scholar]
- Jean D. S.; Chu C. P.; Lee D. J. Freeze/thaw treatment of oily sludge from petroleum refinery plant. Sep. Sci. Technol. 2001, 36, 2733–2746. 10.1081/SS-100107222. [DOI] [Google Scholar]
- Dwivedi G.; Sharma M. P. Application of Box-Behnken design in optimization of biodiesel yield from pongamia oil and its stability analysis. Fuel 2015, 145, 256–262. 10.1016/j.fuel.2014.12.063. [DOI] [Google Scholar]
- Whang L.-M.; Liu P.-W. G.; Ma C. C.; Cheng S. S. Application of rhamnolipid and surfactin for enhanced diesel biodegradation-effects of pH and ammonium addition. J. Hazard. Mater. 2009, 164, 1045–1050. 10.1016/j.jhazmat.2008.09.006. [DOI] [PubMed] [Google Scholar]
- Zhu L.; Zhang M. Effect of rhamnolipids on the uptake of PAHs by ryegrass. Environ. Pollut. 2008, 156, 46–52. 10.1016/j.envpol.2008.01.004. [DOI] [PubMed] [Google Scholar]
- Tian Y.; McGill W. B.; Whitcombe T. W.; Li J. ionic liquid-enhanced solvent extraction for oil recovery from oily sludge. Energy Fuels 2019, 33, 3429–3438. 10.1021/acs.energyfuels.9b00224. [DOI] [Google Scholar]
- Diao P.; Liu J.; Zhang Y.; Liu J.; Yao T. Experiment on enhanced washing of oily sludge by anionic/nonionic mixed surfactant. Chem. Ind. Eng. Prog. 2014, 30, 15–17. [Google Scholar]
- Xiao N.; Zhu L.; Yang Z.; Zhang Y.; Qi M. Study on oxidation process parameters and model optimization of oil sludge. Environ. Sci. Technol. 2019, 42, 195–202. 10.19672/j.cnki.1003-6504.2019.09.029. [DOI] [Google Scholar]
- Sivagami K.; Anand D.; Divyapriya G.; Nambi I. Treatment of petroleum oil spill sludge using the combined ultrasound and fenton oxidation process. Ultrason. Sonochem. 2019, 51, 340–349. 10.1016/j.ultsonch.2018.09.007. [DOI] [PubMed] [Google Scholar]
- Gumaling R. P.; Agusan J. R.; Ellacer N. V. C. R.; Abi Abi G. M. T.; Pajaron J. R. P.; Joyno J. R. Q.; Joyno C. Q.; Ido A. L.; Arazo R. O. Increased bio-oil yield from swietenia macrophylla seeds through microwave pretreatment and ultrasonic-assisted solvent extraction. Sustainable Environ. Res. 2018, 28, 430–437. 10.1016/j.serj.2018.06.003. [DOI] [Google Scholar]
- Yu L.; Jian S.; Kai Z.; Lei G. Research on hot washing treatment process of oily sludge. Sci. Technol. Chem. Ind. 2014, 37, 962–966. 10.16664/j.cnki.issn1008-0511.2014.01.015. [DOI] [Google Scholar]
- Hongxu B.; Xin Z.; Feng Z.; Jingyi Z.; Guoqiao L.; Jiurong S.; Siqin H.; Qing L. Emulsifying activity of rhamnose lipids with different structure ratios and cleaning effect of sludge. Chin. J. Ecol. 2020, 2020, 243–251. 10.13292/j.1000-4890.202001.008. [DOI] [Google Scholar]
- Gopal K.; Sathiyagnanam A. P.; Rajesh Kumar B.; Saravanan S.; Rana D.; Sethuramasamyraja B. Prediction of emissions and performance of a diesel engine fueled with n-octanol/diesel blends using response surface methodology. J. Cleaner Prod. 2018, 184, 423–439. 10.1016/j.jclepro.2018.02.204. [DOI] [Google Scholar]
- Li J.; Han Y.; Mao G.; Wang P. Optimization of exhaust emissions from marine engine fueled with lng/diesel using response surface methodology. Energy Sources, Part A 2020, 42, 1436–1448. 10.1080/15567036.2019.1604859. [DOI] [Google Scholar]
- Liang J.; Zhao L.; Du N.; Li H.; Hou W. Solid effect in solvent extraction treatment of pre-treated oily sludge. Sep. Purif. Technol. 2014, 130, 28–33. 10.1016/j.seppur.2014.03.027. [DOI] [Google Scholar]


