Abstract
Accelerating the drainage of water in coal reservoirs can significantly improve the extraction efficiency of coalbed methane (CBM). The movement of water with different pH values in anthracite was tested and analyzed. The results showed that the electro-osmotic flow velocity increased first and then slightly decreased with the increase of time up to 120 h. The electro-osmotic flow was markedly strengthened under a strong acid (pH 2) or strong alkaline (pH 13) environment, and the direction of electro-osmosis was reversed at a pH of 3–4. The changes in zeta potential, surface groups, and minerals in anthracite were tested to analyze the mechanism of electro-osmotic characteristics. The results obtained from this work will provide a basis for the process of drainage and depressurization during the CBM extraction.
1. Introduction
Unconventional gas includes coalbed methane (CBM), shale gas, and tight sandstone gas. The efficiency of unconventional gas extraction is of great significance for the world in need of clean energy supply. The coal reservoirs contain about 36.81 × 10¹² m3 methane in China.1 However, the permeability of more than 2/3 of the coal reservoirs in China is less than 1 × 10⁻³ μm2, which seriously restricted the commercial development of CBM.2 The injection of water in coal reservoirs such as hydraulic fracturing, hydraulic punching, and hydraulic slotting is widely used for accelerating CBM. The residual fracturing water in the coal reservoir results in insensitivity problems, which decrease the efficiency of gas extraction. The electrochemical technology has been successfully applied to soft soil consolidation,3,4 mineral processing and utilization,5,6 electrokinetic remediation,7,8 and CBM extraction9,10 because of the insensitivity to pore size, uniform distribution, and direction controllability of electro-osmosis.11
Once the solid particles contact with the liquid, a double electric layer will be formed at the solid–liquid interface. When the coal is immersed in water, the ionization of functional groups including those of −COOH and −OH or the adsorption of certain ions from the water will generate a double electric layer at the interface of coal–water.12,13 When a direct current (DC) is applied, the ions in the fractured water are attracted to the electrodes with the opposite charge, dragging the surrounding free water molecules together with them. The surface of coal and soil are usually negatively charged, and the movement of purified water is toward the cathode.14
The pH value of the electrolyte influences the velocity and direction of electro-osmotic flow by changing the zeta potential of the solid–liquid interface. A high zeta potential leads to a better electro-osmotic dewatering effect with less electric energy consumption. Fuerstenau et al.13 found that the zeta potential of coal particles gradually decreased from positive to negative with the increase of pH values; the point of zero charges occurred at the pH of about 3–5. Perrin15 conducted the electro-osmosis experiments of clays with different pH values, finding that the velocity of electro-osmotic flow decreased with the decrease of pH values and the direction of electro-osmotic flow reversed at low pH values. The pH value at which electro-osmotic flow and zeta potential reversed was called the isoelectric point (IEP) when the particles were not charged and no electro-osmotic flow occurred under such condition. Given the electro-osmotic dewatering of coal, Kuh and Kim16 have studied the influence of electrochemical actions on the dewatering rate of coal slurry, finding that the zeta potential reversal occurred when the pH value was about 3. The coals used in electro-osmotic flow and dewatering were commonly fine coal particles,17,18 which was limited for the reference of electro-osmotic flow in coal seams underground.
In conclusion, the effects of pH values on the electro-osmosis in lump anthracite have not been well explained. The electro-osmotic flows with 2–13 pH conditions were tested. The zeta potential, FTIR spectroscopy, and pore characteristics of coal samples before and after electro-osmotic tests were analyzed. Meanwhile, ion migration during electro-osmotic flow was detected.
2. Results and Discussion
2.1. Influence of pH Value on the Electro-Osmotic Flow Characteristics of Lump Anthracite
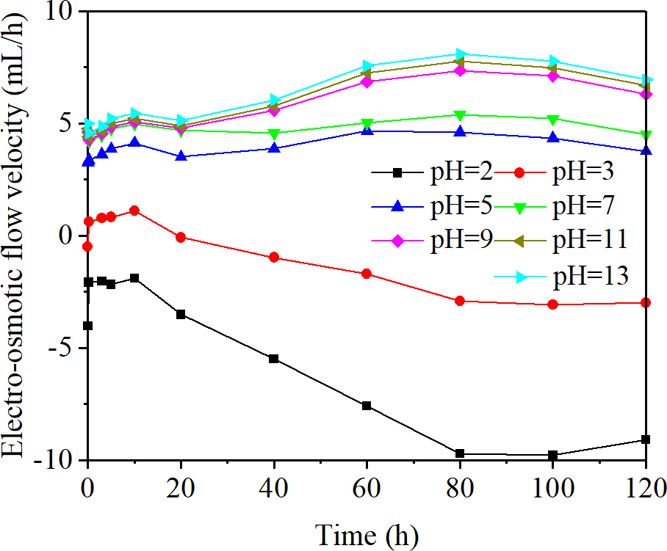
Figure 1 shows the change of electro-osmotic flow velocity with time using electrolytes of different pH values. The positive values represented that the direction of electro-osmotic flow was from the anode to the cathode, whereas the negative values represented the flow in the opposite direction. The electro-osmotic flow velocity increased first and then slightly decreased with the increase of time, reaching a maximum value at 80 h. When the pH values were between 5 and 13, the electro-osmotic flow velocities were positive, which increased with the increase of pH values. The velocity was negative when the pH value was 2, showing that the direction of electro-osmotic flow was from the cathode to the anode. Two maxima appeared when the pH values were 2 and 13, and a minimum appeared when the pH value was 3. The reason was that pH values could change the magnitude and the direction of electro-osmotic flow velocity by influencing the zeta potential of the coal–liquid interface. The electrolytic reactions accompanying the process of electro-osmotic flow could dissolve some minerals such as carbonate and sulfate, leading to the expansion of seepage channels. Besides, the decomposition of the graphite electrode plates would cause the reduction of the effective electric potential, which would also influence the electro-osmotic flow velocity.
Figure 1.
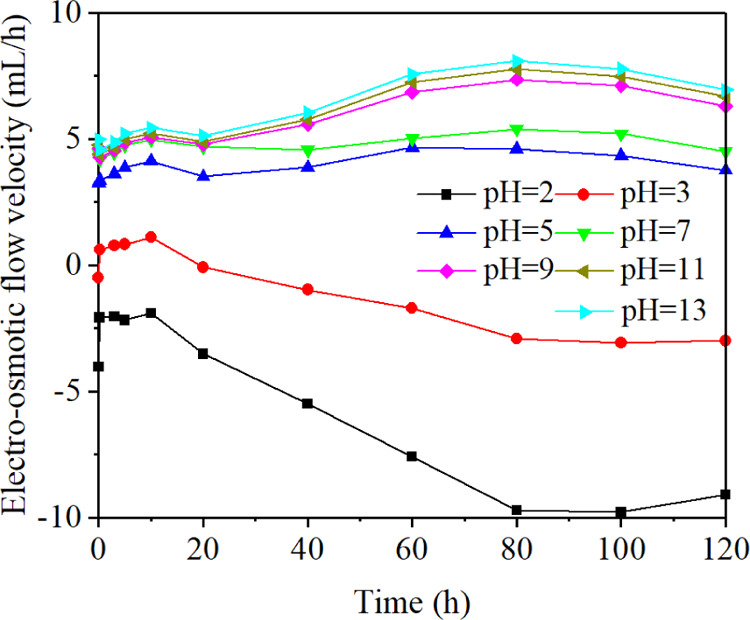
Change of electro-osmotic flow velocity with time.
Figure 2 shows the change of cumulative flow with time using electrolytes of different pH values. The cumulative flow of different pH values increased continuously during the whole experiment. The growth rate increased slowly at first and then tended to be stable gradually. After 120 h, the cumulative flow was as follows: pH 2 > pH 12 > pH 11 > pH 9 > pH 7 > pH 5 > pH 3.
Figure 2.
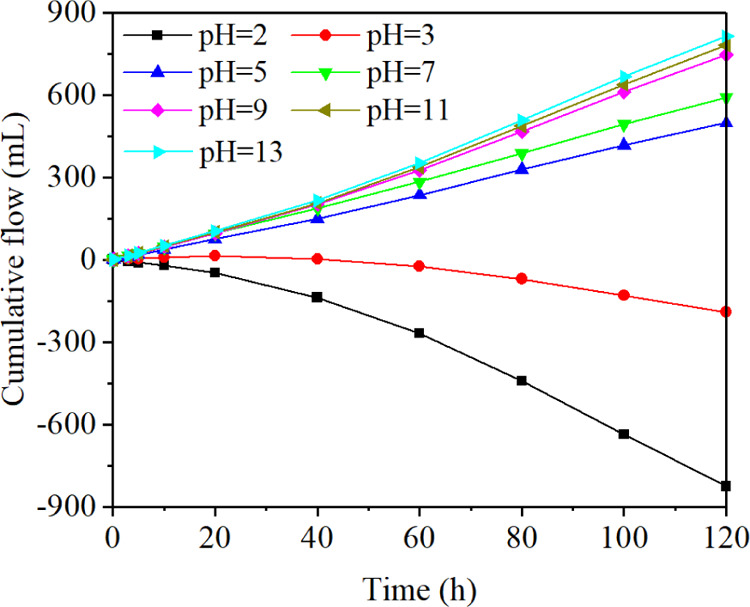
Change of cumulative flow with time.
Figure 3 shows the relationship between the cumulative flow and the pH values of the electrolytes. The cumulative flow decreases first and then increases with rising pH values. The optimal effect of electro-osmotic flow occurred when the pH value was 2 and 13, and the corresponding cumulative flow was 826 and 813 mL, respectively. The minimum of cumulative flow appeared when the pH value was 3 and only 197 mL. The direction of electro-osmotic flow was positive when pH > 4 and negative when pH < 3. The point of direction reversal occurred between pH 3 and 4, also known as the IEP or the point of zero charges.
Figure 3.
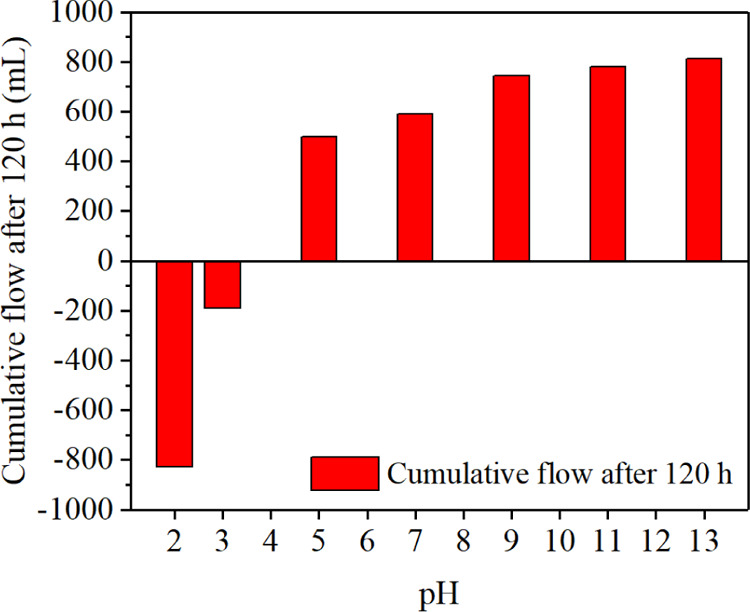
Relationship between accumulative flow and the pH values.
2.2. Effect of pH Value on Zeta Potential
Mujumdar and Yoshida found that the electrodynamics were more effective for particles with high zeta potential and high current density.19 Electrophoresis experiments were conducted to investigate the effect of pH value on the zeta potential of the solid–liquid interface. Each experiment was repeated 10 times, and the results are shown in Figure 4. As the pH value increased, the absolute value of the zeta potential decreased rapidly first and then increased sharply and finally approached stability. Two maxima (52.61 and −45.03 mV) occurred when pH values were 2 and 13, respectively. The minimum (9.97 mV) appeared when the pH value was 3. The zero points occurred at a certain point between pH 3 and 4, also known as the IEP. The zeta potential was one of the key factors to determine the electro-osmotic flow characteristics. The adsorbed hydroxide ions increased the negative charge on the coal surface, making the direction of electro-osmotic flow from the anode to the cathode. When pH < 3, the zeta potential had reversed to a positive value, and the direction of electro-osmotic flow had been changed.
Figure 4.
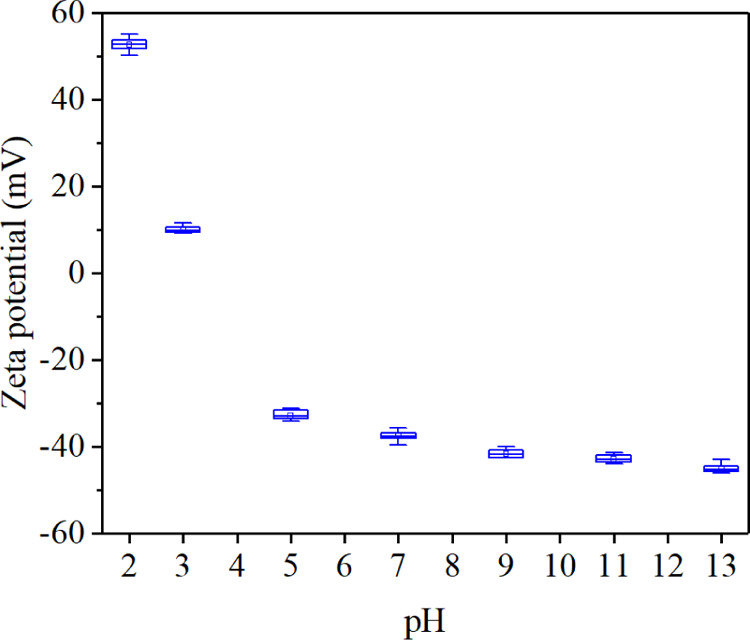
Change of zeta potential with pH value.
2.3. Change of Effective Potential
The electro-osmotic flow velocity was proportional to the product of the zeta potential and the effective potential.20Figure 5 shows the change of effective potential between the two electrodes with time when the pH value of electrolyte was 2, 7, and 11, respectively. The effective potential decreased by 8.6–16.2% within the first 0.2 h. The reason was that the gas generated by the electrochemical reactions made the contact between the electrodes and the coal samples less tight. From 0.2 to 80 h, the effective potential continuously increased, rising to 30.5, 29.0, and 29.5 V, respectively. This was mainly because the temperature of the electrolyte and coal samples increased gradually with continuous reactions. The swelling of coal samples increased the contact area between coal samples and electrodes, leading to an increase in the effective potential. From 80 to 120 h, the effective potential had decreased by 5.5, 5, and 3.5 V, respectively. This phenomenon was mainly due to the decomposition of the graphite electrodes. Observation results indicated that the influence of temperature was greater than that of the decomposition of graphite electrodes in 0.2–80 h. During 80–120 h, the dominance of the two had been exchanged.
Figure 5.
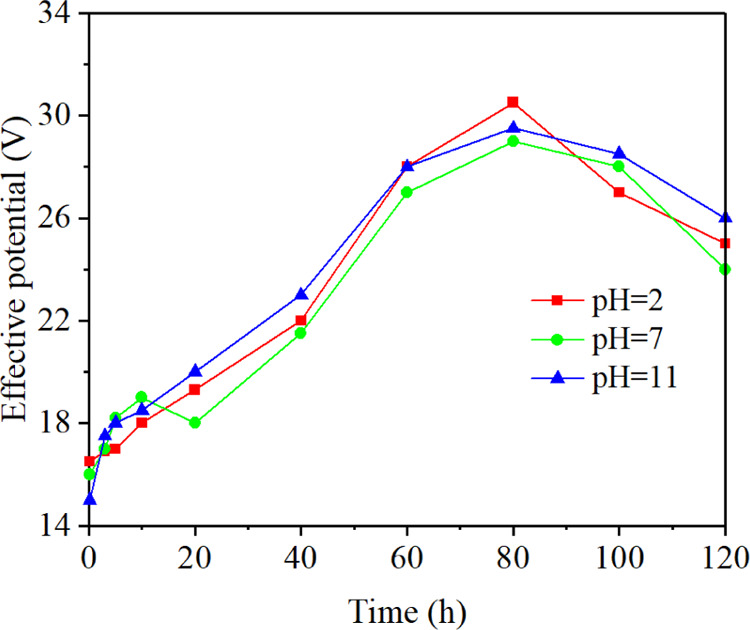
Change of effective potential with time.
2.4. Change of Pore Characteristics of Coal Samples
The pore characteristic is one of the important factors affecting the storage and migration of methane and water in anthracite. Nie et al.21 used different methods to characterize the pore structure of coal with different metamorphic degrees, finding that the optimal pore size was in the range of 1.7–300 nm, obtained by a nitrogen adsorption test. As can be seen from Figure 6 and Table 1, the total specific surface area of natural coal samples was 6.7326 m2/g and that of coal samples with pH 2, 7, and 11 were 6.6272, 6.6811, and 6.7023 m2/g, respectively. The total specific surface area of modified coal samples is smaller than that of natural coal samples. The specific surface area of modified coal samples with a pore size of less than 10 nm decreased and that of a pore size greater than 10 nm increased. The decrease of total specific surface area is caused by pores with a pore size less than 10 nm. The total pore volume of natural coal samples was 0.005035 cm3/g, and those of coal samples with pH 2, 7, and 11 were 0.005823, 0.005221, and 0.005611 cm3/g, respectively. The total pore volume of modified coal samples is larger than that of natural coal samples. The pore volume of modified coal samples with a pore size of less than 10 nm decreased and that of a pore size greater than 10 nm increased. The increase of total pore volume is caused by pores with a pore size greater than 10 nm.
Figure 6.
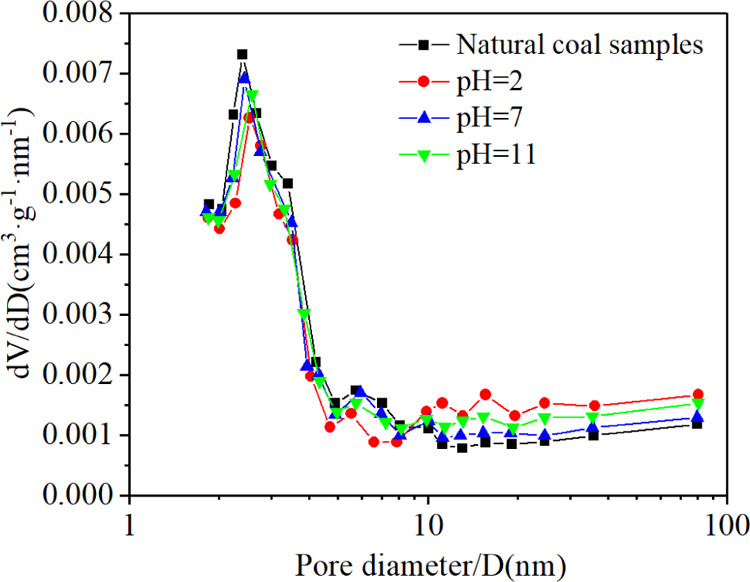
Change of pore size distribution with pH value.
Table 1. Test Results of Pore Characteristics of Coal Samples before and after Electro-Osmotic Flow.
| surface
area (m2/g) |
pore volume (cm3/g) |
||||||||
|---|---|---|---|---|---|---|---|---|---|
| samples | average pore diameter (nm) | <10 nm | 10–100 nm | >100 nm | total | <10 nm | 10–100 nm | >100 nm | total |
| nature coal | 2.7745 | 6.3556 | 0.2349 | 0.1421 | 6.7326 | 0.002899 | 0.001267 | 0.000869 | 0.005035 |
| pH 2 | 3.1052 | 6.1455 | 0.3258 | 0.1558 | 6.6272 | 0.002089 | 0.001873 | 0.001861 | 0.005823 |
| pH 7 | 2.8250 | 6.2140 | 0.2794 | 0.1877 | 6.6811 | 0.002687 | 0.001511 | 0.001023 | 0.005221 |
| pH 11 | 2.9203 | 6.2868 | 0.2653 | 0.1502 | 6.7023 | 0.002273 | 0.001745 | 0.001593 | 0.005611 |
The above test results show that the pore volume with a pore size of less than 10 nm of the coal samples treated with electrolytes of different pH values decreases and those with pore size greater than 10 nm increase, resulting in the decrease of total specific surface area and the increase of total pore volume. The change of pore characteristics of coal samples treated with electrolytes with different pH values is due to the dissolution of minerals in coal samples by the effect of acid (H+) or alkali (OH–). The H+ generated by anodic electrolysis and the H+ existing in the acidic electrolyte would dissolve the carbonate and sulfate minerals in the coal samples.22,23 The OH– generated by cathodic electrolysis and the OH– existing in the alkaline electrolyte would dissolve clay minerals.24
2.5. Ion Migration
The cations will drag the water molecules surrounding them to move directionally when subjected to the electric field force. If the solid particles dispersed in the liquid are electronegative, the cations are dominant in the electric double layer, indicating that there are more water molecules transferred by cations than anions. From a macro perspective, a net seepage occurs in the direction of cationic transference.25,26 If the pH value of the electrolytes changes, especially when it becomes very high or low, some ions will be dispersed or moved.
Figure 7 shows the change of Na+ concentration with time when the pH value was 2, 7, and 11, respectively. The Na+ concentration increased to varying degrees with time. After about 25 h, the concentration was pH 2 > pH 11 > pH 7. At the end of the experiment, the concentration of Na+ increased by 1.10, 0.48, and 0.26%, respectively. There were two main sources of Na+, one from the electrolyte and the other from the minerals in the coal samples. The chemical reactions would occur between some minerals and H+ or OH– when the electrolyte was acidic or alkaline, leading to an increase of the Na+ concentration. An increase of Na+ concentration would cause an increase of the electro-osmotic flow velocity to a certain extent by comparing Figures 7 and 1.
Figure 7.
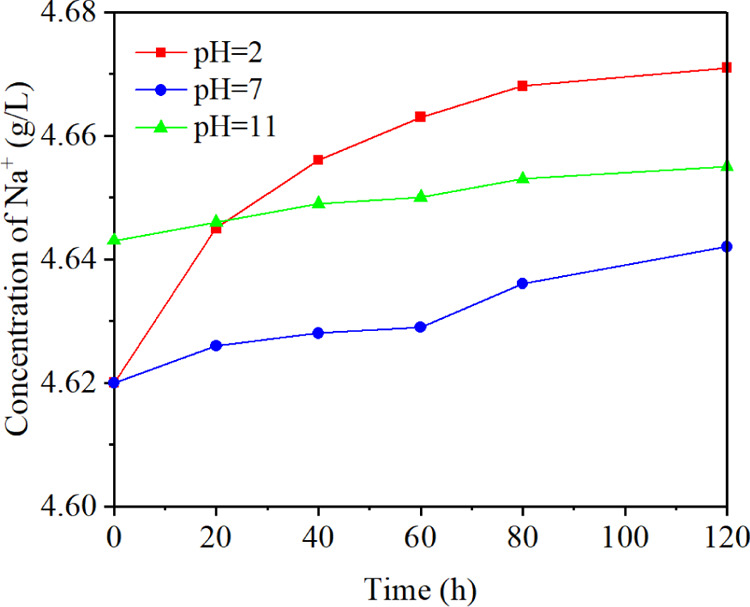
Change of concentration of Na+ with time.
Figure 8 shows the concentration increment of specific ions when the pH values were 2, 7, and 11, respectively. The chemical reactions were more likely to occur in an acidic environment, resulting in the increment of Na+, Ca2+, Al3+, and Fe3+ in an acidic environment greater than that in an alkaline environment. The electro-osmotic flow relies on the transfer of water molecules by small atomic weight counter ions with low and medium valences,27 such as H+, Na+, and Ca2+. Although high atomic weight ions with high valences are not easy to move because they have strong electrostatic attractions with the coal surface, they have little contribution to the electro-osmotic flow.28,29
Figure 8.
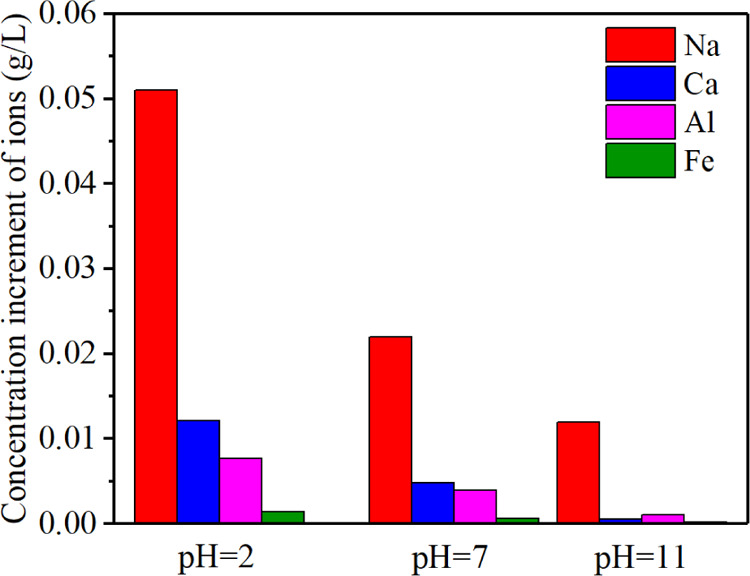
Concentration increment of specific ions after the electro-osmotic flow experiment.
2.6. Change of Conductivity of the Electrolyte
Besides, the conductivity of the electrolyte also played an important role.30 The conductivity reflects the electrical conduction ability of the liquid and the solid particles scattered in it. Figure 9 shows the change of the conductivity of the electrolyte with time when the pH value was 2, 7, and 11, respectively. The conductivity increased to a certain extent with time, and the growth rate gradually slowed down. The reason was that the H+ and OH– generated by the electrolytic reactions gradually increased. Besides, the fine coal particles, mineral particles falling off from the lump coal, and ions precipitating from the minerals would also influence the conductivity of the electrolyte. In the beginning, the conductivity was pH 11 > pH 2 > pH 7. With the occurrence of the electrolytic reactions, the conductivity of the electrolyte with a pH value of 2 increased the most, with an increase of 111.86% at the end of the experiment. However, the conductivity only increased by 37.96 and 27.08% when the pH value was 7 and 11, respectively. Compared with the alkaline environment, the coal samples were more easily corroded by the acid environment. As a result, more particles and ions were produced in the acid environment. The changing law of conductivity was in good agreement with the changing law of electro-osmotic flow velocity in most of the experiment time by comparing Figures 9 and 1.
Figure 9.
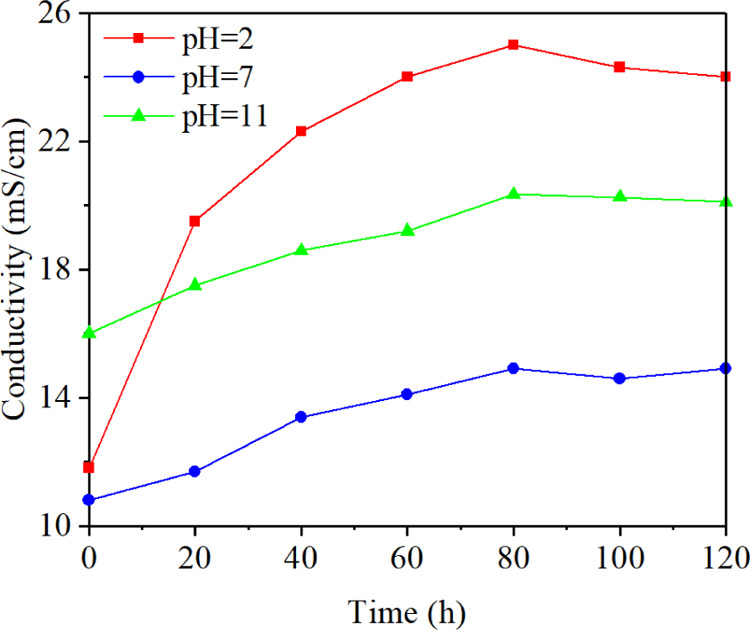
Change of conductivity of the electrolyte with time.
2.7. Change of Surface Groups of Coal Samples and Minerals in Coal Samples
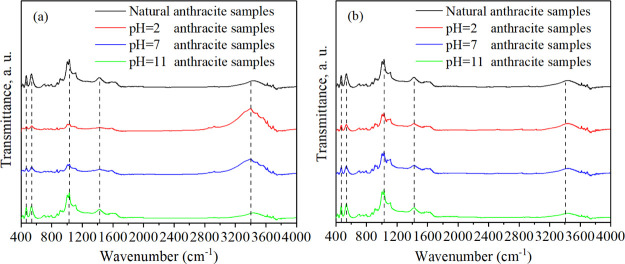
The surface groups can reflect the surface characteristics such as surface electrical property31 of coal, which affect the adsorption and desorption of methane and the migration of water in anthracite. Figure 10 shows the FTIR results of unmodified coal samples and modified coal samples. As can be seen from Figure 10, the zones of 400–700, 1000–1200, 1300–1500, and 3200–3500 cm–1 showed the most marked differences for the studied coal samples. The peaks near 460 and 540 cm–1 can be identified as the vibration of S–H and S–S, respectively. The wavenumber of 1030 cm–1 corresponds to the stretching vibration of Si–O–Si and Si–O–C. The peak near 1430 cm–1 is attributed to the antisymmetric stretching vibration of carbonate and the bending vibration of CH3. The peak near 3400 cm–1 corresponds to the stretching vibration of hydroxyl (−OH), phenolic hydroxyl, and so on. When the pH values were 2 and 7, the peaks near 460, 540, 1030 and 1430 cm–1 of modified coal samples decreased significantly in the anode zone, and there was little change in the cathode zone. The peaks near 3400 cm–1 of modified coal samples increased notably in the anode zone, and there was little change in the cathode zone. When the pH value was 11, the peaks of modified coal samples in anode and cathode zones showed no obvious change near 460, 540, 1030, and 1430 cm–1 and slightly decreased near 3400 cm–1. The changes of the peaks of modified coal samples are caused by the existence of H+ or OH– in electrolyte with different pH values. The H+ produced by anodic electrolysis and contained in acid electrolyte dissolved many minerals such as montmorillonite, sulfate, silicate, and carbonate and increased acidic functional groups such as phenolic hydroxyl. The OH– produced by cathodic electrolysis and contained in alkaline electrolyte reduced acidic functional groups.
Figure 10.
FTIR spectra of anthracite samples before and after electro-osmotic flow. (a) Anode zone. (b) Cathode zone.
3. Application and Significance
The water drainage and depressurization are important processes during CBM extraction. The Na2SO4 electrolyte can be injected into the coal seam as an additive of the hydraulic fracturing fluid. After fracturing, the residual water in the coal seam can be removed by electro-osmotic flow, which can greatly improve the water and gas drainage in coal seams. The electro-osmotic flow characteristics can be changed by the types, pH values, and concentrations of electrolytes. Guo et al.32 proposed a technology of the in-situ electrochemical method for enhancing CBM extraction. The electro-osmotic flow phenomena and electrophoretic phenomena occurred simultaneously. The water drove the gas to move directionally toward the bottom of the production well under the action of electro-osmotic flow. The coal and rock particles migrated toward the wellhead of the injection well under the action of electrophoresis, which can remove the obstacle of the water and the gas seepage channels. Therefore, in the field of engineering applications, the electrochemical method can be used to discharge a large amount of water directionally to reduce reservoir pressure and relieve the water lock effect, which is of great significance to enhance the extraction of CBM.
The existence of electrokinetic remediation makes it possible to reduce the environmental damage caused by electrolytes. Some researchers use electrokinetic remediation to remove the contaminant in the soil. Zhou et al.33 investigated the cadmium-contaminated kaolin by a new-style electrokinetic method and found that most of the exchangeable Cd fraction could be removed effectively. Suanon et al.34 reported the electrokinetic remediation method by using surfactant Triton X-100 as an effective cosolvent for organochlorine pesticide removal from the contaminated soil. As time goes on, Na+, SO42–, H+, OH–, and other harmful ions involved in this paper can be removed by electrokinetic remediation, which has little impact on groundwater. Besides, the electrokinetic behavior improved the directional migration of water, gas, coal, and rock particles, so it could reduce the possibility of coal and gas outburst.35 In summary, electro-osmotic flow is a kind of environmental friendly method with a great application prospect.
4. Conclusions
-
(1)
The electro-osmotic flow velocity increased first and then slightly decreased with the increase of time. The main reason was that the electrochemical reactions increased the size of medium and small pores in coal samples. Besides, the decrease of effective potential caused by the decomposition of graphite electrode plates made the electro-osmotic flow velocity decrease slightly after 80 h.
-
(2)
The cumulative flow increased continuously with the increase of time. The growth rate increased slowly at first and then tended to be stable. Two maxima appeared in a strong acid (pH 2) and a strong alkaline (pH 13) environment, and a minimum appeared when the pH value was 3. The reason was that pH values could influence the electro-osmotic flow by changing the zeta potential of the coal–liquid interface.
-
(3)
The direction of electro-osmotic flow was positive when pH > 4 and negative when pH < 3. The point of direction reversal occurred between pH 3 and 4, also known as the IEP or the point of zero charge.
-
(4)
The migration of ions, the change of the conductivities of the electrolytes, the increase of acid groups on the coal surface caused by oxidation, and the change of pore characteristics caused by dissolution of minerals would also influence the effect of the electro-osmotic flow.
5. Experimental Section
5.1. Sample Preparation
The anthracite samples prepared for the electro-osmotic flow experiments were obtained from the 15303 working face of Sihe coal mine of the Qinshui coalfield, Shanxi Province of China. All the samples were selected manually and sealed with plastic wrap underground and sent to the laboratory as soon as possible to avoid the physicochemical change due to air oxidation. The mean maximum vitrinite reflectance (Ro,max) and the maceral composition of the anthracite samples were measured following the standards of GB/T 6948–2008 and GB/T 8899–2013, respectively. The proximate analysis, which including moisture, ash, and volatile matter content, was conducted following the GB/T 212–2008 standard. The chemical composition and the elemental composition of coal samples were also conducted following the standards of GB/T 1574–2007 and GB/T 476–2001. The analysis results were listed in Tables 2 and 3.
Table 2. Petrologic Characteristics, Elemental Composition, and Proximate Analysis of Coal Samples.
| proximate
analysis (wt %) |
ultimate analysis (%) |
maceral groups (vol %) |
|||||||||
|---|---|---|---|---|---|---|---|---|---|---|---|
| samples | Ro,max (%) | moisture | ash yield | volatile matter | C | H | O | S | vitrinite | inertinite | liptinite |
| Anthracite | 2.86 | 1.65 | 5.21 | 6.12 | 86.52 | 2.64 | 6.83 | 3.32 | 86.3 | 13.7 | 0.0 |
Table 3. Chemical Composition Analysis of Coal Samples.
| chemical composition (wt %) |
|||||||||
|---|---|---|---|---|---|---|---|---|---|
| samples | SiO2 | Al2O3 | CaO | Fe2O3 | SO3 | MgO | TiO2 | Na2O | P2O5 |
| Anthracite | 24.8 | 22.14 | 11.87 | 26.27 | 10.81 | 0.9 | 0.09 | 0.19 | 0.13 |
5.2. Experimental Apparatus
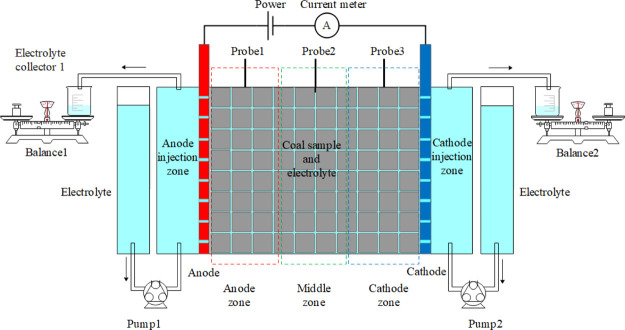
The experimental apparatus for electro-osmotic flow tests is shown in Figure 11. The apparatus is mainly composed of an electrolyzer with a top cover, a DC power, an ammeter, two porous graphite electrode plates, two peristaltic pumps, three potential probes, and two electrolyte collectors. The electrolyzer is made of Plexiglas plates with good electrical insulation, light transmittance, and corrosion resistance. The thickness of Plexiglas plates is 5 mm and the internal dimensions are 150 mm long × 60 mm wide × 80 mm high. The electrolyzer is divided into an electrolytic zone, an anode injection zone, and a cathode injection zone. The electrolytic zone is divided into the anode zone, the middle zone, and the cathode zone according to the distance between the two electrodes. The dimensions of the porous graphite electrode plates are 100 mm high, 60 mm wide, and 5 mm thick. The DC power is supplied by DH1722A-2 produced by Dahua Radio Instrument Factory, the output voltage range is 0 – 110 V, and the output current is 0–3 A. The multimeter is provided by PM18 produced by Huayi Instrument Factory. The copper probes with good electrical conductivity and thermal conductivity are selected to monitor the electric potential and temperature changes in different regions.
Figure 11.
Schematic of the electro-osmotic flow apparatus.
5.3. Experimental Process
The 0.1 mol/L Na2SO4 solution was selected as the electrolyte when pH is 7.22,36 The pH values of other electrolytes were adjusted to 2, 3, 5, 7, 9, 11, and 13 using H2SO4 or NaOH solution with the appropriate concentration respectively. The potential gradient was set to 4 V/cm, and the electro-osmotic flow time was 120 h.23
Before the experiment, the anthracite samples with a total mass of 3.5 kg and a particle size of 1 cm3 were dried to constant weight in a vacuum oven of 373.15–378.15 K. Anthracite samples were put into the electrolyzer as shown in Figure 11 and were fully saturated in the electrolyte with a pH value of 2 for more than 24 h. Two pumps with the same flow rate were used to inject the electrolyte continuously, making the coal samples maintain the saturation state. The anode electrolyte collector and the cathode collector were weighed previously and then weighed again at a time interval of 0.2 h. Meanwhile, the electric potential and temperature of the electrolyte of the anode zone, the middle zone, and the cathode zone were recorded, respectively. The value of the ammeter was also recorded, and an appropriate amount of electrolyte was taken from the anode electrolyte collector and the cathode collector for the element concentration test. After 120 h, the power was cut off, and the coal samples were dried again. The remaining six experiments were repeated in the same way.
The test of pore volume, average pore diameter, and specific surface area of coal samples before and after the electro-osmotic flow experiment were analyzed by the ASAP2020HD88 nitrogen adsorption–desorption apparatus produced by Micromeritics company.
The test of zeta potential of coal samples was conducted with a JS94H micro-electrophoresis instrument produced by Powereach company. The pH range of the instrument was 1.6–13.0, and the switching time was 700 ms.
The test of concentration of Na+, Ca2+, Al3+, and Fe3+ of the electrolytes discharged from the anode zone and the cathode zone was analyzed by the ICP-MS 7500A inductively coupled plasma mass spectrometer produced by Agilent company.
The test of surface functional groups of coal samples was conducted by the Nicolet iS5 FTIR instrument produced by the Thermo Fisher company. The collected spectral range of the instrument has a wavenumber range of 400–4000 cm–1. Before the test, the fine coal samples were dried for 12 h to eliminate the interference of moisture. The samples and potassium bromide (KBr) were tableted in a ratio of 1:150 wt %.
Acknowledgments
This research was supported financially by the National Natural Science Foundation of China (U1810102 and 41902179).
The authors declare no competing financial interest.
Notes
The data used to support the findings of this study are available from the corresponding author upon request.
References
- Liu C.; Che C.; Zhu J.; Yang H.; Fan M. Methodologies and results of the latest assessment of coalbed methane resources in China. Nat. Gas. Ind. 2009, 29, 130–132. [Google Scholar]
- Meng S.; Hou Q. Experimental research on stress sensitivity of coal reservoir and its influencing factors. J. China Coal Soc. 2012, 37, 430–437. [Google Scholar]
- Su J. Q.; Wang Z. The two-dimensional consolidation theory of electro-osmosis. Geotechnique 2003, 53, 759–763. 10.1680/geot.2003.53.8.759. [DOI] [Google Scholar]
- Burnotte F.; Lefebvre G.; Grondin G. A case record of electroosmotic consolidation of soft clay with improved soil electrode contact. Can. Geotech. J. 2004, 41, 1038–1053. 10.1139/t04-045. [DOI] [Google Scholar]
- Dong Y.; Li H.; Fan Y.; Ma X.; Sun D.; Wang Y.; Gao Z.; Dong X. Tunable dewatering behavior of montmorillonite suspension by adjusting solution pH and electrolyte concentration. Minerals 2020, 10, 293. 10.3390/min10040293. [DOI] [Google Scholar]
- Li J. S.; Wang D.; Kang G. X.; Kang T. H. Mechanism and effect of electrochemical modification on physicochemical soft rock. Adv. Mater. Res. 2011, 415-417, 2275–2280. 10.4028/www.scientific.net/amr.415-417.2275. [DOI] [Google Scholar]
- Ma D.; Su M.; Qian J.; Wang Q.; Meng F.; Ge X.; Ye Y.; Song C. Heavy metal removal from sewage sludge under citric acid and electroosmotic leaching processes. Sep. Purif. Technol. 2020, 242, 116822. 10.1016/j.seppur.2020.116822. [DOI] [Google Scholar]
- Chen F.; Li X.; Ma J.; Qu J.; Yang Y.; Zhang S. Remediation of soil co-contaminated with decabromodiphenyl ether (BDE-209) and copper by enhanced electrokinetics-persulfate process. J. Hazard. Mater. 2019, 369, 448–455. 10.1016/j.jhazmat.2019.02.043. [DOI] [PubMed] [Google Scholar]
- Zhang X.; Zhang R.; Kang T.; Hu Y. The adsorption and desorption behavior of CH4 on Jincheng anthracite modified in Fe3+ and Cu2+ ion electrolytes. Energy Fuels 2020, 34, 1251–1258. 10.1021/acs.energyfuels.9b02622. [DOI] [Google Scholar]
- Guo J.; Kang T.; Kang J.; Chai Z.; Zhao G. Accelerating methane desorption in lump anthracite modified by electrochemical treatment. Int. J. Coal Geol. 2014, 131, 392–399. 10.1016/j.coal.2014.06.011. [DOI] [Google Scholar]
- Shapiro A. P.; Probstein R. F. Removal of contaminants from saturated clay by electroosmosis. Environ. Sci. Technol. 1993, 27, 283–291. 10.1021/es00039a007. [DOI] [Google Scholar]
- Malekzadeh M.; Lovisa J.; Sivakugan N. An overview of electrokinetic consolidation of soils. Geotech. Geol. Eng. 2016, 34, 759–776. 10.1007/s10706-016-0002-1. [DOI] [Google Scholar]
- Fuerstenau D. W.; Rosenbaum J. M.; You Y. S. Electrokinetic behavior of coal. Energy Fuels 1988, 2, 241–245. 10.1021/ef00009a002. [DOI] [Google Scholar]
- Kaniraj S. R.; Huong H. L.; Yee J. H. S. Electro-osmotic consolidation studies on peat and clayey silt using electric vertical drain. Geotech. Geol. Eng. 2011, 29, 277–295. 10.1007/s10706-010-9375-8. [DOI] [Google Scholar]
- Perrin J. Mécanisme de l’électrisation de contact et solutions colloïdales. J. Chim. Phys. 1904, 2, 601–651. 10.1051/jcp/1904020601. [DOI] [Google Scholar]
- Kuh S.-E.; Kim D.-S. Effects of surface chemical and electrochemical factors on the dewatering characteristics of fine particle slurry. J. Environ. Health Sci. 2004, 39, 2157–2182. 10.1081/ese-120039382. [DOI] [PubMed] [Google Scholar]
- Chen H.; Mujumdar A. S.; Ragbaran G. S. V. Laboratory experiments on electroosmotic dewatering of vegetable sludge and mine tailings. Dry. Technol. 1996, 14, 2435–2445. 10.1080/07373939608917215. [DOI] [Google Scholar]
- Dong X. S.; Feng L. H.; Yao S. L.; Niu D. F. Study on dewatering of fine coal by combination of electrolysis and filtration. Adv. Mater. Res. 2011, 236-238, 622–626. 10.4028/www.scientific.net/amr.236-238.622. [DOI] [Google Scholar]
- Mujumdar A.; Yoshida H.. Electro-osmotic dewatering (EOD) of bio-materials. In Electrotechnologies for Extraction from Food Plants and Biomaterials; Food Engineering Series; Vorobiev, Eugene; Lebovka N., Ed.; Springer: New York, 2009; pp 121–154. [Google Scholar]
- Rathore A. S. Theory of electroosmotic flow, retention and separation efficiency in capillary electrochromatography. Electrophoresis 2002, 23, 3827–3846. 10.1002/elps.200290004. [DOI] [PubMed] [Google Scholar]
- Nie B.; Lun J.; Wang K.; Shen J. Three-dimensional characterization of open and closed coal nanopores based on a multi-scale analysis including CO2 adsorption, mercury intrusion, low-temperature nitrogen adsorption, and small-angle X-ray scattering. Energy Sci. Eng. 2020, 8, 2086–2099. 10.1002/ese3.649. [DOI] [Google Scholar]
- Zhang X.; Zhang R.; Kang T.; Hu Y.; Li C. Experimental and mechanistic research on methane adsorption in anthracite modified by electrochemical treatment using selected electrode materials. Sci. Rep. 2019, 9, 1–12. 10.1038/s41598-019-53840-9. [DOI] [PMC free article] [PubMed] [Google Scholar]
- Zhang X.; Kang T.; Hou M.; Kang J.; Guo J.; Li L.; Zhang R.; Hu Y. Experimental research on the effects of electrode materials on methane adsorption and desorption in anthracite modified by electrochemical treatment. Chin. J. Geophys. 2020, 63, 2466–2477. [Google Scholar]
- Zhou Y.; Zhang R.; Huang J.; Li Z.; Zhao Z.; Zeng Z. Effects of pore structure and methane adsorption in coal with alkaline treatment. Fuel 2019, 254, 115600. 10.1016/j.fuel.2019.06.008. [DOI] [Google Scholar]
- Gray D. H.; Mitchell J. K. Fundamental aspects of electro-osmosis in soils. J. Soil Mech. Found Div. 1967, 93, 209–236. [Google Scholar]
- Peng J.; Ye H.; Alshawabkeh A. N. Soil improvement by electroosmotic grouting of saline solutions with vacuum drainage at the cathode. Appl. Clay Sci. 2015, 114, 53–60. 10.1016/j.clay.2015.05.012. [DOI] [Google Scholar]
- Tao Y.; Zhou J.; Gong X.; Luo Z. Experimental study on the electrokinetic migration process of Hangzhou sludge. Dry. Technol. 2020, 38, 1332–1339. 10.1080/07373937.2019.1636062. [DOI] [Google Scholar]
- Tao Y.; Zhou J.; Gong X.; Hu P. Electro-osmotic dehydration of Hangzhou sludge with selected electrode arrangements. Dry. Technol. 2016, 34, 66–75. 10.1080/07373937.2015.1006369. [DOI] [Google Scholar]
- Zhou J.; Tao Y.; Li C.; Gong X. Experimental study of electro-kinetic dewatering of silt based on the electro-osmotic coefficient. Environ. Eng. Sci. 2019, 36, 739–748. 10.1089/ees.2018.0458. [DOI] [Google Scholar]
- Lockhart N. C. Electroosmotic dewatering of clays. II. Influence of salt, acid and flocculants. Colloid. Surface. 1983, 6, 239–251. 10.1016/0166-6622(83)80016-x. [DOI] [Google Scholar]
- He X.; Liu X.; Song D.; Nie B. Effect of microstructure on electrical property of coal surface. Appl. Surf. Sci. 2019, 483, 713–720. 10.1016/j.apsusc.2019.03.342. [DOI] [Google Scholar]
- Guo J.; Kang T.; Kang J.; Zhang H.; Chai Z.; Zhang B.; Zhang X. Research progress of electrokinetic dynamics of rock and fluid. Chin. J. Rock Mech. Eng. 2019, 38, 511–526. [Google Scholar]
- Zhou H.; Xu J.; Lv S.; Liu Z.; Liu W. Removal of cadmium in contaminated kaolin by new-style electrokinetic remediation using array electrodes coupled with permeable reactive barrier. Sep. Purif. Technol. 2020, 239, 116544. 10.1016/j.seppur.2020.116544. [DOI] [Google Scholar]
- Suanon F.; Tang L.; Sheng H.; Fu Y.; Xiang L.; Wang Z.; Shao X.; Mama D.; Jiang X.; Wang F. Organochlorine pesticides contaminated soil decontamination using TritonX-100-enhanced advanced oxidation under electrokinetic remediation. J. Hazard. Mater. 2020, 393, 122388. 10.1016/j.jhazmat.2020.122388. [DOI] [PubMed] [Google Scholar]
- Ma Y.-k.; Nie B.-s.; He X.-q.; Li X.-c.; Meng J.-q.; Song D.-z. Mechanism investigation on coal and gas outburst: An overview. Int. J. Miner., Metall. Mater. 2020, 27, 872–887. 10.1007/s12613-019-1956-9. [DOI] [Google Scholar]
- Guo J.; Kang T.; Kang J.; Zhao G.; Huang Z. Effect of the lump size on methane desorption from anthracite. J. Nat. Gas Sci. Eng. 2014, 20, 337–346. 10.1016/j.jngse.2014.07.019. [DOI] [Google Scholar]


