

Abstract
S100 family members are frequently deregulated in human malignancies, including ovarian cancer. However, the prognostic roles of each individual S100 family member in ovarian cancer (OC) patients remain elusive. In the present study, we assessed the prognostic roles and molecular function of 20 individual members of the S100 family in OC patients using GEPIA, Kaplan–Meier plotter, SurvExpress, GeneMANIA and Funrich database. Our results indicated that the mRNA expression levels of S100A1, S100A2, S100A4, S100A5, S100A11, S100A14, and S100A16 were significantly upregulated in patients with OC, and high mRNA expression of S100A1, S100A3, S100A5, S100A6, and S100A13 were significantly correlated with better overall survival, while increased S100A2, S100A7A, S100A10, and S100A11 mRNA expressions were associated with worse prognosis in OC patients. In stratified analysis, the trends of high expression of individual S100 members were nearly the same in different pathological grade, clinical stage, TP53 mutation status, and treatment. More importantly, S100 family signatures may be useful potential prognostic markers for OC. These findings suggest that S100 family plays a vital role in prognostic value and could potentially be an S100-targeted inhibitors for OC patients.
Keywords: Kaplan–Meier plotter, ovarian cancer, prognosis, S100 family, signature
1. Introduction
Ovarian cancer (OC) is the most common cause of cancer-related death among gynecological malignancies, and causes approximately 13,980 deaths annually worldwide.[1,2] During the past decade, there has been little improvement in survival rates of OC, due to the lack of specific symptoms and effective biomarkers. Over 75% of patients are not diagnosed until the disease is advanced (stages III and IV), and the 5-year survival rate is less than 30%.[3,4] Although cytoreductive surgery and platinum-based chemotherapy are applied routinely, most cases acquire platinum resistance and the disease progresses rapidly, with patients having poor long-term survival.[5] Many prognostic factors have been investigated in an attempt to better estimate outcomes in OC patients. Among them, FIGO stage, patient age, residual tumor after initial surgery, lymph node metastasis, vascular invasion, and cancer antigen 125 are consistently reported as important prognostic factors. However, testing these factors is time consuming and carries a steep cost, and they may have insufficient specificity or sensitivity for specific OC, which limits their extensive application in clinical settings.[4,6] It can also be difficult to obtain adequate tumor sample to perform prognostic analyses. Therefore, identification of more effective and minimally invasive prognostic markers is a matter of great clinical urgency for OC patients.
The S100 protein family, which comprises more than 20 known members in humans, is the largest subfamily of calcium-binding proteins of the EF-hand type, of which the first member was discovered in 1965.[7] Twenty-two of the S100 coding genes are clustered at chromosome locus 1q21, a region prone to chromosomal rearrangements and frequently rearranged in cancers.[8] There is growing evidence that deregulation of S100 expression is a common occurrence in several human malignancies, and previous reports demonstrate that S100 expression is associated with tumorigenesis and tumor progression, such as in head and neck cancer,[9,10] lung cancer,[11,12] breast cancer,[13–15] pancreatic cancer,[16,17] prostate cancer,[14,16,17] renal cancer,[18] cervical cancer,[19] gastric cancer[20] and OC.[21–25] These proteins are considered to have potential value as novel biomarkers in the detection and prediction of many kinds of tumors. Although the role of the majority of S100 family proteins has not been reported in OC, several S100 family members (S100A2, S100A4, S100A7, S100A10, and S100A11) have been shown to be related to poor prognosis in different studies.[23–25] However, the prognostic roles and molecular function of each individual S100 family member in OC, especially at the mRNA level, have not been determined.
In the current study, we assessed the expression patterns, prognostic roles and molecular function of each individual member of the S100 family in human OC patients using integrative bioinformatics analysis. The analysis process involves a series of databases such as the GEPIA, Kaplan–Meier plotter, SurvExpress, GeneMANIA and Funrich database. The results will help to provide perspectives on new biomarkers for predicting the prognosis of OC, and highlight the noteworthy S100-targeted inhibitors for OC treatment.
2. Materials and methods
2.1. Ethics approval and consent to participate
This study was approved by the Academic Committee of the People's Hospital of China Three Gorges University, and conducted according to the principles expressed in the Declaration of Helsinki. All the datasets were retrieved from the publishing literature, so it was confirmed that all written informed consent was obtained.
2.2. GEPIA dataset analysis
The online database Gene Expression Profiling Interactive Analysis (GEPIA) (http://gepia.cancer-pku.cn/index.html) is an interactive web server for estimating mRNA expression data based on RNA sequencing expression data of 9,736 tumors and 8,587 normal samples from the TCGA and the GTEx projects.[26] It was used to investigate differential expression analysis, profiling according to pathological stages, patient survival analysis, and correlation analysis.
2.3. The Kaplan–Meier plotter analysis
The online Kaplan–Meier plotter (http://kmplot.com/analysis/) database, which is capable of assessing the effect of 54,675 genes on survival using 10,461 cancer samples, including 1,816 OC samples, was used to evaluate the effect of S100 family members mRNA expression on overall survival (OS) in human OC patients.[27] For each individual gene, patients were split into high and low expression groups by the median values of mRNA expression. The prognostic value of the mRNA expression of S100 family members was evaluated using the Kaplan-Meier survival plot, with a hazard ratio with 95% confidence intervals and log rank p-value. Subgroup analyses were performed by dividing patients based on pathological grade, clinical stage, TP53 mutation status, and treatment type. A P value < .05 was considered statistically significant to reduce the false positive rate.
2.4. SurvExpress analysis
SurvExpress (http://bioinformatica.mty.itesm.mx/SurvExpress), which is a web-based tool providing survival multivariate analysis and risk assessment based on genes expression.[28] In our analysis, SurvExpress was used to provide survival analysis and risk assessment for S100 family members signature in patients with OC. Patients of indicated datasets were stratified according to median value of prognostic index. High and low risk groups were divided based on the maximized risk algorithm. The log-rank test was used to evaluate statistically the equality of survival curves.
2.5. Interaction and functional enrichment analysis
GeneMANIA (http://www.genemania.org) provides a well-maintained, user-friendly gene-list analysis web interface for deriving hypotheses based on gene functions.[29] In this study, the GeneMANIA was adopted to construct a gene–gene interaction network for S100 family members in terms of physical interactions, co-expression, predictions, co-localization, and genetic interaction, as well as to evaluate their functions. FunRich was used to conduct pathway and process enrichment analysis of S100 family members and their closely related genes.[30] The Gene Ontology (GO) terms for biological process (BP), molecular function (MF) and cellular component (CC) categories, as well as biological pathways enrichment analyses were performed through FunRich.
3. Results
3.1. Transcription levels of S100 members in patients with OC
To determine differences in the mRNA expression of S100 member between tumor and normal tissues in OC, we performed a comprehensive analysis using the GEPIA databases. As shown in Figure 1, GEPIA analysis indicated that the expression levels of S100A1, S100A2, S100A4, S100A5, S100A11, S100A14 and S100A16 were higher in OC tissues than in normal tissues, whereas there were no significant difference in Other S100 member mRNA expression between OC and normal controls. We also analyzed the relationship between the transcription levels of S100 member and the tumor stage of patients with OC. As shown in Figure 2, the results demonstrated that S100A1, S100A11, S100A13, S100G and S100P mRNA expression was significantly associated with tumor stage for OC.
Figure 1.
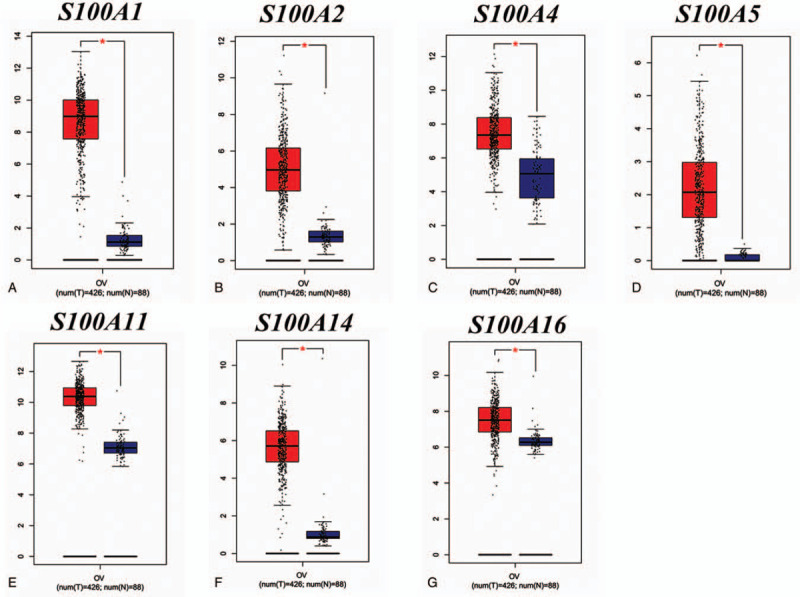
The expression of S100 family members in OC patients (GEPIA database). Note: Box plots derived from gene expression data in GEPIA comparing expression of a specific S100 family member in OC tissue and normal tissues, the p value was set up at 0.05. (A)-(G) The distribution of S100A1, S100A2, S100A4, S100A5, S100A11, S100A14, and S100A16 gene mRNA expression between OC tissue and normal tissues, respectively. (∗, P < .05; ∗∗, P < .01; ∗∗∗, P < .001).
Figure 2.
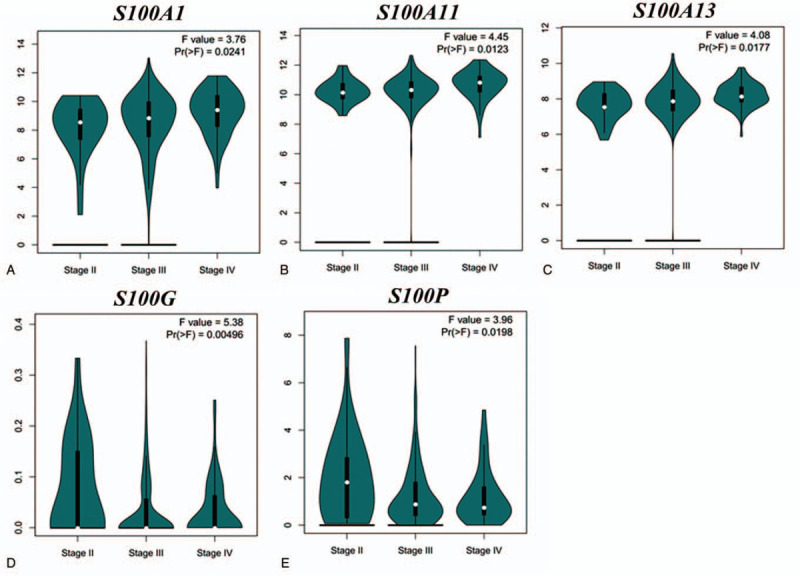
The expression levels of S100 family members in subgroups of different stage OC patients (GEPIA database). (A–E) Boxplot showing relative expression of S100A1, S100A11, S100A13, S100G and S100P in OC patients in stages, 2, 3, or 4 using GEPIA, respectively. (∗, P < .05; ∗∗, P < .01; ∗∗∗, P < .001).
3.2. Prognostic ability of S100 members expression in OC patients
We respectively examined the prognostic ability of the mRNA expression of individual S100 family members in OC patients using www.Kmplot.com. Nine members were significantly associated with prognosis in OC patients (Fig. 3). We observed that high expression of S100A1, S100A3, S100A5, S100A6, and S100A13 were significantly correlated with better OS, while increased S100A2, S100A7A, S100A10, and S100A11 expression were associated with worse prognosis in OC patients. The mRNA levels of the other S100 family members were not correlated with OS, although the expression of S100A4 (HR = 1.14 95% CI: 1.00–1.30, P = .055) was modestly associated with poor survival.
Figure 3.
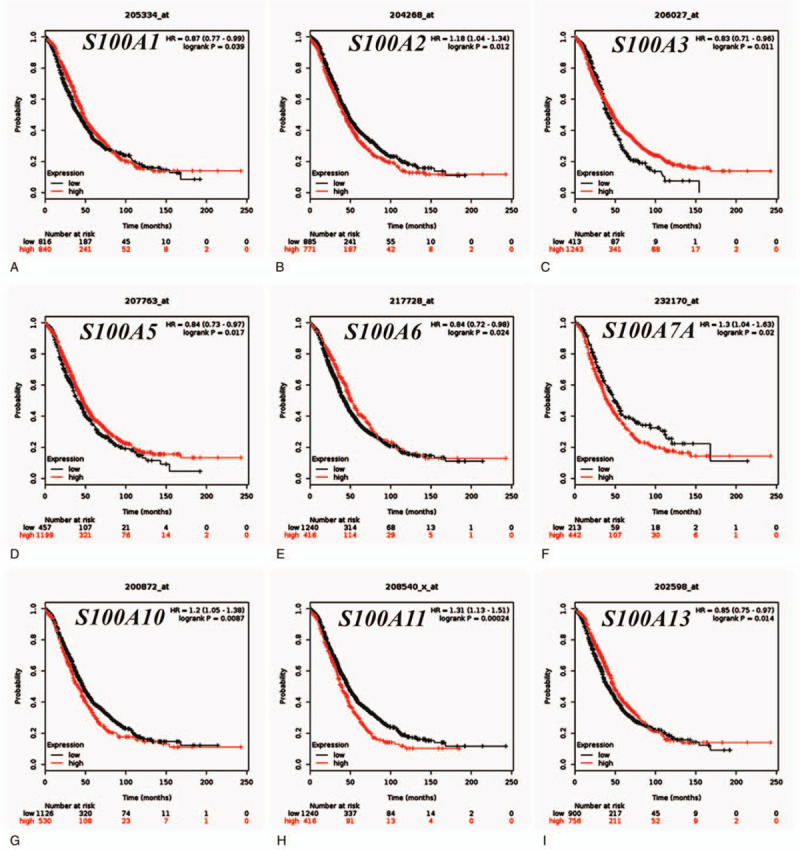
The prognostic value of the individual S100 family members (KM Plotter database). (A–I) Survival curves of S100A1, S100A2, S100A3, S100A5, S100A6, S100A7A, S100A10, S100A11, and S100A13 are plotted for all patients (n = 1,186), respectively.
3.3. Prognostic ability of S100 members expression in different OC subtypes
The prognostic ability of S100 family member expression was assessed in different pathological histological subtypes of OC, including serous and endometrioid. As shown in Table 1 and Figure 4, high expression of S100A5, S100A6, S100A8, and S100A13 were correlated with longer OS in serous OC patients. The expression of S100A10 and S100A11 were associated with poor OS in serous OC patients. S100A1 expression was modestly associated with OS, but without statistical significance. The remaining S100 family members were not related to prognosis in serous OC. In endometrioid OC, increased S100A12 and S100G expression were associated with better prognosis. The remaining S100 family members were not significantly associated with prognosis in endometrioid OC.
Table 1.
Correlation of S100 gene expression level with overall survival in ovarian cancer patients with different pathological histology.
| S100 family | Affymetrix ID | Pathological grades | Cases | HR | 95% CI | P value |
| S100A1 | 205334_at | Serous | 1207 | 0.86 | 0.74–1.00 | .055 |
| Endometrioid | – | – | – | – | ||
| S100A2 | 204268_at | Serous | 1207 | 1.08 | 0.93–1.26 | .31 |
| Endometrioid | 47 | 4.9 | 0.82–29.32 | .054 | ||
| S100A3 | 206027_at | Serous | 1207 | 0.86 | 0.73–1.01 | .06 |
| Endometrioid | 37 | 0.27 | 0.04–1.60 | .12 | ||
| S100A4 | 203186_s_at | Serous | 1207 | 0.91 | 0.78–1.07 | .24 |
| Endometrioid | 37 | 4.79 | 0.53–42.98 | .12 | ||
| S100A5 | 207763_at | Serous | 1207 | 0.83 | 0.70–0.98 | .025 |
| Endometrioid | – | – | – | – | ||
| S100A6 | 217728_at | Serous | 1207 | 0.80 | 0.67–0.95 | .013 |
| Endometrioid | 37 | 2.82 | 0.31–25.21 | .33 | ||
| S100A7 | 205916_at | Serous | 1207 | 0.90 | 0.77–1.05 | .19 |
| Endometrioid | 37 | 0.17 | 0.02–1.48 | .066 | ||
| S100A7A | 232170_at | Serous | 1207 | 523 | 0.92–1.49 | .20 |
| Endometrioid | – | – | – | – | ||
| S100A8 | 202917_s_at | Serous | 1207 | 0.84 | 0.71–0.99 | .038 |
| Endometrioid | 37 | 0.41 | 0.05–3.66 | .41 | ||
| S100A9 | 203535_at | Serous | 1207 | 0.87 | 0.74–1.01 | .075 |
| Endometrioid | 37 | 0.41 | 0.07–2.47 | .32 | ||
| S100A10 | 200872_at | Serous | 1207 | 1.25 | 1.05–1.49 | .011 |
| Endometrioid | – | – | – | – | ||
| S100A11 | 208540_x_at | Serous | 1207 | 1.34 | 1.13–1.58 | .00079 |
| Endometrioid | 37 | 0.30 | 0.05–1.81 | .16 | ||
| S100A12 | 205863_at | Serous | 1207 | 0.90 | 0.76–1.05 | .18 |
| Endometrioid | 37 | 0.10 | 0.01–0.89 | .011 | ||
| S100A13 | 202598_at | Serous | 1207 | 0.80 | 0.68–0.94 | .0055 |
| Endometrioid | 37 | 0.16 | 0.03–0.09 | .022 | ||
| S100A14 | 218677_at | Serous | 1207 | 0.89 | 0.76–1.04 | .13 |
| Endometrioid | 37 | 3.03 | 0.5–18.16 | .20 | ||
| S100A16 | 227998_at | Serous | 523 | 1.21 | 0.97–1.52 | .096 |
| Endometrioid | 30 | 2.65 | 0.28–25.49 | .38 | ||
| S100B | 209686_at | Serous | 1207 | 1.13 | 0.95–1.33 | .16 |
| Endometrioid | 37 | 0.40 | 0.07–2.38 | .29 | ||
| S100G | 207885_at | Serous | 1207 | 0.90 | 0.76–1.06 | .20 |
| Endometrioid | 37 | 0.10 | 0.01–0.86 | .0092 | ||
| S100P | 204351_at | Serous | 1207 | 1.09 | 0.93–1.27 | .28 |
| Endometrioid | 47 | 0.38 | 0.06–2.29 | .28 | ||
| S100Z | 1554876_a_at | Serous | 523 | 1.16 | 0.93–1.46 | .19 |
| Endometrioid | 30 | 0.41 | 0.06–2.92 | .36 |
The bold values indicate that the results are statistically significant.
Figure 4.
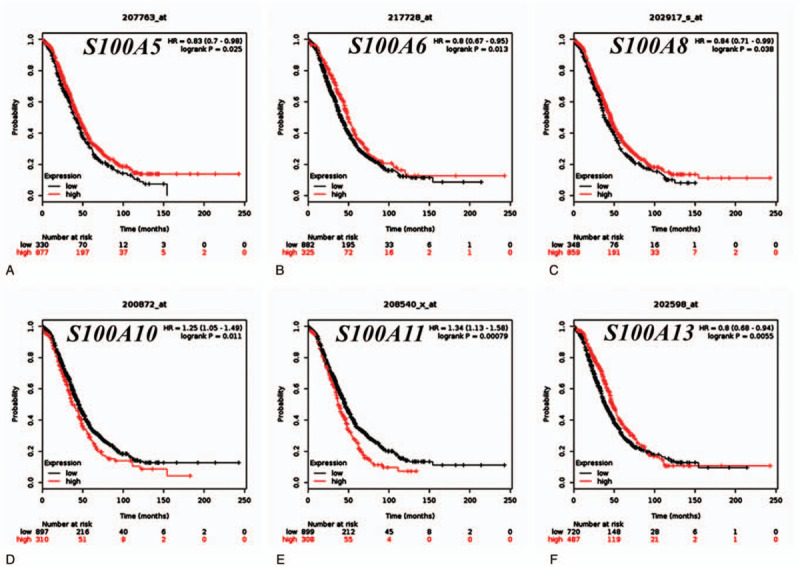
The prognostic values of individual S100 family members in serous ovarian cancer subtypes (KM Plotter database). (A)- (F) Survival curves of S100A5, S100A6, S100A8, S100A10, S100A11 and S100A13 are plotted for serous type OC patients (n = 1,232), respectively.
3.4. Prognostic ability of S100 members expression in OC patients with different clinicopathological features
To further assess the correlation of the expression of individual S100 family members with other clinicopathological features, we examined their correlation with pathological grade (Table 2), clinical stage (Table 3), and TP53 status (Table 4) in OC patients. As shown in Table 2, high expression of S100A2, S100A7A, and S100G were associated with better OS in pathological grade I OC patients. Increased S100A4, S100A6, S100A16, and S100B expression were associated with worse OS. However, elevated expression of S100A12 and S100Z were associated with better OS in grade II OC patients. In pathological grade III OC patients, high S100A2, S100A10, S100A11, and S100P expression were linked to shorter OS, but high S100A3, S100A5, S100A8, and S100B expression were correlated to longer OS. In addition, high expression of S100A1, S100A4, S100A6, S100A13, S100A14, and S100P were correlated with longer OS in grade IV OC patients.
Table 2.
Correlation of S100 gene expression level with overall survival in ovarian cancer patients with different pathological grade.
| S100 family | Affymetrix ID | clinical stage | Cases | HR | 95% CI | P value |
| S100A1 | 205334_at | I | 56 | 0.59 | 0.23–1.49 | .25 |
| II | 324 | 0.91 | 0.66–1.25 | .54 | ||
| III | 1015 | 0.89 | 0.75–1.05 | .16 | ||
| IV | 20 | 0.07 | 0.01–0.34 | 3.2e−5 | ||
| S100A2 | 204268_at | I | 56 | 0.14 | 0.02–1.04 | .026 |
| II | 324 | 1.30 | 0.91–1.86 | .15 | ||
| III | 1015 | 1.27 | 1.07–1.50 | .0051 | ||
| IV | 20 | 1.83 | 0.59–0.69 | .29 | ||
| S100A3 | 206027_at | I | 56 | 2.22 | 0.73–6.77 | .15 |
| II | 324 | 1.26 | 0.93–1.71 | .13 | ||
| III | 1015 | 0.78 | 0.65–0.93 | .0056 | ||
| IV | 20 | 0.36 | 0.12–1.04 | .049 | ||
| S100A4 | 203186_s_at | I | 56 | 0.63 | 0.21–1.93 | .41 |
| II | 324 | 1.46 | 1.06–2.03 | .0021 | ||
| III | 1015 | 1.09 | 0.92–1.29 | .30 | ||
| IV | 20 | 0.21 | 0.06–0.66 | .0036 | ||
| S100A5 | 207763_at | I | 56 | 0.53 | 0.17–1.62 | .26 |
| II | 324 | 1.32 | 0.98–1.79 | .071 | ||
| III | 1015 | 0.79 | 0.66–0.95 | .011 | ||
| IV | 20 | 0.44 | 0.15–1.30 | .13 | ||
| S100A6 | 217728_at | I | 56 | 0.41 | 0.14–1.19 | .092 |
| II | 324 | 1.40 | 1.02–1.93 | .038 | ||
| III | 1015 | 0.83 | 0.70–1.00 | .051 | ||
| IV | 20 | 0.58 | 0.37–0.90 | .015 | ||
| S100A7 | 205916_at | I | 56 | 0.52 | 0.19–1.39 | .18 |
| II | 324 | 0.84 | 0.60–1.17 | .30 | ||
| III | 1015 | 0.90 | 0.76–1.06 | .20 | ||
| IV | 20 | 0.47 | 0.17–1.31 | .14 | ||
| S100A7A | 232170_at | I | 41 | 4.36 | 1.42–13.42 | .0051 |
| II | 162 | 1.39 | 0.90–2.17 | .14 | ||
| III | 392 | 0.81 | 0.63–1.04 | .093 | ||
| IV | 18 | – | – | – | ||
| S100A8 | 202917_s_at | I | 56 | 0.46 | 0.13–1.61 | .22 |
| II | 324 | 0.77 | 0.56–1.06 | .11 | ||
| III | 1015 | 0.75 | 0.63–0.89 | .0012 | ||
| IV | 20 | 0.55 | 0.17–1.73 | .30 | ||
| S100A9 | 203535_at | I | 56 | 1.66 | 0.62–4.48 | .31 |
| II | 324 | 0.75 | 0.55–1.03 | .071 | ||
| III | 1015 | 0.85 | 0.72–1.00 | .052 | ||
| IV | 20 | 2.18 | 0.74–6.39 | .15 | ||
| S100A10 | 200872_at | I | 56 | 0.56 | 0.21–1.48 | .24 |
| II | 324 | 1.34 | 0.97–1.84 | .072 | ||
| III | 1015 | 1.38 | 1.15–1.65 | .00058 | ||
| IV | 20 | 0.56 | 0.21–1.48 | .24 | ||
| S100A11 | 208540_x_at | I | 56 | 0.55 | 0.22–1.42 | .21 |
| II | 324 | 0.74 | 0.53–1.03 | .069 | ||
| III | 1015 | 1.38 | 1.15–1.66 | .00051 | ||
| IV | 20 | 2.79 | 0.80–9.72 | .094 | ||
| S100A12 | 205863_at | I | 56 | 1.91 | 0.73–4.99 | .18 |
| II | 324 | 0.56 | 0.41–0.78 | .00043 | ||
| III | 1015 | 0.90 | 0.76–1.06 | .21 | ||
| IV | 20 | 1.66 | 0.63–4.40 | .30 | ||
| S100A13 | 202598_at | I | 56 | 1.60 | 0.59–4.33 | .35 |
| II | 324 | 0.31 | 0.09–1.14 | .063 | ||
| III | 1015 | 0.87 | 0.74–1.02 | .096 | ||
| IV | 20 | 1.34 | 0.90–1.99 | .15 | ||
| S100A14 | 218677_at | I | 56 | 1.86 | 0.65–5.32 | .24 |
| II | 324 | 0.78 | 0.58–1.06 | .11 | ||
| III | 1015 | 0.87 | 0.74–1.03 | .11 | ||
| IV | 20 | 0.34 | 0.12–0.97 | .035 | ||
| S100A16 | 227998_at | I | 41 | 0.53 | 0.17–1.63 | .26 |
| II | 162 | 1.75 | 1.02–3.01 | .04 | ||
| III | 392 | 1.29 | 1.00–1.67 | .05 | ||
| IV | 18 | – | – | – | ||
| S100B | 209686_at | I | 56 | 2.05 | 0.76–5.50 | .15 |
| II | 324 | 1.41 | 1.02–1.94 | .036 | ||
| III | 1015 | 0.83 | 0.70–0.99 | .037 | ||
| IV | 20 | 0.46 | 0.14–1.47 | .18 | ||
| S100G | 207885_at | I | 56 | 0.27 | 0.09–0.87 | .019 |
| II | 324 | 0.77 | 0.55–1.08 | .13 | ||
| III | 1015 | 0.87 | 0.73–1.03 | .11 | ||
| IV | 20 | 0.71 | 0.26–1.94 | .51 | ||
| S100P | 204351_at | I | 56 | 0.65 | 0.25–1.72 | .38 |
| II | 324 | 0.87 | 0.64–1.20 | .40 | ||
| III | 1015 | 1.25 | 1.06–1.48 | .0096 | ||
| IV | 20 | 0.08 | 0.01–0.62 | .0023 | ||
| S100Z | 1554876_a_at | I | 41 | – | – | – |
| II | 162 | 0.60 | 0.37–0.96 | .032 | ||
| III | 392 | 1.29 | 1.00–1.66 | .051 | ||
| IV | 18 | – | – | – |
The bold values indicate that the results are statistically significant.
Table 3.
Correlation of S100 gene expression level with overall survival in ovarian cancer patients with different clinical stage.
| S100 family | Affymetrix ID | clinical stage | Cases | HR | 95% CI | P value |
| S100A1 | 205334_at | I | 74 | 0.41 | 0.11–1.53 | .17 |
| II | 61 | 0.55 | 0.19–1.59 | .26 | ||
| III | 1044 | 0.80 | 0.68–0.94 | .0059 | ||
| IV | 176 | 1.48 | 1.03–2.14 | .034 | ||
| S100A2 | 204268_at | I | 74 | 1.18 | 1.04–1.34 | .012 |
| II | 61 | 0.42 | 0.14–1.29 | .12 | ||
| III | 1044 | 1.08 | 0.91–1.28 | .36 | ||
| IV | 176 | 1.40 | 0.97–2.02 | .069 | ||
| S100A3 | 206027_at | I | 74 | 0.36 | 0.11–1.20 | .083 |
| II | 61 | 0.74 | 0.37–1.51 | .41 | ||
| III | 1044 | 0.82 | 0.69–0.96 | .017 | ||
| IV | 176 | 0.79 | 0.54–1.15 | .22 | ||
| S100A4 | 203186_s_at | I | 74 | 1.73 | 0.52–5.81 | .37 |
| II | 61 | 3.06 | 0.66–14.23 | .14 | ||
| III | 1044 | 0.88 | 0.74–1.05 | .16 | ||
| IV | 176 | 1.54 | 1.07–2.22 | .021 | ||
| S100A5 | 207763_at | I | 74 | 0.48 | 0.14–1.59 | .22 |
| II | 61 | 0.12 | 0.02–0.95 | .017 | ||
| III | 1044 | 0.78 | 0.64–0.94 | .011 | ||
| IV | 176 | 1.69 | 1.17–2.45 | .0047 | ||
| S100A6 | 217728_at | I | 74 | 0.38 | 0.12–1.18 | .082 |
| II | 61 | 3.27 | 1.00–10.73 | .04 | ||
| III | 1044 | 0.88 | 0.74–1.05 | .16 | ||
| IV | 176 | 0.58 | 0.37–0.90 | .015 | ||
| S100A7 | 205916_at | I | 74 | 0.43 | 0.12–1.59 | .19 |
| II | 61 | 2.12 | 0.58–7.79 | .25 | ||
| III | 1044 | 0.87 | 0.73–1.03 | .11 | ||
| IV | 176 | 0.73 | 0.49–1.08 | .12 | ||
| S100A7A | 232170_at | I | 51 | 0.33 | 0.08–1.41 | .12 |
| II | 32 | 2.54 | 0.46–13.92 | .27 | ||
| III | 426 | 1.24 | 0.94–1.62 | .12 | ||
| IV | 61 | 1.74 | 0.95–3.16 | .068 | ||
| S100A8 | 202917_s_at | I | - | - | - | - |
| II | 61 | 2.04 | 0.66–6.27 | .20 | ||
| III | 1044 | 0.85 | 0.71–1.00 | .056 | ||
| IV | 176 | 0.76 | 0.53–1.09 | .13 | ||
| S100A9 | 203535_at | I | 74 | 0.21 | 0.03–1.61 | .096 |
| II | 61 | 2.36 | 0.78–7.13 | .12 | ||
| III | 1044 | 0.90 | 0.76–1.06 | .20 | ||
| IV | 176 | 0.81 | 0.56–1.17 | .26 | ||
| S100A10 | 200872_at | I | 74 | 0.16 | 0.02–1.22 | .42 |
| II | 61 | 2.47 | 0.77–7.94 | .12 | ||
| III | 1044 | 1.32 | 1.11–1.57 | .0014 | ||
| IV | 176 | 1.24 | 0.82–1.88 | .31 | ||
| S100A11 | 208540_x_at | I | 74 | 0.36 | 0.11–1.15 | .072 |
| II | 61 | 4.55 | 1.00–20.78 | .033 | ||
| III | 1044 | 1.49 | 1.25–1.78 | 7.9e−06 | ||
| IV | 176 | 1.1 | 0.77–1.59 | .59 | ||
| S100A12 | 205863_at | I | 74 | 0.46 | 0.15–1.47 | .18 |
| II | 61 | 0.52 | 0.18–1.50 | .220 | ||
| III | 1044 | 0.83 | 0.70–0.98 | .027 | ||
| IV | 176 | 0.76 | 0.51–1.14 | .18 | ||
| S100A13 | 202598_at | I | 74 | 0.11 | 0.01–0.84 | .0095 |
| II | 61 | 0.31 | 0.09–1.14 | .063 | ||
| III | 1044 | 0.87 | 0.74–1.02 | .096 | ||
| IV | 176 | 1.34 | 0.90–1.99 | .15 | ||
| S100A14 | 218677_at | I | 74 | 2.24 | 0.49–10.25 | .28 |
| II | – | – | – | – | ||
| III | 1044 | 0.85 | 0.72–1.00 | .046 | ||
| IV | 176 | 1.15 | 0.80–1.67 | .45 | ||
| S100A16 | 227998_at | I | 51 | 2.42 | 0.58–10.21 | .21 |
| II | 32 | 0.35 | 0.07–1.85 | .20 | ||
| III | 426 | 1.42 | 1.05–1.93 | .022 | ||
| IV | 61 | 0.65 | 0.36–1.20 | .17 | ||
| S100B | 209686_at | I | 74 | 3.67 | 1.01–13.40 | .037 |
| II | 61 | 1.93 | 0.65–5.76 | .23 | ||
| III | 1044 | 0.83 | 0.70–1.00 | .048 | ||
| IV | 176 | 0.83 | 0.58–1.20 | .33 | ||
| S100G | 207885_at | I | 74 | 2.64 | 0.33–21.51 | .34 |
| II | 61 | 0.27 | 0.08–1.00 | .035 | ||
| III | 1044 | 0.84 | 0.70–1.01 | .056 | ||
| IV | 176 | 1.28 | 0.87–1.88 | .20 | ||
| S100P | 204351_at | I | 74 | 2.41 | 0.72–8.02 | .14 |
| II | 61 | 4.14 | 1.37–12.51 | .0063 | ||
| III | 1044 | 1.35 | 1.13–1.60 | .00074 | ||
| IV | 176 | 0.74 | 0.48–1.15 | .18 | ||
| S100Z | 1554876_a_at | I | 51 | 2.41 | 0.72–8.02 | .14 |
| II | 32 | 0.35 | 0.04–2.90 | .31 | ||
| III | 426 | 0.87 | 0.67–1.13 | .29 | ||
| IV | 176 | 0.63 | 0.35–1.14 | .12 |
The bold values indicate that the results are statistically significant.
Table 4.
Correlation of S100 gene expression level with overall survival in ovarian cancer patients with different TP53 mutation status.
| S100 family | Affymetrix ID | TP53 mutation | Cases | HR | 95% CI | P value |
| S100A1 | 205334_at | mutated | 506 | 0.66 | 0.51–0.85 | .0011 |
| wild type | 94 | 0.65 | 0.36–1.17 | .15 | ||
| S100A2 | 204268_at | mutated | 506 | 0.79 | 0.61–1.02 | .069 |
| wild type | 94 | 0.45 | 0.22–0.93 | .027 | ||
| S100A3 | 206027_at | mutated | 506 | 1.22 | 0.96–1.56 | .11 |
| wild type | 94 | 0.41 | 0.23–0.74 | .0023 | ||
| S100A4 | 203186_s_at | mutated | 506 | 0.82 | 0.64–1.03 | .089 |
| wild type | 94 | 0.62 | 0.35–1.13 | .11 | ||
| S100A5 | 207763_at | mutated | 506 | 0.82 | 0.64–1.06 | .14 |
| wild type | 94 | 0.39 | 0.18–0.86 | .016 | ||
| S100A6 | 217728_at | mutated | 506 | 0.79 | 0.62–1.02 | .069 |
| wild type | 94 | 0.63 | 0.36–1.10 | .099 | ||
| S100A7 | 205916_at | mutated | 506 | 1.10 | 0.87–1.39 | .42 |
| wild type | 94 | 0.71 | 0.38–1.31 | .27 | ||
| S100A7A | 232170_at | mutated | 124 | 1.71 | 1.15–2.56 | .0079 |
| wild type | 19 | – | – | – | ||
| S100A8 | 202917_s_at | mutated | 506 | 0.80 | 0.63–1.03 | .08 |
| wild type | 94 | 1.84 | 1.05–3.23 | .031 | ||
| S100A9 | 203535_at | mutated | 506 | 0.86 | 0.68–1.08 | .20 |
| wild type | 94 | 1.46 | 0.83–2.57 | .19 | ||
| S100A10 | 200872_at | mutated | 506 | 1.26 | 0.94–1.64 | .088 |
| wild type | 94 | 0.61 | 0.33–1.11 | .10 | ||
| S100A11 | 208540_x_at | mutated | 506 | 1.53 | 1.21–1.94 | .00031 |
| wild type | 94 | 2.14 | 1.17–3.91 | .011 | ||
| S100A12 | 205863_at | mutated | 506 | 1.31 | 1.04–1.64 | .019 |
| wild type | 94 | 1.43 | 0.83–2.46 | .20 | ||
| S100A13 | 202598_at | mutated | 506 | 0.75 | 0.60–0.94 | .013 |
| wild type | 94 | 0.16 | 0.03–0.09 | .022 | ||
| S100A14 | 218677_at | mutated | 506 | 1.30 | 1.02–1.65 | .035 |
| wild type | 94 | 0.73 | 0.42–1.27 | .27 | ||
| S100A16 | 227998_at | mutated | 124 | 0.64 | 0.42–0.98 | .038 |
| wild type | 19 | – | – | – | ||
| S100B | 209686_at | mutated | 506 | 0.80 | 0.64–1.01 | .055 |
| wild type | 94 | 2.04 | 1.16–3.58 | .012 | ||
| S100G | 207885_at | mutated | 506 | 1.27 | 1.01–1.61 | .043 |
| wild type | 94 | 0.68 | 0.39–1.18 | .17 | ||
| S100P | 204351_at | mutated | 506 | 1.28 | 1.01–1.62 | .038 |
| wild type | 94 | 1.38 | 0.80–2.39 | .25 | ||
| S100Z | 1554876_a_at | mutated | 506 | 1.27 | 0.86–1.88 | .22 |
| wild type | 19 | – | – | – |
The bold values indicate that the results are statistically significant.
As shown in Table 3, increased expression of S100A2 and S100B were associated with worse OS in clinical stage I patients, and only high expression of S100A13 was linked to better prognosis. For clinical stage II OC patients, high expression of S100A5 and S100G were associated with better OS, and high S100A6, S100A11, S100A16, and S100P expression correlated with poor prognosis in this subgroup. In clinical stage III OC patients, high expression of S100A1, S100A3, S100A5, S100A12, S100A14, and S100B correlated with better OS; in contrast, elevated S100A10, S100A11, and S100P expression were associated with worse OS. For clinical stage IV patients, high levels of S100A1, S100A4, and S100A5 were associated with worse OS, and only high S100A6 correlated with better OS in this subgroup.
Table 4 shows the correlation between S100 family member expression and TP53 status. Elevated expression of S100A1, S100A13, S100A16, S100G, and S100P were correlated with better OS in OC patients harboring mutated TP53. However, high expression of S100A7A, S100A11, S100A12, S100A14, and S100A16 were associated with poor OS in this subgroup. In contrast, increased S100A2, S100A3, S100A5, S100A13, and S100B expression were associated with worse OS in OC patients with wild-type TP53, and high expression of S100A8, S100A11, and S100B were linked to better prognosis.
3.5. Prognostic ability of S100 family members expression in OC patients according to treatment type
We examined the relationship between S100 family member expression and treatment in OC patients (Table 5). Elevated S100A2, S100A4, S100A7A, S100A10, S100A16, and S100B expression were associated with worse OS in OC patients who underwent optimal surgery, and high expression of S100A3, S100A7, S100A9, S100A12, and S100G were associated with outstanding OS in this subgroup. Increased S100A1, S100A6, S100A13, and S100A14 expression significantly correlated with longer survival in patients treated with suboptimal surgery. However, high expression of S100A11 was linked with worse OS in patients who underwent suboptimal surgery.
Table 5.
Correlation of S100 gene expression level with overall survival in ovarian cancer patients with different treatment.
| S100 family | Affymetrix ID | Treatment | Cases | HR | 95% CI | P value |
| S100A1 | 205334_at | optimal | 801 | 1.13 | 0.92–1.39 | .26 |
| suboptimal | 536 | 0.67 | 0.55–0.82 | 9.1e−05 | ||
| S100A2 | 204268_at | optimal | 801 | 1.24 | 1.01–1.52 | .039 |
| suboptimal | 536 | 1.19 | 0.98–1.46 | .086 | ||
| S100A3 | 206027_at | optimal | 801 | 0.61 | 0.49–0.76 | 1.1e−05 |
| suboptimal | 536 | 1.11 | 0.90–1.35 | .33 | ||
| S100A4 | 203186_s_at | optimal | 801 | 1.26 | 1.01–1.56 | .039 |
| suboptimal | 536 | 0.84 | 0.66–1.06 | .14 | ||
| S100A5 | 207763_at | optimal | 801 | 1.22 | 0.99–1.49 | .057 |
| suboptimal | 536 | 0.81 | 0.65–1.01 | .066 | ||
| S100A6 | 217728_at | optimal | 801 | 0.88 | 0.70–1.10 | .26 |
| suboptimal | 536 | 0.78 | 0.62–0.99 | .043 | ||
| S100A7 | 205916_at | optimal | 801 | 0.76 | 0.61–0.94 | .012 |
| suboptimal | 536 | 0.86 | 0.69–1.08 | .20 | ||
| S100A7A | 232170_at | optimal | 243 | 1.52 | 1.00–2.32 | .049 |
| suboptimal | 235 | 1.37 | 0.98–1.93 | .065 | ||
| S100A8 | 202917_s_at | optimal | 801 | 0.83 | 0.68–1.02 | 0083 |
| suboptimal | 536 | 0.91 | 0.73–1.33 | .39 | ||
| S100A9 | 203535_at | optimal | 801 | 0.78 | 0.63–0.96 | .018 |
| suboptimal | 536 | 1.14 | 0.90–1.45 | .26 | ||
| S100A10 | 200872_at | optimal | 801 | 1.42 | 1.15–1.76 | .0012 |
| suboptimal | 536 | 1.17 | 0.92–1.48 | .21 | ||
| S100A11 | 208540_x_at | optimal | 801 | 1.23 | 0.98–1.55 | .075 |
| suboptimal | 536 | 1.42 | 1.15–1.76 | .0012 | ||
| S100A12 | 205863_at | optimal | 801 | 0.71 | 0.57–0.90 | .0034 |
| suboptimal | 536 | 1.10 | 0.90–1.36 | .36 | ||
| S100A13 | 202598_at | optimal | 801 | 0.84 | 0.66–1.06 | .14 |
| suboptimal | 536 | 0.75 | 0.61–0.93 | .0084 | ||
| S100A14 | 218677_at | optimal | 801 | 0.86 | 0.70–1.06 | .16 |
| suboptimal | 536 | 0.81 | 0.66–1.01 | .058 | ||
| S100A16 | 227998_at | optimal | 243 | 1.98 | 1.16–3.40 | .011 |
| suboptimal | 235 | 0.76 | 0.55–1.05 | .091 | ||
| S100B | 209686_at | optimal | 801 | 1.35 | 1.08–1.68 | .0077 |
| suboptimal | 536 | 0.82 | 0.67–1.01 | .059 | ||
| S100G | 207885_at | optimal | 801 | 0.69 | 0.55–0.86 | .0011 |
| suboptimal | 536 | 0.82 | 0.67–1.00 | .055 | ||
| S100P | 204351_at | optimal | 801 | 1.15 | 0.91–1.44 | .24 |
| suboptimal | 536 | 1.23 | 1.00–1.50 | .05 | ||
| S100Z | 1554876_a_at | optimal | 243 | 1.40 | 0.88–2.25 | .16 |
| suboptimal | 235 | 1.14 | 0.85–1.53 | .40 |
The bold values indicate that the results are statistically significant.
3.6. Prognostic ability of S100 family members signature in patients with OC
To further identify the prognostic values of S100 family members signature in patients with OC, the SurvExpress platform was used. A total of 1,902 patients from four datasets of large sample size ovarian cancer dataset in the SurvExpress platform were analyzed. High/low risk groups were divided by prognostic risk algorithms in each datasets. The survival analysis and Kaplan–Meier plotter between low risk (green) and high risk (red) groups were demonstrated in Figure 5. The results showed that the low risk group displayed a significant favorable OS outcome compared to the high risk group in ovarian serous cystadenocarcinoma TCGA (HR = 1.50, 95% CI = 1.19–1.88), ovarian Meta-base: 6 cohorts 22K genes (HR = 1.60, 95% CI = 1.32–1.94), Tothill Bowtell Survival Ovarian GSE9891 (HR = 2.25, 95% CI = 1.52–3.33) and Yoshihara Tanaka Ovarian GSE32062 (HR = 1.76, 95% CI = 1.22–1.54) datasets, respectively.
Figure 5.
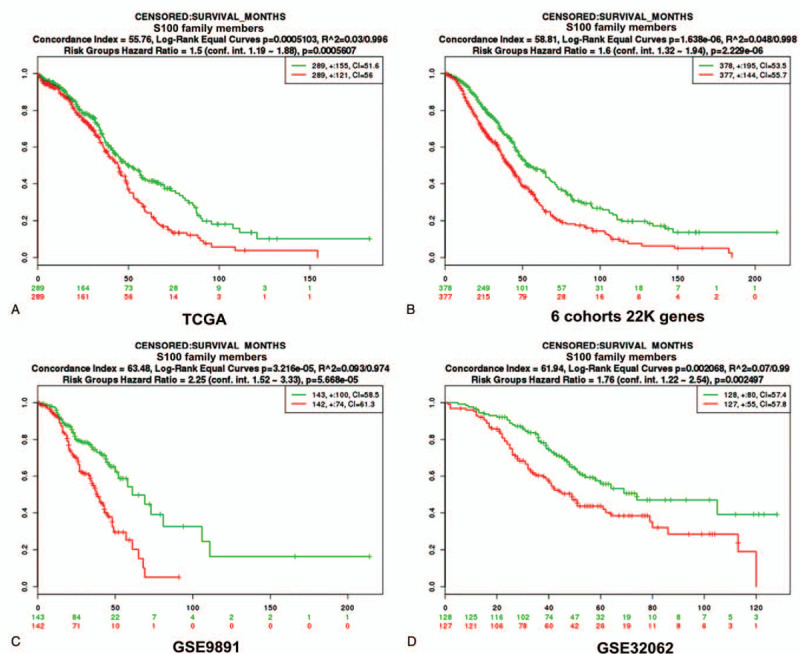
The genes signature of S100 family members in ovarian cancer (SurvExpress database). (A–D) Kaplan-Meier survival curves of S100 family members were explored in high risk and low risk group for ovarian serous cystadenocarcinoma TCGA, ovarian Meta-base: 6 cohorts 22K genes, Tothill Bowtell Survival Ovarian GSE9891 and Yoshihara Tanaka Ovarian GSE32062 datasets, respectively.
3.7. Interaction and functions enrichment analysis of S100 family members in patients with OC
We ran GeneMANIA to analyze the S100 family members to further predict gene functions and network connections. As showed in Figure 6A, 19 genes closely related to the S100 family members are identified, such as CABP2, CABP7, CALN1, CAPSL, CRNN, EFCAB3, FLG, FLG2, GUCA1A, HRNR, KCNIP4, MICU3, MYL5, OCM, PVALB, RPTN, SNTN, TCHH, and TCHHL1. The co-expression interactions, co-localization interactions, physical interactions, prediction interactions, share protein domains interactions of the S100 family members were 197 pairs, 32 pairs, 8 pairs, 21 pairs and 1184 pairs, respectively.
Figure 6.
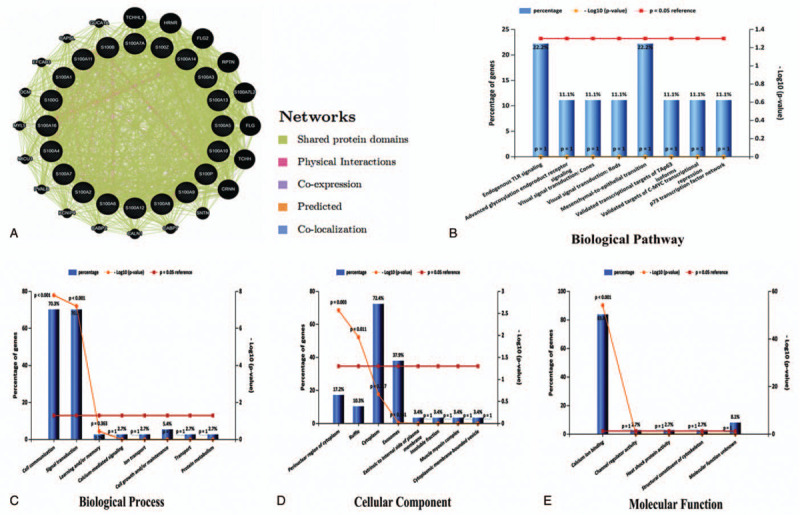
The interaction and functions enrichment analysis of S100 family members in ovarian cancer (GeneMANIA and Funrich database). (A) Network connections of S100 family members in patients with ovarian cancer by GeneMANIA; (B–E) The biological pathways and Gene Ontology (GO) terms for biological process (BP), molecular function (MF) and cellular component (CC) categories enrichment analyses were performed through FunRich, respectively.
The functions enrichment of S100 family members and their closely related genes were predicted by analyzing gene ontology (GO) and biological pathways enrichment analyses were performed through FunRich. As shown in Figure 6B–E, the biological process (BP) of S100 family members and their closely related genes were mainly enrichment in the cell communication, signal transduction, learning and/or memory, calcium-mediated signaling, ion transport, cell growth and/or maintenance, transport and protein metabolism. The cellular components that these genes were involve in were the perinuclear region of cytoplasm, ruffle, cytoplasm, exosomes, extrinsic to internal side of plasma membrane, insoluble fraction, muscle myosin complex and cytoplasmic membrane-bounded vesicle. The molecular functions that these genes were mainly expressed in were calcium ion binding, channel regulator activity, heat shock protein activity, structural constituent of cytoskeleton and molecular function unknown; The top 8 results of the enriched biological pathways included endogenous TLR signaling, advanced glycosylation endproduct receptor signaling, visual signal transduction: cones, visual signal transduction: rods, mesenchymal-to-epithelial transition, validated transcriptional targets of TAp63 isoforms, validated targets of C-MYC transcriptional repression and p73 transcription factor network pathway.
4. Discussion
Accumulative studies have determined that deregulated S100 expression is a common feature in human cancers, and S100 expression is associated with tumorigenesis and progression.[7,8] However, the exact role of S100 expression in human tumors, including OC, is still controversial.[23–25] In the current study, we comprehensively examined the expression patterns, prognostic roles and molecular function of S100 family members in OC using integrated bioinformatical analysis. Among the members of the S100 family, the mRNA expression levels of S100A1, S100A2, S100A4, S100A5, S100A11, S100A14, and S100A16 were found to be significantly upregulated in patients with OC, and high mRNA expression of S100A1, S100A3, S100A5, S100A6, and S100A13 were significantly correlated with better overall survival, while increased S100A2, S100A7A, S100A10, and S100A11 mRNA expressions were associated with worse prognosis in OC patients. More importantly, S100 family signatures may be useful potential prognostic markers for OC. Regrettably, to date, few studies have directly compared the prognostic value of S100 family members with other conventional markers, such as CA125 and HE4, and our study could therefore not elucidate whether S100 family members could improve the predictive accuracy of commonly used serum tumor markers for OC prognosis, either alone or in combination.
S100A1 is a member of the S100 family of calcium-binding proteins. It is involved in calcium signaling and neurotransmitter release and associated with cytoskeletal and filament-associated proteins, transcription factors and their regulators, enzymes, and other Ca2+-activated proteins.[31] However, its role in cancer has not yet been fully elucidated. Our results demonstrated that the mRNA expression levels of S100A1 were significantly upregulated in patients with OC, and increased expression of S100A1 was correlated with significantly better OS for all OC patients, but not in the serous or endometrioid subgroups. This may be due to the small sample size of these two subgroups. A previous study found that S100A1 expression was associated with clinicopathological features in OC patients, such as tumor grade, clinical stage, tumor differentiation, and lymph node metastasis.[32] Consistent with this result, we found that high expression of S100A1 indicated a better OS for OC patients with high grade (IV) and stage (IV). Furthermore, S100A1 expression was also associated with longer survival in OC patients who underwent suboptimal surgery.
S100A2 is considered a novel transcriptional target of the cellular calcium signaling and p53 signaling pathways,[33] and plays a pivotal role in regulating cell cycle progression and differentiation and triggering apoptotic programmed cell death in response to DNA damage or stress.[34] Decreased expression of S100A2 has been observed in several tumor types, such as oral cancer,[35] head and neck cancer,[9] breast cancer,[36] pancreatic cancer,[37] lung cancer,[38] bladder cancer,[9] gastric cancer,[20] and colorectal cancer,[39] leading to its designation as a potential tumor suppressor gene. Recent studies confirmed that S100A2 acts downstream of the BRCA1/ΔNp63 signaling axis in modulating transcriptional responses, and it participates in susceptibility to familial OC.[33] In our study, the mRNA expression levels of S100A2 were significantly increased in tumor compared to normal, and high expression of S100A2 was significantly associated with poor OS, especially in clinical stage I and pathological grade III OC patients. In addition, S100A2 was also found to be associated with decreased survival in OC patients who underwent optimal surgery in our analysis.
The biologic roles and prognostic effects of S100A3, S100A5, S100A7A, and S100A13 in OC are still ambiguous. S100A3 is a matricellular protein expressed in numerous tissues and cell types. It was reported to be associated with tumorigenesis in epidermoid cysts, pilomatrixoma, and digestive system tumors.[40,41] S100A5 is expressed in very restricted regions of the adult brain and regulates electrolyte metabolism.[42] S100A7A was demonstrated to be involved in the innate immune system and acts as a defense against epidermal differentiation and inflammation. However, its role in cancer has rarely been explored.[43] Unlike S100A5, the expression of S100A13 has been detected in multiple tissue types, with high expression in the thyroid gland. It plays essential roles in signal transduction for the modulation of tumor growth and invasion.[44] To the best of our knowledge, there are very few studies exploring the relationship between these four genes and outcomes of OC patients. Our analysis showed that the mRNA expression levels of S100A5 were significantly upregulated, and overexpression of S100A3, S100A5, and S100A13 were associated with better OS in OC patients, and S100A13 expression was also associated with better OS in early clinical stages, patients undergoing suboptimal surgery, and two pathological types of OC. In contrast, high expression of S100A7A was associated with worse OS in OC patients.
S100A6 is expressed in a limited number of cell types in adult normal tissues and in several tumor types. As an intracellular protein, S100A6 has been implicated in the regulation of several cellular functions, such as proliferation, cytoskeleton dynamics, apoptosis, and the cellular response to stress. It was reported to be inversely associated with the progression and invasion of several human carcinomas.[45] Moreover, a recent study indicated that serum S100A6 concentration predicts peritoneal tumor burden and correlates with clinical disease stage in OC patients.[46] Our results showed that increased expression of S100A6 was correlated with better prognosis, especially in serous type OC.
S100A10 is an integral part of the cellular structural scaffolding that interacts with plasma membrane proteins through its association with annexin II. S100A10 has been shown to be overexpressed in several human carcinomas, and knockdown of S100A10 significantly reduces the proliferation, migration, and invasion capacity of cancer cell lines.[47] Therefore, it has been implicated in tumor development and progression. Moreover, some studies reported that high S100A10 expression is a powerful predictor of poor chemotherapy response and/or poor outcome in ovarian serous carcinoma.[48,49] We found a similar result, with high S100A10 expression being related to poorer prognosis in OC patients.
S100A11 may function in motility, invasion, and tubulin polymerization. Chromosomal rearrangements and altered expression of S100A11 have been implicated in carcinogenesis, metastasis, and tumor progression.[50] S100A11 has been shown to promote the growth, invasion, and migration of OC cells, and its overexpression correlates with an aggressive malignant phenotype, suggesting it may be a novel prognostic factor for OC. Our results showed that increased expression of S100A11 might indicate worse outcome in serous OC patients, but not in endometrioid OC patients. In addition, high expression of S100A11 was correlated with a worse OS in grade III and stage III OC patients.
Mutations in tumor suppressor genes may be essential drivers in cancer onset and progression. p53, a transcriptional regulator, has been extensively studied, and is capable of inducing apoptosis, promoting genomic stability, and inhibiting angiogenesis.[51] Mutant p53 causes a gain-of-function phenotype, and is involved in tumorigenesis, invasion, and metastasis. Several S100 family members can directly bind to p53 and inhibit its expression and phosphorylation, which contributes to chemoresistance and leads to cancer progression.[52] Multiple studies have revealed a correlation between p53 function and OC stem cells; however, evidence on a prognostic association between TP53 status and S100 family members in OC remains to be clarified.[53] In our current analysis, we found that the mRNA expression levels of S100A11, S100A14, and S100A16 were significantly increased, and increased S100A11, S100A14, S100A16, S100G, and S100P expression in TP53-mutated and S100A8, S100A11, and S100B expression in TP53-wild-type OC patients were correlated with poor OS, indicating that mutations in TP53 might regulate these S100 family members’ expression and participation in the development and progression of OC.
In addition, S100 family, is composed of 20 members that exhibit a high degree of structural and function similarity in humans, the prognostic values of each gene don’t fully reflect the intricacy of potential biomarkers and don’t maximally distinguish the survival benefits in high/low expression group via the expression optimal cutoff. Therefore, we have identified the prognostic values of S100 family members signature in patients with OC using the SurvExpress platform. High/low risk groups were divided by prognostic risk algorithms, and the low risk group displayed a significant favorable OS outcome compared to the high risk group in four datasets. Our results indicating that S100 family signatures may be useful potential prognostic markers for OC. At last, we also carried out interaction and functions enrichment analysis of S100 family members in patients with OC by GeneMANIA and Funrich databases. 19 genes that are closely related with the S100 family members are identified, and dozens of gene ontology (GO) and biological pathways are enriched. Interestingly, the function and carcinogenesis of 19 closely related genes are currently less studied, but the involved pathways of their and S100 family members are closely related to the development and progression of various tumors. For example, TLR signaling pathway, p73 signaling pathway, p63 signaling pathway, C-MYC signaling pathway, Wnt signaling pathway, p53 signaling pathway, mTOR signaling pathway, c-Met signaling pathway, VEGF and VEGFR signaling network, immune System signaling pathway and CDC42 signaling events signaling pathway. The above results provided a novel insight of S100 family members into OC pathogenesis, which might be helpful for better understanding the heterogeneity and complexity of the molecular biological properties of OC.
5. Conclusion
In conclusion, the mRNA expression levels of S100A1, S100A2, S100A4, S100A5, S100A11, S100A14, and S100A16 were significantly upregulated in patients with OC, and high mRNA expression of S100A1, S100A3, S100A5, S100A6, and S100A13 were significantly correlated with better overall survival, while increased S100A2, S100A7A, S100A10, and S100A11 mRNA expressions were associated with worse prognosis in OC patients. In addition, we also observed that specific S100 members were associated with prognosis when examining patients with different pathological histology, clinical stage, pathological grade, TP53 status, and treatment type. More importantly, S100 family signatures may be useful potential prognostic markers for OC. The associated results may be useful to develop tools to more accurately predict OC prognosis and promote development of S100-targeted inhibitors for the treatment of OC patients. However, due to the limitations of KM database mining, the above conclusions need to be interpreted cautiously in clinical practice. More large-scale and Cox-multivariate analysis are needed to be conducted to better validate the prognostic value of each individual member of the S100 family in patients with OC.
Supplementary Materials: Additional file: Table S1. Interaction and functions enrichment analysis of S100 family members in patients with OC using GeneMANIA database.
Acknowledgments
The authors thank all authors who sharing public database data could be adopted in our study.
Author contributions
Conceptualization: Quan Zhou.
Data curation: Quan Zhou, Hong-Yu Xu.
Formal analysis: Hong-Yu Xu, Hua-Mei Song.
Funding acquisition: Quan Zhou.
Investigation: Quan Zhou, Hua-Mei Song.
Methodology: Hong-Yu Xu, Hua-Mei Song.
Project administration: Quan Zhou.
Resources: Hua-Mei Song.
Software: Hong-Yu Xu, Hua-Mei Song.
Visualization: Hong-Yu Xu.
Writing – original draft: Hua-Mei Song.
Writing – review & editing: Quan Zhou, Hua-Mei Song.
Supplementary Material
Footnotes
Abbreviations: BP = biological processes, CA125 = carbohydrate antigen 125, CC = cellular components, FIGO = the international federation of gynecology and obstetrics, GEPIA = gene expression profiling interactive analysis, GO = gene ontology, HE4 = human epididymal protein 4, HR = hazard ratio, MF = molecular functions, OC = ovarian cancer, TCGA = The Cancer Genome Atlas Program.
How to cite this article: Xu H-Y, Song H-M, Zhou Q. Comprehensive analysis of the expression and prognosis for S100 in human ovarian cancer: A STROBE study. Medicine. 2020;99:47(e22777).
H-YX and H-MS contributed equally to this work.
This study is funded by the Yichang Medical and Health Research Project (No. A17-301-12) to Quan Zhou.
The authors declare that they have no conflict of interest.
The datasets generated during and/or analyzed during the current study are publicly available.
Supplemental digital content is available for this article.
References
- [1].Siegel RL, Miller KD, Jemal A. Cancer statistics, 2019. CA Cancer J Clin 2019;69:7–34. [DOI] [PubMed] [Google Scholar]
- [2].Torre LA, Bray F, Siegel RL, et al. Global cancer statistics, 2012. CA Cancer J Clin 2015;65:87–108. [DOI] [PubMed] [Google Scholar]
- [3].Jin J. Screening for Ovarian Cancer. JAMA 2018;319:624. [DOI] [PubMed] [Google Scholar]
- [4].Kim SJ, Rosen B, Fan I, et al. Epidemiologic factors that predict long-term survival following a diagnosis of epithelial ovarian cancer. Br J Cancer 2017;116:964–71. [DOI] [PMC free article] [PubMed] [Google Scholar]
- [5].Force USPST, Grossman DC, Curry SJ, et al. Screening for Ovarian Cancer: US preventive services task force recommendation Statement. JAMA 2018;319:588–94. [DOI] [PubMed] [Google Scholar]
- [6].Soletormos G, Duffy MJ, Othman Abu Hassan S, et al. Clinical use of cancer biomarkers in epithelial ovarian cancer: updated guidelines from the european group on tumor markers. Int J Gynecol Cancer 2016;26:43–51. [DOI] [PMC free article] [PubMed] [Google Scholar]
- [7].Zimmer DB, Cornwall EH, Landar A, et al. The S100 protein family: history, function, and expression. Brain Res Bull 1995;37:417–29. [DOI] [PubMed] [Google Scholar]
- [8].Bresnick AR, Weber DJ, Zimmer DB. S100 proteins in cancer. Nat Rev Cancer 2015;15:96–109. [DOI] [PMC free article] [PubMed] [Google Scholar]
- [9].Lee J, Wysocki PT, Topaloglu O, et al. Epigenetic silencing of S100A2 in bladder and head and neck cancers. Oncoscience 2015;2:410–8. [DOI] [PMC free article] [PubMed] [Google Scholar]
- [10].Ralhan R, Desouza LV, Matta A, et al. Discovery and verification of head-and-neck cancer biomarkers by differential protein expression analysis using iTRAQ labeling, multidimensional liquid chromatography, and tandem mass spectrometry. Mol Cell Proteomics 2008;7:1162–73. [DOI] [PMC free article] [PubMed] [Google Scholar]
- [11].Liu Y, Cui J, Tang YL, et al. Prognostic roles of mRNA expression of S100 in non-small-cell lung cancer. Biomed Res Int 2018;2018:9815806. [DOI] [PMC free article] [PubMed] [Google Scholar]
- [12].Wang T, Huo X, Chong Z, et al. A review of S100 protein family in lung cancer. Clin Chim Acta 2018;476:54–9. [DOI] [PubMed] [Google Scholar]
- [13].Goh JY, Feng M, Wang W, et al. Chromosome 1q21.3 amplification is a trackable biomarker and actionable target for breast cancer recurrence. Nat Med 2017;23:1319–30. [DOI] [PubMed] [Google Scholar]
- [14].Yen MC, Huang YC, Kan JY, et al. S100B expression in breast cancer as a predictive marker for cancer metastasis. Int J Oncol 2018;52:433–40. [DOI] [PubMed] [Google Scholar]
- [15].Zhang S, Wang Z, Liu W, et al. Distinct prognostic values of S100 mRNA expression in breast cancer. Sci Rep 2017;7:39786. [DOI] [PMC free article] [PubMed] [Google Scholar]
- [16].Huang S, Zheng J, Huang Y, et al. Impact of S100A4 expression on clinicopathological characteristics and prognosis in pancreatic cancer: a meta-analysis. Dis Markers 2016;2016:8137378. [DOI] [PMC free article] [PubMed] [Google Scholar]
- [17].Ji YF, Huang H, Jiang F, et al. S100 family signaling network and related proteins in pancreatic cancer (Review). Int J Mol Med 2014;33:769–76. [DOI] [PubMed] [Google Scholar]
- [18].Wang LJ, Matoso A, Sciandra KT, et al. Expression of S100A4 in renal epithelial neoplasms. Appl Immunohistochem Mol Morphol 2012;20:71–6. [DOI] [PubMed] [Google Scholar]
- [19].Qin F, Song Y, Li Z, et al. S100A8/A9 induces apoptosis and inhibits metastasis of CasKi human cervical cancer cells. Pathol Oncol Res 2010;16:353–60. [DOI] [PubMed] [Google Scholar]
- [20].Liu YF, Liu QQ, Wang X, et al. Clinical significance of S100A2 expression in gastric cancer. Tumour Biol 2014;35:3731–41. [DOI] [PubMed] [Google Scholar]
- [21].Bai Y, Li LD, Li J, et al. Prognostic values of S100 family members in ovarian cancer patients. BMC Cancer 2018;18:1256. [DOI] [PMC free article] [PubMed] [Google Scholar]
- [22].Ma N, Zhu L, Yang L, et al. Prognostic values of S100 family mRNA expression in ovarian cancer. Cancer Biomark 2019;25:67–78. [DOI] [PubMed] [Google Scholar]
- [23].Qian J, Ding F, Luo A, et al. Overexpression of S100A14 in human serous ovarian carcinoma. Oncol Lett 2016;11:1113–9. [DOI] [PMC free article] [PubMed] [Google Scholar]
- [24].Lv Y, Niu Z, Guo X, et al. Serum S100 calcium binding protein A4 (S100A4, metatasin) as a diagnostic and prognostic biomarker in epithelial ovarian cancer. Br J Biomed Sci 2018;75:88–91. [DOI] [PubMed] [Google Scholar]
- [25].Lin M, Xia B, Qin L, et al. S100A7 regulates ovarian cancer cell metastasis and chemoresistance through MAPK signaling and is targeted by miR-330-5p. DNA Cell Biol 2018;37:491–500. [DOI] [PubMed] [Google Scholar]
- [26].Tang Z, Li C, Kang B, et al. GEPIA: a web server for cancer and normal gene expression profiling and interactive analyses. Nucleic Acids Res 2017;45(W1):W98–102. [DOI] [PMC free article] [PubMed] [Google Scholar]
- [27].Gyorffy B, Lanczky A, Szallasi Z. Implementing an online tool for genome-wide validation of survival-associated biomarkers in ovarian-cancer using microarray data from 1287 patients. Endocr Relat Cancer 2012;19:197–208. [DOI] [PubMed] [Google Scholar]
- [28].Aguirre-Gamboa R, Gomez-Rueda H, Martinez-Ledesma E, et al. SurvExpress: an online biomarker validation tool and database for cancer gene expression data using survival analysis. PLoS One 2013;8:e74250. [DOI] [PMC free article] [PubMed] [Google Scholar]
- [29].Franz M, Rodriguez H, Lopes C, et al. GeneMANIA update 2018. Nucleic Acids Res 2018;46(W1):W60–4. [DOI] [PMC free article] [PubMed] [Google Scholar]
- [30].Pathan M, Keerthikumar S, Ang CS, et al. FunRich: An open access standalone functional enrichment and interaction network analysis tool. Proteomics 2015;15:2597–601. [DOI] [PubMed] [Google Scholar]
- [31].Wright NT, Cannon BR, Zimmer DB, et al. S100A1: structure, function, and therapeutic potential. Curr Chem Biol 2009;3:138–45. [DOI] [PMC free article] [PubMed] [Google Scholar]
- [32].Tian T, Li X, Hua Z, et al. S100A1 promotes cell proliferation and migration and is associated with lymph node metastasis in ovarian cancer. Discov Med 2017;23:235–45. [PubMed] [Google Scholar]
- [33].Buckley NE, D’Costa Z, Kaminska M, et al. S100A2 is a BRCA1/p63 coregulated tumour suppressor gene with roles in the regulation of mutant p53 stability. Cell Death Dis 2014;5:e1070. [DOI] [PMC free article] [PubMed] [Google Scholar]
- [34].Wolf S, Haase-Kohn C, Pietzsch J. S100A2 in cancerogenesis: a friend or a foe? Amino Acids 2011;41:849–61. [DOI] [PubMed] [Google Scholar]
- [35].Kumar M, Srivastava G, Kaur J, et al. Prognostic significance of cytoplasmic S100A2 overexpression in oral cancer patients. J Transl Med 2015;13:8. [DOI] [PMC free article] [PubMed] [Google Scholar]
- [36].Golouh R, Cufer T, Sadikov A, et al. The prognostic value of Stathmin-1, S100A2, and SYK proteins in ER-positive primary breast cancer patients treated with adjuvant tamoxifen monotherapy: an immunohistochemical study. Breast Cancer Res Treat 2008;110:317–26. [DOI] [PubMed] [Google Scholar]
- [37].Ohuchida K, Mizumoto K, Miyasaka Y, et al. Over-expression of S100A2 in pancreatic cancer correlates with progression and poor prognosis. J Pathol 2007;213:275–82. [DOI] [PubMed] [Google Scholar]
- [38].Bulk E, Sargin B, Krug U, et al. S100A2 induces metastasis in non-small cell lung cancer. Clin Cancer Res 2009;15:22–9. [DOI] [PubMed] [Google Scholar]
- [39].Masuda T, Ishikawa T, Mogushi K, et al. Overexpression of the S100A2 protein as a prognostic marker for patients with stage II and III colorectal cancer. Int J Oncol 2016;48:975–82. [DOI] [PMC free article] [PubMed] [Google Scholar]
- [40].Tao R, Wang ZF, Qiu W, et al. Role of S100A3 in human hepatocellular carcinoma and the anticancer effect of sodium cantharidinate. Exp Ther Med 2017;13:2812–8. [DOI] [PMC free article] [PubMed] [Google Scholar]
- [41].Liu B, Sun WY, Zhi CY, et al. Role of S100A3 in human colorectal cancer and the anticancer effect of cantharidinate. Exp Ther Med 2013;6:1499–503. [DOI] [PMC free article] [PubMed] [Google Scholar]
- [42].Wheeler LC, Harms MJ. Human S100A5 binds Ca(2+) and Cu(2+) independently. BMC Biophys 2017;10:8. [DOI] [PMC free article] [PubMed] [Google Scholar]
- [43].Wolf R, Mirmohammadsadegh A, Walz M, et al. Molecular cloning and characterization of alternatively spliced mRNA isoforms from psoriatic skin encoding a novel member of the S100 family. FASEB J 2003;17:1969–71. [DOI] [PubMed] [Google Scholar]
- [44].Zhong J, Liu C, Chen YJ, et al. The association between S100A13 and HMGA1 in the modulation of thyroid cancer proliferation and invasion. J Transl Med 2016;14:80. [DOI] [PMC free article] [PubMed] [Google Scholar]
- [45].Donato R, Sorci G, Giambanco I. S100A6 protein: functional roles. Cell Mol Life Sci 2017;74:2749–60. [DOI] [PMC free article] [PubMed] [Google Scholar]
- [46].Wei BR, Hoover SB, Ross MM, et al. Serum S100A6 concentration predicts peritoneal tumor burden in mice with epithelial ovarian cancer and is associated with advanced stage in patients. PLoS One 2009;4:e7670. [DOI] [PMC free article] [PubMed] [Google Scholar]
- [47].Rescher U, Gerke V. S100A10/p11: family, friends and functions. Pflugers Arch 2008;455:575–82. [DOI] [PubMed] [Google Scholar]
- [48].Nymoen DA, Hetland Falkenthal TE, Holth A, et al. Expression and clinical role of chemoresponse-associated genes in ovarian serous carcinoma. Gynecol Oncol 2015;139:30–9. [DOI] [PubMed] [Google Scholar]
- [49].Lokman NA, Pyragius CE, Ruszkiewicz A, et al. Annexin A2 and S100A10 are independent predictors of serous ovarian cancer outcome. Transl Res 2016;171:83–95. e81-82. [DOI] [PubMed] [Google Scholar]
- [50].He H, Li J, Weng S, et al. S100A11: diverse function and pathology corresponding to different target proteins. Cell Biochem Biophys 2009;55:117–26. [DOI] [PubMed] [Google Scholar]
- [51].Tanaka T, Watanabe M, Yamashita K. Potential therapeutic targets of TP53 gene in the context of its classically canonical functions and its latest non-canonical functions in human cancer. Oncotarget 2018;9:16234–47. [DOI] [PMC free article] [PubMed] [Google Scholar]
- [52].Duffy MJ, Synnott NC, Crown J. Mutant p53 as a target for cancer treatment. Eur J Cancer 2017;83:258–65. [DOI] [PubMed] [Google Scholar]
- [53].Semczuk A, Gogacz M, Semczuk-Sikora A, et al. The putative role of TP53 alterations and p53 expression in borderline ovarian tumors - correlation with clinicopathological features and prognosis: a mini-review. J Cancer 2017;8:2684–91. [DOI] [PMC free article] [PubMed] [Google Scholar]
Associated Data
This section collects any data citations, data availability statements, or supplementary materials included in this article.