Abstract
Retinoblastoma (RB) is the commonest malignant tumor of the infant retina. Besides genetic changes, epigenetic events are also considered to implicate the occurrence of RB. This study aimed to identify significantly altered protein-coding genes, DNA methylation, microRNAs (miRNAs), long noncoding RNAs (lncRNAs), and their molecular functions and pathways associated with RB, and investigate the epigenetically regulatory mechanism of DNA methylation modification and non-coding RNAs on key genes of RB via bioinformatics method.
We obtained multi-omics data on protein-coding genes, DNA methylation, miRNAs, and lncRNAs from the Gene Expression Omnibus database. We identified differentially expressed genes (DEGs) using the Limma package in R, discerned their biological functions and pathways using enrichment analysis, and conducted the modular analysis based on protein-protein interaction network to identify hub genes of RB. Survival analyses based on The Cancer Genome Atlas clinical database were performed to analyze prognostic values of key genes of RB. Subsequently, we identified the differentially methylated genes, differentially expressed miRNAs (DEMs) and lncRNAs (DELs), and intersected them with key genes to analyze possible targets of the underlying epigenetic regulatory mechanisms. Finally, the ceRNA network of lncRNAs-miRNAs-mRNAs was constructed using Cytoscape.
A total of 193 DEGs, 74 differentially methylated-DEGs (DM-DEGs), 45 DEMs, 5 DELs were identified. The molecular pathways of DEGs were enriched in cell cycle, p53 signaling pathway, and DNA replication. A total of 10 key genes were identified and found significantly associated with poor survival outcome based on survival analyses, including CDK1, BUB1, CCNB2, TOP2A, CCNB1, RRM2, KIF11, KIF20A, NDC80, and TTK. We further found that hub genes MCM6 and KIF14 were differentially methylated, key gene RRM2 was targeted by DEMs, and key genes TTK, RRM2, and CDK1 were indirectly regulated by DELs. Additionally, the ceRNA network with 222 regulatory associations was constructed to visualize the correlations between lncRNAs-miRNAs-mRNAs.
This study presents an integrated bioinformatics analysis of genetic and epigenetic changes that may be associated with the development of RB. Findings may yield many new insights into the molecular biomarker candidates and epigenetically regulatory targets of RB.
Keywords: retinoblastoma, gene expression, DNA methylation, microRNAs, long noncoding RNA, epigenomics, computational biology
1. Introduction
Retinoblastoma (RB) remains the most frequent and malignant intraocular cancer in childhood worldwide with an incidence rate of 1 per 16,000 to 18,000 live births across population, corresponding to 8000 new cases every year. The mortality from RB is about 70%. The high mortality is related to a lack of early detection and effective therapeutic strategies, especially in underdeveloped countries.[1,2] Early detection and effective treatment are critical for enhancing survival.[3] The biallelic mutation of retinoblastoma tumor suppressor gene RB1 allows disorder of cell cycle and uncontrolled cell division, which is historically considered to be the initial factor in causing most of RB.[4] However, with growing studies identifying that other genomic alterations and epigenetic changes are involved in progression to cancer,[5,6] the logic of single RB1 pathway mutations in cancer is challenged. Therefore, further investigation into the molecular mechanism underlying the tumorigenesis of RB is required to find potential diagnostic and therapeutic targets for RB.
Recent studies on transcriptional profile and epigenetically regulatory mechanisms in RB molecular oncology have provided remarkable and referable foundations for this field. Epigenetic regulation on gene expression mainly includes DNA methylation, histone modifications, non-coding RNA, etc.[7] Aldiri et al indicated that epigenetically modified DNA landscape during retinogenesis is heritable change and is most likely to be disturbed in RB.[8,9] Aberrant DNA methylation altered the expression of many genes in tumor patients. MicroRNAs (miRNAs) are a class of short non-coding RNAs with approximately 22 nucleotides that function as post-transcriptional regulators through targeting mRNAs.[10] Emerging evidence detected altered expression patterns of miRNAs and suggested that the dysregulated miRNAs play the role of either tumor suppressors or oncogenes in RB.[11,12] Long noncoding RNAs (lncRNAs), with more than 200 nucleotides at length, can regulate gene expression in the epigenetic level mainly through binding with miRNAs as sponges or targeting mRNAs or proteins.[13] LncRNAs are involved in diverse cellular processes, such as cell cycle, cell proliferation,[14,15] and play an important role in tumorigenesis, including RB.[13,16] While researches on the expression landscape and specific roles of lncRNA clusters in RB are scarce.
Studies on epigenetic regulation in RB can help to discover targets for designing epigenetic biomarkers or inhibitors to diagnose and treat RB. Understanding how DNA methylation and non-coding RNA regulate protein-coding genes and the molecular pathways in RB is important for the identification of the biomarkers for early detection and therapy. In this article, we for the first time presented the key genes associated with RB and their possible epigenetic modifications. Based on multi-omics data from the Gene Expression Omnibus (GEO) database, we used bioinformatics method to identify differentially expressed genes, DNA methylation, miRNAs, and lncRNAs between RB and healthy controls, discern altered biological functions and molecular pathways associated with RB, and analyze the epigenetically regulatory mechanism of DNA methylation modification and non-coding RNAs on gene expression in RB. The findings of this study may shed new light on the pathogenesis of RB and provide unique ideas on the biomarker candidates for diagnosis and treatment strategies.
2. Materials and methods
2.1. Multi-omics microarray data collection and preprocessing
The multi-omics microarray data on protein-coding gene, DNA methylation, miRNA, and lncRNA expression were obtained from the National Center of Biotechnology Information (NCBI) GEO database (https://www.ncbi.nlm.nih.gov/geo/). Four independent RB gene expression profiles (GSE97508, GSE110811, GSE24673, GSE59983) contained 119 RB samples and 8 retinal samples from healthy control (HC) persons. The DNA methylation microarray GSE57362 contained 57 RB samples and 12 HC samples. The miRNA expression microarray GSE39105 contained 30 RB samples and 6 HC samples. The LncRNA expression data screened from dataset GSE110811 contained 28 RB samples and 3 HC samples. A summary of the datasets used in the present study is shown in Table 1. Because the data was obtained from the online public database, the ethical review was not necessary.
Table 1.
Datasets used in the present study.
| GEO accession number | Data type | Platform | HC vs RB |
| GSE97508 | mRNA expression profiling | GPL15207: Affymetrix Human Gene Expression Array | 3 vs 6 |
| GSE110811 | mRNA and lncRNA expression profiling | GPL16686: Affymetrix Human Gene 2.0 ST Array | 3 vs 28 |
| GSE24673 | mRNA expression profiling | GPL6244: Affymetrix Human Gene 1.0 ST Array | 2 vs 9 |
| GSE59983 | mRNA expression profiling | GPL13158: Affymetrix HT HG-U133+ PM Array Plate | 0 vs 76 |
| GSE57362 | DNA methylation profiling | GPL13534: Illumina HumanMethylation450 BeadChip | 12 vs 57 |
| GSE39105 | microRNA expression profiling | GPL15765: Life Technologies Human miRNA expression assays 450-plex | 6 vs 30 |
GEO = Gene Expression Omnibus; HC vs RB = number of healthy control persons vs retinoblastoma persons.
The data mining techniques and statistical analysis of this study were based on Bioconductor Packages (http://www.bioconductor.org/) of R software (version 3.6.1; https://www.r-project.org/). The gene probes in raw data of transcriptome microarray were turned into readable gene symbols according to the platforms annotation information. The probe that did not match the gene symbol was removed and the average expression values were calculated and adopted if multiple probes correspond to one given gene.
2.2. Protein-coding genes microarray analysis
The protein-coding gene expression data were extracted from 4 gene expression datasets mentioned above. These datasets were merged and then were performed background adjustment and batchnormalization using sva package of R to remove batch effects and other unwanted noise for the subsequent analysis.[17] The identification of differentially expressed genes (DEGs) between RB and HC samples was conducted using the limma package of R[18] and then visualized by volcano plot using ggplot2 package of R. The adjusted P value (adj P value) was calculated using false discovery rate method to correct the limitations of false-positives. The statistically significant cut-off values were defined as |log2 fold change (FC)| > 1.5 and adj P value < .05. After that, the clustering analysis was applied to highlight the expression patterns of significant DEGs among different samples with pheatmap package of R.
The clusterProfiler and DOSE packages of R were applied to implement the Gene Ontology (GO) and Kyoto Encyclopedia of Genes and Genomes (KEGG) analyses of DEGs,[19] with the cut-off standard of adj P value <.05. A protein–protein interaction (PPI) network of the DEGs were designed based on the Search Tool for the Retrieval of Interacting Genes (STRING) database (https://string-db.org/) with a confidence score ≥0.7 and visualized using Cytoscape software (version 3.7.2). The modular analysis of the PPI network was implemented using the MCODE plugin in Cytoscape (version 3.7.2) to find the hub genes of RB with the standard of the degree cut-off = 2, node score cut-off = 0.2, k-core = 2, and maximum depth = 100. The KEGG analysis of hub genes was conducted to figure out the molecular pathways associated with RB. The top 10 hub genes were determined based on the degree of connection in the PPI network. Furthermore, the survival analysis based on the top 10 hub genes was performed using expression and follow-up data on 88 neuroblastoma cases from The Cancer Genome Atlas (TCGA; Versteeg database; http://www.cbioportal.org) database to identify the possible key genes and validate their prognostic role in tumor.
2.3. DNA Methylation microarray analysis
The level of methylation was measured with beta values in raw data from Illumina Human Methylation 450K array. Firstly, the multidimensional scaling plot generated by the R was examined to spot cases of outlying samples and the data were normalized using watermelon package of R.[20] Subsequently, the differentially methylated sites (DMSs) and regions (DMRs) were detected using minfi package of R.[21] Significant DMSs were defined as adj P value <.05, while significant DMRs were defined as mean methylation difference >0.2. DMSs and DMRs were manifested and annotated based on the IlluminaHumanMethylation450kanno.ilmn12.hg19 library.[22] Then, DMRs were mapped to differentially methylated genes (DMGs) with wANNOVAR (http://wannovar.wglab.org/).[23] To analyze the DMGs epigenetic regulation on DEGs in RB, the differentially methylated-differentially expressed genes (DM-DEGs) were defined as the intersection of DMGs and DEGs using Venn diagram and employed for subsequent clustering analysis in GSE97508, GSE110811, GSE24673, and GSE59983 using pheatmap package of R. Subsequently, the GO analysis and KEGG analysis of DM-DEGs were performed using clusterProfiler and DOSE packages of R.
2.4. MicroRNA microarray analysis
The normalization of miRNA expression data and identification of differentially expressed miRNAs (DEMs) between RB tissues and HC retinal tissues was carried out using limma package of R. The statistically significant cut-off values were defined as | FC| > 2 and adj P value <.05. After that, clustering analysis of DEMs was performed using the pheatmap package of R. The GO and KEGG analyses of DEMs were performed using the FunRich software (version 3.1.3) with the cut-off standard of adj P value <.05.
To further identify the epigenetically regulatory targets of DEMs, we predicted the target genes and transcription factors (TFs) using the FunRich (version 3.1.3) with the standard of adj P value <.05. To analyze the DEMs epigenetic regulation on DEGs in RB, the Venn diagram was applied for the intersection of DEGs and the target genes of DEMs. The genes from the intersection set were then used to construct the miRNA-target network using Cytoscape (version 3.7.2).
2.5. LncRNA microarray analysis
The differentially expressed lncRNAs (DELs) between RB samples and HC retinal samples were identified using limma package of R. The cut-off criteria were |FC| > 1 and adj P value <.05. The clustering analysis of DELs was performed using the pheatmap package of R. To identify the epigenetically regulatory targets of DELs in RB, these DELs were submitted to the miRcode database (http://www.mircode.org/) for target miRNAs;[24] the latter was then employed for identifying target genes using FunRich (version 3.1.3). To analyze the DELs epigenetic regulation on DEGs in RB, the Venn diagram was applied for the intersection of DEGs and these target genes. Subsequently, based on the genes from the intersection set, the ceRNA network of lncRNAs-miRNAs-mRNAs interaction was constructed with Cytoscape (version 3.7.2) to visualize the targeted relationship among the differentially expressed RNAs in RB.
3. Results
3.1. Identification of DEGs in RB and functional analysis
A total of 193 common DEGs identified among GSE97508, GSE110811, GSE24673, and GSE59983 between RB and HC retinal samples, including 123 up-regulated and 70 down-regulated DEGs, are exhibited in the volcano plot (Fig. 1A). Significant differences were discerned in the DEGs between RB and HC groups by the cluster analysis, as shown in the heatmap (Fig. 1B). GO analysis results of DEGs containing Biological Process (BP), Cellular Component (CC), and Molecular Function (MF) terms are presented in Figure 1C. The biological functions of DEGs were significantly enriched in mitotic nuclear division, cell cycle checkpoint, DNA replication origin binding, etc. KEGG pathway enrichment analysis detected 4 significantly enriched pathways of DEGs, including cell cycle, phototransduction, p53 signaling pathway, and nitrogen metabolism, as shown in Table 2.
Figure 1.
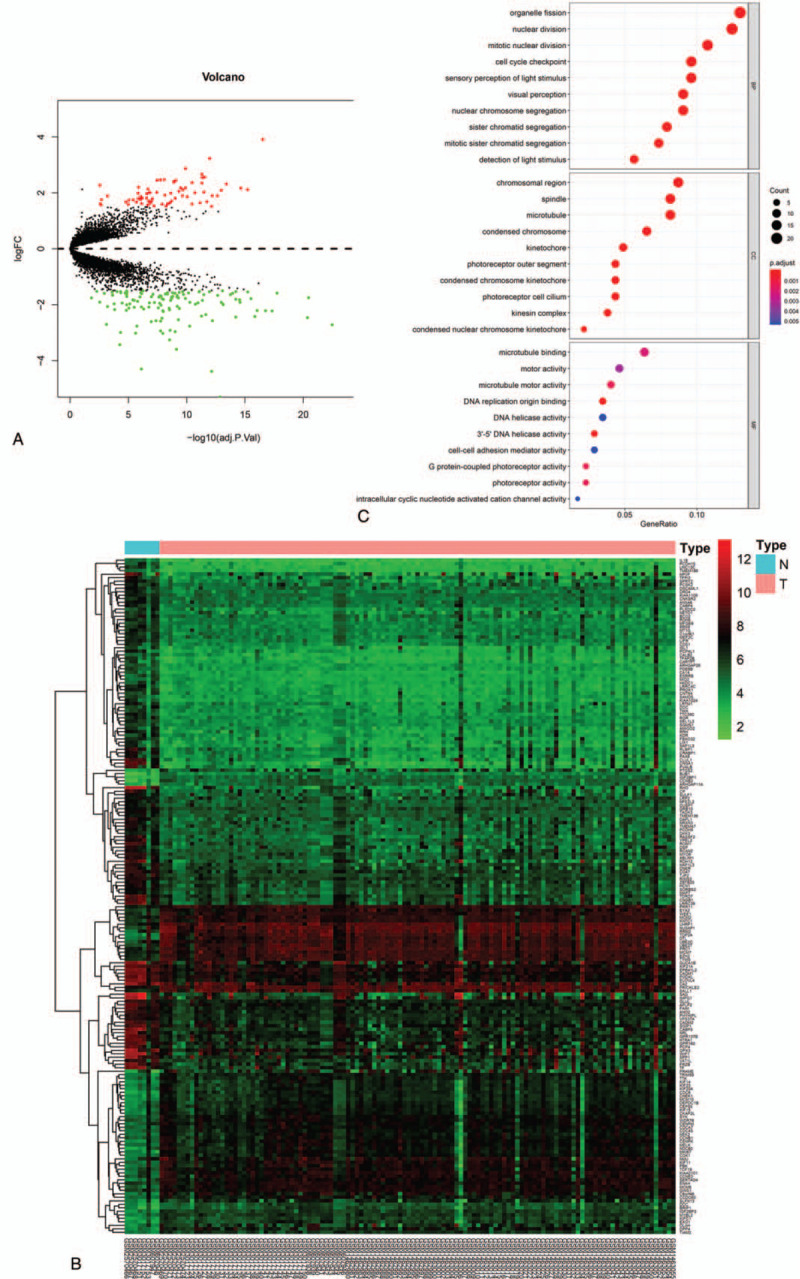
The differentially expressed genes (DEGs) and Gene Ontology (GO) terms. (A) Volcano plot of DEGs in GSE97508, GSE110811, GSE24673, and GSE59983. (B) The heatmap of DEGs (|log2 fold change| > 1.5; adjusted P value <.05). (C) GO analysis based on DEGs. BP = biological process, MF = molecule function, CC = cellular component.
Table 2.
The KEGG pathway analysis of DEGs.
| Pathway ID | Pathway name | Count | Adj P value | Genes |
| hsa04110 | Cell cycle | 13 | 6.64E-08 | CCNB2, MCM6, BUB1, CDC6, WEE1, CDK1, CHEK1, MCM7, MCM2, CDC45, TTK, CCNE2, CCNB1 |
| hsa04744 | Phototransduction | 5 | .000745 | RHO, CNGA1, CNGB1, SAG, GUCA1B |
| hsa04115 | p53 signaling pathway | 6 | .005453 | CCNB2, RRM2, CDK1, CHEK1, CCNE2, CCNB1 |
| hsa00910 | Nitrogen metabolism | 3 | .027305 | CA14, GLUL, CA2 |
KEGG = Kyoto Encyclopedia of Genes and Genomes, DEGs = differentially expressed genes, Count: the number of enriched DEGs, Adj P value = adjusted P value, CCN = cyclin, MCM = minichromosome maintenance complex component, BUB1 = BUB1 mitotic checkpoint serine/threonine kinase, CDC = cell division cycle, WEE1 = WEE1 G2 checkpoint kinase, CDK1 = cyclin dependent kinase 1, CHEK1 = checkpoint kinase 1, TTK = TTK protein kinase, RHO = rhodopsin, CNGA1 = cyclic nucleotide gated channel subunit alpha 1, CNGB1 = cyclic nucleotide gated channel subunit beta 1, SAG = S-antigen visual arrestin, GUCA1B = guanylate cyclase activator 1B, RRM2 = ribonucleotide reductase regulatory subunit M2, CA = carbonic anhydrase, GLUL = glutamate-ammonia ligase.
PPI network of these DEGs contained 139 nodes and 720 interactions (Fig. 2A). Further modular analysis based on the PPI network identified 3 sub-networks (Fig. 2B). The top module, with the highest score (score: 30.312), was composed of 33 DEGs which were defined as hub genes (Table 3). The subsequent KEGG analysis revealed that hub genes may cause tumorigenesis of RB through the following pathways: cell cycle, p53 signaling pathway, cellular senescence, DNA replication, pyrimidine metabolism, etc. (Table 4). The top 10 hub genes with the greatest degree of interaction were screened, including CDK1, BUB1, CCNB2, TOP2A, CCNB1, RRM2, KIF11, KIF20A, NDC80, and TTK. Their full names, abbreviations, also known as, and expression patterns are shown in Table 5. Survival analysis of the top 10 hub genes showed that their higher expression levels correlated with worse prognosis in neuroblastoma, another embryonal malignancy with similar histology to RB, indicating that these genes are important indicative biomarkers in tumors and that targeting them may be an effective tumor therapy (Fig. 3). Therefore, the top 10 hub genes were defined as key genes.
Figure 2.
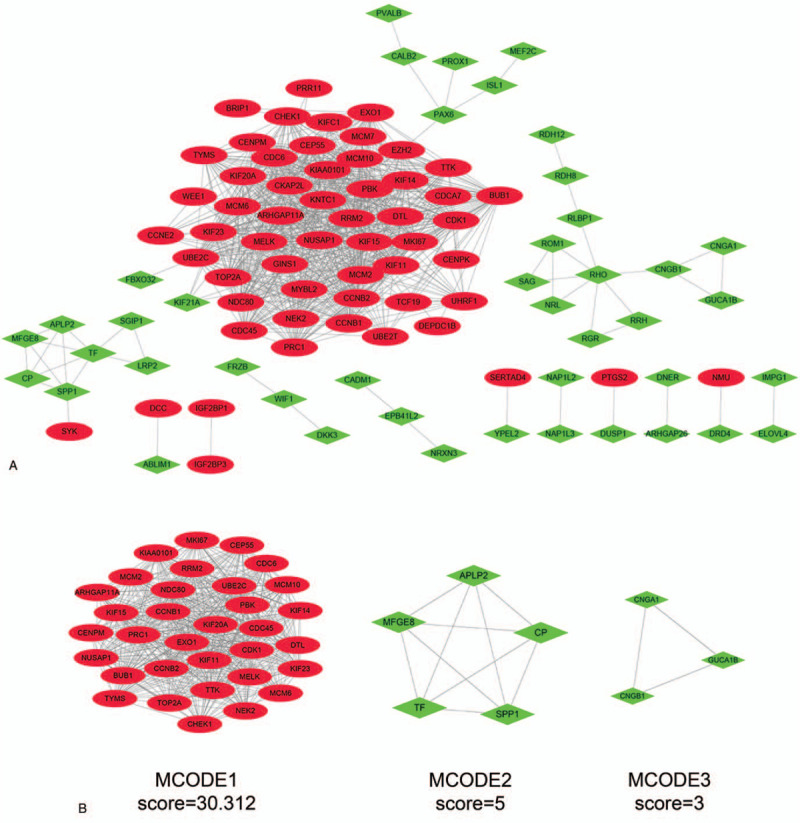
The protein–protein interaction (PPI) network of the DEGs and modular analysis. (A) PPI network of DEGs using Cytoscape. Red oval: upregulated DEGs; green diamond: downregulated DEGs. (B) Modular analysis of the PPI network identified 3 sub-networks using Cytoscape.
Table 3.
Three modules from the PPI network satisfied the criteria of MCODE scores > = 3 and number of nodes > = 3.
| Cluster | Score | Nodes | Edge | Node IDs |
| 1 | 30.312 | 33 | 485 | CEP55, KIAA0101, ARHGAP11A, MCM2, CDK1, CCNB2, MCM6, KIF11, CCNB1, BUB1, MCM10, CDC6, CDC45, UBE2C, NDC80, TTK, KIF23, CHEK1, EXO1, KIF20A, PBK, NUSAP1, TOP2A, KIF15, NEK2, PRC1, KIF14, RRM2, DTL, TYMS, CENPM, MKI67, MELK |
| 2 | 5 | 5 | 10 | SPP1, APLP2, TF, MFGE8, CP |
| 3 | 3 | 3 | 3 | CNGA1, CNGB1, GUCA1B |
PPI = protein, protein interaction, MCODE, Molecular Complex Detection, Score = density × no. of nodes. CEP55, centrosomal protein 55, KIAA0101 = PCNA clamp associated factor, ARHGAP11A = Rho GTPase activating protein 11A, MCM = minichromosome maintenance complex component, CDK1 = cyclin dependent kinase 1; CCN = cyclin; KIF = kinesin family member; BUB1 = BUB1 mitotic checkpoint serine/threonine kinase; MCM10 = minichromosome maintenance 10 replication initiation factor; CDC = cell division cycle; UBE2C = ubiquitin conjugating enzyme E2 C; NDC80 = NDC80 kinetochore complex component; TTK = TTK protein kinase; CHEK1 = checkpoint kinase 1; EXO1 = exonuclease 1, PBK = PDZ binding kinase, NUSAP1 = nucleolar and spindle associated protein 1, TOP2A = DNA topoisomerase II alpha, NEK2 = NIMA related kinase 2, PRC1 = protein regulator of cytokinesis 1, RRM2 = ribonucleotide reductase regulatory subunit M2, DTL = denticleless E3 ubiquitin protein ligase homolog, TYMS = thymidylate synthetase, CENPM = centromere protein M, MKI67 = marker of proliferation Ki = 67, MELK = maternal embryonic leucine zipper kinase, SPP1 = secreted phosphoprotein 1, APLP2 = amyloid beta precursor like protein 2, TF = transferrin, MFGE8 = milk fat globule EGF and factor V/VIII domain containing, CP = ceruloplasmin, CNGA1 = cyclic nucleotide gated channel subunit alpha 1, CNGB1 = cyclic nucleotide gated channel subunit beta 1, GUCA1B = guanylate cyclase activator 1B.
Table 4.
KEGG pathway analysis of hub genes.
| Pathway ID | Name | Count | Adj P value | Genes |
| hsa04110 | Cell cycle | 10 | 4.62E-14 | MCM2, CDK1, CCNB2, MCM6, CCNB1, BUB1, CDC6, CDC45, TTK, CHEK1 |
| hsa04115 | p53 signaling pathway | 5 | 1.13E-06 | CDK1, CCNB2, CCNB1, CHEK1, RRM2 |
| hsa04914 | Progesterone, mediated oocyte maturation | 4 | 0.000129073 | CDK1, CCNB2, CCNB1, BUB1 |
| hsa04114 | Oocyte meiosis | 4 | 0.000264829 | CDK1, CCNB2, CCNB1, BUB1 |
| hsa04218 | Cellular senescence | 4 | 0.000502229 | CDK1, CCNB2, CCNB1, CHEK1 |
| hsa05170 | Human immunodeficiency virus 1 infection | 4 | 0.001221954 | CDK1, CCNB2, CCNB1, CHEK1 |
| hsa03030 | DNA replication | 2 | 0.003460544 | MCM2, MCM6 |
| hsa00240 | Pyrimidine metabolism | 2 | 0.007484262 | RRM2, TYMS |
Adj P- value = adjusted P-value, BUB1 = BUB1 mitotic checkpoint serine/threonine kinase, CDK1 = cyclin dependent kinase 1, CCN = cyclin, CHEK1 = checkpoint kinase 1, CDC = cell division cycle, Count: the number of enriched genes, KEGG = Kyoto Encyclopedia of Genes and Genomes, MCM = minichromosome maintenance complex component, RRM2 = ribonucleotide reductase regulatory subunit M2, TTK = TTK protein kinase, TYMS = thymidylate synthetase.
Table 5.
Top 10 hub genes with the highest degree of interaction in retinoblastoma.
| Gene ID | Gene description | Expression pattern | Degree |
| CDK1 | Cyclin dependent kinase 1 | Up | 46 |
| BUB1 | BUB1 mitotic checkpoint serine/threonine kinase | Up | 44 |
| CCNB2 | Cyclin B2 | Up | 43 |
| TOP2A | DNA topoisomerase II alpha | Up | 42 |
| CCNB1 | Cyclin B1 | Up | 41 |
| RRM2 | Ribonucleotide reductase regulatory subunit M2 | Up | 40 |
| KIF11 | Kinesin family member 11 | Up | 39 |
| KIF20A | Kinesin family member 20A | Up | 39 |
| NDC80 | NDC80 kinetochore complex component | Up | 38 |
| TTK | TTK protein kinase | Up | 38 |
Up = upregulated genes.
Figure 3.
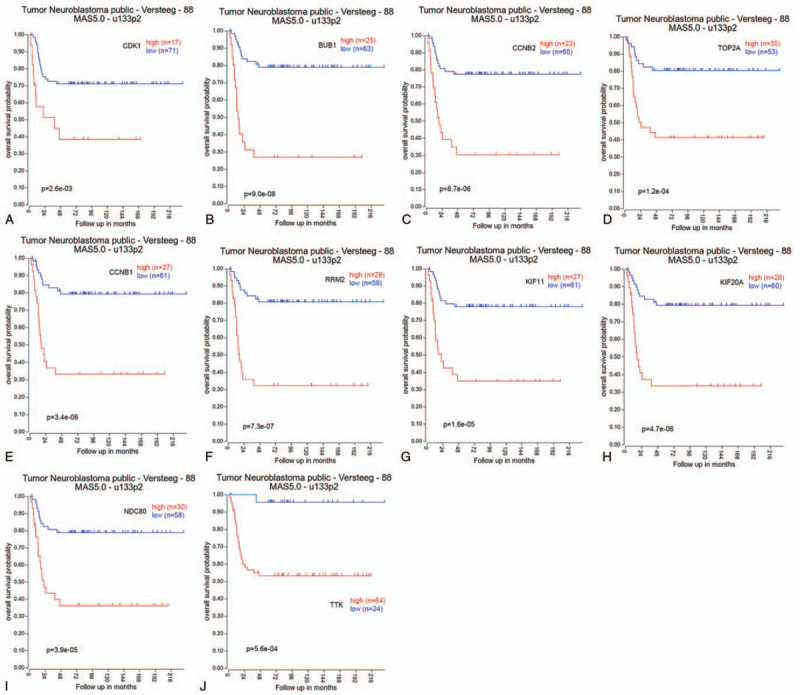
Kaplan–Meier survival curves of key genes in neuroblastoma patients based on The Cancer Genome Atlas database. Overall survival by low and high expression of (A) Cyclin dependent kinase 1, (B) BUB1 mitotic checkpoint serine/threonine kinase, (C) Cyclin B2, (D) DNA topoisomerase II alpha, (E) Cyclin B1, (F) Ribonucleotide reductase regulatory subunit M2, (G) Kinesin family member 11, (H) Kinesin family member 20A, (I) NDC80 kinetochore complex component, and (J) TTK protein kinase.
3.2. The epigenetically regulatory function of altered DNA methylation
A total of 4335 DMGs were screened out based on the GSE57362 methylation profile (Suppl 1, Supplemental Digital Content, which shows the details of all the DMGs). Subsequently, a total of 74 DM-DEGs were found in Venn diagram (Fig. 4A). Two of them were hub genes, namely MCM6 and KIF14. These 74 DM-DEGs were drawn on a heatmap and well distinguished RB from HC samples (Fig. 4B).
Figure 4.
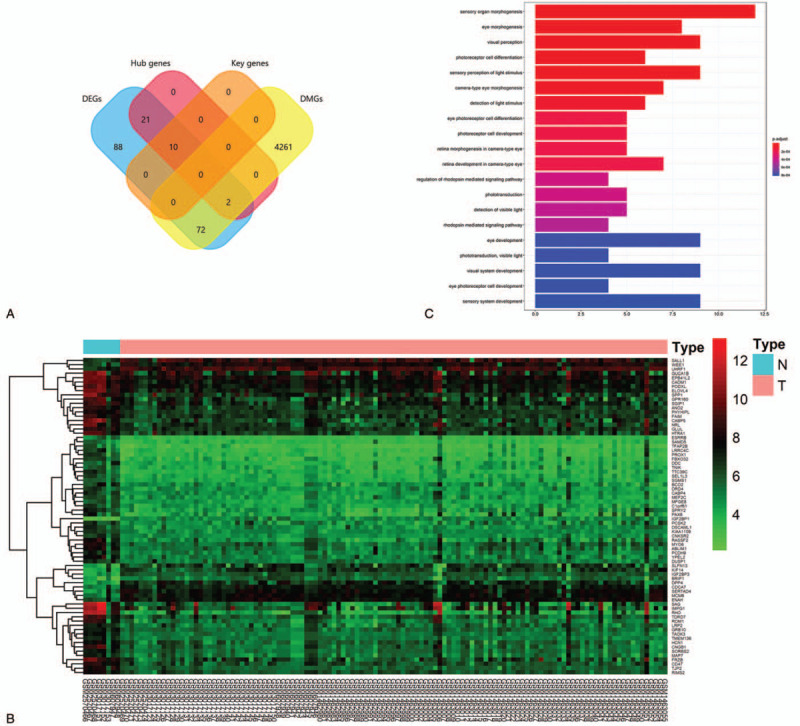
The differentially methylated-differentially expressed genes (DM-DEGs) and Gene Ontology (GO) terms. (A) The intersection of 193 differentially expressed genes, 4335 differentially methylated genes, 33 hub genes, and 10 key genes shown in Venn diagram using FunRich. (B) The heatmap of DM-DEGs in GSE97508, GSE110811, GSE24673, and GSE59983. (C) GO analysis of DM-DEGs in the biological processes.
To get an insight into the biological functions that these DM-DEGs exert in RB progression, GO and KEGG analysis of functions and signaling pathways were performed. The results of GO analysis showed that BP terms were mainly enriched in sensory organ morphogenesis, eye morphogenesis, visual perception, photoreceptor cell differentiation, and sensory perception of light stimulus (Fig. 4C). Besides, 1 significantly enriched molecular pathway was phototransduction.
3.3. The epigenetically regulatory function of DEMs
A total of 45 DEMs, including 24 upregulated DEMs and 21 downregulated DEMs, were identified and displayed in volcano plot and heatmap (Fig. 5A and5B). The GO analysis results of DEMs were exhibited as pie charts (Fig. 6). The BP terms were mainly enriched in “regulation of nucleobase, nucleoside, nucleotide ,and nucleic acid metabolism”, “transport”, “signal transduction”, and “cell communication”; The CC terms were mainly enriched in “nucleus”, “cytoplasm”, “lysosome”, and “protein phosphatase type 2A complex”; The MF terms were mainly enriched in “transcription factor activity”, “protein serine/threonine kinase activity”, “GTPase activity”, and “cytoskeletal protein binding”.
Figure 5.
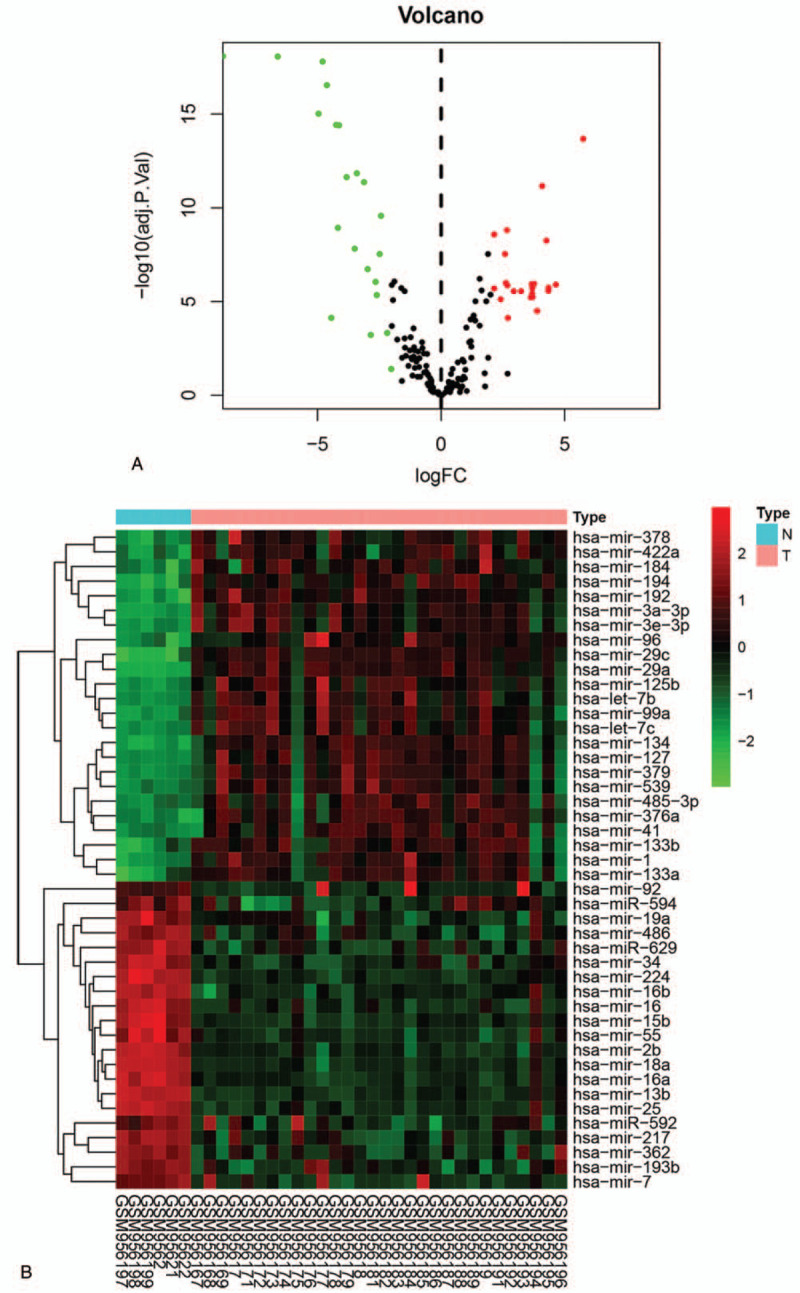
The differentially expressed microRNAs (DEMs) and cluster analysis results. (A) Volcano plot of DEMs in GSE39105. (B) The heatmap of DEMs (|log2 fold change| > 2; adjusted P value <.05).
Figure 6.
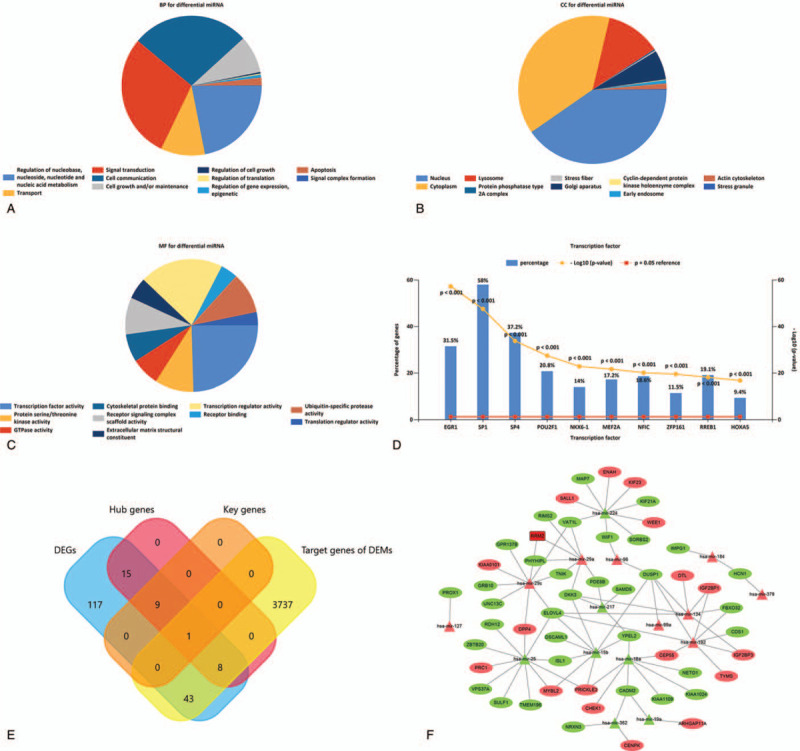
Biological function of differentially expressed microRNAs (DEMs). Gene Ontology analysis of DEMs in the (A) biological process, (B) cellular component, and (C) molecule function. (D) The top 10 most significant transcription factors predicted by FunRich. (E) The intersection of 193 differentially expressed genes (DEGs), 3,789 target genes of DEMs, 33 hub genes, and 10 key genes shown in Venn diagram using FunRich. (F) The microRNA-targets network showing the target DEGs of DEMs. Ovals: mRNAs; triangles: microRNAs; rectangle: key gene; red: upregulated RNAs; green: downregulated RNAs.
Then, 203 TFs and 3789 target genes of DEMs were predicted using the FunRich (version 3.1.3) (Suppl 2 and 3 Supplemental Digital Content, which shows the details of all the transcription factors and target gene, respectively). The top 10 most significant TFs were early growth response (EGR)1, Sp1 transcription factor (SP1), SP4, POU class 2 homeobox (POU2F)1, NK6 homeobox 1(NKX6-1), myocyte enhancer factor (MEF)2A, nuclear factor I C(NFIC), zinc finger and BTB domain containing 14 (ZFP161), ras responsive element binding protein (RREB)1, and homeobox (HOX)A5 (Fig. 6D). A total of 52 genes in the intersection of the 3789 target genes of DEMs and 193 DEGs were found in Venn diagram (Fig. 6E). Based on these 52 intersected genes, the miRNA-targets network, including 68 nodes and 84 interactions, was constructed using Cytoscape (version 3.7.2) (Fig. 6F). Of 52 intersected genes, 9 were hub genes, including KIF23, centrosomal protein (CEP)55, checkpoint kinase (CHEK)1, protein regulator of cytokinesis (PRC)1, PCNA clamp associated factor (PCLAF), RRM2, thymidylate synthetase (TYMS), denticleless E3 ubiquitin protein ligase homolog (DTL), and Rho GTPase activating protein 11A (ARHGAP11A). Among them, RRM2 was one of the key genes.
3.4. The epigenetically regulatory function of DELs
The DELs were identified based on GSE110811 between RB and HC samples. Four DELs, namely C3orf35, KIAA0087, MEG3, and SLC6A1-AS1, were found to be downregulated significantly, while MIR7-3HG was upregulated in RB (Fig. 7A). A total of 184 target miRNAs of DELs were found based on the miRcode database (Suppl 4, Supplemental Digital Content, which shows the target miRNAs of DELs). A total of 4743 target genes of these 184 miRNAs were found using FunRich (version 3.1.3) (Suppl 5, Supplemental Digital Content, which shows the details of the 4743 target genes). A total of 68 genes in the intersection of the 4743 target genes and 193 DEGs were found in Venn diagram (Fig. 7B). Of these 68 intersected genes, 8 genes were hub genes, including ARHGAP11A, maternal embryonic leucine zipper kinase (MELK), PCLAF, CEP55, TTK, KIF23, RRM2, and CDK1; 3 were key genes, including TTK, RRM2, and CDK1. Based on the intersected genes, the ceRNA network of lncRNAs-miRNAs-mRNAs interaction was generated using Cytoscape (version 3.7.2), which consisted of 222 regulatory associations including 73 lncRNA-miRNA pairs and 149 mRNA-miRNA pairs (Fig. 7C; Suppl 6, Supplemental Digital Content, which shows the 73 lncRNA-miRNA pairs and 149 mRNA-miRNA pairs).
Figure 7.
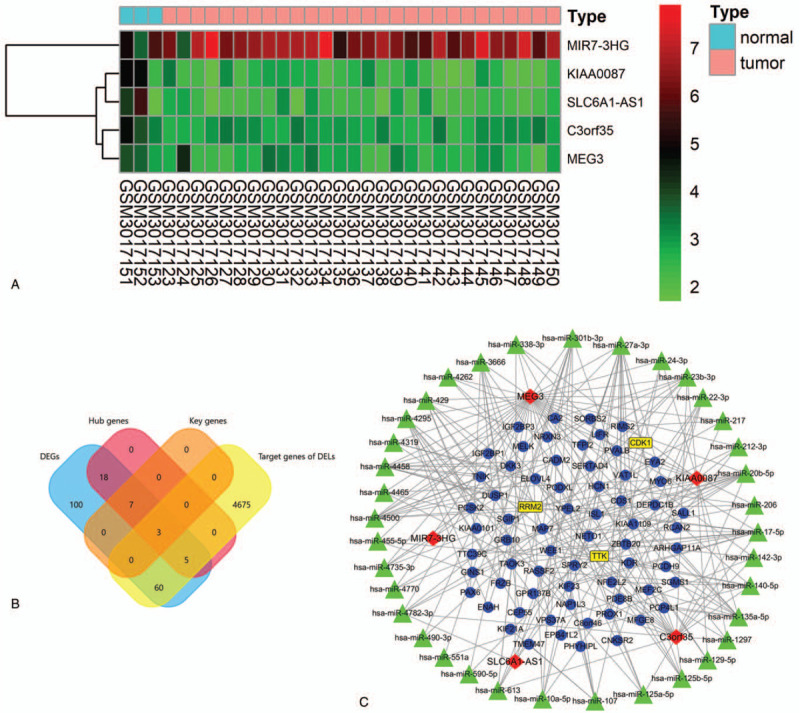
The differentially expressed lncRNAs (DELs) and regulatory relations. (A) The heatmap of DELs in GSE110811 (|log2 fold change| > 1; adjusted P value <.05). (B) The intersection of 193 differential expressed genes, 4743 target genes of DELs, 33 hub genes, and 10 key genes shown in Venn diagram using FunRich. (C) The ceRNA network of lncRNAs-microRNAs-mRNAs network. Red diamonds: lncRNAs; green triangles: microRNAs; blue circles: mRNAs; yellow rectangle: key genes.
4. Discussion
As the occurrence and proliferation of RB are implicated by complex epigenetic and genetic events,[25] it is necessary to explore the regulatory mechanisms underlying the action of DNA methylation, miRNAs, and lncRNAs on gene expression in RB. In this study, we firstly identified key genes and pathways associated with RB and then analyze the epigenetically regulatory mechanism of DNA methylation modification and non-coding RNAs on the expression of key genes via bioinformatics method.
We found 193 DEGs (123 upregulated genes and 70 downregulated genes) based on 4 datasets and identified ten key genes, including CDK1, BUB1, CCNB2, TOP2A, CCNB1, RRM2, KIF11, KIF20A, NDC80, and TTK, which may promote the development of potential biomarkers for the diagnosis, prognosis, or therapy of RB. Among these genes, CDK1, BUB1, CCNB2, CCNB1, RRM2, KIF11, KIF20A, NDC80, and TTK play important regulatory roles in cell cycle and mitosis, and TOP2A and RRM2 are closely associated with the functions of DNA synthesis, transcription, and replication. Tumorigenesis may accompany or result from the abnormal expression of these protein-coding genes. Similar with RB, neuroblastoma is another pediatric embryonal malignancy of the sympathetic nervous system,[2] caused by aberrant amplification of oncogene MYCN.[26,27] Here, we suggest that activation of these ten key genes is strongly correlated with the poor prognosis of neuroblastoma patients. Although neuroblastoma and RB are 2 distinct cancers,[28] activation of these genes was observed in both cases and exhibited potential clinical significance. Therefore, it is well worth further excavation of these genes for diagnostic biomarkers and therapeutic targets of neuroblastoma and RB. In this paper, the GO and KEGG analyses based on DEGs and hub genes showed that mitotic nuclear division, cell cycle checkpoint, DNA replication origin binding, and p53 signaling pathway were significantly affected in RB. These enriched pathways have been validated to exert essential functions in cell proliferation, apoptosis, and invasion in various human cancers. For example, activation of the p53 signaling pathway can bring about cell cycle arrest and transcriptional inhibition of many cell cycle genes indirectly.[29]
DNA methylation is one of the most common epigenetic events, which can modify gene expression stably.[30] In this study, we identified a series of 74 genes that were both differentially methylated and expressed between RB and HC samples. Of note, MCM6 and KIF14, as 2 hub genes, showed significantly methylated, indicating potential novel mechanisms of their aberrant overexpression in RB. MCM6, a component of minichromosome maintenance (MCM) protein complex, functions to initiate DNA replication and unwinding based on its replicative helicase activity. It has been demonstrated that the overexpression of MCM6 can promote tumorigenesis,[31] also seen in the present study. Further study is needed to identify how DNA methylation regulated MCM6 expression to affect the development of RB. Similarly, KIF14 serves as an oncogene in RB. The aberrant DNA methylation was one of multiple mechanisms of its upregulated expression.[32,33] Our finding offers novel targets for therapeutic interventions to degrade the KIF14 level in RB.
MiRNAs are powerful regulators of gene expression.[34] In this study, a total of 45 DEMs were detected between the RB and HC samples. Nine hub genes were found to be epigenetically regulated by DEMs, most of which were considered to play an oncogenesis role in tumor.[35–39] Among them, RRM2 is one of the key genes identified in our study and exerts oncogenic functions by involving DNA synthesis and DNA repair.[40] According to the analysis, the overexpression of miRNA29A and miRNA29C upregulated RRM2 expression, indicating that miRNA29A(C)/RRM2 axis may play a role in RB progress.
Accumulating studies have highlighted the regulatory role of lncRNAs in genetic transcription and translation.[41] According to the results of our analysis, the dysregulation of DELs, including C3orf35, KIAA0087, MEG3, SLC6A1-AS1, and MIR7-3HG, may be associated with RB. The tumor suppressor MEG3 functions to inhibit tumor cell proliferation by regulating the expression of target genes of the tumor suppressor p53.[42] We subsequently constructed a ceRNA network based on DELs-miRNA and miRNA-DEGs pairs, which included 222 regulatory associations. The 2 DELs, MEG3, and C3orf35, were found to indirectly regulate the expression of key genes TTK, RRM2, and CDK1 by miRNAs (for example, miRNA-140-5p,[43] and miRNA-212-3p[44]), that implied new clues on mechanisms of RB tumorigenesis and developing.
Overall, our results elucidate the potential functions of significantly altered genes, DNA methylation, miRNAs, and lncRNAs in RB. The findings would lay the foundation for future validation through in vitro experiments, such as Western blot and polymerase chain reaction assays using retinal tissue. However, several limitations existed in this study. First, our study lacked cell or animal experiments designed to verify the expression patterns, biological functions, and mechanisms of epigenetic regulation. Second, due to the lack of follow-up information of RB patients, the prognostic value of key genes was evaluated indirectly based on neuroblastoma rather than RB. Third, unlike other cancers, the corresponding normal tissues of RB in GEO database were insufficient. The wide disparity of the sample size between RB and normal controls may bring potential bias in the analysis of protein-coding gene expression data.
In conclusion, the present study identified 193 DEGs, 10 key genes, 74 DM-DEGs, 45 DEMs, 5 DELs, as well as their biological functions in RB based on multi-omics data by integrated bioinformatics analysis. The hub genes MCM6 and KIF14 were found differentially methylated; key gene RRM2 was found to be targeted by DEMs; key genes TTK, RRM2, and CDK1 were found to be indirectly regulated by DELs. These epigenetic regulations on key genes may play an important role in RB development. Additionally, the ceRNA network was constructed to better understand the underlying epigenetic regulatory mechanism in RB. These findings offered new insights into the molecular biomarker candidates and epigenetically regulatory targets of RB.
Author contributions
Conceptualization: Yiqiao Xing, Changzheng Chen.
Investigation: Yuyang Zeng, Tao He.
Methodology: Yuyang Zeng, Juejun Liu.
Project administration: Yuyang Zeng, Zongyuan Li, Feijia Xie.
Supervision: Yiqiao Xing, Changzheng Chen.
Writing – review & editing: Yuyang Zeng, Yiqiao Xing, Changzheng Chen.
Supplementary Material
Supplementary Material
Supplementary Material
Supplementary Material
Supplementary Material
Supplementary Material
Footnotes
Abbreviations: APLP2 = amyloid beta precursor like protein 2, ARHGAP11A = Rho GTPase activating protein 11A, BP = biological process, BUB1 = BUB1 mitotic checkpoint serine/threonine kinase, CC = Cellular Component, CCN = cyclin, CDC = cell division cycle, CDK1 = cyclin dependent kinase 1, CEP55 = centrosomal protein 55, CENPM = centromere protein M, CHEK1 = checkpoint kinase 1, CNGA1 = cyclic nucleotide gated channel subunit alpha 1, CNGB1 = cyclic nucleotide gated channel subunit beta 1, CP = ceruloplasmin, DEGs = differentially expressed genes, DELs = differentially expressed lncRNAs, DEMs = differentially expressed miRNAs, DMGs = differentially methylated genes, DMRs = differentially methylated regions, DMSs = differentially methylated sites, DM-DEGs = differentially methylated-differentially expressed genes, DTL = denticleless E3 ubiquitin protein ligase homolog, EGR1 = early growth response 1, EXO1 = exonuclease 1, GEO = Gene Expression Omnibus, GO = Gene Ontology, GUCA1B = guanylate cyclase activator 1B, HOXA5 = homeobox A5, KEGG = Kyoto Encyclopedia of Genes and Genomes, KIAA0101 = PCNA clamp associated factor, KIF = kinesin family member, lncRNAs = long noncoding RNAs, MCM = minichromosome maintenance complex component, MCM10 = minichromosome maintenance 10 replication initiation factor, MFGE8 = milk fat globule EGF and factor V/VIII domain containing, MEF2A = myocyte enhancer factor 2A, MELK = maternal embryonic leucine zipper kinase, miRNAs = microRNAs, MF = Molecular Function, MKI67 = marker of proliferation Ki67, NCBI = National Center of Biotechnology Information, NDC80 = NDC80 kinetochore complex component, NEK2 = NIMA related kinase 2, NFIC = nuclear factor I C, NKX6-1 = NK6 homeobox 1, NUSAP1 = nucleolar and spindle associated protein 1, PBK = PDZ binding kinase, POU2F1 = POU class 2 homeobox 1, PPI = protein-protein interaction, PRC1 = protein regulator of cytokinesis 1, RB = retinoblastoma, RREB1 = ras responsive element binding protein 1, RRM2 = ribonucleotide reductase regulatory subunit M2, SP1 = Sp1 transcription factor, SPP1 = secreted phosphoprotein 1, STRING = Search Tool for the Retrieval of Interacting Genes, TCGA = The Cancer Genome Atlas, TF = transferrin, TFs = transcription factors, TOP2A = DNA topoisomerase II alpha, TTK = TTK protein kinase, TYMS = thymidylate synthetase, UBE2C = ubiquitin conjugating enzyme E2C, ZFP161 = zinc finger and BTB domain containing 14.
How to cite this article: Zeng Y, He T, Liu J, Li Z, Xie F, Chen C, Xing Y. Bioinformatics analysis of multi-omics data identifying molecular biomarker candidates and epigenetically regulatory targets associated with retinoblastoma. Medicine. 2020;99:47(e23314).
This research did not receive any specific grant from funding agencies in the public, commercial, or not-for-profit sectors.
The authors have no conflicts of interests to disclose.
The datasets generated during and/or analyzed during the current study are available from the corresponding author on reasonable request.
Supplemental digital content is available for this article.
References
- [1].Dimaras H, Corson TW, Cobrinik D, et al. Retinoblastoma. Nature reviews disease primers 2015;1:15021. [DOI] [PMC free article] [PubMed] [Google Scholar]
- [2].Dimaras H, Kimani K, Dimba EA, et al. Retinoblastoma. Lancet (London, England) 2012;379:1436–46. [DOI] [PubMed] [Google Scholar]
- [3].Fabian ID, Onadim Z, Karaa E, et al. The management of retinoblastoma. Oncogene 2018;37:1551–60. [DOI] [PubMed] [Google Scholar]
- [4].Berry JL, Polski A, Cavenee WK, et al. The story: characterization and cloning of the first tumor suppressor gene. Genes 2019;10: [DOI] [PMC free article] [PubMed] [Google Scholar]
- [5].Soliman SE, Racher H, Zhang C, et al. Genetics and molecular diagnostics in retinoblastoma--an update. Asia Pac J Ophthalmol (Phila) 2017;6:197–207. [DOI] [PubMed] [Google Scholar]
- [6].Rajasekaran S, Nagarajha Selvan LD, Dotts K, et al. Non-coding and coding transcriptional profiles are significantly altered in pediatric retinoblastoma tumors. Front Oncol 2019;9:221. [DOI] [PMC free article] [PubMed] [Google Scholar]
- [7].Singh U, Malik MA, Goswami S, et al. Epigenetic regulation of human retinoblastoma. Tumour Biol 2016;37:14427–41. [DOI] [PubMed] [Google Scholar]
- [8].Aldiri I, Xu B, Wang L, et al. The Dynamic epigenetic landscape of the retina during development reprogramming, and tumorigenesis. Neuron 2017;94:550–68. e510. [DOI] [PMC free article] [PubMed] [Google Scholar]
- [9].Quiñonez-Silva G, Dávalos-Salas M, Recillas-Targa F, et al. Monoallelic germline methylation and sequence variant in the promoter of the RB1 gene: a possible constitutive epimutation in hereditary retinoblastoma. Clinical Epigenet 2016;8:1. [DOI] [PMC free article] [PubMed] [Google Scholar]
- [10].Peng Y, Croce CM. The role of MicroRNAs in human cancer. Signal Transduct Targeted Ther 2016;1:15004. [DOI] [PMC free article] [PubMed] [Google Scholar]
- [11].Golabchi K, Soleimani-Jelodar R, Aghadoost N, et al. MicroRNAs in retinoblastoma: potential diagnostic and therapeutic biomarkers. J Cell Physiol 2018;233:3016–23. [DOI] [PubMed] [Google Scholar]
- [12].Delsin LEA, Salomao KB, Pezuk JA, et al. Expression profiles and prognostic value of miRNAs in retinoblastoma. J Cancer Res Clin Oncol 2019;145:1–0. [DOI] [PubMed] [Google Scholar]
- [13].Yang M, Wei W. Long non-coding RNAs in retinoblastoma. Pathol Res Pract 2019;215:152435. [DOI] [PubMed] [Google Scholar]
- [14].Kitagawa M, Kitagawa K, Kotake Y, et al. Cell cycle regulation by long non-coding RNAs. Cell Molec Life Sci 2013;70:4785–94. [DOI] [PMC free article] [PubMed] [Google Scholar]
- [15].Bhan A, Soleimani M, Mandal SS. Long noncoding RNA and cancer: a new paradigm. Cancer Res 2017;77:3965–81. [DOI] [PMC free article] [PubMed] [Google Scholar]
- [16].Qi D, Wang M, Yu F. Knockdown of lncRNA-H19 inhibits cell viability, migration and invasion while promotes apoptosis via microRNA-143/RUNX2 axis in retinoblastoma. Biomed Pharmacother 2019;109:798–805. [DOI] [PubMed] [Google Scholar]
- [17].Leek JT. svaseq: removing batch effects and other unwanted noise from sequencing data. Nucleic Acids Res 2014;42:e161. [DOI] [PMC free article] [PubMed] [Google Scholar]
- [18].Ritchie ME, Phipson B, Wu D, et al. limma powers differential expression analyses for RNA-sequencing and microarray studies. Nucleic Acids Res 2015;43:e47. [DOI] [PMC free article] [PubMed] [Google Scholar]
- [19].Yu G, Wang LG, Han Y, et al. clusterProfiler: an R package for comparing biological themes among gene clusters. OMICS 2012;16:284–7. [DOI] [PMC free article] [PubMed] [Google Scholar]
- [20].Kling T, Carén H. Methylation analysis using microarrays: analysis and interpretation. Methods Mol Biol 2019;1908:205–17. [DOI] [PubMed] [Google Scholar]
- [21].Aryee MJ, Jaffe AE, Corrada-Bravo H, et al. Minfi: a flexible and comprehensive Bioconductor package for the analysis of Infinium DNA methylation microarrays. Bioinformatics 2014;30:1363–9. [DOI] [PMC free article] [PubMed] [Google Scholar]
- [22].Pidsley R, Wong YCC, Volta M, et al. A data-driven approach to preprocessing Illumina 450K methylation array data. BMC Genomics 2013;14:293. [DOI] [PMC free article] [PubMed] [Google Scholar]
- [23].Yang H, Wang K. Genomic variant annotation and prioritization with ANNOVAR and wANNOVAR. Nat Protoc 2015;10:1556–66. [DOI] [PMC free article] [PubMed] [Google Scholar]
- [24].Jeggari A, Marks DS, Larsson E. miRcode: a map of putative microRNA target sites in the long non-coding transcriptome. Bioinformatics 2012;28:2062–3. [DOI] [PMC free article] [PubMed] [Google Scholar]
- [25].Benavente CA, Dyer MA. Genetics and epigenetics of human retinoblastoma. Annu Rev Pathol 2015;10:547–62. [DOI] [PubMed] [Google Scholar]
- [26].Felsher DW. Role of MYCN in retinoblastoma. Lancet Oncol 2013;14:270–1. [DOI] [PubMed] [Google Scholar]
- [27].Cheung N-KV, Zhang J, Lu C, et al. Association of age at diagnosis and genetic mutations in patients with neuroblastoma. JAMA 2012;307:1062–71. [DOI] [PMC free article] [PubMed] [Google Scholar]
- [28].Kamihara J, Bourdeaut F, Foulkes WD, et al. Retinoblastoma and neuroblastoma predisposition and surveillance. Clin Cancer Res 2017;23: [DOI] [PMC free article] [PubMed] [Google Scholar]
- [29].Engeland K. Cell cycle arrest through indirect transcriptional repression by p53: I have a DREAM. Cell Death Differ 2018;25:114–32. [DOI] [PMC free article] [PubMed] [Google Scholar]
- [30].Baylin SB, Herman JG, Graff JR, et al. Alterations in DNA methylation: a fundamental aspect of neoplasia. Adv Cancer Res 1998;72:141–96. [PubMed] [Google Scholar]
- [31].Issac MSM, Yousef E, Tahir MR, et al. MCM2, MCM4, and MCM6 in breast cancer: clinical utility in diagnosis and prognosis. Neoplasia 2019;21:1015–35. [DOI] [PMC free article] [PubMed] [Google Scholar]
- [32].Thériault BL, Dimaras H, Gallie BL, et al. The genomic landscape of retinoblastoma: a review. Clin Exp Ophthalmol 2014;42:33–52. [DOI] [PMC free article] [PubMed] [Google Scholar]
- [33].Thériault BL, Basavarajappa HD, Lim H, et al. Transcriptional and epigenetic regulation of KIF14 overexpression in ovarian cancer. PLoS One 2014;9:e91540. [DOI] [PMC free article] [PubMed] [Google Scholar]
- [34].Esquela-Kerscher A, Slack FJ. Oncomirs - microRNAs with a role in cancer. Nat Rev Cancer 2006;6:259–69. [DOI] [PubMed] [Google Scholar]
- [35].Zhao C, Wang XB, Zhang YH, et al. MicroRNA-424 inhibits cell migration, invasion and epithelial-mesenchymal transition in human glioma by targeting KIF23 and functions as a novel prognostic predictor. Eur Rev Med Pharmacol Sci 2018;22:6369–78. [DOI] [PubMed] [Google Scholar]
- [36].Li F, Jin D, Guan L, et al. CEP55 promoted the migration, invasion and neuroshpere formation of the glioma cell line U251. Neurosci Lett 2019;705:80–6. [DOI] [PubMed] [Google Scholar]
- [37].Li J, Dallmayer M, Kirchner T, et al. PRC1: linking cytokinesis, chromosomal instability, and cancer evolution. Trends Cancer 2018;4:59–73. [DOI] [PubMed] [Google Scholar]
- [38].Fan S, Li X, Tie L, et al. KIAA0101 is associated with human renal cell carcinoma proliferation and migration induced by erythropoietin. Oncotarget 2016;7:13520–37. [DOI] [PMC free article] [PubMed] [Google Scholar]
- [39].Kobayashi H, Komatsu S, Ichikawa D, et al. Overexpression of denticleless E3 ubiquitin protein ligase homolog (DTL) is related to poor outcome in gastric carcinoma. Oncotarget 2015;6:36615–24. [DOI] [PMC free article] [PubMed] [Google Scholar]
- [40].Mazzu YZ, Armenia J, Chakraborty G, et al. A novel mechanism driving poor-prognosis prostate cancer: overexpression of the DNA Repair gene, ribonucleotide reductase small subunit M2 (RRM2). Clin Cancer Res 2019;25:4480–92. [DOI] [PMC free article] [PubMed] [Google Scholar]
- [41].Engreitz JM, Haines JE, Perez EM, et al. Local regulation of gene expression by lncRNA promoters, transcription and splicing. Nature 2016;539:452–5. [DOI] [PMC free article] [PubMed] [Google Scholar]
- [42].Ghafouri-Fard S, Taheri M. Maternally expressed gene 3 (MEG3): A tumor suppressor long non coding RNA. Biomed Pharmacother 2019;118:109129. [DOI] [PubMed] [Google Scholar]
- [43].Li Z, Jin C, Chen S, et al. Long non-coding RNA MEG3 inhibits adipogenesis and promotes osteogenesis of human adipose-derived mesenchymal stem cells via miR-140-5p. Mol Cell Biochem 2017;433:51–60. [DOI] [PubMed] [Google Scholar]
- [44].Yu F, Geng W, Dong P, et al. LncRNA-MEG3 inhibits activation of hepatic stellate cells through SMO protein and miR-212. Cell Death Dis 2018;9:1014. [DOI] [PMC free article] [PubMed] [Google Scholar]
Associated Data
This section collects any data citations, data availability statements, or supplementary materials included in this article.


