

Abstract
Skin barrier dysfunction has been reported in both atopic dermatitis (AD) and food allergy (FA). However, only one-third of patients with AD have FA. The purpose of this study was to use a minimally invasive skin tape strip sampling method and a multiomics approach to determine whether children with AD and FA (AD FA+) have stratum corneum (SC) abnormalities that distinguish them from AD without FA (AD FA−) and nonatopic (NA) controls. Transepidermal water loss was found to be increased in AD FA+. Filaggrin and the proportion of ω-hydroxy fatty acid sphingosine ceramide content in nonlesional skin of children with AD FA+ were substantially lower than in AD FA− and NA skin. These abnormalities correlated with morphologic changes in epidermal lamellar bilayer architecture responsible for barrier homeostasis. Shotgun metagenomic studies revealed that the nonlesional skin of AD FA+ had increased abundance of Staphylococcus aureus compared to NA. Increased expression of keratins 5, 14, and 16 indicative of hyperproliferative keratinocytes was observed in the SC of AD FA+. The skin transcriptome of AD FA+ had increased gene expression for dendritic cells and type 2 immune pathways. A network analysis revealed keratins 5, 14, and 16 were positively correlated with AD FA+, whereas filaggrin breakdown products were negatively correlated with AD FA+. These data suggest that the most superficial compartment of nonlesional skin in AD FA+ has unique properties associated with an immature skin barrier and type 2 immune activation.
INTRODUCTION
Atopic dermatitis (AD) is the most common inflammatory skin disease in childhood affecting nearly 20% of children (1). A major dichotomy between patients with AD involves the distinction between highly allergic (so-called extrinsic AD) and nonallergic AD (so-called intrinsic AD). Patients with AD with multiple allergen sensitization to foods and aeroallergens often undergo the so-called atopic march, which classically progresses from AD to food allergy (FA) and respiratory allergy (2). There is enormous interest in identifying the different endotypes and skin biomarkers, which result in various clinical phenotypes of AD in the hope that this will translate into personalized treatments with improved outcomes beyond what is achieved with current nonspecific approaches (3). Although blood biomarkers can correlate with AD disease activity, their interpretation is limited by potential contribution within the circulation from allergic comorbidities such as asthma, allergic rhinitis, and FA. Skin biopsies are invasive and not accepted by most study participants. Skin tape stripping (STS) is a noninvasive approach to skin sampling that has recently been used to profile the protein, lipid, and transcriptome content of the epidermis (4–7).
FA only affects one-third of children with AD, with allergy to peanuts, egg, and milk as the predominant food allergies (8). These patients are at great risk for severe allergic reaction to environmental foods and have a restricted diet accompanied by poor quality of life. Recent studies have demonstrated that both peanut allergy and AD are strongly associated with filaggrin (FLG) gene mutations (9). Although only a minority of patients with AD and FA have FLG gene mutations, this strong association suggests that skin barrier dysfunction contributes to the development of both AD and FA (10). Previous studies have reported that the strongest risk factors for the development of peanut allergy in children are the epicutaneous application of peanut-containing creams or oils, skin infection, and severity of AD (11, 12). Nonlesional AD skin has not been comprehensively evaluated in patients with AD FA+.
The purpose of the current prospective study was to use STS to analyze the transepidermal water loss (TEWL) and stratum corneum (SC) composition in combination with a comprehensive multiomics approach to determine whether children with AD FA+ have skin features, which distinguish them from children with AD FA− and those with nonatopic (NA). The data suggest that children with AD FA+ exhibit a unique constellation of skin proteins, lipids, and RNA transcripts, measurable with minimally invasive methods that distinguish them from children with AD FA− and those with NA.
RESULTS
Participant characteristics
A total of 62 participants were enrolled (AD FA+, n = 21; AD FA−, n = 19; NA, n = 22). Table S1 shows demographics, disease severity, and FA assessment. The three diagnostic groups were balanced for age, gender, and race. Furthermore, the two AD groups had similar skin disease severity as measured by the SCORing Atopic Dermatitis (SCORAD), the Nottingham Eczema Severity Score (NESS), and the Eczema Area and Severity Index (EASI). The proportion of mild, moderate, and severe AD categorized by SCORAD was similar in the AD FA+ versus AD FA− group. Five Caucasians in the AD FA+ group had FLG mutations, and none were found in the AD FA− group. Participants in the AD FA+ group all had immediate clinical reactions to peanut and immediate skin prick wheal size to peanut of 8 mm or greater, as well as allergic sensitization to a variety of other foods (table S1). In contrast, the AD FA− and NA groups tolerated clinical ingestion of peanut and had negative skin prick tests to peanut and other foods. Peanut-specific immunoglobulin E (IgE) was also significantly increased in the AD FA+ group compared to the AD FA− group (P < 0.001).
Skin TEWL measurements
The primary end point in this study was based on comparisons between groups for the TEWL area under the curve (AUC), and TEWL at baseline before STS and after 5, 10, 15, and 20 STS assessed on nonlesional skin. TEWL AUC was calculated as an integral of TEWL measurements over 20 consecutive STS with TEWL measurement at every five STS. Patients with AD FA+ had substantially reduced skin barrier function of their nonlesional skin as assessed by both a higher TEWL AUC (Fig. 1A) and higher baseline and postbaseline TEWL compared to patients with AD FA− and those with NA (Fig. 1B and table S2). In contrast, there were no notable differences in nonlesional TEWL AUC and after repeated STS between patients with AD FA− and those with NA. Baseline TEWL values of skin lesions from AD FA+ were indistinguishable from AD FA− (fig. S1), consistent with a similar level of AD severity in the AD FA+ and AD FA− groups.
Fig. 1. TEWL AUC and TEWL after sequential STS by group.

The primary end point comparisons between groups were TEWL AUC assessed on nonlesional skin of 62 participants. (A) Boxplots: Solid horizontal line and filled circle within a box represent the median and mean, respectively, the box margins are the interquartile range (50% of the observations), whisker lines extend for 1.5 times the interquartile range, and observations outside the whisker are marked by an open circle. The annotations are the P values from pairwise comparisons between groups obtained from a one-way analysis of variance (ANOVA). (B) TEWL measurements after 5, 10, 15, and 20 STS. The line figure represents means and SEs from a linear mixed model (green line represents NA, purple line represents AD FA−, and orange line represents AD FA+). Colored asterisks represent statistically significant differences: green represents a statistically significant difference between AD FA+ and NA, whereas purple compares AD FA+ and AD FA−.
A strong association was seen between TEWL AUC for nonlesional skin and AD severity (SCORAD) in the AD FA+ group but not in the AD FA− group (Fig. 2). The observation that this relationship was not seen in AD FA− suggests that these two forms of AD have an intrinsically different skin barrier and response to skin inflammation or the pruritus-scratch cycle. The SCORAD pruritus visual analog scale (VAS) correlated very well with TEWL AUC in the AD FA+ group but not in the AD FA− group (fig. S2). This suggests that the TEWL response to STS may mimic the skin stimulation known to enhance AD severity when the itch-scratch cycle is triggered. A correlation was observed between food-specific IgE and number of positive skin tests for food allergens with nonlesional TEWL AUC and TEWL after 10, 15, and 20 STS for nonlesional skin in the upper extremity but not with lesional baseline TEWL (table S3).
Fig. 2. Correlation of TEWL AUC with SCORAD in nonlesional skin for AD FA+ and AD FA− group.

Correlation between SCORAD and TEWL AUC in nonlesional skin stratified by AD FA+ (A) and AD FA− (B). The annotations in each panel are the Pearson correlations [95% confidence interval (CI)] and P values.
We also used a ruthenium vapor postfixation protocol that provides artifact-free images of SC for electron microscopy to evaluate lamellar bilayer architecture of STS (13). Lamellar bilayer structural integrity was highly abnormal in STS obtained from the same skin sites as TEWL measurements performed in patients with AD FA+. These STS displayed remarkably disorganized extracellular lamellar bilayers (fig. S3A). In patients with AD FA− and those with NA, relatively normal lamellar bilayer structures were observed (fig. S3, B and C).
Skin FLG and lipid content
Previous studies have demonstrated a close correlation between FLG breakdown products [urocanic acid (UCA) and pyroglutamic acid (PCA)] and FLG protein abundance in the skin (4). Because the inflection point at STS layers 15 and 16 showed an upward slope in the TEWL AUC for AD FA+, we focused studies of FLG breakdown products and EOS CER (ω-esterified fatty acid sphingosine ceramide)/NS CER (nonhydroxy fatty acid sphingosine ceramide) on these layers. As shown in Fig. 3 (A and B), children in the AD FA+ group had the lowest amount of FLG breakdown products in the skin at nonlesional STS layers 15 and 16 among the three diagnostic groups. In AD FA−, at nonlesional STS layers 15 and 16, the amount of FLG breakdown products was intermediate; UCA concentrations were significantly lower than in NA (P = 0.013), whereas UCA and PCA concentrations were significantly higher than in AD FA+ (P = 0.004 and P < 0.001, respectively; Fig. 3, A and B, and table S4). Therefore, abundance of FLG breakdown products at nonlesional skin layers 15 and 16 distinguished these three groups.
Fig. 3. FLG breakdown products and the proportion of EOS CER content in nonlesional skin.

Comparisons between groups for FLG breakdown products total UCA (A), PCA (B), and EOS CER/NS CER ratio (C) were all assessed at skin tapes 15 and 16 on nonlesional skin. In the boxplot, the solid horizontal line represents the median, and the filled circle represents the mean. The box margins are the interquartile range, and the whiskers extend 1.5 times the interquartile range. Observations outside the whisker are marked by an open circle. The annotations are the P values from pairwise comparisons between groups obtained from a one-way ANOVA.
In contrast, the amounts of FLG breakdown products (UCA and PCA) at nonlesional STS layers 5 and 6 in the two AD groups were similar, with both showing considerably reduced abundance as compared to the NA group (table S4). However, no differences in UCA and PCA amounts were observed between the AD FA+ and AD FA− groups in lesional AD skin (table S4). The concentrations of FLG breakdown products in nonlesional STS layers 15 and 16 of the AD FA+ group were comparable to those seen in lesional skin samples of both patients with AD FA+ and those with AD FA−. A strong inverse correlation was found between the amounts of FLG breakdown products of STS layers 15 and 16 with the corresponding TEWL assessed on nonlesional and lesional skin (table S5).
A substantial decrease was also found in the amount of EOS CER at nonlesional STS layers 15 and 16 in the AD FA+ group as compared to the AD FA− group and NA controls, as well as in the ratio between EOS CER and NS CER (Fig. 3C and table S6). In contrast, no difference in EOS CER abundance was found at nonlesional STS layers 5 and 6 between the AD FA+ group and the AD FA− and NA groups. However, the AD FA+ group did separate from the AD FA− group at nonlesional STS layers 5 and 6 when comparing the EOS CER/NS CER ratio (table S6). There was no difference in EOS CER amounts in nonlesional skin of the AD FA− group versus NA controls at either STS layers 5 and 6 or STS layers 15 and 16. The amounts of EOS CER in nonlesional skin of patients with AD FA+ were comparable to the low amounts observed in lesional STS layers 15 and 16 of patients with AD FA+ and those with AD FA−. Changes in the absolute amounts of EOS CER and NS CER in the AD FA+ and AD FA− groups versus the NA group are opposite in direction. This strengthens the magnitude of the ratio between EOS CER and NS CER in comparison to just changes in each individual ceramide subclass (Fig. 3C). There was a notable correlation between EOS CER/NS CER ratio and corresponding TEWL assessed on nonlesional and lesional skin (table S7).
Skin microbiome
Skin swabs for microbiome analysis were collected from lesional and nonlesional upper extremity skin from patients with AD FA+, those with AD FA−, and those with NA. To evaluate the microbial community composition across samples, we mapped shotgun metagenomic microbial sequence reads to reference databases and calculated the relative abundance of each microorganism. Alpha diversity, an ecological metric to measure the microbial richness (total number of bacterial species) and evenness (relative proportion of the bacterial species), revealed no difference in bacterial diversity between AD FA+ and AD FA− groups stratified in lesional and nonlesional samples (fig. S4). Microbial relative abundance at the genus level on nonlesional skin showed an increase of Staphylococcus and Micrococcus in AD FA+ compared to NA (fig. S5). The relative abundance of other bacterial genera did not differ in samples from the three groups (fig. S5). No difference was found comparing AD FA+ and AD FA− lesional skin (fig. S6). Comparison of Staphylococcus species on nonlesional skin revealed patients with AD FA+ had increased Staphylococcus aureus relative abundance compared to NA controls but similar relative abundance to AD FA− (fig. S7). No difference was found comparing AD FA+ and AD FA− lesional skin (fig. S8). Correlation analyses between overall Staphylococcus species and S. aureus relative abundance and TEWL AUC revealed a positive correlation between S. aureus abundance in nonlesional skin and TEWL for AD FA+ but not AD FA− or NA group (Fig. 4). In contrast, no correlation was found between other commensal Staphylococcus species (e.g., Staphylococcus hominis) and TEWL.
Fig. 4. Staphylococcus, S. aureus, and S. hominis correlations with TEWL AUC for AD FA+, AD FA−, and NA.

Correlations between overall Staphylococcal species including S. aureus and S. hominis relative abundance (%, square root transformed) and TEWL AUC assessed on nonlesional skin from AD FA+, AD FA−, and NA. Relative abundance of Staphylococcus species were obtained by mapping the trimmed reads to reference genomes. Correlation between relative abundance and TEWL was obtained using Pearson correlation (95% CI) and P values. Linear regression models were used to estimate the best-fitting line and SE.
Abnormal epidermal keratin expression in AD FA+ skin
The epidermis is a highly organized, stratified squamous epithelium characterized by proliferation in its basal layer and terminal differentiation in the SC (14–16). Our current results showing increased TEWL, low FLG, decreased EOS CER/NS CER ratio, and increased S. aureus colonization in the AD FA+ group suggest that AD FA+ skin has abnormal barrier function and lack of epidermal terminal differentiation.
Keratin 5 (KRT5) and KRT14 are predominantly expressed by basal keratinocytes, and KRT16 is a marker for hyperproliferating keratinocytes in the skin (17, 18). Using proteomics, we examined the expression of keratins in STS samples from patients with AD FA+, those with AD FA−, and those with NA. Although STS samples only the SC and upper granular layers of the skin, increased amounts of KRT5 and KRT14 amounts were observed in the skin of patients with AD FA+ (Fig. 5 and table S8) as compared to the other two groups. This is unusual because KRT5 and KRT14 are predominantly expressed by undifferentiated proliferating keratinocytes. At the same time, patients with AD FA+ had a concomitant increase in KRT16 expression compared to the two other groups. Correlations were also observed between KRT5, KRT14, and KRT16 amounts in the nonlesional skin and TEWL AUC and TEWL at STS layer 15 (table S9). These observations suggest that the superficial layer of skin in patients with AD FA+ is characterized by keratinocytes that hyperproliferate, impairing their ability to terminally differentiate, thus accounting for the low FLG, lipid abnormalities, increased TEWL, and microbiome abnormalities.
Fig. 5. Keratin expression in nonlesional skin.
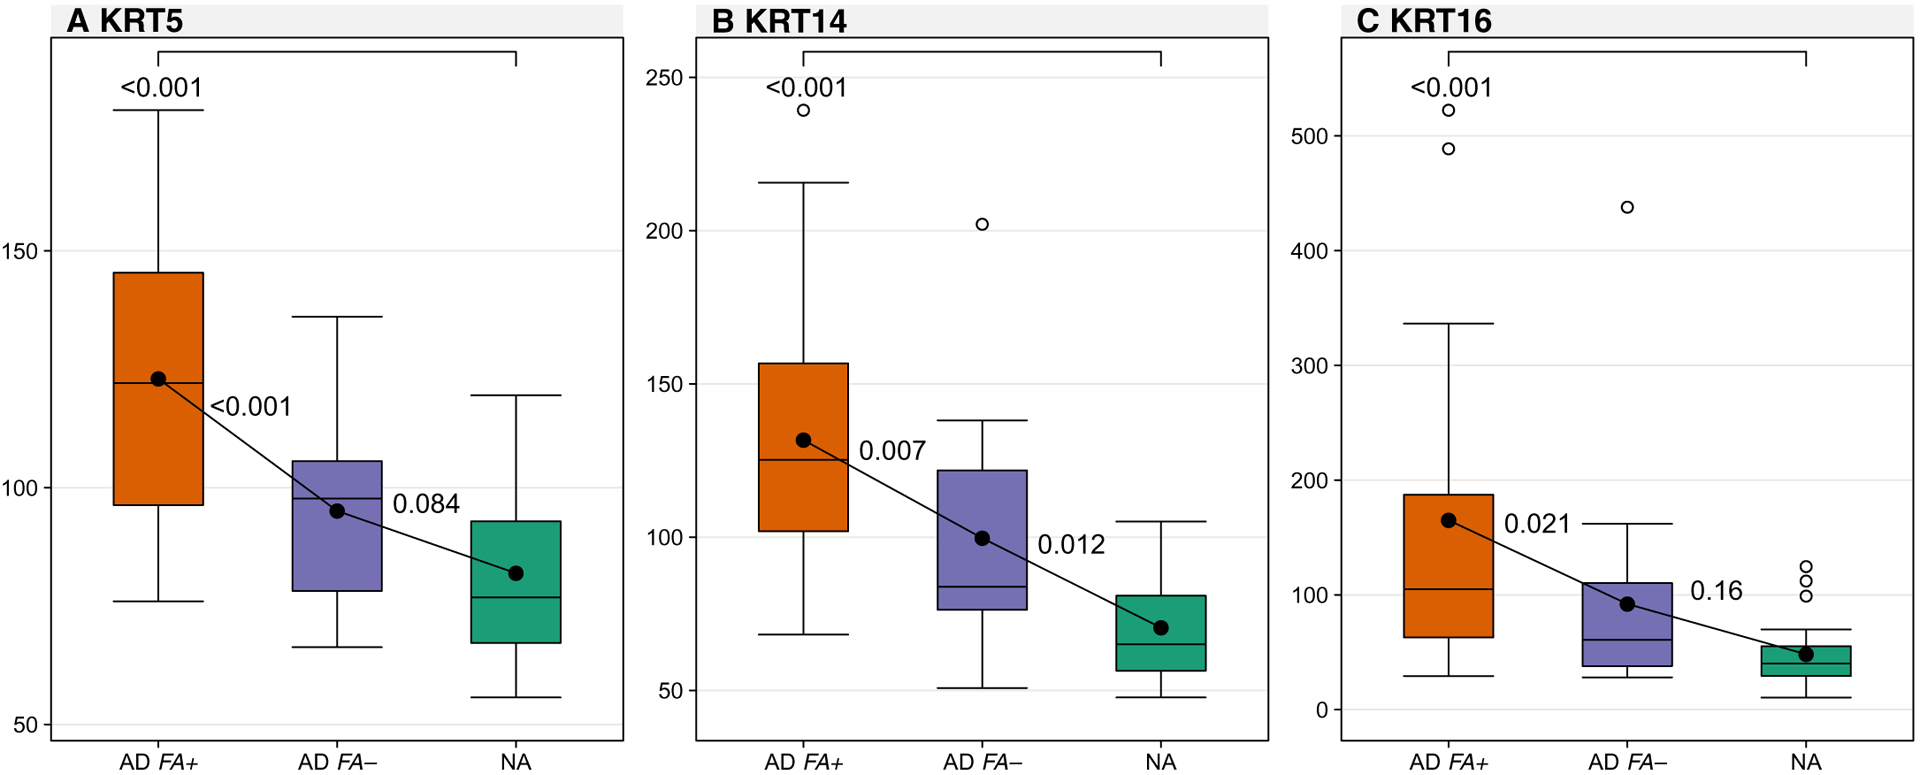
Comparisons between groups for markers of keratin expression measured as cumulative reporter ion signal to noise: KRT5 (A), KRT14 (B), and KRT16 (C) all assessed at skin tapes 15 and 16 on nonlesional skin. In the boxplot, the solid horizontal line represents the median, and the filled circle represents the mean. The box margins are the interquartile range, and the whiskers extend 1.5 times the interquartile range. Observations outside the whisker are marked by an open circle. The annotations are the P values from pairwise comparisons between groups obtained from a one-way ANOVA.
Skin transcriptome
As an exploratory objective, we collected paired lesional and nonlesional STS samples from the upper extremity of 21 patients with AD FA+ and 19 patients with AD FA−, as well as 22 nonlesional STS from NA for transcriptomic analyses. RNA extraction resulted in average total RNA yields [median (first, third quartile)] of 34.0 (17.0, 59.8) pg/μl, 12 μl of extraction per sample. Although these RNA quantities were too low for standard RNA sequencing (RNA-seq), we attempted to generate AmpliSeq whole-transcriptome sequencing libraries for all samples, as previously described (5). Sequencing data were successfully generated from 4 NA nonlesional STS (18%), 5 AD FA− nonlesional STS (26%), 8 AD FA+ nonlesional STS (38%), 17 AD FA− lesional STS (89%), and 12 AD FA+ lesional STS (57%) for a total success rate of 45%.
A random forest classifier was used to identify differentially expressed genes within the nonlesional STS of patients with AD FA+, those with AD FA−, and those with NA. Genes with a mean decrease in Gini index of >0.005 were determined to be sufficiently informative for classifying these participants by diagnostic group. This yielded a set (n = 288) of genes whose expression separated patients with NA (n = 51 genes), those with AD FA− (n = 19 genes), and those with AD FA+ (n = 218 genes) using unsupervised hierarchical clustering (Fig. 6A and table S10). We noted that almost half of the AD FA+ enriched genes overlapped with the gene signature previously identified in the STS of patients with type 2 high AD (n = 96 of 218 AD FA+ genes overlapped with the n = 656 type 2 high genes; hyper-geometric P = 9.64 × 10−86) (5). The type 2 pathway genes CCR8, IL4R, and CRLF2 [a thymic stromal lymphopoietin (TSLP) receptor] were higher in the AD FA+ group than in patients with AD FA− and those with NA (fig. S10). Both AD groups had increased expression of CCL17, CCL22, IL13, and IL7R (a TSLP receptor) and IL1RAP [an interleukin-33 (IL-33) receptor]. CD200R1, which is a recently recognized immunoglobulin superfamily member that identifies cells involved in type 2 immune responses (19), was also increased in the AD FA+ group as compared to patients with AD FA− and those with NA (fig. S10). The AD FA+ group also expressed elevated amounts of the AD-associated matrix metalloproteinase MMP9, antigen-presenting cells (APCs) major histocompatibility complex class II receptors (HLA-DMA, HLA-DBP1, and HLA-DRA), APC costimulatory receptors (CD83 and CD86), and the plasmacytoid dendritic cell marker IL3RA. Moreover, ingenuity pathway analysis (IPA) canonical pathway analysis of the 218 AD FA+ genes identified “T helper 1 (TH1) and TH2 activation pathways” and “dendritic cell maturation” among the most enriched classical pathways for these genes (table S11).
Fig. 6. Dendritic cell and immune activation signatures in nonlesional skin of AD FA+ are similar to lesional AD FA+ and AD FA− skin.

Heat map and dendrogram for the transcriptome dataset (A). In this map, each row represents a transcriptome, and each column represents a participant. The cell color represents normalized levels from high (red) to middle (yellow) to low (blue), and the top column color represents the diagnostic group with appropriate annotations at the bottom (+ for AD FA+ and − for AD FA−). Boxplot for nonlesional skin (B) and lesional skin (C) of the first principal component. In the boxplots, the solid horizontal line represents the median, and the filled circle represents the mean. The box margins are the interquartile range, and the whiskers extend 1.5 times the interquartile range. Observations outside the whisker are marked by an open circle. The annotations are the P values from pairwise comparisons between groups obtained from a one-way ANOVA.
To further test the possibility that the patients with AD FA+ harbored immune-activated gene signatures, a principal components analysis was performed on all 46 STS transcriptomes using the 656 type 2 high signature genes from Dyjack et al. (5). The leading principal component, which accounted for 13% of the variance, was found to be substantially elevated in nonlesional skin of patients with AD FA− compared to NA skin (Fig. 6B), was further elevated in the nonlesional skin of patients with AD FA+ compared to AD FA− nonlesional skin (Fig. 6B), and was significantly associated with TEWL after 15 STS [correlation (95% CI), 0.65 (0.25 to 0.86); P < 0.01]. The immune activation signature was also elevated in lesional skin of both AD FA+ and AD FA− compared to NA or nonlesional AD FA− skin but was not increased over the level in AD FA+ nonlesional skin (Fig. 6C). These data are supportive of substantial immunomodulated inflammation in the nonlesional skin of patients with AD FA+ but not those with AD FA−.
Correlation network and relative importance of different variables in predicting AD FA+
To understand the relationships between the multiomics and clinical variables, we took a two-step approach. First, to understand the interrelationships between all measured variables, we constructed a correlation network (Fig. 7A and fig. S9). As expected, strong positive correlations (red) were observed within the FLG breakdown products (UCA and PCA), keratins (KRT5, KRT14, and KRT16), and AD severity scores (NESS, SCORAD, and EASI). Furthermore, both TEWL 15 and AD FA+ were correlated with these variables. Type 2 transcriptome first principal component (PC1) was also correlated with the aforementioned variables except for KRT5. Of note is the absent or weak correlation of EOS CER/NS CER ratio and S. hominis. Last, although a statistically significant (P < 0.01) correlation is present between TEWL and AD FA+, it is not as strong as the ones between and with other indicators.
Fig. 7. Network and relative importance analyses.

Network (A) of the intercorrelations between the measurements of TEWL (TEWL), total UCA (UCA), PCA (PCA), EOS CER/NS CER ratio (EOSNS), AD severity indices (EASI, NESS, and SCORAD), keratin expression (KRT5, KRT14, and KRT16), transcriptome PC1 (TPC1), the relative abundance of S. aureus (SAUR) and S. hominis (SHOM), and an indicator variable for AD FA+ (yes/no) based on peanut wheal size of ≥8 mm. TEWL measurements were done at STS 15; UCA, PCA and EOS CER/NS CER ratio were evaluated at STS layers 15 and 16. The color saturation and the width of the connecting lines correspond to the strength of the Pearson correlation coefficient, and the color of each connecting line indicates a positive (red) or negative (blue) correlation. Connecting lines are only shown for significant Pearson correlations (P < 0.01). Relative importance for prediction of AD FA+ (B) and TEWL STS 15 (C).
The second approach, a supervised method, was to identify and quantify which of these variables were the most important in predicting AD FA+. Using a statistical method for the determination of the relative importance of correlated predictors, we were able to quantify the independent effect of each variable in predicting AD FA+ (Fig. 7B). The total proportion of variance explained by the model including all predictors was 50.7%. Predictors with larger contributions to the R2 are more important in independently explaining the outcome variable, i.e., independently from any of the other predictors in the model and unrelated to the order or position of the predictor in the model statement. For predicting AD FA+, the most important independent grouped predictors were KRT5, KRT14, and KRT16 (15.9%), FLG breakdown products (10.7%), and AD severity (9.6%) but not S. aureus or lipid profile. The independent effects of the EOS CER/NS CER ratio, TEWL 15, transcriptome PC1, and the S. aureus were markedly lower, accounting for 6.1, 3.9, 3, and 1.6%, respectively. We observed that KRT5, a marker of immature keratinocytes, was the most important independent predictor within the keratin group (10.7%), followed by KRT14. PCA accounted for 6.5% within the FLG breakdown products group, and the AD severity was driven by SCORAD (5.2%). When TEWL was included as the only predictor in the model, it represented 17.1% of the total variation, whereas its independent contribution dropped to 3.9% in the presence of all the other predictors. Concluding that once other measures are included in the model, the independent contribution of TEWL is reduced substantially.
Similarly, we analyzed the predictors of TEWL 15 (Fig. 7C). The most important independent predictors were similar to those observed for the prediction of AD FA+: FLG breakdown products (14.4%), KRT5, KRT14, and KRT16 (14%), and AD severity (10.6%). The S. aureus (5.5%), AD FA+ (3.9%), transcriptome PC1 (3%), and EOS CER/NS CER ratio (2.5%) were having a lesser independent effect. Within the keratin expression, KRT16, a marker of cell proliferation, accounted for 8.3%, followed by KRT14. In addition, PCA accounted twice as much as UCA, and the majority of the AD severity domain was driven by EASI score with 6.9%. This suggests that TEWL is best described by FLG breakdown products (particularly PCA), markers of keratinocyte proliferation (KRT5, KRT14, and KRT16), and the EASI severity score versus the SCORAD. Because the contributing grouped features and their relative influences to the R2 are similar between the prediction of AD FA+ and TEWL and given the observed difference in TEWL AUC or the individual STS between AD FA+ and AD FA− (Fig. 1), we conclude that TEWL can be used as a proxy for FA.
DISCUSSION
In this prospective clinical study with laboratory personnel blinded to minimize bias, we demonstrate that children with AD FA+ represent a unique endotype that can be distinguished from AD FA− or NA. A constellation of SC attributes including increased TEWL AUC, low FLG breakdown products, changes in SC lamellar bilayer structure, and a reduced EOS CER/NS CER ratio was found in patients with AD FA+. These differences were most pronounced at STS layers 15 to 20, at the interface between the SC and stratum granulosum. These findings in the nonlesional skin were not attributable to differences in AD skin severity, because there was no difference between the AD FA+ group and the AD FA− group using three different clinical skin severity scoring systems (NESS, EASI, and SCORAD). All groups studied were balanced for age, gender, and race to control for potential confounding factors. Lesional skin in the two groups of AD had similar TEWL AUC, FLG breakdown products, and EOS CER content, suggesting that distinction between AD FA+ and AD FA− was found only in nonlesional AD skin. The reduced FLG breakdown products and EOS CER/NS CER ratio in nonlesional skin of patients with AD FA+ approached those observed in lesional AD skin.
Previous studies have shown that AD, as an overall group without stratification for FA, is associated with increased TEWL at the skin surface (referred to as baseline before STS) (20). These TEWL abnormalities are associated with substantial variability due to environmental influences and overlap with patients with no FA. We now show that variation in lamellar bilayer structure correlates with changes in barrier function of uninvolved skin. Optimal regulation of barrier function requires that sufficient lamellar material should be present within the extracellular spaces and that the secreted lipids are properly organized into stacks of lamellar bilayers. A previous birth cohort study demonstrated that baseline TEWL at day 2 of life, in the upper quartile of normal values, could predict AD or FA before the onset of clinical symptoms (21, 22). However, such measures would be difficult to interpret prospectively for early intervention studies before the onset of AD and FA because the baseline TEWL values were within the normal range. Hence, TEWL has not been used to identify skin barrier defects at the level of the individual patient, which would be required for precision medicine approaches. An important feature of our study was the investigation of barrier integrity (e.g., TEWL AUC) of AD nonlesional skin, involving measurement of TEWL at baseline and after 5, 10, 15, and 20 STS. Measurement of TEWL after sequential STS indicates that the AD FA+ group is a distinctive endotype that is well separated from AD FA− and NA by TEWL AUC. Consistent with previous studies (6, 7), the STS procedure in our current study was well tolerated and painless with no reported adverse events.
Clinical observations have highlighted the importance of the scratch-itch cycle in driving the occurrence of clinical AD. STS in mouse models induced TSLP and IL-33, two key cytokines that drive the type 2 immune response and stimulate IgE production to foods (23, 24). A strong association was observed between pruritus and STS-induced TEWL values. The current study links pruritus in AD FA+ and peanut reactivity. Pruritus has recently been shown to be driven by type 2 immune cytokines including IL-4, IL-13, IL-31, and IL-33 (25, 26). IL-4 and IL-13 can directly activate sensory neurons in the skin, and chronic itch is dependent on neuronal IL-4 receptor (IL-4R) and Janus kinase 1 signaling (27). Dupilumab, an anti–IL-4R monoclonal antibody, inhibits IL-4 and IL-13 signaling and rapidly reverses pruritus in AD (28). Therefore, the increased type 2 immune activation in AD FA+ likely explains the association of pruritus and FA. We postulate that scratching from pruritus likely damages the skin and increases local release of TSLP, IL-33, and other type 2 cytokines to enhance TEWL responses and support environmental peanut allergen penetration through the skin due to the loss of skin barrier function from immune activation.
Our current observation that increased TEWL AUC after sequential STS of nonlesional skin distinguishes AD FA+ from AD FA− independent of AD severity is unexpected because AD severity has been reported to be a risk factor for peanut allergy (29). However, those previous studies were performed primarily on patients referred for FA, which would be enriched for the AD FA+ group. Within AD FA+, however, AD severity does correlate with the TEWL response to STS. This is consistent with a previous report that increased TEWL of nonlesional skin was detected in infants, without clinical evidence for AD, before the development of FA (21, 22). Our current study confirms a relationship between AD severity and increased TEWL; however, we highlight a difference in the nonlesional skin of AD FA+ versus AD FA− that is not explained by AD severity alone.
Barrier integrity is thought to reflect the function of multiple epidermal proteins and lipids in the SC. FLG, in particular, is a structural protein that plays an important role in controlling water retention in the skin, and the hygroscopic properties of FLG breakdown products are important role as natural moisturizing factor ingredients (10). FLG gene mutations have been associated with increased TEWL and peanut allergy in Northern Europe (30). Studies in the United States, however, did not find an association of FLG mutation with peanut allergy but linked peanut allergy to AD severity (31). Epicutaneous sensitization to foods is enhanced in FLG-deficient mice due to increased epidermal allergen penetration leading to type 2 immune activation, suggesting an important role for FLG deficiency in FA (24). In our current study, only five participants in the AD FA+ group had FLG mutations, and all were heterozygous. Their TEWL AUC values were evenly distributed across the entire range of the AD FA+ group.
Alternatively, we and others have demonstrated that there are multiple causes of acquired reduction in FLG protein abundance (32). Immune activation involving type 2 cytokines, e.g., IL-4/IL-13, IL-31, TSLP, and IL-33 or inflammatory cytokines such as tumor necrosis factor–α can cause a considerable reduction in FLG expression (33, 34). To investigate whether immune activation is present in the nonlesional skin of patients with AD FA+, we performed STS transcriptome analysis. Although RNA recovery with this method is inefficient, it is highly sensitive in detecting type 2 inflammation and dendritic cell activation in the upper skin layers. We found that patients with AD FA+ exhibited a high dendritic cell and immune activation (including type 2) signature in their nonlesional skin, comparable to that in the lesional skin of all AD participants. These results support a mechanism, whereby increased immune inflammation in patients with AD FA+ reduces epidermal barrier proteins at STS layers 15 and 16 and compromises skin barrier. Transcripts for the type 2 cytokines IL-13, CCL17, and CCL22 were elevated in both AD FA+ and AD FA− compared to NA. However, transcripts for type 2 immune receptors, i.e., IL-4R, CCR8, and CRLF2 (a TSLP receptor) were higher in AD FA+ as compared to AD FA− or NA.
In the current study, we found low FLG breakdown product content in the skin at STS layers 5 and 6 in both the AD FA+ and AD FA− groups, confirming the importance of FLG in AD, in general. However, the contribution of the current study lies in the demonstration that at STS layers 15 and 16, there is substantial separation between the AD FA+, AD FA−, and NA groups such that at deeper layers of the skin, AD FA+ had the most profound defect in skin barrier.
The lack of distinctive findings in STS layers 5 and 6 is likely because the most superficial layers of the SC are subject to environmental effects, such as increased oxidation of lipids, potential component modification by variable skin microbiome, changes in pH, activity and expression of desquamation enzymes, and ceramidases. All these environmental effects lead to increased variability in measurements performed at STS layers 5 and 6, in comparison to deeper STS layers 15 and 16, where effects are driven mainly by type 2 immune activation. This observation of discrepancies between skin layers has a particular value for current and planned clinical trials.
FLG plays a critical role in keratinocyte differentiation including lipid transport into the extracellular space around keratinocytes (35). FLG deficiency leads to impaired lipid profile and altered acidification pathways (36). Lipid abnormalities have been reported in patients with FLG mutations (37). Ultralong-chain lipids, such as EOS CER, control water retention in the skin and prevent allergen penetration (38). Modified (oxidized and de-esterified) EOS CERs and epidermal structural proteins, such as involucrin, loricrin, and periplakin, cross-link to create an impermeable barrier that prevents allergen penetration and water loss, with FLG facilitating structural alignment of cornified envelope proteins (15, 39). Loss of acidification in the epidermis results in activation of proteases such as kallikrein, which damages the skin barrier. Netherton’s syndrome, which is associated with increased skin protease activity due to SPINK5 deficiency, is often associated with FA. In our current study, we found a decrease in EOS CER/NS CER ratio in STS of patients with AD FA+ as compared to the AD FA− and NA groups. Both the low FLG breakdown products and reduced EOS CER were highly correlated with TEWL AUC and food allergen sensitization. Further studies are needed to decipher the cause of low FLG and EOS CER in children with AD FA+, but it is likely due to a complex combination of epidermal structural genetic mutations and cytokine activation. The concentration of FLG breakdown products and EOS CER in nonlesional STS layers 15 and 16 of AD FA+ were not only the lowest among the three study groups but also approached concentrations seen in lesional skin of patients with AD FA− and those with AD FA+. The greatest decrease in the ratio between EOS CER and NS CER in children with AD FA+ also indicates the maximum loss of skin hydrophobicity due to a decline of highly hydrophobic EOS CER and the increase in short-chain NS CER. This suggests the entire skin surface of AD FA+ is at risk for allergen penetration.
AD skin barrier dysfunction is associated with microbial dysbiosis with overgrowth of S. aureus, which can produce proteases and lipases that degrade epidermal structural proteins, including FLG, and metabolize lipids (40, 41). Recent birth cohort studies revealed that the skin microbiome changes before the onset of AD with increased S. aureus abundance (42–44). Consistent with a role for S. aureus, our metagenomic studies revealed increased S. aureus, which correlated with increased TEWL.
Future interventional birth cohort studies are required in humans to untangle the web among S. aureus colonization, reduced FLG and EOS CER, increased TEWL AUC, type 2 immune activation, and food allergen sensitization. Animal models, including studies with FLG-deficient mice, suggest all these factors can be causal, and there is likely a multidirectional relationship among them, depending on the genetic and environmental factors affecting a given individual (23, 24). For example, it is known that type 2 cytokines increase S. aureus colonization and reduce FLG expression (33, 45). Our previous studies have shown that an increase in TSLP occurs before the onset of AD (46). Furthermore, S. aureus drives AD and FA by enhancing type 2 immune activation, disrupting the skin barrier, and reducing T regulatory cell function (47, 48). Supporting a role for the skin barrier in driving AD and FA, a pilot study with a lipid-rich skin emollient from birth was found to improve skin barrier function and reduce food allergen sensitization (49). Because novel safe approaches are developed to inhibit type 2 immunity, this will clarify the role that type 2 immunity plays in FA (50).
Our multiomics analyses suggest a major role for low FLG in FA. Unexpectedly, we found increased KRT5, KRT14, and KRT16 expression patterns in AD FA+ nonlesional, clinically normal-appearing skin, suggesting that keratinocytes are hyperproliferating in the epidermis of patients with AD FA+. This impairs terminal differentiation of keratinocytes and provides an explanation for impaired skin barrier function in these patients. IL-4/IL-13 have been previously documented to inhibit keratinocyte differentiation, particularly the expression of FLG, in vitro (33, 51). A strong negative correlation between the type 2 immune transcriptome in STS samples and concentration of FLG breakdown products was documented in this study. KRT16, a marker of epidermal proliferation, was among the large set of genes down-regulated in the skin of patients with AD treated with dupilumab (52), a targeted anti–IL-4R therapy (53). We, therefore, propose that the observed changes in keratin profiles of AD FA+ may be a marker of enhanced type 2 response in the skin of patients with AD FA+.
Our study had several limitations. Because of the limited amount of RNA extracted from STS, transcriptome analysis was successful only for a fraction of study participants. In addition, collected amount of material was not sufficient to perform S. aureus analysis at the strain level. Last, skin biopsies were not collected in this study, and all interpretations were drawn from the STS analysis. Skin biopsy analysis in the future would be beneficial to confirm STS findings in patients with AD FA+ and the potential role of changes in the deeper layers of skin.
In conclusion, we have performed a comprehensive evaluation of the SC in children with AD comparing AD FA+ versus AD FA− using a minimally invasive STS sampling technique that allowed us to analyze TEWL AUC responses, lipidomics, FLG breakdown products, proteomics, and transcriptomics. This analysis by local skin sampling has clear advantages over blood biomarkers that may diffuse from other tissues. Although skin biopsies are informative, in our personal experience, less than 30% of study participants are willing to give skin biopsies (5), whereas all study participants willingly provided STS, leading to less bias in sample collection. Our findings not only demonstrate that the AD FA+ group represents a unique AD endotype but also identify a defective SC as the key abnormality that distinguishes patients with AD FA+ from patients with AD FA− or those with NA. It is important to emphasize that our findings of SC abnormalities were observed in nonlesional AD skin, raising the possibility that these skin changes are occurring before the occurrence of clinical skin lesions and places the patient with AD FA+ at great risk because their entire skin body surface area may be susceptible to food allergen penetration and allergen sensitization. Although previous epidemiology studies in children with peanut allergy and experimental mouse models have implicated epicutaneous allergen sensitization, our current study systemically studies that these intertwined associations and provide possible biomarkers to directly demonstrate that the skin of children with AD FA+ has a defect in their SC. Although future studies are needed to validate our findings, our current data support the concept that primary and secondary prevention of AD and FA in this subset of AD should focus on improving skin barrier function.
MATERIALS AND METHODS
Study design
We report our observations from a prospective, clinical mechanistic study registered at ClinicalTrials.gov identifier: NCT03168113. The protocol was approved by the Western Institutional Review Board, protocol number 20170474. Written informed consent was provided by the parent or legal guardian, and written assent was provided by the participant, as applicable, before participation.
All laboratory data were analyzed without knowledge of study participant diagnostic group to eliminate any investigator bias. Data analysis was performed/validated by the Statistical and Clinical Coordinating Center at Rho Federal Systems Division. The primary end point was the TEWL AUC assessed on nonlesional skin before STS and repeated after 5, 10, 15, and 20 STS. STS samples were also assessed for proteomics, lipidomics, electron microscopy, and transcriptomics. Skin swabs were assessed for the microbiome. Primary data are reported in data file S1.
Study participants
A total of 62 children between 4 and 17 years of age were enrolled. The AD participants had active skin disease without a history of eczema herpeticum diagnosed using published criteria (54) and were stratified into two groups based on their FA status: (i) 21 AD FA+ with FA to peanut. The following criteria were used for diagnosis of peanut allergy: peanut skin prick test wheal of ≥8 mm, which has been reported to significantly correlate with immediate clinical reactions to oral peanut challenge (55) and documentation of a previous positive oral food challenge to peanut or convincing history of an immediate allergic reaction to peanut. (ii) Nineteen children with AD FA− with no FA. These participants had no personal history of FA (based on ability to ingest foods without adverse reactions) and negative skin prick test (wheal, <3 mm) to peanut, milk, egg, wheat, soy, shellfish mix (clam, crab, oyster, scallops, and shrimp), almond, English walnut, hazelnut, cashew, brazil nut, and sesame seed. A third comparison group consisted of 22 NA controls defined as those without a personal history of atopic diseases and negative skin prick tests to common foods and aeroallergens. The three diagnostic groups (AD FA+, AD FA−, and NA) were balanced for age, gender, and race, and the two AD groups had similar skin disease severity (table S1).
Skin disease severity assessments
AD severity was evaluated using the SCORAD (56), which includes a VAS for pruritus, the NESS (57, 58), and the EASI (59) (table S1). Enrollment of patients with AD FA+ and those with AD FA− was balanced on the basis of AD severity (mild, moderate, and severe) as determined by the NESS. The details about STS processing and analysis for FLG breakdown products, lipids, proteomics, microbiome, and transcriptomics are provided in the Supplementary Materials.
Statistical analysis
To compare differences in demographics and severity characteristics between the groups, χ2 tests were used for categorical variables, and Wilcoxon or Kruskal-Wallis tests were used for two-group or three-group comparisons, respectively. Nonparametric Wilcoxon rank-sum test was used to compare differences in microbial relative abundance and diversity measurements between the groups. Primary analyses for TEWL AUC, TEWL by STS, FLG, and KRT expression were specified, a priory, in the statistical analysis plan. All statistical analyses and normalization of the RNA-seq transcriptome data were performed in R statistical language (60), and a P < 0.05 was considered significant. Figures were created using the lattice package (61). Gene counts were normalized with DEseq2 (62). Gene set discovery was conducted using the randomForest package (63). Principal components analysis was executed using the stats package (60).
Correlation network and relative importance analyses were performed using nonlesional skin measurements of the AD FA+, AD FA−, and NA controls. Because of missing data in the nonlesional transcriptome data, we used a multiple imputation strategy, using all the variables in the network diagram, to create 10 imputed datasets with the predictive mean matching method of the mice R package (64). Each of the 10 resulting datasets was then analyzed using standard complete methods. The correlations across the 10 imputed datasets were pooled, and the SEs were adjusted to reflect both within imputation and between imputation variability. The relative abundance of the skin bacterial data was square root–transformed. Total severity scores (EASI, NESS, and SCORAD) were imputed with a zero for the patients with NA. A correlation network plot was constructed with the qgraph R package (65) and used the Pearson correlation coefficient. The color saturation and the width of the connecting lines correspond to the strength of the Pearson correlation coefficient, and the color of each connecting line indicates a positive (red) or negative (blue) correlation. Connecting lines were dropped between variables that did not have a significant correlation (P < 0.01), as a way to control for potential false-positive findings. For more details, a scatterplot matrix (SPLOM) was constructed showing all bivariate relationships between the variables included in the correlation network plot (fig. S9). The SPLOM includes the Pearson correlation coefficients (95% CIs) and P values (upper triangle), in addition to univariate distribution plots (diagonal) and scatterplots (lower triangle). Relative importance was calculated using the relaimpo R package (66) with the “lmg” method. The R2 of a model represents the proportion of variance explained by the set of predictors included in the model. The lmg method calculates the relative and independent contribution of each predictor to the R2 while taking care of the dependence on the ordering of predictors within the model.
Supplementary Material
Materials and Methods
Fig. S1. Lesional skin has similar baseline TEWL in AD FA+ and AD FA− groups.
Fig. S2. Pruritus correlates with TEWL AUC in AD FA+ but not AD FA−.
Fig. S3. Lamellar bilayer structural integrity is abnormal in the skin of AD FA+.
Fig. S4. Shannon diversity index.
Fig. S5. Staphylococcus and Micrococcus species are more abundant on nonlesional skin of AD FA+ versus NA.
Fig. S6. Relative abundance of various bacterial genera are similar in AD lesional skin, regardless of FA.
Fig. S7. S. aureus is more abundant in nonlesional skin of AD FA+ than NA skin but similar to AD FA−.
Fig. S8. Skin lesions of AD FA+ and AD FA− have similar abundance of the Staphylococcus species.
Fig. S9. SPLOM showing all bivariate relationships between the variables in the network diagram (Fig. 7A).
Fig. S10. Type 2 immune response gene expression in the nonlesional skin of AD FA+, AD FA−, and NA groups.
Table S1. Characteristics of study participants by diagnostic group.
Table S2. Comparisons between groups for TEWL.
Table S3. Correlations between food-specific IgE and skin test results with TEWL.
Table S4. Comparisons between groups for FLG breakdown products.
Table S5. Comparisons between groups for FLG breakdown products with the corresponding TEWL.
Table S6. Comparisons between groups total EOS CER, total C18 NS CER, and NS CER.
Table S7. Correlations between groups for total EOS CER, total C18 NS CER, and NS CER with the corresponding TEWL.
Table S8. Comparisons between groups for keratin expression in nonlesional skin.
Table S9. Correlations between keratin expression in nonlesional skin and TEWL.
Table S10. Genes (n = 288) associated with the AD FA+, AD FA−, and NA groups.
Table S11. Top 10 ingenuity canonical pathways.
References (67–73)
Data file S1. Primary data.
Data file S2. Data for the skin microbiome.
Data file S3. Data for the skin transcriptome.
Acknowledgments:
We acknowledge M. Plaut, NIAID project scientist for ADRN, and W. Davidson, NIAID program officer, for review of this manuscript and valuable advice regarding this project; and the following study coordinators at National Jewish Health for assistance in recruiting human participants and performing procedures: P. Taylor, C. Bronchick, and S. Palombi. We also thank J. Streib who orchestrated processing of the laboratory samples.
Funding: This work was funded by the NIH/NIAID Atopic Dermatitis Research Network grant numbers U19AI117673 and UM2AI117870. Partial support was provided by NIH/NCATS Colorado CTSA grant number UL1 TR002535 and the Edelstein Family Chair for Pediatric Allergy at NJH. This work was supported by NIH/NHLBI grants R01 MD010443, R01 HL135156, R01 HL128439, P01HL132821 to M.A.S. and NIH/NIAMS grant R01 AR41256 to E.G. and D.Y.M.L.
Footnotes
SUPPLEMENTARY MATERIALS
www.sciencetranslationalmedicine.org/cgi/content/full/11/480/eaav2685/DC1
Competing interests: The authors declare that they have no competing interests. D.Y.M.L., E.G., and E.B. are inventors on patent application serial no 62/746,313 submitted by National Jewish Health that covers methods of identifying AD with FA as a unique endotype.
Data and materials availability: All data associated with this study are present in the paper or the Supplementary Materials.
REFERENCES AND NOTES
- 1.Czarnowicki T, Krueger JG, Guttman-Yassky E, Novel concepts of prevention and treatment of atopic dermatitis through barrier and immune manipulations with implications for the atopic march. J. Allergy Clin. Immunol 139, 1723–1734 (2017). [DOI] [PubMed] [Google Scholar]
- 2.Tran M, Lefebvre DL, Dharma C, Dai D, Lou WYW, Subbarao P, Becker AB, Mandhane PJ, Turvey SE, Sears MR, Predicting the atopic march: Results from the Canadian healthy infant longitudinal development study. J. Allergy Clin. Immunol 141, 601–607.e8 (2018). [DOI] [PubMed] [Google Scholar]
- 3.Muraro A, Lemanske RF Jr., Hellings PW, Akdis CA, Bieber T, Casale TB, Jutel M, Ong PY, Poulsen LK, Schmid-Grendelmeier P, Simon HU, Seys SF, Agache I, Precision medicine in patients with allergic diseases: Airway diseases and atopic dermatitis—PRACTALL document of the European academy of allergy and clinical immunology and the American Academy of Allergy, Asthma & Immunology. J. Allergy Clin. Immunol 137, 1347–1358 (2016). [DOI] [PubMed] [Google Scholar]
- 4.Kezic S, O’Regan GM, Yau N, Sandilands A, Chen H, Campbell LE, Kroboth K, Watson R, Rowland M, McLean WHI, Irvine AD, Levels of filaggrin degradation products are influenced by both filaggrin genotype and atopic dermatitis severity. Allergy 66, 934–940 (2011). [DOI] [PMC free article] [PubMed] [Google Scholar]
- 5.Dyjack N, Goleva E, Rios C, Kim BE, Bin L, Taylor P, Bronchick C, Hall CF, Richers BN, Seibold MA, Leung DYM, Minimally invasive skin tape strip RNA sequencing identifies novel characteristics of the type 2–high atopic dermatitis disease endotype. J. Allergy Clin. Immunol 141, 1298–1309 (2018). [DOI] [PMC free article] [PubMed] [Google Scholar]
- 6.Berdyshev E, Goleva E, Bronova I, Dyjack N, Rios C, Jung J, Taylor P, Jeong M, Hall CF, Richers BN, Norquest KA, Zheng T, Seibold MA, Leung DYM, Lipid abnormalities in atopic skin are driven by type 2 cytokines. JCI Insight 3, 98006 (2018). [DOI] [PMC free article] [PubMed] [Google Scholar]
- 7.Broccardo CJ, Mahaffey S, Schwarz J, Wruck L, David G, Schlievert PM, Reisdorph NA, Leung DYM, Comparative proteomic profiling of patients with atopic dermatitis based on history of eczema herpeticum infection and Staphylococcus aureus colonization. J. Allergy Clin. Immunol 127, 186–193.e1–11 (2011). [DOI] [PMC free article] [PubMed] [Google Scholar]
- 8.Eigenmann PA, Sicherer SH, Borkowski TA, Cohen BA, Sampson HA, Prevalence of IgE-mediated food allergy among children with atopic dermatitis. Pediatrics 101, E8 (1998). [DOI] [PubMed] [Google Scholar]
- 9.Brough HA, Simpson A, Makinson K, Hankinson J, Brown S, Douiri A, Belgrave DCM, Penagos M, Stephens AC, McLean WHI, Turcanu V, Nicolaou N, Custovic A, Lack G, Peanut allergy: Effect of environmental peanut exposure in children with filaggrin loss-of-function mutations. J. Allergy Clin. Immunol 134, 867–875.e1 (2014). [DOI] [PMC free article] [PubMed] [Google Scholar]
- 10.Irvine AD, McLean WHI, Leung DYM, Filaggrin mutations associated with skin and allergic diseases. N. Engl. J. Med 365, 1315–1327 (2011). [DOI] [PubMed] [Google Scholar]
- 11.Lack G, Fox D, Northstone K, Golding J; Avon Longitudinal Study of Parents and Children Study Team, Factors associated with the development of peanut allergy in childhood. N. Engl. J. Med 348, 977–985 (2003). [DOI] [PubMed] [Google Scholar]
- 12.Tordesillas L, Goswami R, Benedé S, Grishina G, Dunkin D, Järvinen KM, Maleki SJ, Sampson HA, Berin MC, Skin exposure promotes a Th2-dependent sensitization to peanut allergens. J. Clin. Invest 124, 4965–4975 (2014). [DOI] [PMC free article] [PubMed] [Google Scholar]
- 13.Lin T-K, Crumrine D, Ackerman LD, Santiago J-L, Roelandt T, Uchida Y, Hupe M, Fabriàs G, Abad JL, Rice RH, Elias PM, Cellular changes that accompany shedding of human corneocytes. J. Invest. Dermatol 132, 2430–2439 (2012). [DOI] [PMC free article] [PubMed] [Google Scholar]
- 14.Fuchs E, Epidermal differentiation: The bare essentials. J. Cell Biol 111, 2807–2814 (1990). [DOI] [PMC free article] [PubMed] [Google Scholar]
- 15.Candi E, Schmidt R, Melino G, The cornified envelope: A model of cell death in the skin. Nat. Rev. Mol. Cell Biol 6, 328–340 (2005). [DOI] [PubMed] [Google Scholar]
- 16.Bikle DD, Xie Z, Tu C-L, Calcium regulation of keratinocyte differentiation. Expert Rev. Endocrinol. Metab 7, 461–472 (2012). [DOI] [PMC free article] [PubMed] [Google Scholar]
- 17.Bragulla HH, Homberger DG, Structure and functions of keratin proteins in simple, stratified, keratinized and cornified epithelia. J. Anat 214, 516–559 (2009). [DOI] [PMC free article] [PubMed] [Google Scholar]
- 18.Lessard JC, Piña-Paz S, Rotty JD, Hickerson RP, Kaspar RL, Balmain A, Coulombe PA, Keratin 16 regulates innate immunity in response to epidermal barrier breach. Proc. Natl. Acad. Sci. U.S.A 110, 19537–19542 (2013). [DOI] [PMC free article] [PubMed] [Google Scholar]
- 19.Blom LH, Martel BC, Larsen LF, Hansen CV, Christensen MP, Juel-Berg N, Litman T, Poulsen LK, The immunoglobulin superfamily member CD200R identifies cells involved in type 2 immune responses. Allergy 72, 1081–1090 (2017). [DOI] [PubMed] [Google Scholar]
- 20.Seidenari S, Giusti G, Objective assessment of the skin of children affected by atopic dermatitis: A study of pH, capacitance and TEWL in eczematous and clinically uninvolved skin. Acta Derm. Venereol 75, 429–433 (1995). [DOI] [PubMed] [Google Scholar]
- 21.Kelleher M, Dunn-Galvin A, Hourihane JO, Murray D, Campbell LE, McLean WHI, Irvine AD, Skin barrier dysfunction measured by transepidermal water loss at 2 days and 2 months predates and predicts atopic dermatitis at 1 year. J. Allergy Clin. Immunol 135, 930–935.e1 (2015). [DOI] [PMC free article] [PubMed] [Google Scholar] [Retracted]
- 22.Kelleher MM, Dunn-Galvin A, Gray C, Murray DM, Kiely M, Kenny L, McLean WHI, Irvine AD, Hourihane JO, Skin barrier impairment at birth predicts food allergy at 2 years of age. J. Allergy Clin. Immunol 137, 1111–1116.e8 (2016). [DOI] [PubMed] [Google Scholar]
- 23.Oyoshi MK, Larson RP, Ziegler SF, Geha RS, Mechanical injury polarizes skin dendritic cells to elicit a TH2 response by inducing cutaneous thymic stromal lymphopoietin expression. J. Allergy Clin. Immunol 126, 976–984.e1–5 (2010). [DOI] [PMC free article] [PubMed] [Google Scholar]
- 24.Walker MT, Green JE, Ferrie RP, Queener AM, Kaplan MH, Cook-Mills JM, Mechanism for initiation of food allergy: Dependence on skin barrier mutations and environmental allergen costimulation. J. Allergy Clin. Immunol 141, 1711–1725.e9 (2018). [DOI] [PMC free article] [PubMed] [Google Scholar]
- 25.Trier AM, Kim BS, Cytokine modulation of atopic itch. Curr. Opin. Immunol 54, 7–12 (2018). [DOI] [PMC free article] [PubMed] [Google Scholar]
- 26.Liu B, Tai Y, Achanta S, Kaelberer MM, Caceres AI, Shao X, Fang J, Jordt S-E, IL-33/ST2 signaling excites sensory neurons and mediates itch response in a mouse model of poison ivy contact allergy. Proc. Natl. Acad. Sci. U.S.A 113, E7572–E7579 (2016). [DOI] [PMC free article] [PubMed] [Google Scholar]
- 27.Oetjen LK, Mack MR, Feng J, Whelan TM, Niu H, Guo CJ, Chen S, Trier AM, Xu AZ, Tripathi SV, Luo J, Gao X, Yang L, Hamilton SL, Wang PL, Brestoff JR, Council ML, Brasington R, Schaffer A, Brombacher F, Hsieh C-S, Gereau RW, Miller MJ, Chen Z-F, Hu H, Davidson S, Liu Q, Kim BS, Sensory neurons co-opt classical immune signaling pathways to mediate chronic itch. Cell 171, 217–228.e13 (2017). [DOI] [PMC free article] [PubMed] [Google Scholar]
- 28.Simpson EL, Bieber T, Guttman-Yassky E, Beck LA, Blauvelt A, Cork MJ, Silverberg JI, Deleuran M, Kataoka Y, Lacour J-P, Kingo K, Worm M, Poulin Y, Wollenberg A, Soo Y, Graham NMH, Pirozzi G, Akinlade B, Staudinger H, Mastey V, Eckert L, Gadkari A, Stahl N, Yancopoulos GD, Ardeleanu M; SOLO 1 and SOLO 2 Investigators, Two phase 3 trials of dupilumab versus placebo in atopic dermatitis. N. Engl. J. Med 375, 2335–2348 (2016). [DOI] [PubMed] [Google Scholar]
- 29.Flohr C, Perkin M, Logan K, Marrs T, Radulovic S, Campbell LE, MacCallum SF, McLean WHI, Lack G, Atopic dermatitis and disease severity are the main risk factors for food sensitization in exclusively breastfed infants. J. Invest. Dermatol 134, 345–350 (2014). [DOI] [PMC free article] [PubMed] [Google Scholar]
- 30.Brown S, Asai Y, Cordell HJ, Campbell LE, Zhao Y, Liao H, Northstone K, Henderson J, Alizadehfar R, Ben-Shoshan M, Morgan K, Roberts G, Masthoff LJN, Pasmans SGMA, van den Akker PC, Wijmenga C, Hourihane JO, Palmer CNA, Lack G, Clarke A, Hull PR, Irvine AD, McLean WHI, Loss-of-function variants in the filaggrin gene are a significant risk factor for peanut allergy. J. Allergy Clin. Immunol 127, 661–667 (2011). [DOI] [PMC free article] [PubMed] [Google Scholar]
- 31.Brough HA, Liu AH, Sicherer S, Makinson K, Douiri A, Brown SJ, Stephens AC, McLean WHI, Turcanu V, Wood RA, Jones SM, Burks W, Dawson P, Stablein D, Sampson H, Lack G, Atopic dermatitis increases the effect of exposure to peanut antigen in dust on peanut sensitization and likely peanut allergy. J. Allergy Clin. Immunol 135, 164–170 (2015). [DOI] [PMC free article] [PubMed] [Google Scholar]
- 32.Thyssen JP, Kezic S, Causes of epidermal filaggrin reduction and their role in the pathogenesis of atopic dermatitis. J. Allergy Clin. Immunol 134, 792–799 (2014). [DOI] [PubMed] [Google Scholar]
- 33.Howell MD, Kim BE, Gao P, Grant AV, Boguniewicz M, Debenedetto A, Schneider L, Beck LA, Barnes KC, Leung DYM, Cytokine modulation of atopic dermatitis filaggrin skin expression. J. Allergy Clin. Immunol 120, 150–155 (2007). [DOI] [PMC free article] [PubMed] [Google Scholar]
- 34.Kim BE, Leung DYM, Boguniewicz M, Howell MD, Loricrin and involucrin expression is down-regulated by Th2 cytokines through STAT-6. Clin. Immunol 126, 332–337 (2008). [DOI] [PMC free article] [PubMed] [Google Scholar]
- 35.Pendaries V, Malaisse J, Pellerin L, Le Lamer M, Nachat R, Kezic S, Schmitt A-M, Paul C, Poumay Y, Serre G, Simon M, Knockdown of filaggrin in a three-dimensional reconstructed human epidermis impairs keratinocyte differentiation. J. Invest. Dermatol 134, 2938–2946 (2014). [DOI] [PubMed] [Google Scholar]
- 36.Vávrova K, Henkes D, Strüver K, Sochorová M, Školová B, Witting MY, Friess W, Schreml S, Meier RJ, Schäfer-Korting M, Fluhr JW, Küchler S, Filaggrin deficiency leads to impaired lipid profile and altered acidification pathways in a 3D skin construct. J. Invest. Dermatol 134, 746–753 (2014). [DOI] [PubMed] [Google Scholar]
- 37.Gruber R, Elias PM, Crumrine D, Lin T-K, Brandner JM, Hachem J-P, Presland RB, Fleckman P, Janecke AR, Sandilands A, McLean WHI, Fritsch PO, Mildner M, Tschachler E, Schmuth M, Filaggrin genotype in ichthyosis vulgaris predicts abnormalities in epidermal structure and function. Am. J. Pathol 178, 2252–2263 (2011). [DOI] [PMC free article] [PubMed] [Google Scholar]
- 38.Elias PM, Wakefield JS, Mechanisms of abnormal lamellar body secretion and the dysfunctional skin barrier in patients with atopic dermatitis. J. Allergy Clin. Immunol 134, 781–791.e1 (2014). [DOI] [PMC free article] [PubMed] [Google Scholar]
- 39.Marekov LN, Steinert PM, Ceramides are bound to structural proteins of the human foreskin epidermal cornified cell envelope. J. Biol. Chem 273, 17763–17770 (1998). [DOI] [PubMed] [Google Scholar]
- 40.Nakatsuji T, Chen TH, Two AM, Chun KA, Narala S, Geha RS, Hata TR, Gallo RL, Staphylococcus aureus exploits epidermal barrier defects in atopic dermatitis to trigger cytokine expression. J. Invest. Dermatol 136, 2192–2200 (2016). [DOI] [PMC free article] [PubMed] [Google Scholar]
- 41.Williams MR, Nakatsuji T, Sanford JA, Vrbanac AF, Gallo RL, Staphylococcus aureus induces increased serine protease activity in keratinocytes. J. Invest. Dermatol 137, 377–384 (2017). [DOI] [PMC free article] [PubMed] [Google Scholar]
- 42.Kennedy EA, Connolly J, Hourihane JO, Fallon PG, McLean WHI, Murray D, Jo J-H, Segre JA, Kong HH, Irvine AD, Skin microbiome before development of atopic dermatitis: Early colonization with commensal staphylococci at 2 months is associated with a lower risk of atopic dermatitis at 1 year. J. Allergy Clin. Immunol 139, 166–172 (2017). [DOI] [PMC free article] [PubMed] [Google Scholar]
- 43.Meylan P, Lang C, Mermoud S, Johannsen A, Norrenberg S, Hohl D, Vial Y, Prod’hom G, Greub G, Kypriotou M, Christen-Zaech S, Skin colonization by Staphylococcus aureus precedes the clinical diagnosis of atopic dermatitis in infancy. J. Invest. Dermatol 137, 2497–2504 (2017). [DOI] [PubMed] [Google Scholar]
- 44.Nakatsuji T, Chen TH, Narala S, Chun KA, Two AM, Yun T, Shafiq F, Kotol PF, Bouslimani A, Melnik AV, Latif H, Kim J-N, Lockhart A, Artis K, David G, Taylor P, Streib J, Dorrestein PC, Grier A, Gill SR, Zengler K, Hata TR, Leung DYM, Gallo RL, Antimicrobials from human skin commensal bacteria protect against Staphylococcus aureus and are deficient in atopic dermatitis. Sci. Transl. Med 9, eaah4680 (2017). [DOI] [PMC free article] [PubMed] [Google Scholar]
- 45.Ong PY, Ohtake T, Brandt C, Strickland I, Boguniewicz M, Ganz T, Gallo RL, Leung DYM, Endogenous antimicrobial peptides and skin infections in atopic dermatitis. N. Engl. J. Med 347, 1151–1160 (2002). [DOI] [PubMed] [Google Scholar]
- 46.Kim J, Kim BE, Lee J, Han Y, Jun H-Y, Kim H, Choi J, Leung DYM, Ahn K, Epidermal thymic stromal lymphopoietin predicts the development of atopic dermatitis during infancy. J. Allergy Clin. Immunol 137, 1282–1285.e4 (2016). [DOI] [PubMed] [Google Scholar]
- 47.Kobayashi T, Glatz M, Horiuchi K, Kawasaki H, Akiyama H, Kaplan DH, Kong HH, Amagai M, Nagao K, Dysbiosis and Staphylococcus aureus colonization drives inflammation in atopic dermatitis. Immunity 42, 756–766 (2015). [DOI] [PMC free article] [PubMed] [Google Scholar]
- 48.Jones AL, Curran-Everett D, Leung DYM, Food allergy is associated with Staphylococcus aureus colonization in children with atopic dermatitis. J. Allergy Clin. Immunol 137, 1247–1248.e3 (2016). [DOI] [PubMed] [Google Scholar]
- 49.Lowe AJ, Su JC, Allen KJ, Abramson MJ, Cranswick N, Robertson CF, Forster D, Varigos G, Hamilton S, Kennedy R, Axelrad C, Tang MLK, Dharmage SC, A randomized trial of a barrier lipid replacement strategy for the prevention of atopic dermatitis and allergic sensitization: The PEBBLES pilot study. Br. J. Dermatol 178, e19–e21 (2018). [DOI] [PubMed] [Google Scholar]
- 50.Keet CA, Wood RA, Emerging therapies for food allergy. J. Clin. Invest 124, 1880–1886 (2014). [DOI] [PMC free article] [PubMed] [Google Scholar]
- 51.Omori-Miyake M, Yamashita M, Tsunemi Y, Kawashima M, Yagi J, In vitro assessment of IL-4- or IL-13-mediated changes in the structural components of keratinocytes in mice and humans. J. Invest. Dermatol 134, 1342–1350 (2014). [DOI] [PubMed] [Google Scholar]
- 52.Hamilton JD, Suárez-Fariñas M, Dhingra N, Cardinale I, Li X, Kostic A, Ming JE, Radin AR, Krueger JG, Graham N, Yancopoulos GD, Pirozzi G, Guttman-Yassky E, Dupilumab improves the molecular signature in skin of patients with moderate-to-severe atopic dermatitis. J. Allergy Clin. Immunol 134, 1293–1300 (2014). [DOI] [PubMed] [Google Scholar]
- 53.Beck LA, Thaçi D, Hamilton JD, Graham NM, Bieber T, Rocklin R, Ming JE, Ren H, Kao R, Simpson E, Ardeleanu M, Weinstein SP, Pirozzi G, Guttman-Yassky E, Suárez-Fariñas M, Hager MD, Stahl N, Yancopoulos GD, Radin AR, Dupilumab treatment in adults with moderate-to-severe atopic dermatitis. N. Engl. J. Med 371, 130–139 (2014). [DOI] [PubMed] [Google Scholar]
- 54.Beck LA, Boguniewicz M, Hata T, Schneider LC, Hanifin J, Gallo R, Paller AS, Lieff S, Reese J, Zaccaro D, Milgrom H, Barnes KC, Leung DYM, Phenotype of atopic dermatitis subjects with a history of eczema herpeticum. J. Allergy Clin. Immunol 124, 260–269.e7 (2009). [DOI] [PMC free article] [PubMed] [Google Scholar]
- 55.Roberts G, Lack G, Diagnosing peanut allergy with skin prick and specific IgE testing. J. Allergy Clin. Immunol 115, 1291–1296 (2005). [DOI] [PubMed] [Google Scholar]
- 56.Consensus Report of the European Task Force on Atopic Dermatitis, Severity scoring of atopic dermatitis: The SCORAD index. Dermatology 186, 23–31 (1993). [DOI] [PubMed] [Google Scholar]
- 57.Emerson RM, Charman CR, Williams HC, The Nottingham eczema severity score: Preliminary refinement of the Rajka and Langeland grading. Br. J. Dermatol 142, 288–297 (2000). [DOI] [PubMed] [Google Scholar]
- 58.Phan NQ, Blome C, Fritz F, Gerss J, Reich A, Ebata T, Augustin M, Szepietowski JC, Stander S, Assessment of pruritus intensity: Prospective study on validity and reliability of the visual analogue scale, numerical rating scale and verbal rating scale in 471 patients with chronic pruritus. Acta Derm. Venereol 92, 502–507 (2012). [DOI] [PubMed] [Google Scholar]
- 59.Leshem YA, Hajar T, Hanifin JM, Simpson EL, What the eczema area and severity index score tells us about the severity of atopic dermatitis: An interpretability study. Br. J. Dermatol 172, 1353–1357 (2015). [DOI] [PubMed] [Google Scholar]
- 60.R Core Team, R: A language and environment for statistical computing. R Foundation for Statistical Computing; (2013); www.r-project.org/. [Google Scholar]
- 61.Sarkar D, Lattice: Multivariate Data Visualization with R (Springer, 2008). [Google Scholar]
- 62.Love MI, Huber W, Anders S, Moderated estimation of fold change and dispersion for RNA-seq data with DESeq2. Genome Biol. 15, 550 (2014). [DOI] [PMC free article] [PubMed] [Google Scholar]
- 63.Liaw A, Wiener M, Classification and regression by randomForest. R. News 2, 18–22 (2002). [Google Scholar]
- 64.van Buuren S, Groothuis-Oudshoorn K, Mice: Multivariate imputation by chained equations in R. J. Stat. Soft 45, 1–67 (2011). [Google Scholar]
- 65.Epskamp S, Cramer AOJ, Waldorp LJ, Schmittman VD, Borsboom D, Qgraph: Network visualizations of relationships in psychometric data. J. Stat. Soft 48, 1–18 (2012). [Google Scholar]
- 66.Grömping U, Relative importance for linear regression in R: The package relaimpo. J. Stat. Soft 17, 1–27 (2006). [Google Scholar]
- 67.Simpson EL, Villarreal M, Jepson B, Rafaels N, David G, Hanifin J, Taylor P, Boguniewicz M, Yoshida T, De Benedetto A, Barnes KC, Leung DYM, Beck LA, Patients with atopic dermatitis colonized with Staphylococcus aureus have a distinct phenotype and endotype. J. Invest. Dermatol 138, 2224–2233 (2018). [DOI] [PMC free article] [PubMed] [Google Scholar]
- 68.Joo K-M, Han JY, Son ED, Nam G-W, Chung HY, Jeong HJ, Cho J-C, Lim K-M, Rapid, simultaneous and nanomolar determination of pyroglutamic acid and cis-/trans-urocanic acid in human stratum corneum by hydrophilic interaction liquid chromatography (HILIC)–electrospray ionization tandem mass spectrometry. J. Chromatogr. B Analyt. Technol. Biomed. Life Sci 897, 55–63 (2012). [DOI] [PubMed] [Google Scholar]
- 69.Bligh EG, Dyer WJ, A rapid method of total lipid extraction and purification. Can. J. Biochem. Physiol 37, 911–917 (1959). [DOI] [PubMed] [Google Scholar]
- 70.Bolger AM, Lohse M, Usadel B, Trimmomatic: A flexible trimmer for Illumina sequence data. Bioinformatics 30, 2114–2120 (2014). [DOI] [PMC free article] [PubMed] [Google Scholar]
- 71.Embree M, Liu JK, Al-Bassam MM, Zengler K, Networks of energetic and metabolic interactions define dynamics in microbial communities. Proc. Natl. Acad. Sci. U.S.A 112, 15450–15455 (2015). [DOI] [PMC free article] [PubMed] [Google Scholar]
- 72.Thompson A, Schäfer J, Kuhn K, Kienle S, Schwarz J, Schmidt G, Neumann T, Hamon C, Tandem mass tags: A novel quantification strategy for comparative analysis of complex protein mixtures by MS/MS. Anal. Chem 75, 1895–1904 (2003). [DOI] [PubMed] [Google Scholar]
- 73.Calatroni A, Wildfire JJ, Graphic depiction of bioinformatics data. J. Allergy Clin. Immunol 140, 1519–1522 (2017). [DOI] [PubMed] [Google Scholar]
Associated Data
This section collects any data citations, data availability statements, or supplementary materials included in this article.
Supplementary Materials
Materials and Methods
Fig. S1. Lesional skin has similar baseline TEWL in AD FA+ and AD FA− groups.
Fig. S2. Pruritus correlates with TEWL AUC in AD FA+ but not AD FA−.
Fig. S3. Lamellar bilayer structural integrity is abnormal in the skin of AD FA+.
Fig. S4. Shannon diversity index.
Fig. S5. Staphylococcus and Micrococcus species are more abundant on nonlesional skin of AD FA+ versus NA.
Fig. S6. Relative abundance of various bacterial genera are similar in AD lesional skin, regardless of FA.
Fig. S7. S. aureus is more abundant in nonlesional skin of AD FA+ than NA skin but similar to AD FA−.
Fig. S8. Skin lesions of AD FA+ and AD FA− have similar abundance of the Staphylococcus species.
Fig. S9. SPLOM showing all bivariate relationships between the variables in the network diagram (Fig. 7A).
Fig. S10. Type 2 immune response gene expression in the nonlesional skin of AD FA+, AD FA−, and NA groups.
Table S1. Characteristics of study participants by diagnostic group.
Table S2. Comparisons between groups for TEWL.
Table S3. Correlations between food-specific IgE and skin test results with TEWL.
Table S4. Comparisons between groups for FLG breakdown products.
Table S5. Comparisons between groups for FLG breakdown products with the corresponding TEWL.
Table S6. Comparisons between groups total EOS CER, total C18 NS CER, and NS CER.
Table S7. Correlations between groups for total EOS CER, total C18 NS CER, and NS CER with the corresponding TEWL.
Table S8. Comparisons between groups for keratin expression in nonlesional skin.
Table S9. Correlations between keratin expression in nonlesional skin and TEWL.
Table S10. Genes (n = 288) associated with the AD FA+, AD FA−, and NA groups.
Table S11. Top 10 ingenuity canonical pathways.
References (67–73)
Data file S1. Primary data.
Data file S2. Data for the skin microbiome.
Data file S3. Data for the skin transcriptome.