Summary
Myeloid malignancies, including acute myeloid leukemia (AML), arise from the expansion of hematopoietic stem/progenitor cells which acquire somatic mutations. Bulk molecular profiling suggests step-wise mutation acquisition, where mutant genes with high variant allele frequencies (VAFs) occur early in leukemogenesis and mutations with lower VAFs are thought to be acquired later1–3. Although bulk sequencing informs leukemia biology and prognostication, it cannot distinguish which mutations occur in the same clone(s), accurately measure clonal complexity, or definitively elucidate mutational order. To delineate the clonal framework of myeloid malignancies, we performed single cell mutational profiling on 146 samples from 123 patients. We found AML is dominated by a small number of clones, which frequently harbor co-occurring mutations in epigenetic regulators. Conversely, mutations in signaling genes often occur more than once in distinct subclones consistent with increasing clonal diversity. We next mapped clonal trajectories for each sample and uncovered mutation combinations that synergized to promote clonal expansion and dominance. Finally, we combined protein expression with mutational analysis to map somatic genotype and clonal architecture with immunophenotype. Our studies of single cell clonal architecture provides novel insights into the pathogenesis of myeloid transformation and how clonal complexity evolves with disease progression.
Results
The genomic landscape of myeloid malignancies (MM) has been well described, with a near complete catalogue of putative driver mutations3–7. While specific mutation combinations have been investigated in preclinical models, there remains uncertainty about the co-occurrence and functional relevance of mutations at a clonal level. To analyze the clonal architecture of MM, we used a custom amplicon panel covering 31 frequently mutated genes to perform single cell DNA sequencing (scDNA-seq) (Supplementary Table 1)8. We sequenced 740,529 cells from 146 samples from 123 MM patients with clonal hematopoiesis (CH), myeloproliferative neoplasms (MPN), or AML (Extended Figure 1A). We queried samples from patients at diagnosis and relapse; the majority being from patients with relapsed/refractory disease (Extended Figure 1B; Supplementary Table 2). The most common mutations identified with scDNA-seq were in DNMT3A (n=62 patients), TET2 (n=58 patients), NPM1 (n=37 patients) and FLT3 (n=32 patients), consistent with previous bulk sequencing studies3–5 (Extended Figure 1C–D). Eighty percent of patients had ≥3 mutations in or near exons (Extended Figure 1E–F). Reconstructed VAF from single cell data significantly correlated with bulk sequencing (Pearson ρ = 0.84; p ≤ 2.2 × 10⁻¹⁶ ; Extended Figure 1G). ScDNA-seq further identified rare mutations not present in bulk sequencing, which had significantly lower VAF than mutations found in bulk sequencing (Extended Figure 1H; p < 2.2×10⁻¹⁶).
Clonal architecture in MM
We next investigated disease subtypes, subdividing AML into samples with epigenetic mutations (DTAI; DNMT3A, TET2, ASXL1 and/or IDH1/2), signaling mutations (JAK2/RAS/FLT3) without DTAI mutations and AML with DTAI and co-mutated signaling effectors. The number of mutations per sample increased significantly from CH to MPN and then AML (Figure 1A; FDR p ≤ 7.15×10⁻⁶ - 0.067 for all indicated comparisons). This was more pronounced in AML cases with signaling effector mutations, specifically RAS and FLT3 (FDR p ≤ 0.075). We next explored clonal repertoire, where clones were defined by cells that had identical protein encoding SNVs, and a bootstrapping approach was applied to identify clones that were observed in at least 10 cells (Figure 1B, Extended Figure 2A). We observed a significant increase in clone number in AML compared to MPN or CH (Figure 1C; FDR p ≤ 1.37×10⁻⁴ - 0.026 for all indicated comparisons) with the highest number of clones in FLT3-mutant AML samples (FDR p ≤ 1.37×10⁻⁴). We assessed the diversity of clone size on a per sample basis and observed a significant increase from CH or MPN to AML (FDR p ≤ 0.008; Figure 1D). We observed significantly higher clonal diversity in RAS and FLT3 mutant samples compared to both CH/MPN samples and RAS/FLT3-wildtype AML samples (FDR p ≤ 0.039). Despite increased complexity, most AML patients had one (75.6%; 65/86) or two (10.5%; 9/86) clones that accounted ≥30% of cells. We found a significant decrease in the relative size of the largest clone in different AML subtypes consistent with the presence of multiple clones with increased fitness (Figure 1E; FDR p ≤ 0.0102 – 0.074). This increased clonal diversity in AML did not coincide with difference in the number of mutations within the largest clone (Extended Figure 2B–C). These data suggest that increased mutational burden within a clone is not the primary driver of clonal dominance.
Figure 1. Single cell DNA sequencing of patients with myeloid malignancies.
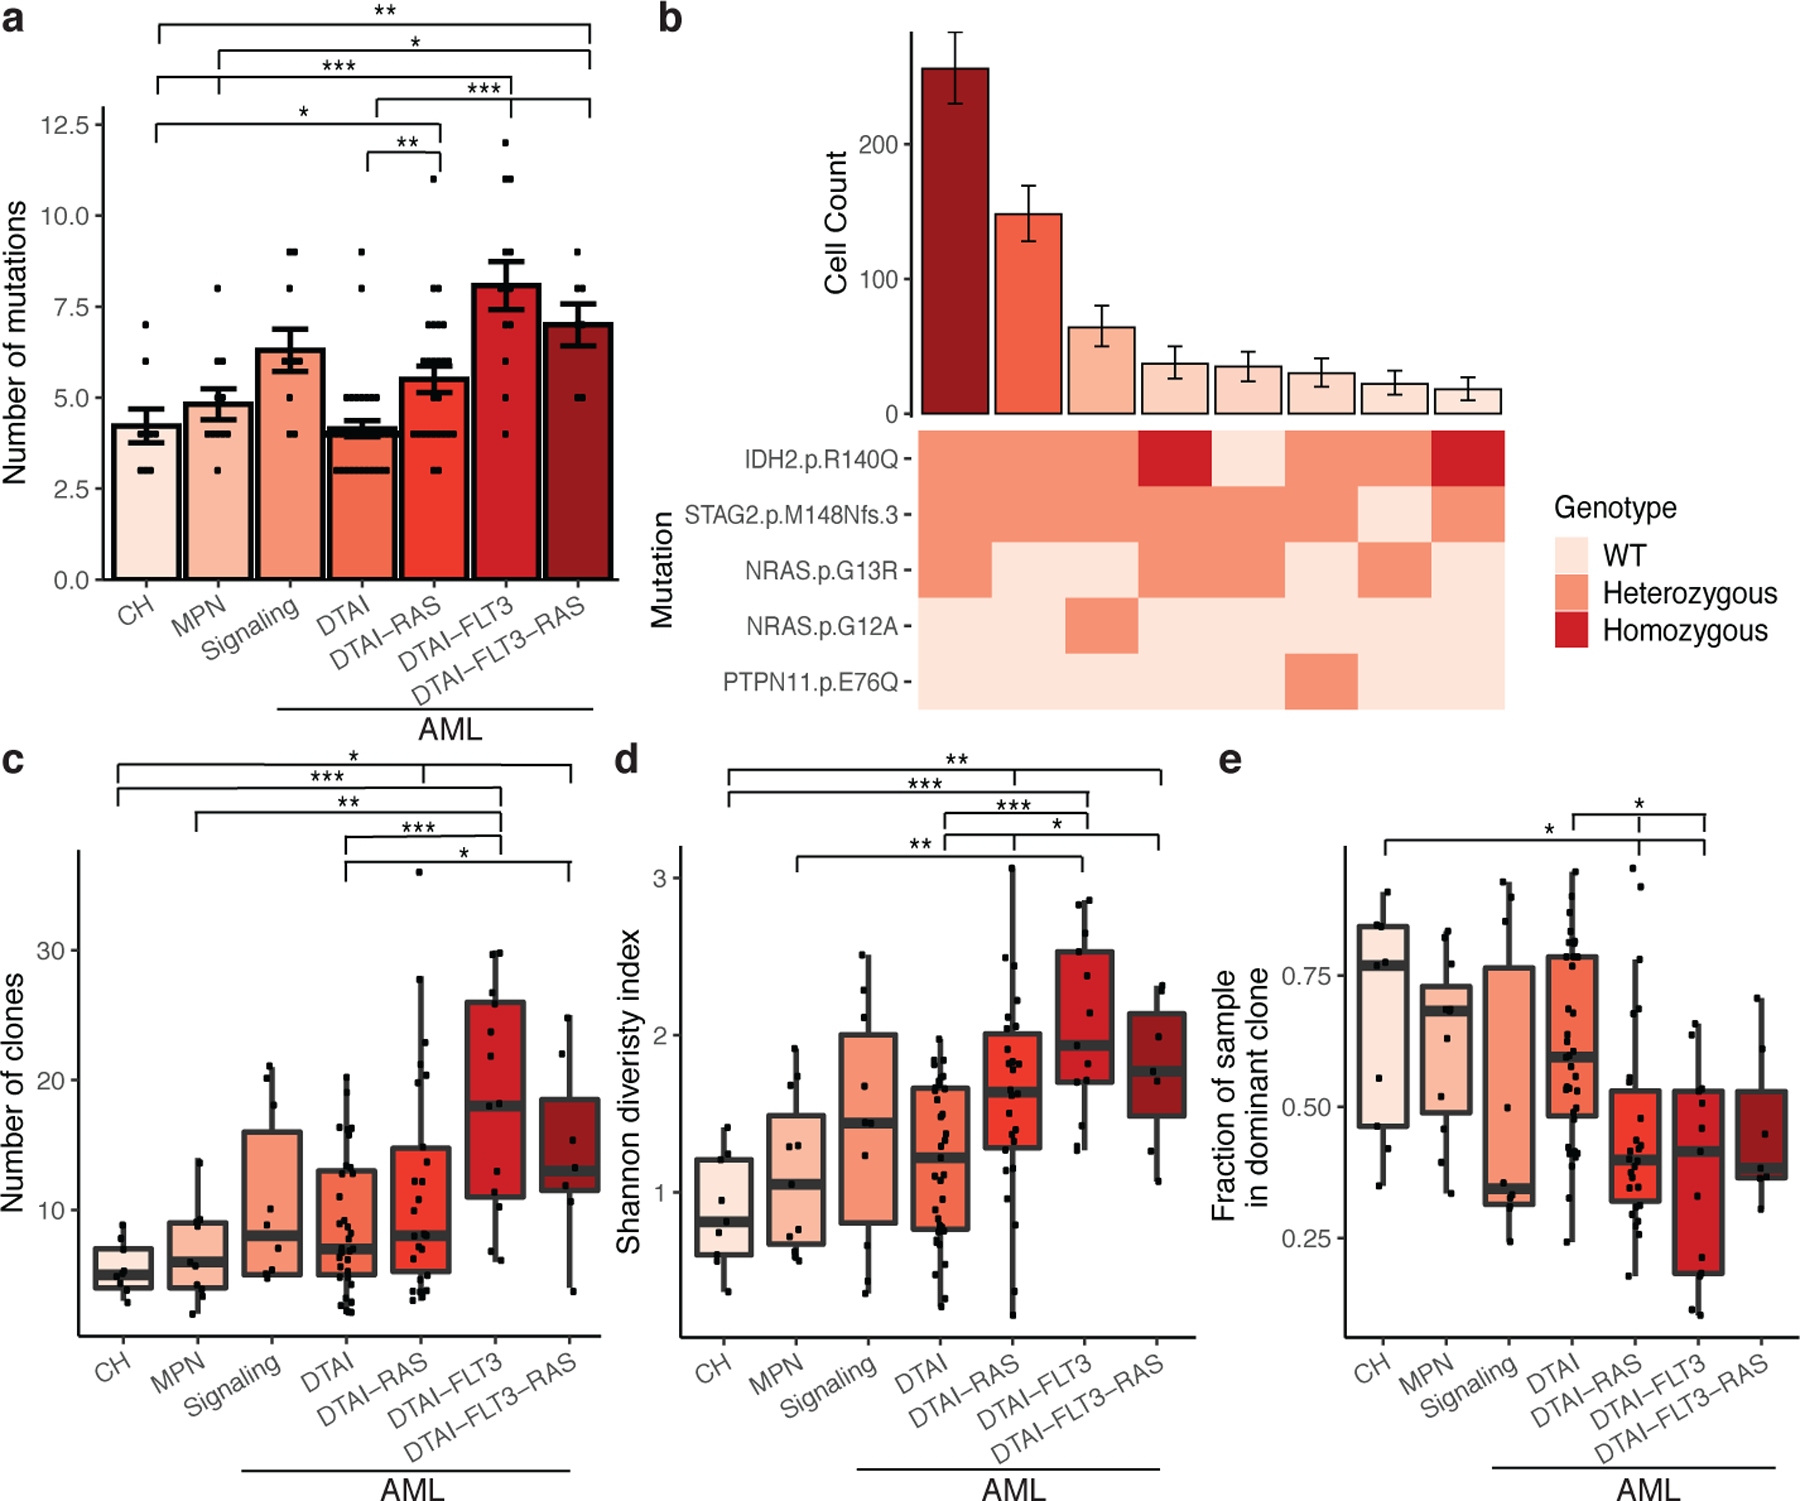
A) Bar plot of the number of identified mutations in each sample (n =111 biologically independent samples; A, C-E) with samples by cohort. Mean value indicated by height of bar with error bars depicting standard error measurement. A two-sided t-test with false discovery rate (FDR) correction was used to determine statistical significance pairwise between groups (A, C-E). For clarity, only significant p-values referenced in text are shown. * P < 0.1; ** P < 0.01; ***P < 0.001 (A, C-E). B) Bar plot depicts the number of cells identified with a given genotype and ranked by decreasing frequency (top panel). Mean cell counts for each clone depicted with 95% confidence intervals. Heatmap indicates mutation zygosity for each clone (wildtype = light pink, heterozygous = orange, homozygous = red). C-E) Boxplot depicting the number of unique clones per sample for each cohort (C), clonal diversity calculated by the Shannon diversity index (D), and the fraction of cells in the dominant clone (E) for each sample (center line: median; box: interquartile range (IQR); whiskers: 1.5xIQR; C-E).
Mutation patterns in clonal architecture
We next investigated if specific genes were more likely to be mutated in the dominant clone (Figure 2A, Extended Figure 2D). This revealed gene-specific contributions to clonal expansion, with IDH2, NPM1 and JAK2 mutations nearly always in the dominant clone, while FLT3 or RAS mutations were found only in minor subclones in some patients, and dominant clones in others. The presence of a mutation in the dominant clone could be inferred from VAF in some cases (Extended Figure 2E), especially JAK2 which has a known relationship between VAF and clonal dominance in MPN9–11. Mutational inclusivity and exclusivity patterns on a per sample basis were consistent with previously reported associations3 (Extended Figure 2F). Amongst the 80 AML samples with DTAI mutations, 52.5% of these samples harbored mutations in more than one epigenetic modifier (Figure 2B). In nearly all cases epigenetic regulator mutations were in the same clone, and in 81% of cases the co-occurring mutations were within the dominant clone suggesting cooperativity between DTAI mutations (Figure 2C). DTAI mutations did not occur in the same clone in CH samples, suggesting that early clonal expansion is commonly mediated by individual mutations in epigenetic regulators (Extended Figure 3A). By contrast, co-occurring signaling mutations such as RAS and FLT3 very rarely occurred within the same clone, and almost never within the dominant clone (Figure 2D).
Figure 2. Elucidation of clonal dominance and co-mutation by single cell DNA sequencing.
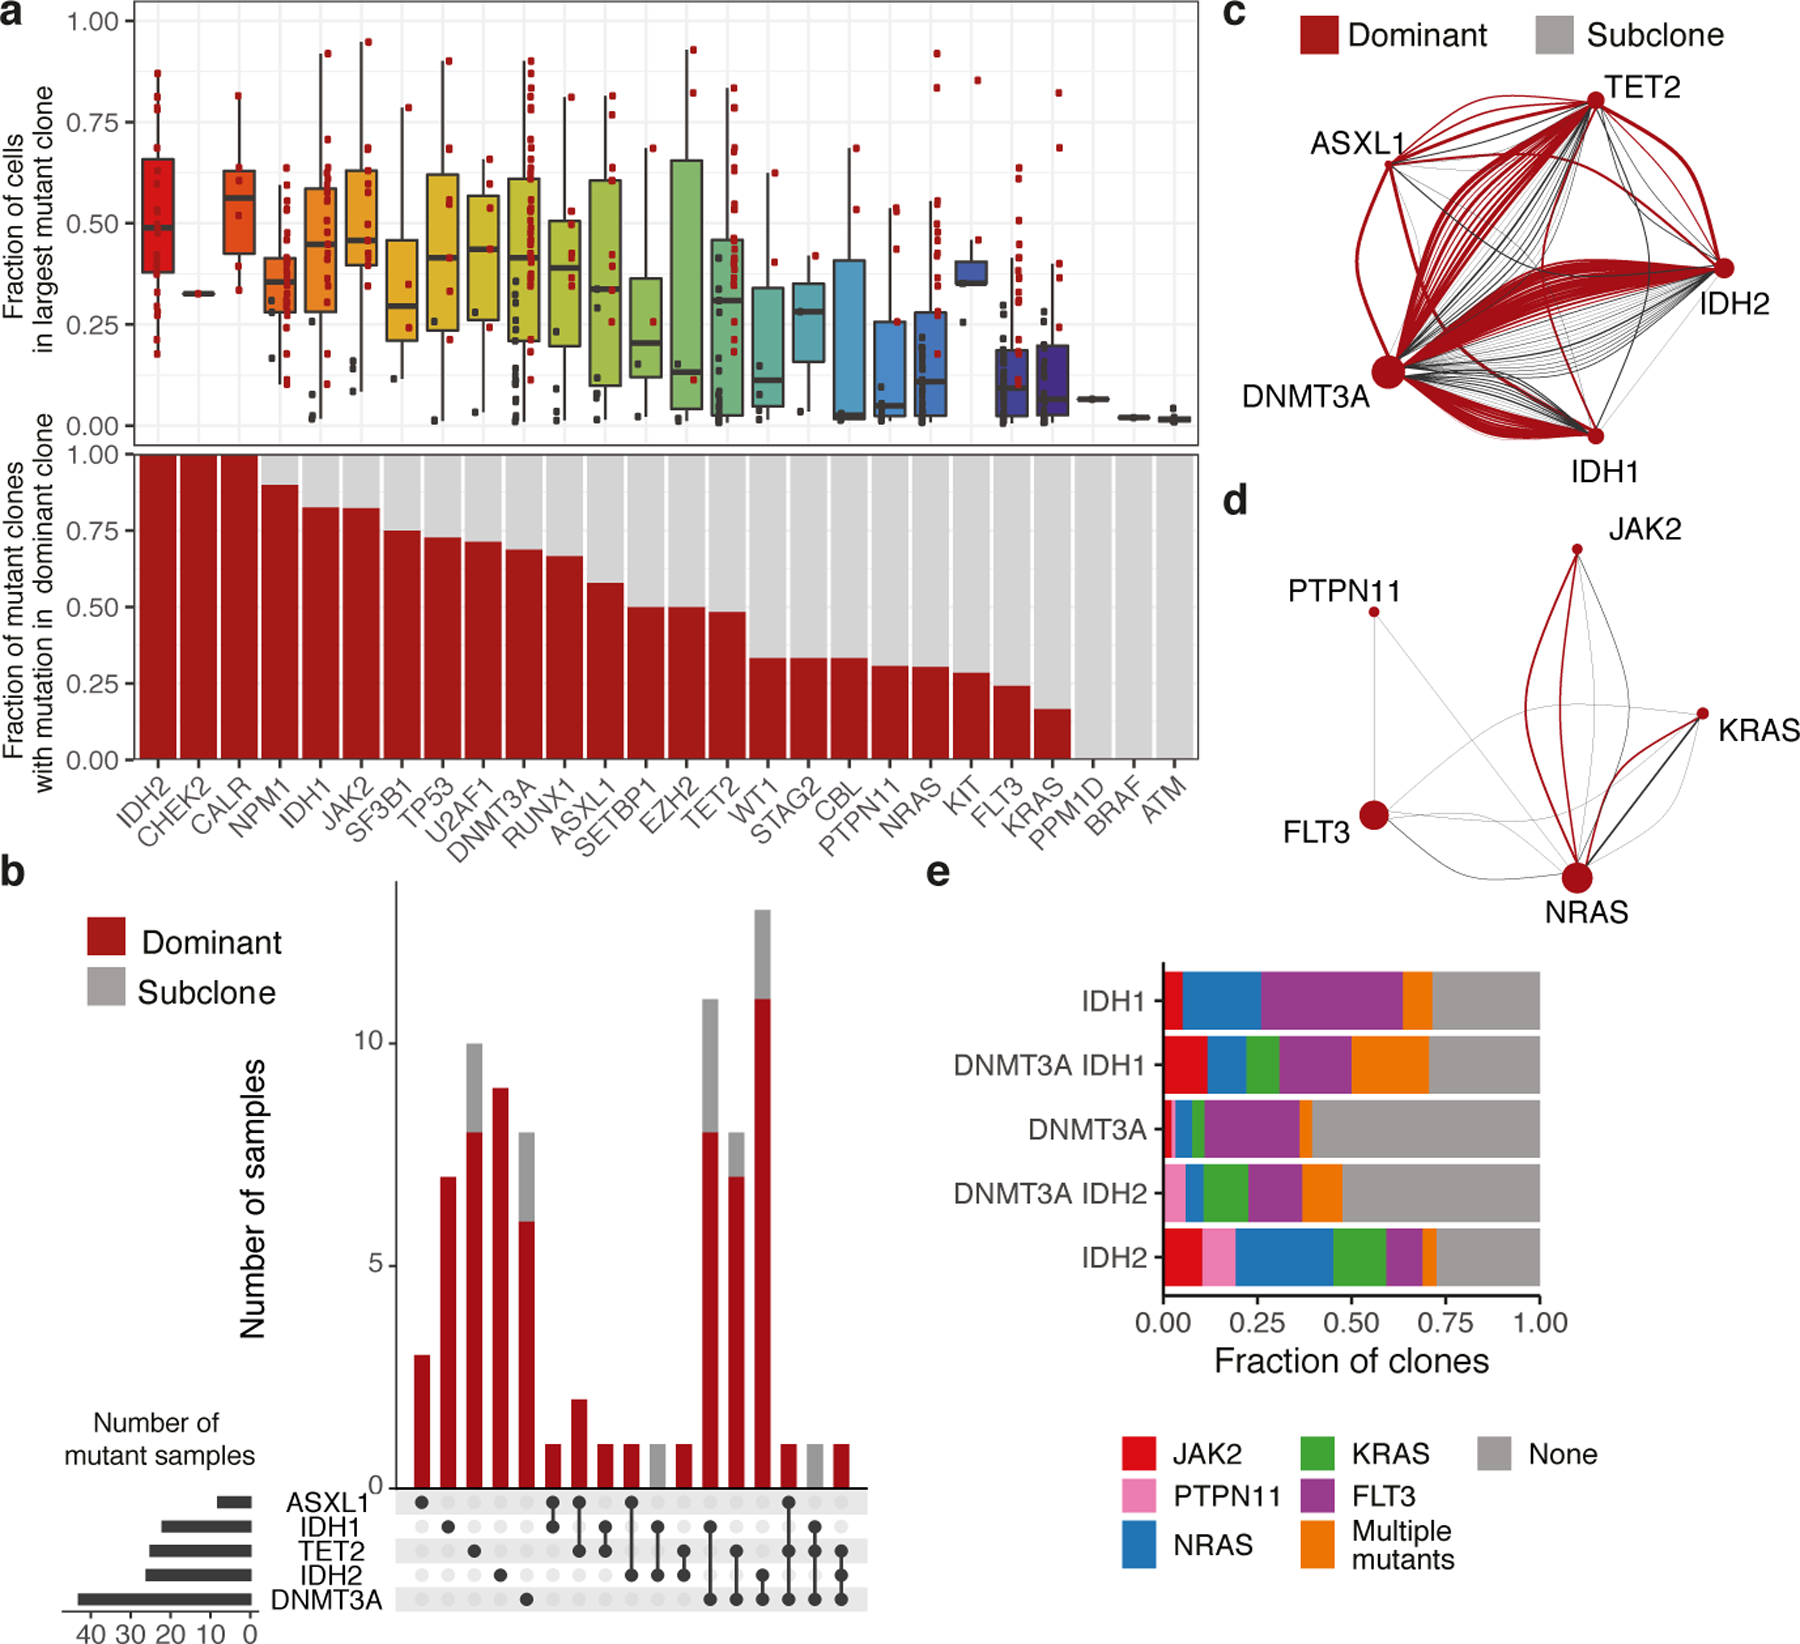
A) Boxplot (center line, median; box, IQR; whiskers, 1.5xIQR) indicating the fraction of cells for a sample in the largest mutant clone (top panel). Dominant clones indicated in red dots and subclones in black dots. Barplot indicating the proportion of mutant clones where the indicated gene is mutated in the most dominant identified clone (red bar; bottom panel) (n=485 clones, n=111 samples). B) Upset plot of co-occurring mutations for AML samples with mutations in DTAI genes. Bar graph depicts number of samples with each mutant gene(s). Presence in dominant clone (red) or subclones (grey) is indicated. Grid (bottom panel) indicates combination of mutations in each corresponding barplot. C-D) Co-occurrence spectrum of DTAI mutations (C) or signaling mutations (D). Size of vertex represents number of samples mutated for given gene. Edge color denotes dominant clones (red) and subclone (grey), with edge width representative of clone size. E) Within AML patients, barplot indicates fraction of clones with co-occurring signaling mutations in DNMT3A, IDH1, and IDH2 mutant clones. Different signaling mutations are colored as indicated.
We further identified distinct mutational cooperativity patterns in AML samples with DNMT3A and/or IDH1/2 mutations (Figure 2E). Similar patterns of co-occurring signaling effector mutations were observed in IDH1 mutant clones and in DNMT3A/IDH1 co-mutant clones, with fewer signaling mutations in single mutant DNMT3A clones. DNMT3A/IDH2 co-mutant clones showed similar signaling co-mutation burdens and patterns as single mutant DNMT3A clones, distinct from IDH2- single mutant clones. IDH2 mutant clones had an increased frequency of JAK2 and NRAS co-mutations and fewer FLT3 co-mutations. We focused on 6 patients that harbored both DNMT3A and IDH1/2 mutations and concurrent signaling effector mutations (Extended Figure 3B). In these cases, a high fraction of cells had concurrent DNMT3A and IDH mutations, whereas few clones possessed >1 mutation in a signaling effector (p ≤ 0.00326). These trends suggest that the presence of additional mutations with epigenetic modifiers may influence subsequent mutational trajectories.
Initiating mutations and clonal dominance
These data provided an opportunity to delineate the sequence of somatic genetic events during myeloid transformation, and to map these events on clonal expansion. We adapted a zygosity sensitive (Extended Figure 3C) Markov decision process with reinforcement learning to generate evolutionary trajectories. We identified optimal trajectories starting with non-mutant wildtype (WT) cells that progressed through observed and unobserved states maximizing the fraction of cells represented in each trajectory (Figure 3A–B). CH samples displayed oligoclonality and clonal outgrowth of distinct clones with 1–2 mutations (Figure 3A). In AML we observed complex evolutionary trajectories, with progressive clonal dominance and subsequent subclonal propagation (Figure 3B).
Figure 3. Identification of initiating mutations and clonal expansion through assessing optimal genetic trajectories.
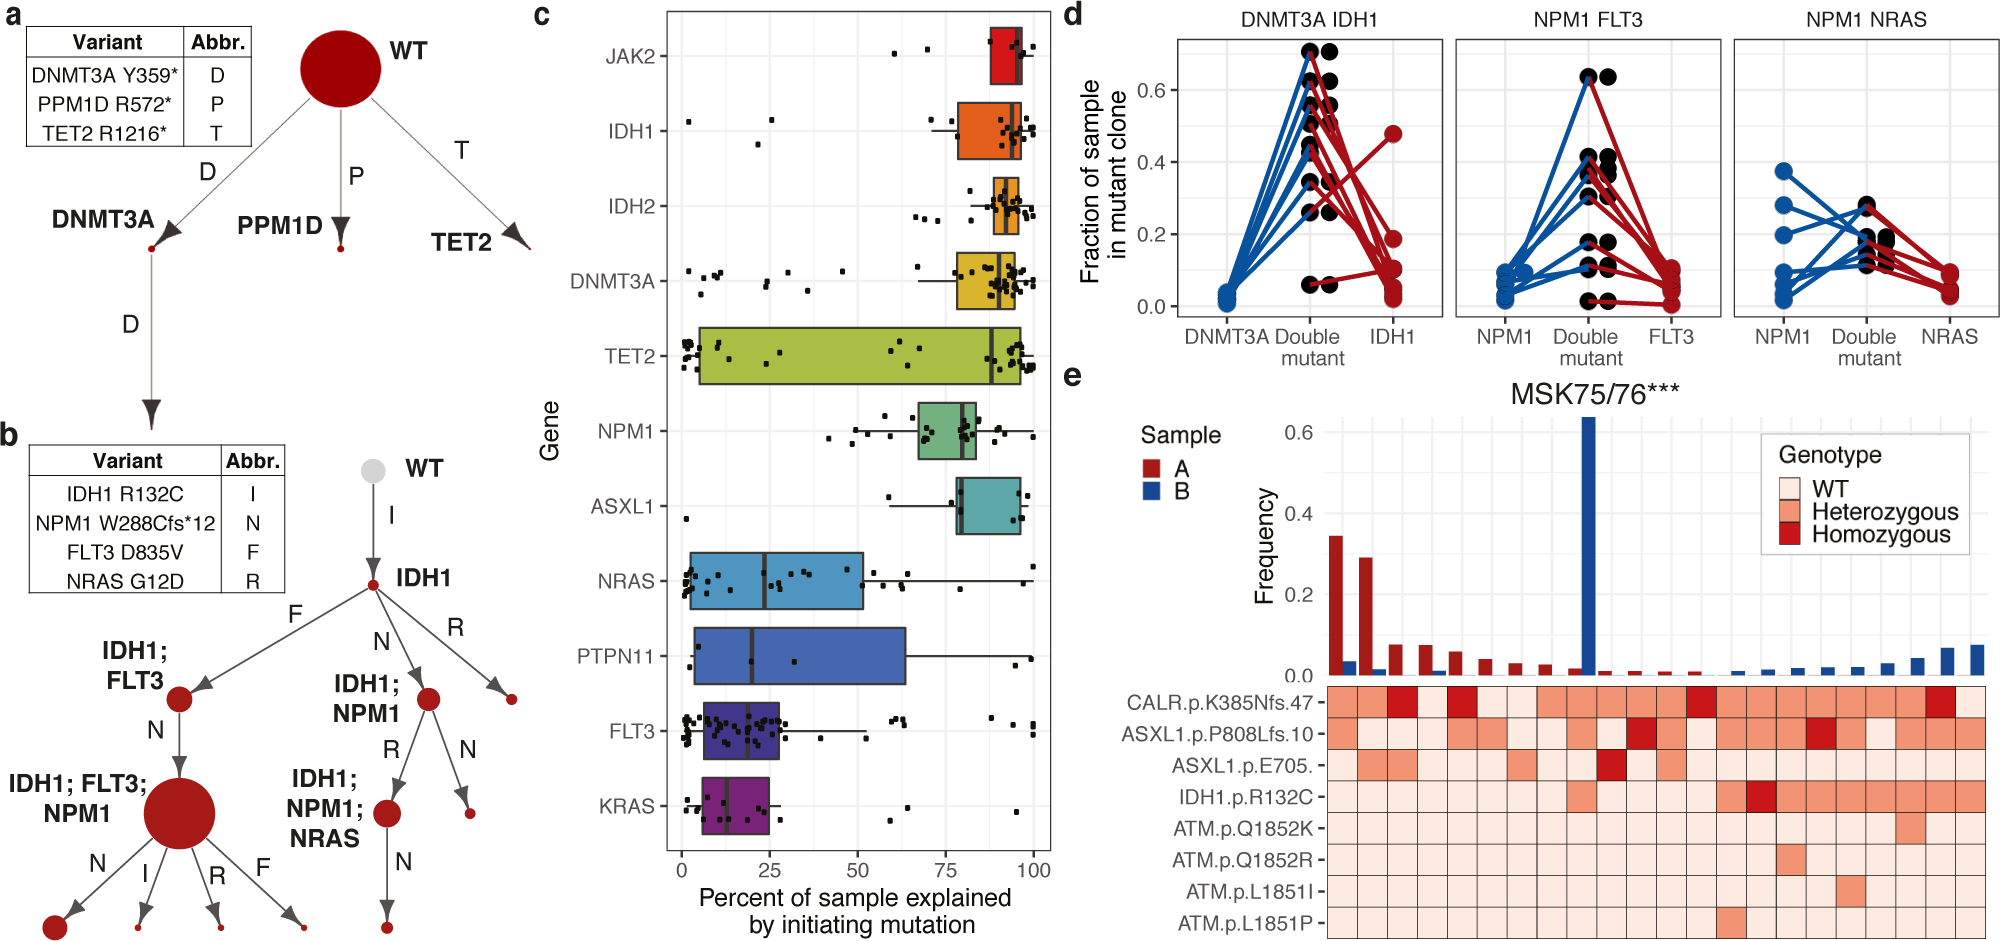
A-B) Representative genetic trajectories from CH (A, MSK68) and DTAI samples. (B, MSK129). Size of circle denotes relative clone size with observed clones in red and unobserved clones in grey (with fixed size). C) Fraction of each sample explained by indicated putative initiating mutation (center line, median; box, IQR; whiskers, 1.5xIQR; n =80 biologically independent samples, n=383 clones) D) Fraction of sample in single and double mutant clones in DNMT3A/IDH1 (n=9), FLT3/NPM1c (n=9) and RAS/NPM1c (n=7) mutant samples. Each sample indicated by connecting line, absence of a line for single mutants indicates absence of clone. E) Clonotype plot of paired sample from a patient that underwent leukemic transformation (MSK75/76; n=1/timepoint): sample A (red, MPN) and sample B (blue, AML). Height of bar depicts frequency of a clone in each sample. Heatmap indicates mutation zygosity for each clone (wildtype = light pink, heterozygous = orange, homozygous = red).
We next assessed the fraction of the clonal architecture explained by a particular genetic trajectory to predict disease-initiating mutation in DTAI samples (Figure 3C). The majority of states were reconstructed when epigenetic modifers such as DNMT3A and/or IDH1/2 were the initiating mutation(s). Conversely, very little of the clonal trajectory could be formed if the first mutation occurred in signaling genes such as NRAS or FLT3. This observation was highly correlated to the computed VAF from scDNA sequencing (Spearman’s ρ=0.93; p ≤ 2.2 × 10⁻¹⁶; Extended Figure 3D). The notable exception was TET2, which could serve as the disease initiating mutation or as an acquired mutation during clonal progression, consistent with studies in MPN/post-MPN AML suggesting a context-specific effect of TET2 loss-of-function during myeloid transformation and clonal evolution12,13. We next examined which gene mutations were observed as initiating, single-mutant clones and found that single-mutant clones with a DTAI mutation were commonly identified, confirming these as likely clone-initiating mutations (Extended Figure 3E). However, DNMT3AR882 missense mutant-only clones (15.79%; 3/19 mutant samples) were less frequently detected (p < 0.04) than non-R882 DNMT3A missense mutant initating clones (50.0%; 10/20 mutant samples; Extended Figure 3F). This suggests DNMT3AR882 mutations are either less commonly observed as disease initiating mutations and/or more likely acquire additional mutations and undergo rapid clonal evolution. These data are consonant with the relative paucity of DNMT3AR882 mutations in CH relative to overt AML14,15. In contrast, we did observe increased subclone size for clones with DNMT3A-missense mutations compared to DNMT3A-nonsense mutations further suggesting distinct consequences and fates for cells harboring different DNMT3A alleles (Extended Figure 3G).
We next focused on discerning the order of subsequent mutations during clonal evolution and their contribution to clonal expansion and dominance. For the majority of samples with co-occurring DNMT3A/IDH1 and DNMT3A/IDH2 mutations (n=19/23), we observed a significant increase in relative clone size compared to either single mutant DNMT3A clones (IDH1 p ≤ 0.00023; IDH2 p ≤ 2.16 × 10⁻⁶; Figure 3D; Extended Figure 3H) or IDH1/IDH2 clones (p ≤ 0.0016; p ≤ 1.37 × 10⁻⁵ respectively). In NPM1c mutant samples with co-occurring FLT3 mutations, the clone size of FLT3/NPM1c double-mutant clones was significantly greater than FLT3 (p ≤ 0.0097) or NPM1c (p ≤ 0.0089) single-mutant clones (Figure 3D). By contrast, for RAS/NPM1c co-mutant clones we observed significant variability in clone size and less evidence of cooperativity compared to single mutant NPM1c (p ≤ 0.462), whereas the double mutant clone was significantly larger than RAS mutant-only clones (p ≤ 0.0009). This finding suggests differential capacity for mutation co-occurrences to promote clonal dominance in AML, even for commonly observed genotypes seen in bulk sequencing.
Clonal evolution in MM
We next sought to determine if clonal architecture is altered in disease transformation and response to therapy. In 4/6 patients that transformed from MPN to AML, we observed a significant alteration in clonal architecture, or a “clonal sweep” with emergence of new dominant clone(s) (Extended Figure 4A). In MSK75/76 the dominant CALR/ASXL1 clone in the MPN (Sample A) was replaced by a CALR/ASXL1/IDH1 dominant clone at transformation (Sample B), which was a minor clone in the MPN phase (Figure 3E). We next queried pre/post therapy samples from FLT3-mutant patients (n=3) who were treated with the FLT3 inhibitor, gilteritinib. All patients (3/3) showed a decrease in FLT3-mutant clones in response to gilteritinib with significant “clonal sweeps” (Extended Figure 4B–C). In 2/3 patients, we observed outgrowth of RAS-mutant clones, previously observed as a potential resistance mechanism to FLT3 inhibitor therapy often with RAS mutations acquired in the FLT3-mutant clone16. In MSK82/83, we observed diminution of FLT3-ITD mutant clones with expansion of FLT3-wildtype RAS mutant clones (Extended 4B). In a second patient (MSK95/96), two FLT3-wildtype U2AF1/RAS mutant clones (KRASG13D and NRASG12D) achieved clonal dominance during FLT3 inhibitor therapy (Extended Figure 4C). Meanwhile, a FLT3/KRAS mutant clone was suppressed following therapy. These results indicate that transformation and therapeutic perturbations can alter clonal architecture in both a linear and branched manner.
Simultaneous scDNA-seq/immunophenotyping
We next investigated if specific mutations or combinations influenced immunophenotypes. We performed simultaneous scDNA-seq and cell surface protein expression analysis17 on CH patients with ≥1 mutation(s) to investigate the contribution of CH mutations to mature hematopoietic lineages. We observed differential B- and T-cell lineage contribution depending on the mutated CH allele. DNMT3AR882 mutations (4/4) showed minimal contribution to the B- (CD19 high) and T-cell (CD3 high) lineages, consistent with restricted myeloid (CD11b high) bias (Figure 4A; Extended Figure 5). Conversely, non-R882 DNMT3A mutations (e.g. DNMT3AR635Q) had greater representation in T-cell lineage with lesser contributions to the myeloid and B-cell lineages. Allele-specific lineage skew was even observed in patients harboring >1 CH clone, such that we observed differential lineage contribution of DNMT3A R882 and R635Q within the same patient. By contrast, TET2 mutations offered less consistent results, with some mutants (2/4) showing myeloid lineage bias and others (2/4) showing balanced contribution to all mature lineages (Extended Figure 5).
Figure 4. Simultaneous single cell DNA and cell surface protein expression sequencing.
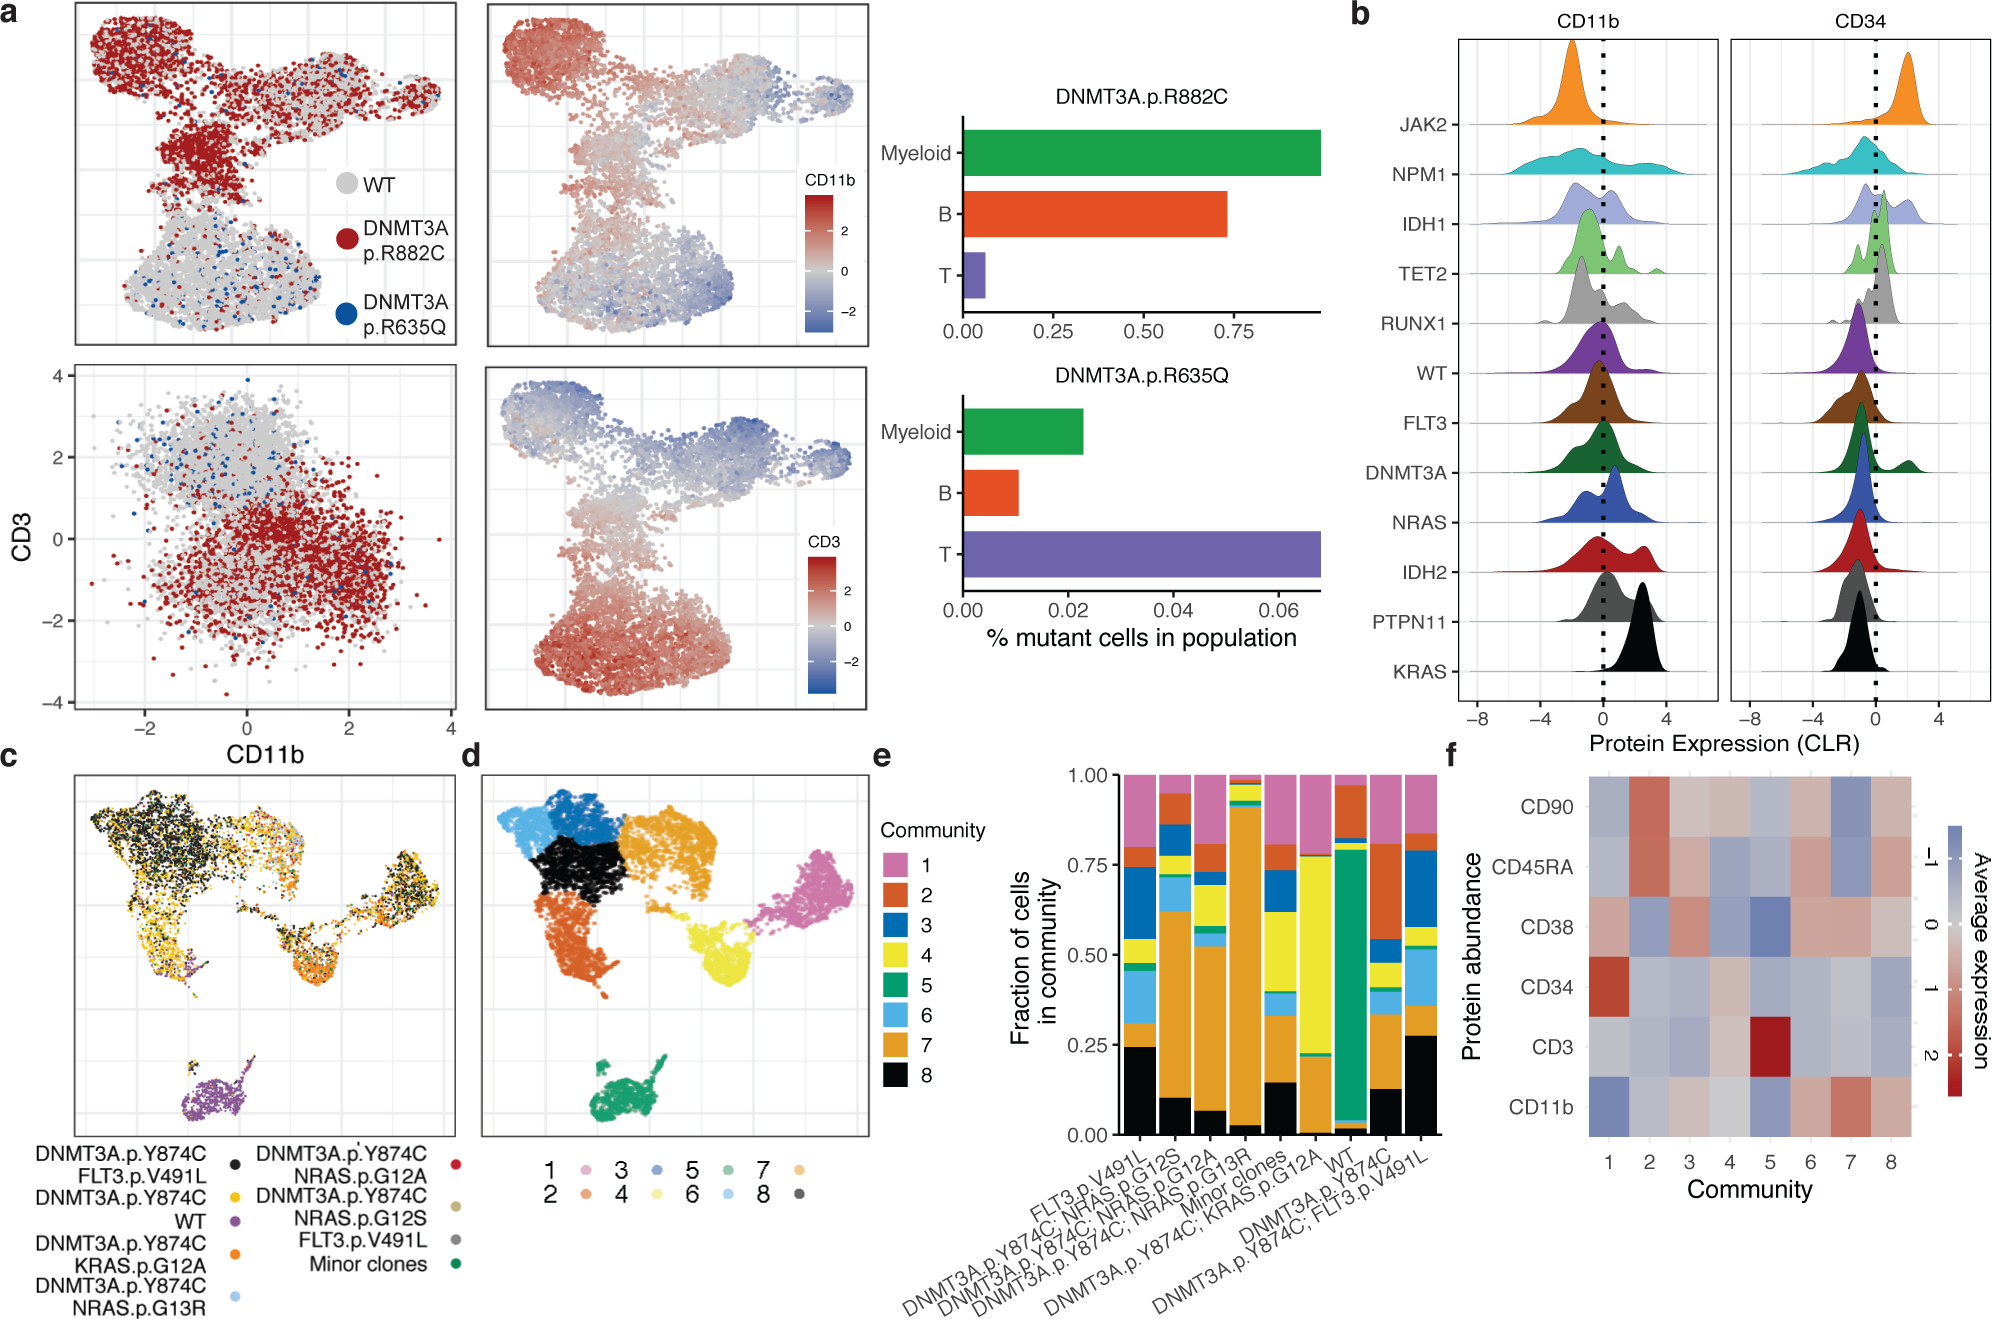
A) UMAP plot of CH sample MSK15 (n=1) with cells clustered by immunophenotype. Genotype overlaid onto each cell (top left panel, WT-grey; DNMT3AR882C-red; DNMT3AR635Q-blue). Relative protein expression for CD11b and CD3 overlaid onto each cell (high = red; low = blue) in UMAP (middle panel). Protein expression of CD3 and CD11b with genotype indicated by color (lower left panel). Bar graph of mutant cell percentage found in Myeloid, B-cell, and T-cell communities (right panel). B) Histogram of CLR normalized protein expression of CD34 and CD11b for cells mutated with select genes. C-D) UMAP for sample MSK71 clustered by immunophenotype with corresponding clones from Extended Figure 7 (denoted with ***) depicted in overlaid colors (C) or communities determined by phonograph (D). E) Fraction of cells in a given clone clustered in 8 communities present in MSK71 depicted by color of corresponding community from (D). F) Heatmap depicts CLR of indicated proteins for each community from (D) (high=red; low=blue).
Recent single cell RNA-sequencing work has highlighted a continuum of differentiation states in AML18,19. To assess clonal architecture and differentiation state, we analyzed simultaneous scDNA-seq and immunophenotype in AML samples (n = 17). We observed significant differences in protein expression between WT and mutant cells, with WT cells expressing high levels of CD3 (p ≤ 2.2 × 10⁻¹⁶) and low levels of CD34 (p ≤ 2.2 × 10⁻¹⁶) compared to mutant cells (Extended Figure 6A–B). With respect to different mutations, TET2 (p ≤ 1.38 × 10⁻⁸), RUNX1 (p ≤ 9.48 × 10 −13), IDH1 (p ≤ 2.2 × 10⁻¹⁶), and JAK2 (p ≤ 2.2 × 10⁻¹⁶) mutant cells were enriched for high CD34 surface expression (Figure 4B), whereas mutations in the MAPK/ERK signaling pathway (NRAS p ≤ 0.04; KRAS p ≤ 2.2 × 10⁻¹⁶ and PTPN11; p ≤ 2.2 × 10⁻¹⁶) had higher expression of CD11b compared to other mutant genes. Moreover, NPM1c mutant cells harbored lower expression of CD34 compared to all other mutant cells (p ≤ 2.2 × 10⁻¹⁶), consistent with previous flow cytometric data20. Given the complex multigenic clonal architecture, we next queried immunophenotypic differences across cells harboring pairwise combinations of mutations in DNMT3A, IDH1, IDH2, FLT3, NRAS and KRAS (Extended Figure 6C). We observed that the high CD34 expression seen in IDH1 mutant cells decreased in cells with co-mutations in signaling effectors (p ≤ 2.2 × 10⁻¹⁶) and CD11b expression was increased in IDH1/RAS co-mutant subclones (p ≤ 2.2 × 10⁻¹⁶).
We expanded this analysis to assess how immunophenotype differed across distinct genetic clones. We observed co-occurring mutation-specific expression changes, including increased CD11b expression in RAS mutant subclones compared to RAS wildtype subclones (Figure 4C; Extended Figure 7; MSK71). We also observed reduced CD34 expression of DNMT3A/FLT3 co-mutant clones compared to DNMT3A single-mutant clones with a concomitant increase in CD38 and CD45RA expression, consistent with a myeloid progenitor phenotype21,22 (Extended Figure 7; MSK71). To summarize combinatorial differences in immunophenotype, we clustered cells into communities and queried their change in representation on a clonal level23 (Figure 4D–F). Significant differences in subclone-specific community representation were observed in MSK71, which harbored an initiating DNMT3A mutation with NRAS, KRAS, and FLT3-mutant subclones (Figure 4D–E). Specifically, Community 8 was expanded while Community 2 was reduced concurrent with acquisition of a FLT3 mutation in the DNMT3A mutant clone. This was associated with an increased CD11b expression and decreased CD45RA and CD90 surface expression in FLT3 mutant cells (Figure 4E–F; Extended Figure 8A). We also observed different community enrichment patterns in RAS-mutant clones, with differences between NRAS vs. KRAS mutant cells. An NRAS mutant clone showed a specific increase in Community 7, which was marked by the highest level of CD11b expression. Meanwhile a KRAS mutant clone showed increased representation in Community 4, associated with high CD19 expression (Extended Figure 8A).
To determine if patterns of immunophenotype changes existed across multiple samples, we merged all samples, clustered cells based on cell surface protein expression, then identified communities of cells (Extended Figure 8B–C). We found that multiple overlapping immunophenotypic states occur across samples with divergent genotypes; no community was exclusive to an individual sample and 6 communities were observed in every sample (Community 7, 8, 9, 18, 32, and 42) which were intercorrelated with high expression of either CD90 or CD38 (Extended Figure 9A). We observed significant shifts in community representation between the dominant clone and subclones in 8/14 samples with more than one leukemic clone, (Extended Figure 9B). In contrast to NRAS-mutant clone specific increases in CD11b expression, we observed in MSK130 that a FLT3 mutant dominant clone had expansion of a community with high CD34 (p ≤ 2.2 × 10⁻¹⁶) and low CD11b expression (p ≤ 2.2 × 10⁻¹⁶) (Extended Figure 9C). Furthermore, a JAK2 mutant sample (MSK94) had expanded communities with high CD38 and low CD11b expression in the dominant clone compared to subclones (CD38; p ≤ 2.2 × 10⁻¹⁶; CD11b; p ≤ 2.2 × 10⁻¹⁶). These findings suggest divergent clone-specific changes in immunophenotype upon the acquisition of signaling effector mutations.
Discussion
The identification of frequent, recurrent mutations in epigenetic regulators in CH, and the lower incidence of overt MM relative to CH suggests that the rate-limiting step in myeloid transformation is clonal evolution from disease-initiating clones to leukemic clones. Previous studies have used bulk sequencing analyses to predict important features of clonal evolution3,24–26; however, the molecular sequence of events which drive myeloid transformation have not been dissected at a single cell, clonal level. Here we use scDNA-seq to map clonal evolution in MM, and to make important insights into the pathogenesis of myeloid transformation previously not discernible by bulk sequencing.
First, we found that the clonal complexity increases from CH or MPN to AML and continues to evolve as AML clones acquire mutations in signaling effectors. By contrast, signaling effector mutations were often subclonal, and very rarely co-occurring in the same clone. Second, we observed significant differences in how mutational combinations contributed to clonal dominance such that specific co-occurring disease alleles (e.g. NPM1c + FLT3-ITD or DNMT3A + IDH2) were associated with clonal dominance and other mutational combinations (NPM1c + RAS) did not promote clonal expansion. Analysis of paired samples in the context of disease evolution from MPN to AML and in the setting of therapeutic perturbation show that MM are characterized by “clonal sweeps” in the setting of specific stressors, and that the changes in clonal architecture largely occur due to expansion of pre-existing minor clones. These data have biologic and therapeutic insight, as the clones which emerge with transformation (e.g. expanding IDH2-mutant clones) or with therapeutic selection (FLT3-wildtype, RAS mutant) can be detected with scDNA-seq and may inform the use of therapies which target these clones before they achieve clonal dominance. Lastly, we identified significant changes in cell surface protein expression driven by genotypes using simultaneous single cell mutational profiling and immunophenotyping. Signaling effector mutations were particularly notable for altering cell surface protein expression, with MAPK/ERK pathway mutations leading to increased CD11b expression.
Taken together, these data suggest that patients with myeloid malignancies manifest as a complex ecosystem of clones which evolves over time, and that scDNA-seq gives a glimpse into this milieu not seen with conventional bulk sequencing. Our studies of clonal architecture at a single cell level give us new insights into how clonal complexity contributes to the pathogenesis of myeloid transformation (see Supplementary Discussion). Similar studies across different pre-malignant and malignant contexts will give new information into how malignancies initiate and progress and will lead to new therapeutic strategies aimed at intercepting clonal evolution and/or targeting cancer as a multi-clonal disease.
Online Methods
Reagents –
All antibodies for flow cytometry were purchased from Biolegend. These studies used the following antibodies: FITC-CD3 (clone UCHT1) FITC-CD19 (clone HIB19) and FITC-CD56 (clone HCD56). Human TruStain FcX was also purchased from Biolegend. The DNA+Protein oligo-conjugated antibodies were produced and provided by Biolegend as part of a collaboration with Mission Bio, Inc. The antibodies in the conjugate pool were the following: CD3 (clone SK7), CD11b (clone RCRF44), CD19 (clone HIB19), CD34 (clone 581), CD38 (clone HIT2), CD45RA (clone HI100), and CD90 (clone 5E10). Antibody conjugates were pooled in equimolar ratios. All Tapestri related reagents were included as part of a Custom Single Cell DNA sequencing kit purchased from Mission Bio, Inc. The Custom amplicon panel used in these studies covers 109 amplicons over 31 genes previously found to be frequently mutated in human myelodysplastic syndromes (MDS), myeloproliferative neoplasms (MPN), and acute myeloid leukemia (AML) (Supplementary Table 1)27–29.
Patient Samples –
Patients with myeloid neoplasms or acute myeloid leukemia between 2014 and 2019 were studied. Informed consent was obtained from patients according to protocols approved by the institutional IRBs and in accordance with the Declaration of Helsinki. This study was approved by MSKCC Institutional Review Board (protocol #15–017) and Thomas Jefferson University (TJU) Institutional Review Board (protocol# 17D.083). Diagnosis and disease status was confirmed and assigned according to World Health Organization (WHO) classification criteria30. Patient characteristics are summarized in Supplementary Table 2 and Extended Figure 1A–B. With the exception of four complex karyotype/TP53 mutant samples (denoted with *), all samples were confirmed normal karyotype. Bone marrow from healthy individuals was obtained with informed consent according to procedures approved by the institutional review boards Memorial Sloan Kettering Cancer Center and Hospital for Special Surgery. Patient samples were collected and processed by the MSKCC Human Oncology Tissue Bank (HOTB) or TJU Heme Malignancy Repository. Mononuclear cells were obtained by centrifugation on Ficoll from peripheral blood or bone marrow and viably frozen. Patient samples from MSKCC underwent high-throughput genetic sequencing with a targeted deep sequencing assay of 685 genes (HemePACT) or by an NGS platform panel composed of 49 genes recurrently mutated in myeloid disorders (RainDance Technologies ThunderBolts Myeloid Panel). Single point variants were called using Mutect and short insertions and deletions using Pindel as described previously, comparing samples to a sample representing a pool of normal samples31. Mutations were excluded if found to be present in at least one database of known non-somatic variants (dbSNP and 1000 genomes) and absent from COSMIC. Samples with non-excluded mutations with variant allele frequency >2% were classified as clonal hematopoiesis. Samples were selected based on mutation coverage by the Mission Bio Custom amplicon panel, variant allele frequencies of all covered mutations (>5% VAF for each gene covered on panel), and number of cells collected (>5 × 10⁶ cells) per frozen aliquot. Specifically, samples were prioritized if they harbored 1) more than one mutation in epigenetic modifier genes DNMT3A, TET2, ASXL1, or IDH1/2, 2) a NPM1 mutation, 3) mutations in NRAS, KRAS, and/or 4) mutations in FLT3 (either internal tandem duplication (ITD) or tyrosine kinase domain (TKD) mutations).
Single cell DNA sequencing library preparation and sequencing –
Patient samples were thawed and washed with PBS supplemented with 1% BSA (FACS buffer). Cells were incubated with TruStain FcX (Biolegend) for 15 min at 4°C then stained with FITC-conjugated antibodies against human CD3, CD19, and CD56 (NCAM) for 15 min at 4°C. Cells were then washed and resuspended in FACS buffer with DAPI and sorted to isolate viable (DAPI−) CD3−/CD19−/CD56− (FITC−) cells using a Sony SH800 Cell Sorter. Cells were resuspended in Tapestri cell buffer and quantified using a Countess cell counter (Invitrogen). Single cells (3–4,000 cells/μL) were encapsulated using a Tapestri microfluidics cartridge, lysed, and barcoded32. Barcoded samples were then subjected to targeted PCR amplification of a custom 109 amplicons covering 31 genes known to be involved in hematologic malignancies (AML/MPN/MDS; Supplementary Table 1). PCR products were removed from individual droplets, purified with Ampure XP beads (Beckman Coulter), and used as a template for PCR to incorporate Illumina i5/i7 indices. PCR products were purified a second time, quantified via an Agilent Bioanalyzer and pooled to be sequenced. Library pools were sequenced on an Illumina NovaSeq by the MSKCC Integrated Genomics Core.
Single cell DNA & Protein sequencing library preparation and sequencing –
Patient samples were thawed, washed with FACS buffer, and quantified using a Countess cell counter. Cells (1.0–4.0 × 10⁶ viable cells) were then resuspended in DPBS (Gibco) and incubated with TruStain FcX, Dextran Sulfate (100 μg/mL; Research Products International), and 1X Tapestri staining buffer for 3 minutes at room temperature. The pool of 7 oligo-conjugated antibodies (CD3, CD11b, CD19, CD34, CD38, CD45RA, CD90) was then added and incubated for 30 minutes at room temperature. Cells were then washed multiple times with DPBS supplemented with 5% fetal bovine serum (FBS; Gibco) followed by resuspension of the cells in Tapestri cell buffer, requantification, and loading of the cells into a Tapestri microfluidics cartridge. Single cells were encapsulated, lysed, barcoded as above with the exception of adding an additional forward primer mix (30 μM each) for the antibody tags prior to barcoding. DNA PCR products were then isolated from individual droplets and purified with Ampure XP beads. The DNA PCR products were then used as a PCR template for library generation as above and repurified using Ampure XP beads. Protein PCR products (supernatant from Ampure XP bead incubation) were incubated with Tapestri pullout oligo (5 μM) at 96°C for 5 minutes followed by incubation on ice for 5 minutes. Protein PCR products were then purified using Steptavidin C1 beads (Invitrogen) and beads were used as a PCR template for the incorporation of i5/i7 Illumina indices followed by purification using Ampure XP beads. All libraries, both DNA and Protein, were quantified using an Agilent Bioanalyzer and pooled for sequencing on an Illumina NovaSeq by the MSKCC Integrated Genomics Core.
Data Analysis
Data processing:
FASTQ files for single cell DNA libraries were analyzed through the Tapestri Pipeline using Bluebee’s high performance genomics platform. Briefly, this pipeline trims adaptor sequences, aligns reads to the human genome (hg19), assigns sequence reads to cell barcodes, and performs genotype calling with GATKv3.7. Data is then consolidated into a multiple sample VCF file and output as a loom file for subsequent processing. Initial steps for filtering low quality genotypes or cells were performed in Tapestri Insights and R, where the minimum variant quality score was set to 30 with a minimum of 10 reads per variant per cell. We further removed variants present in <50% of cells and removed cells in which <50% of potential variants reported informative genotypes. Data was exported from Tapestri Insights and subsequent filtering was performed in R. For DNA analysis on the DNA+Protein platform, we used the Tapestri Pipeline on Bluebee as described above. For the protein analysis, custom scripts in R were used by Mission Bio to enumerate the number of reads per antibody per cell. Subsequent normalization was performed using the tapestri package in R. Variants were filtered through an empirically curated banned-list of panel-specific mutations that were not identified in bulk sequencing nor present in COSMIC. We further removed variants constrained to one problematic hyper mutated amplicon (chr20;31,022,898–31,023,107) and focused all subsequent on protein encoding mutations, non-splicing mutations. Variants were included if there were at least 2 cells which were heterozygous or homozygous. Samples were included if they harbored 1 or more protein encoding, non-synonymous/insertion/deletion variants and more than 100 cells with definitive genotype for all protein coding variants within the sample. We next sought to define genetic clones, which we identified as cells that possessed identical genotype calls for the protein encoding variants of interest. In order to focus our analyses on reproducible clones, we performed a bootstrapping analysis over 10,000 samplings to calculate 95% confidence intervals for the presence of each clone. Clonal analyses in Figure 1B and onward focus on clones where the lower 95% confidence interval > 10 cells. We further excluded rare variants which were only identified in clones that did not pass this threshold. Samples were included in clonal analyses if they encoded >2 protein encoding variants and >2 clones. Flowchart of sample inclusion can be found in Extended Figure 2A, and patient characteristics can be found in Supplementary Table 2. Dominant clones as referred to in the text were defined as the largest mutant clone in the sample, excluding cells which were wild type for all variants of interest.
Genetic trajectory analysis:
For the genetic trajectory analysis constructed in Figure 3, we implemented a markov decision process with reinforcement learning. Generally, this allowed us to model the optimal track of mutation acquisition if a cell were to acquire one mutation at a time and not revert that mutation to a wild type state. Technically, for a given sample, we first constructed a reward matrix by enumerating all possible clones given the number of mutations present in a sample, and the maximum zygosity for a given mutant (i.e., if we did not observe a homozygous state for a mutant, it was not considered in the reward matrix). After construction of the reward matrix, we set permissible decision processes with a value of 0, and impermissible decision processes with a value of −1 (i.e. decisions where a mutant was reverted to wildtype or required more than one genetic alteration were penalized). Decisions were considered permissible if a clone was separated by a single genetic event, either a variant changing from wildtype to heterozygous or heterozygous to homozygous. For observed clones, the frequency of the clone (ranging from 0–100% of cells) was used as the value in the reward matrix, while unobserved clones retained a value of 0. The matrix was then converted to long form and state transitions between clones were associated with the action/mutation causative to that state change. This was then used as input to the ReinforcmentLearning package in R to generate a Q matrix through the experience replay algorithm33. Custom scripts in R were used to navigate this Q matrix to determine optimal trajectory from the wildtype clone.
Statistical analysis:
Statistical significance was evaluated using a two-sided Student’s T-test and two-sided Fisher’s exact test where indicated. Multiple test correction was implemented using the Benjamini-Hochberg/FDR approach as indicated. Shannon diversity index was assessed using the diversity function in the vegan package in R34. Genetic co-occurrence analysis was performed using the cooccur package in R. UMAP clustering was performed using the R package umap, with default paramaters35,36. Subsequent community analysis was performed using phenograph implemented with the Rphenograph package37,38. The perplexity factor K was set to 50. For multiple comparisons, a range of significant p values, or FDR values have been provided for clarity. Complete p values and measures of significance can be found with the publicly available code below.
Plotting and graphical representations:
All barplots, boxplots, heatmaps and scatterplots were produced using the ggplot2 package in R39. Error bars depict standard error of measure. Boxplots are depicted in Tukey’s style with boxes representing the median and quartile range, with whiskers representing +/− 1.5x the IQR. The oncoprint presented in Extended Figure 1A was produced using the ComplexHeatmap package in R40. Upset plots shown in Figure 2B and Extended Figure 3A were produced using the UpsetR package41. Network plots in Figure 2C, D and Figure 3A–B were produced with the igraph package in R42. UMAP data was plotted using the ggplot2 package. Other packages used in data processing include tidyr, dplyr, RColorbrewer, pals, and cowplot.
Rigor and Reproducibility:
Samples inclusion criteria are described in detail above. Briefly: high quality variants were selected with a minimum GATK quality score of 30, and 10 reads supporting each variant. Variants and cells were filtered if incomplete genotype information was present for all variants of interest as described above. Variants on a subset of samples visually inspected on IGV to ensure mutation caller fidelity. If less than 100 informative cells were present in a sample, it was removed from the analysis to filter out low quality. Rigorous evaluation of clonal abundance was estimated with a bootstrapping approach to establish 95% confidence intervals. Clones with a lower confidence interval >10 cells were retained for analysis. Duplicate aliquots from select samples were processed on different days to assess replicability of the tapestri platform. To enable reproducibility and transparency, all code and data are available as described below.
Data Availability:
Raw data is available on dbGAP (accession number phs002049.v1.p1) in form of loom files and FASTQ files for each sample.
Code Availability:
All scripts and processed data files are available at https://github.com/bowmanr/scDNA_myeloid.
Extended Data
Extended Figure 1. ScDNA sequencing patient cohort.
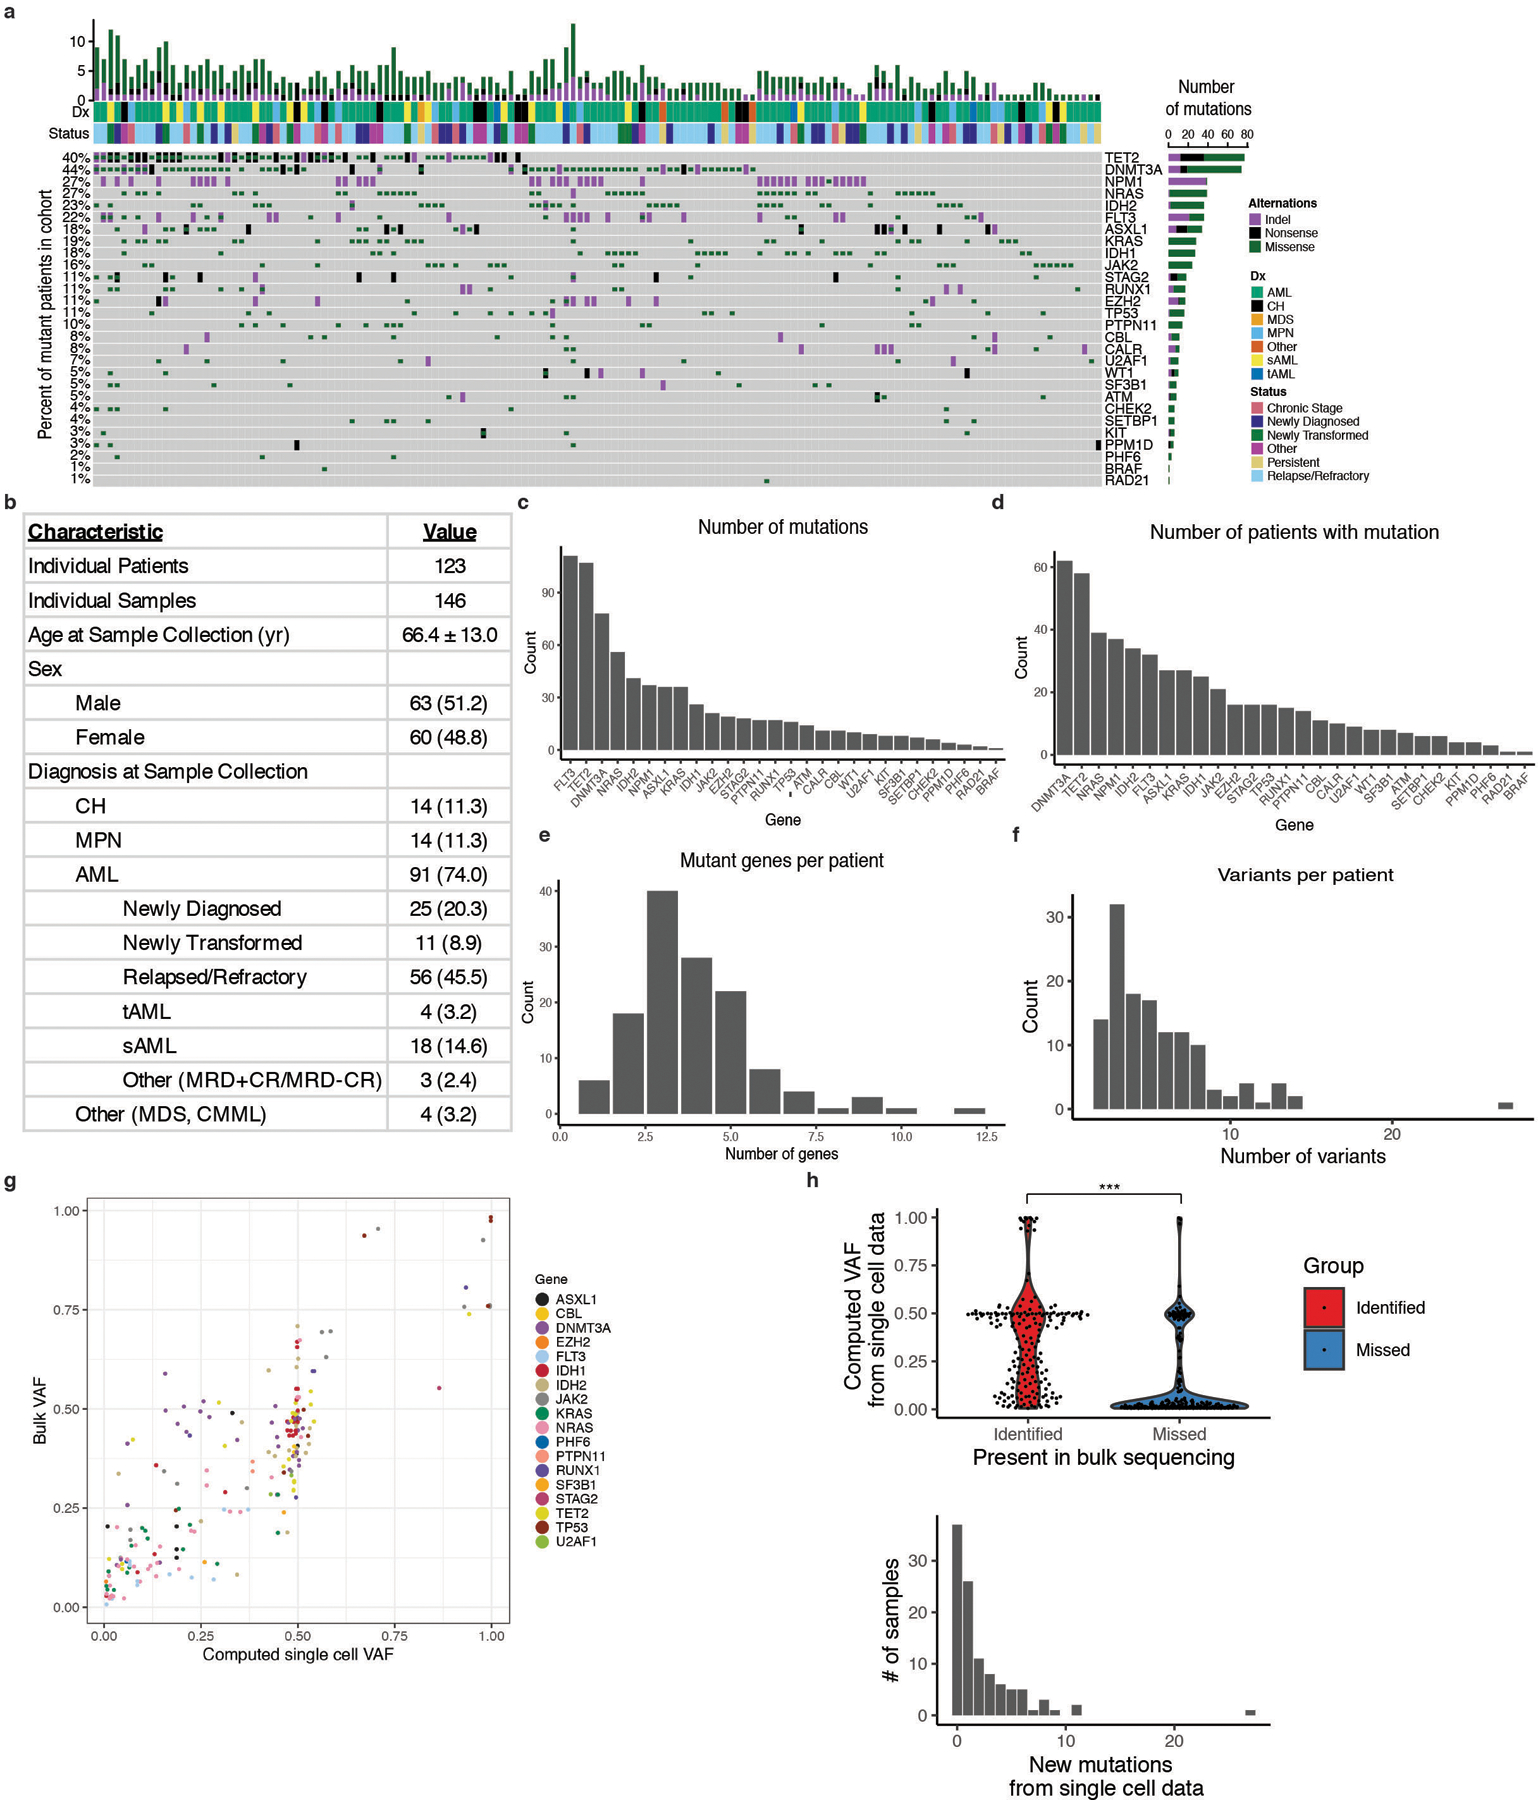
A) Oncoprint of patient samples analyzed by single cell DNA sequencing. B) Table describing patient cohort characteristics. Standard deviation calculated for mean age of patients at sample collection date. Absolute number of samples denoted with percent of total samples in parentheses. C) Number of individual mutations identified for each gene covered on our custom amplicon panel by single cell DNA sequencing (n =146 biologically independent samples for C-F). Genes are ranked by the number of identified protein coding mutations from highest to lowest. Genes with zero identified mutations are not listed. D) Number of patients with protein coding mutations in a given gene. Genes are ranked by decreasing number of patients identified with mutations. E) Number of patients with a given number of identified mutant genes via single cell sequencing. F) Number of patients with a given number of identified protein altering variants via single cell sequencing. G) Correlation of bulk sequencing SNV data VAF versus single cell SNV data VAF from MSKCC samples. Statistical significance was calculated by Pearson correlation coefficient. H) Violin plot of computed VAF from single cell DNA sequencing for mutations found in both scDNA-seq and in bulk sequencing (identified; red), or mutations only identified in scDNA-seq (missed; blue) (top panel). Samples identified by single cell DNA sequencing only were found to be low VAF mutations (p < 2.2×10⁻¹⁶; two-sample Mann-Whitney test). Bar plot of the number of new mutations in each sample identified by single cell DNA sequencing only (bottom panel).
Extended Figure 2. Analysis of clonal architecture by disease type and gene mutation.
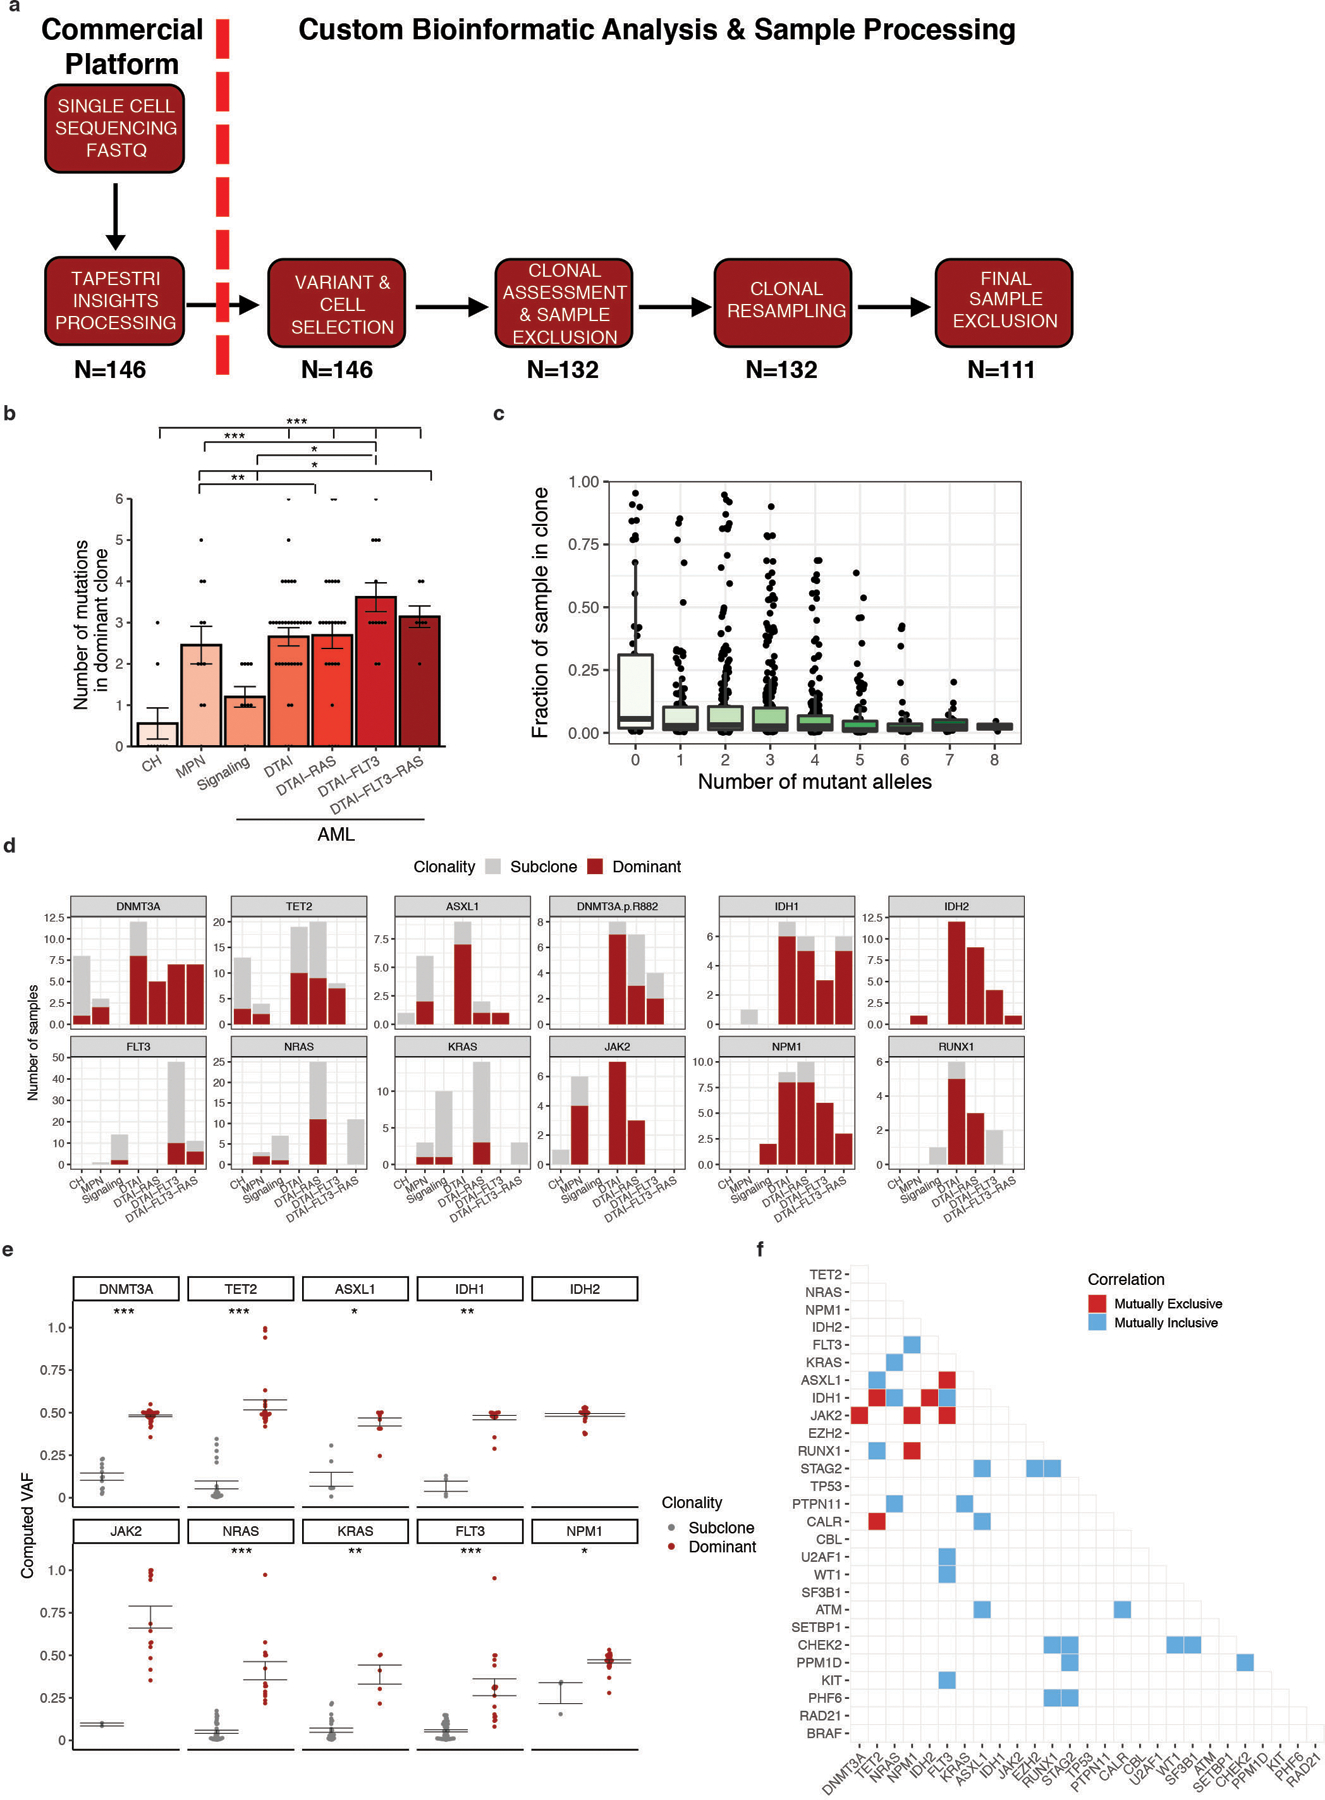
A) scDNA sequencing data processing and analysis workflow. FASTQ sequencing files for each sample were uploaded and processed through Mission Bio Tapestri Insights platform for variant calling and cell finding (Commercial Platform). Included samples for further analysis harbored ≥1 variant which leads to a protein sequence change (non-synonymous/insertion/deletion) and included 50 cells with definitive genotyping for all protein coding variants within the sample (n=146). This data was used for analysis in Figure 1. Clones present in each sample were identified and samples removed if they contained less than 2 clones for clonal analysis studies. Samples were subjected to random resampling of cells using a bootstrapping approach to identify the stability of identified clones (n=132). Following bootstrapping, clones with lower 95% confidence intervals <10 were removed as were variants identified only within those clones. Samples which harbored only 1 variant or presented with <2 clones after bootstrapping analysis were removed (n=111). The number of samples at each step of processing is shown below the different steps of the workflow. B) Number of mutations in the most dominant clone identified in each sample (n =111 biologically independent samples) stratified by cohort. Mean value for each cohort shown by height of bar with standard error of measurement (SEM) depicted with error bars. A two-sided t-test with false discovery rate (FDR) correction was used to determine statistical significance pairwise between all groups. For clarity, only significant p-values referenced in text are shown. * P < 0.1; ** P < 0.01; ***P < 0.001. C) Association between clone size and the number of mutant alleles in the clone. Every clone (n = 111 biologically independent samples) identified in clinical cohort is depicted by black circle. Centerline: median; box: IQR; whiskers 1.5xIQR. D) Barplot depicting the prevalence of dominant clones for each DTAI gene across patient cohorts. Color of bar plot annotates if mutation occurs in the dominant clone (red) or subclone (grey). Absence of bar denotes no clones were identified with the indicated mutation in a given cohort. E) Association of VAF with presence of mutation in either the dominant clone (red) or subclone (grey) for select genes (n = 101 biologically independent samples). Standard error of measurement depicted with error bars. A two-sided t-test with false discovery rate (FDR) correction was used to determine statistical significance pairwise between all groups. * P < 0.1; ** P < 0.01; ***P < 0.001. Absence of p value for IDH2 and JAK2 due to lack of samples with subclonal mutations. F) Pairwise interaction matrix of mutually exclusive (red square) and inclusive (blue square) on a per sample basis. Pairwise interactions with no color did not garner a significant p-value.
Extended Figure 3. Clonal dominance, initiating mutation, and co-mutation patterns in MM patients.
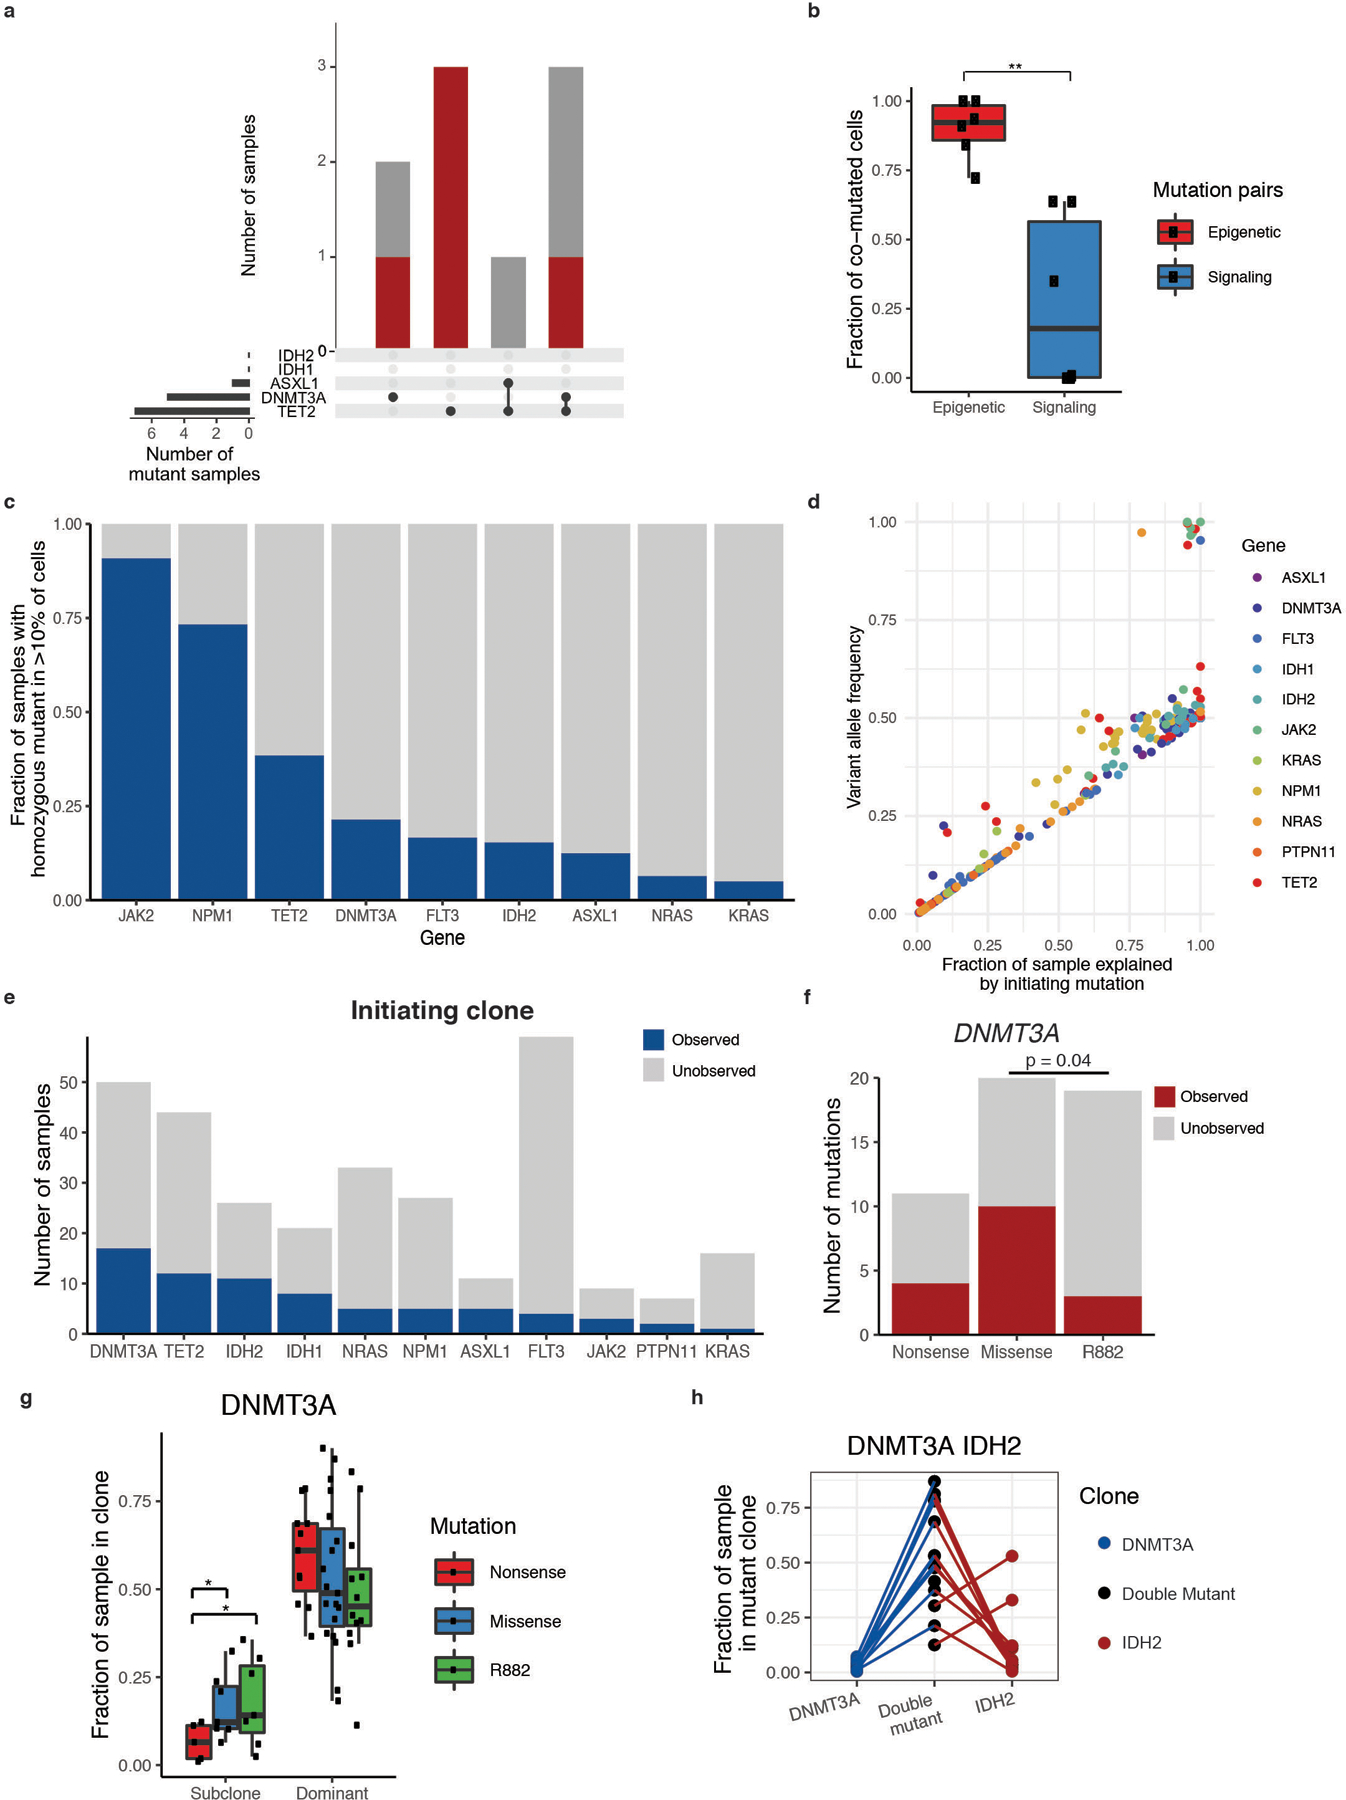
A) Upset plot of co-occurring DTAI mutations in CH samples with more than 1 DTAI variant. Bar graph (top panel) depicts the number of samples with each mutant gene(s) and color of bar annotating whether mutation(s) occur in the dominant clone (red) or subclones (grey). Black circles and connecting line in bottom panel demark the combination of mutations in each corresponding bar plot. B) Divergent frequency of co-mutated cells for epigenetic modifier genes (red) and signaling genes (blue). Individual samples (n=6 samples) shown with black square. Centerline: median; box: IQR; whiskers 1.5xIQR. A two-sided Student’s t-test was used to determine statistical significance * P < 0.1; ** P < 0.01; ***P < 0.001. C) Fraction of mutant samples harboring a homozygous mutation for the indicated given gene (at least >10% of cells). Homozygous sample denoted in blue. D) Correlation of VAF computed by scDNA sequencing to fraction of a mutant sample explained by the genetic trajectory starting with an initiating mutation in a given gene. Genes used as the initiating mutation for a given sample are denoted by colored squares (colors described in figure). Statistical significance calculated by Spearman’s rank correlation coefficient test (ρ = 0.93; p ≤ 2.2 × 10⁻¹⁶). E) Number of samples where a monoallelic clone for a given gene is observed. Dark blue denotes total number of mutant samples where single-mutant clone is present for a given gene and grey represents mutant samples where single-mutant clone is unobserved. F) Number of DNMT3A mutant samples where single-mutant clones are observed (red) or unobserved (grey) with samples categorized by DNMT3A R882 hotspot mutations, nonsense mutations, or missense mutations. A two-sided Fisher’s exact test was used to determine statistical significance (p ≤ 0.04) between DNMT3AR882 and other missense mutations. G) Differences in dominant and subclone size in DNMT3A mutant samples (n=61 biologically independent clones). Fraction of sample in the dominant clone or subclone(s) for DNMT3A nonsense (red), R882-missense (green), and non-R882 missense (blue) mutations shown. Centerline: median; box: IQR; whiskers 1.5xIQR. Each mutant clone denoted by black square. A two-sided t-test correction was used to determine statistical significance pairwise between all groups. For clarity, only significant p-values referenced in text are shown. * P < 0.1. H) As in Main Figure 3E, fraction of sample in single and double mutant clones in DNMT3A/IDH2 mutant samples. Each sample is indicated by a connecting line, absence of a line for single mutants indicates absence of clone.
Extended Figure 4. Clonal evolution in MM patients.
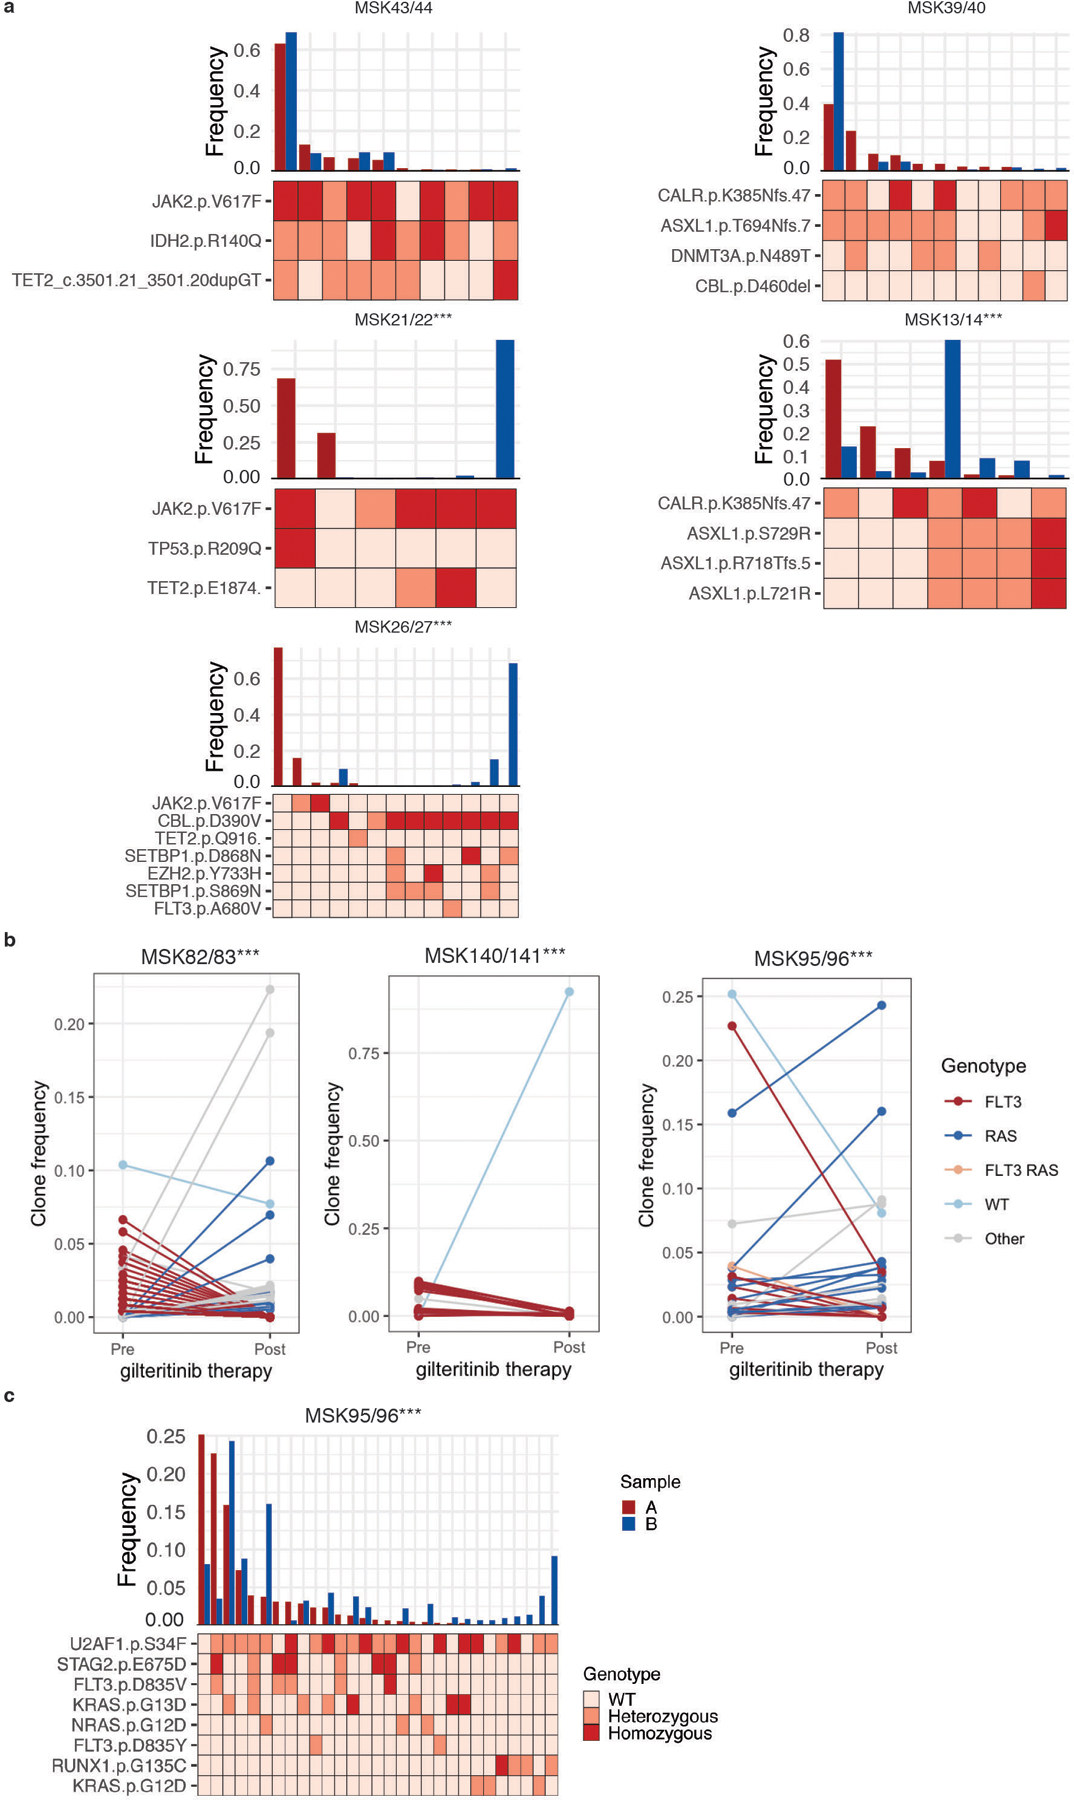
A) Paired samples from patients (n=6) that underwent MPN to AML transformation were analyzed. Samples with significant changes in clonal architecture or “clonal sweeps” were evaluated using a two-sided two proportions z-test; ***P<0.001. Sample A (red) denotes the MPN sample and sample B (blue) denotes the AML sample. Clonotype plot depicts the frequency of a clone with given genotype in Sample A and B ranked by decreasing frequency based on Sample A (top panel). Heatmap (bottom panel) shows the genotype of each identified protein coding mutation in the given clone with zygosity (wildtype = light pink, heterozygous = orange, homozygous = red). Paired samples MSK75/76 are highlighted in Main Figure 3F. B) Clonal sweeps, or significant clonal architecture alterations, following gilteritinib therapy of FLT3-mutant patients (n=3). Line graphs for each pair of samples depict individual clones and the change in clone frequency between pre- (left) and post- (right) therapy samples. Clones harboring FLT3 mutations (red), RAS mutations (blue), or WT clones (light blue) are significantly altered after gilteritinib therapy in each patient. FLT3/RAS mutations (orange) and clones harboring additional mutations (Other; grey) are also included. Statistical significance was assessed using a two-sided two proportions z-test; ***P<0.001 (A-B). C) As in (A), clonotype plot of paired sample (n=1 sample/timepoint) from AML patient (MSK95/96) that under gilteritinib therapy: sample A (red, pre-therapy) and sample B (blue, post-therapy).
Extended Figure 5. Contribution of clonal hematopoiesis (CH) mutations to mature cell lineages.
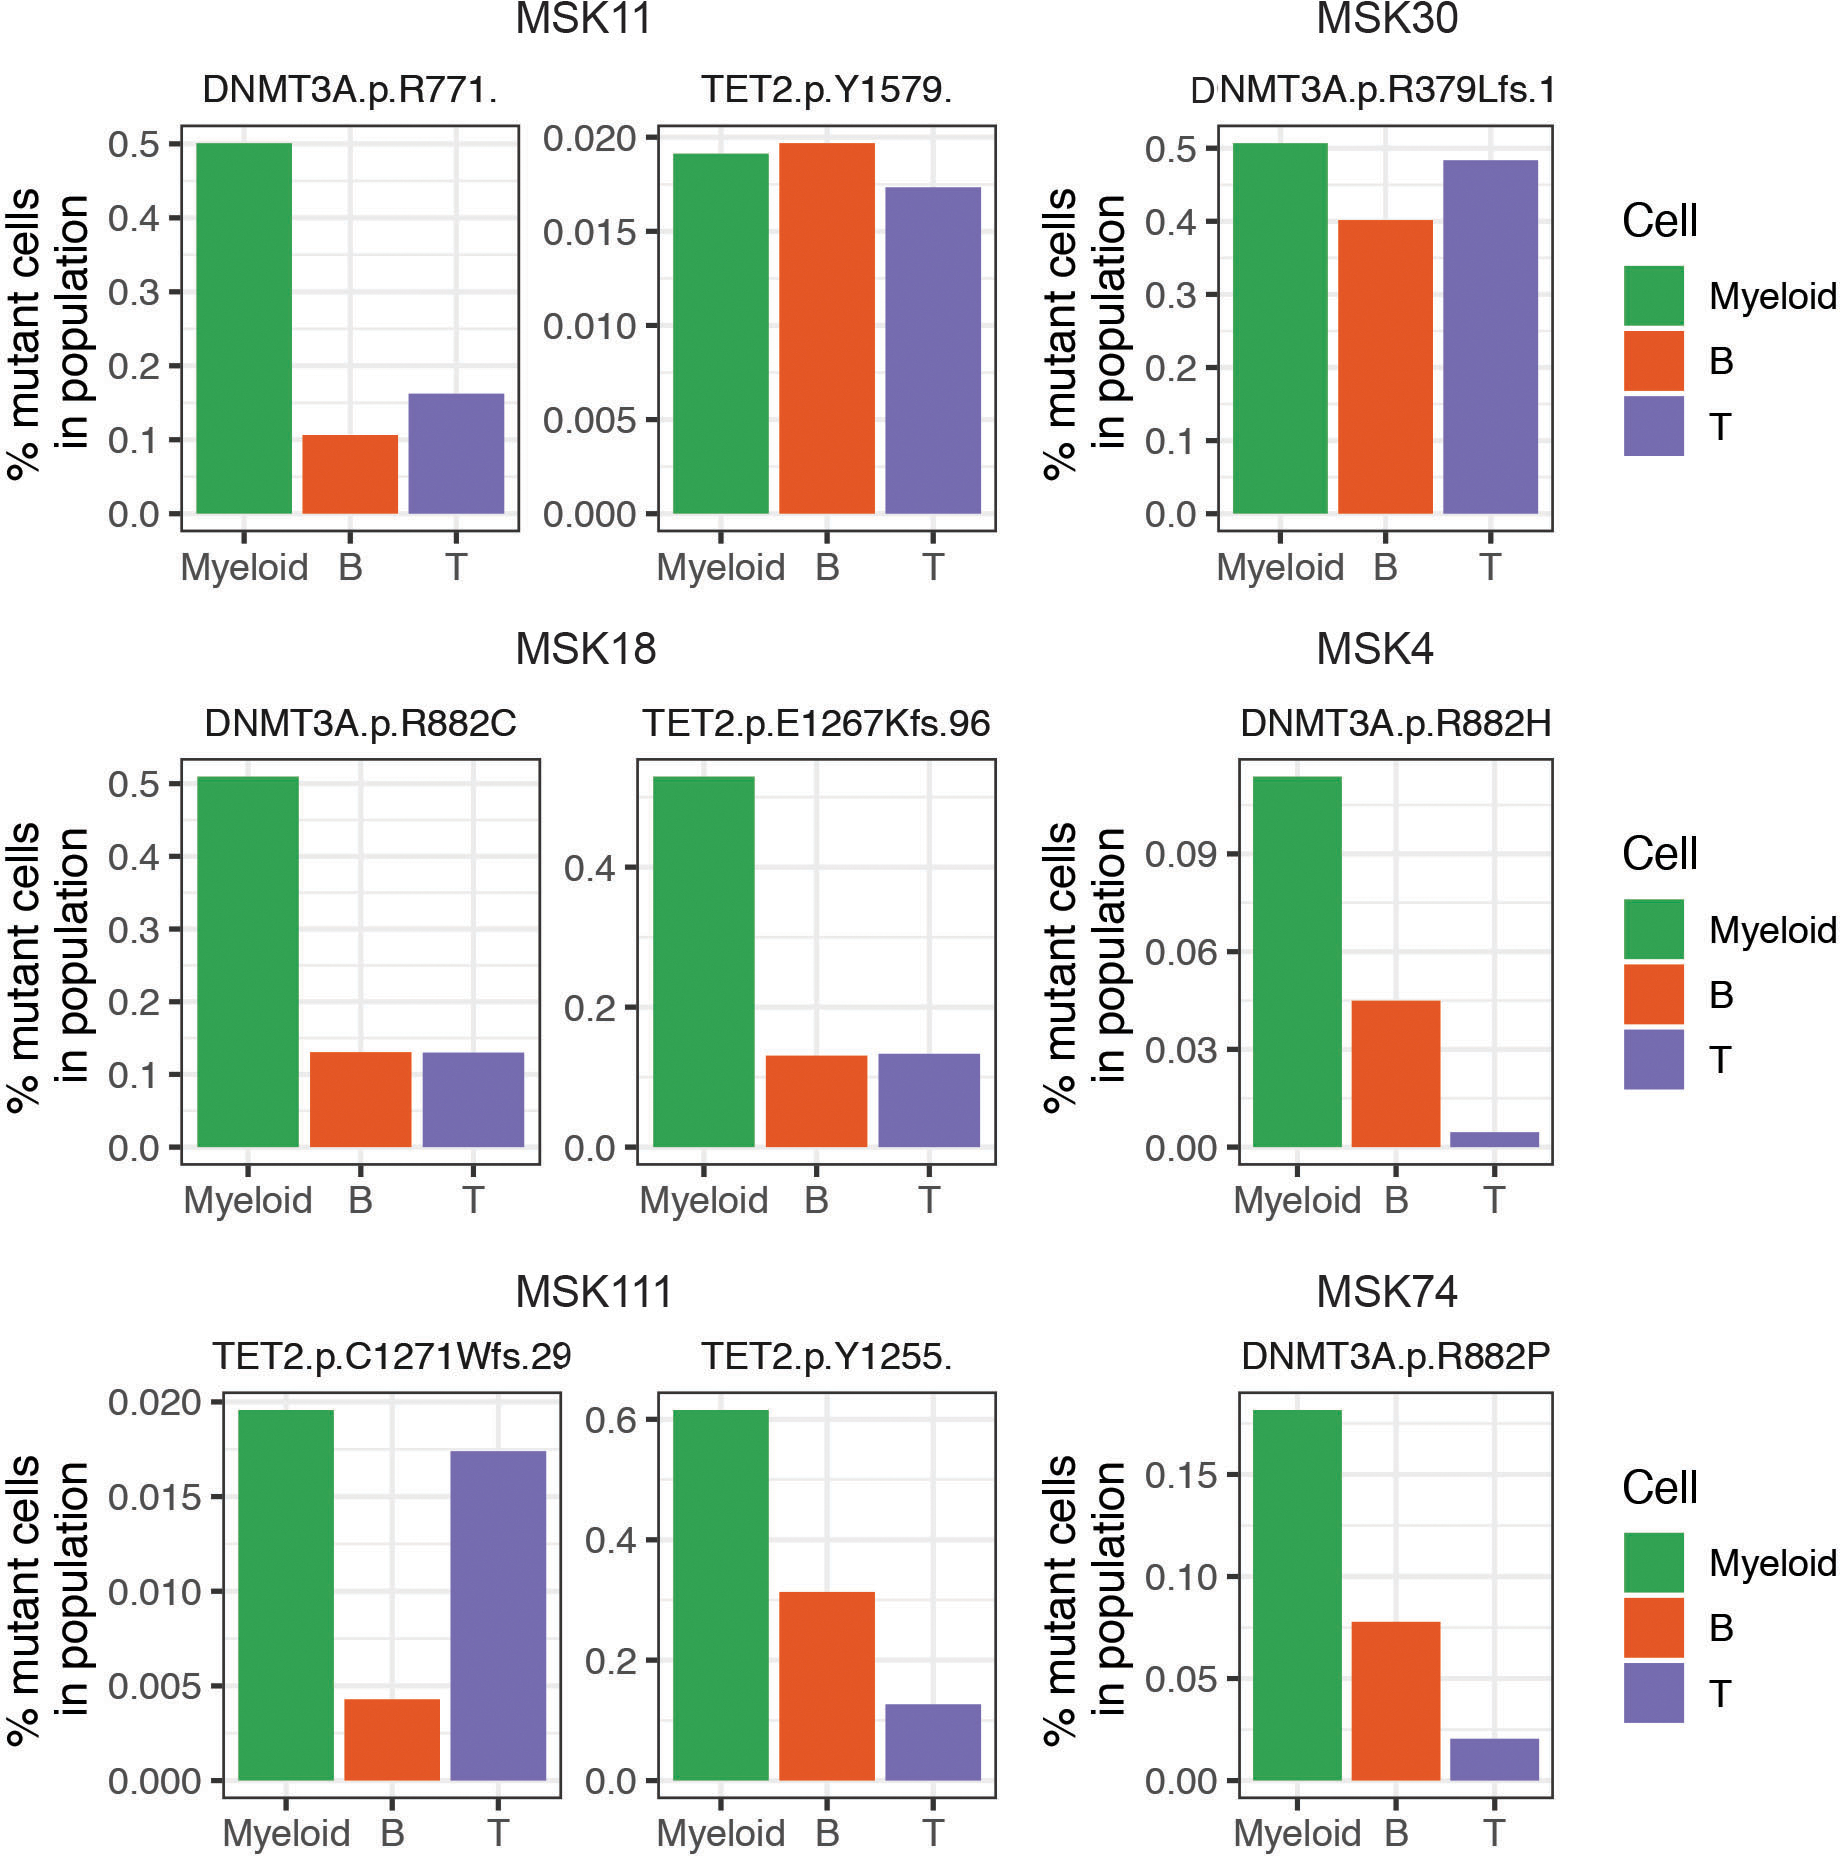
Bar graphs of the mutant cell percentage found in Myeloid (CD11b high; green), B-cell (CD19 high; orange), and T-cell (CD3 high; purple) cells in samples from patients with CH. DNMT3A and/or TET2 mutations found in each sample are listed above each graph. Double mutant samples are shown on the left and single mutant samples are depicted on the right.
Extended Figure 6. Simultaneous molecular and immunophenotypic profiling of AML patient samples.
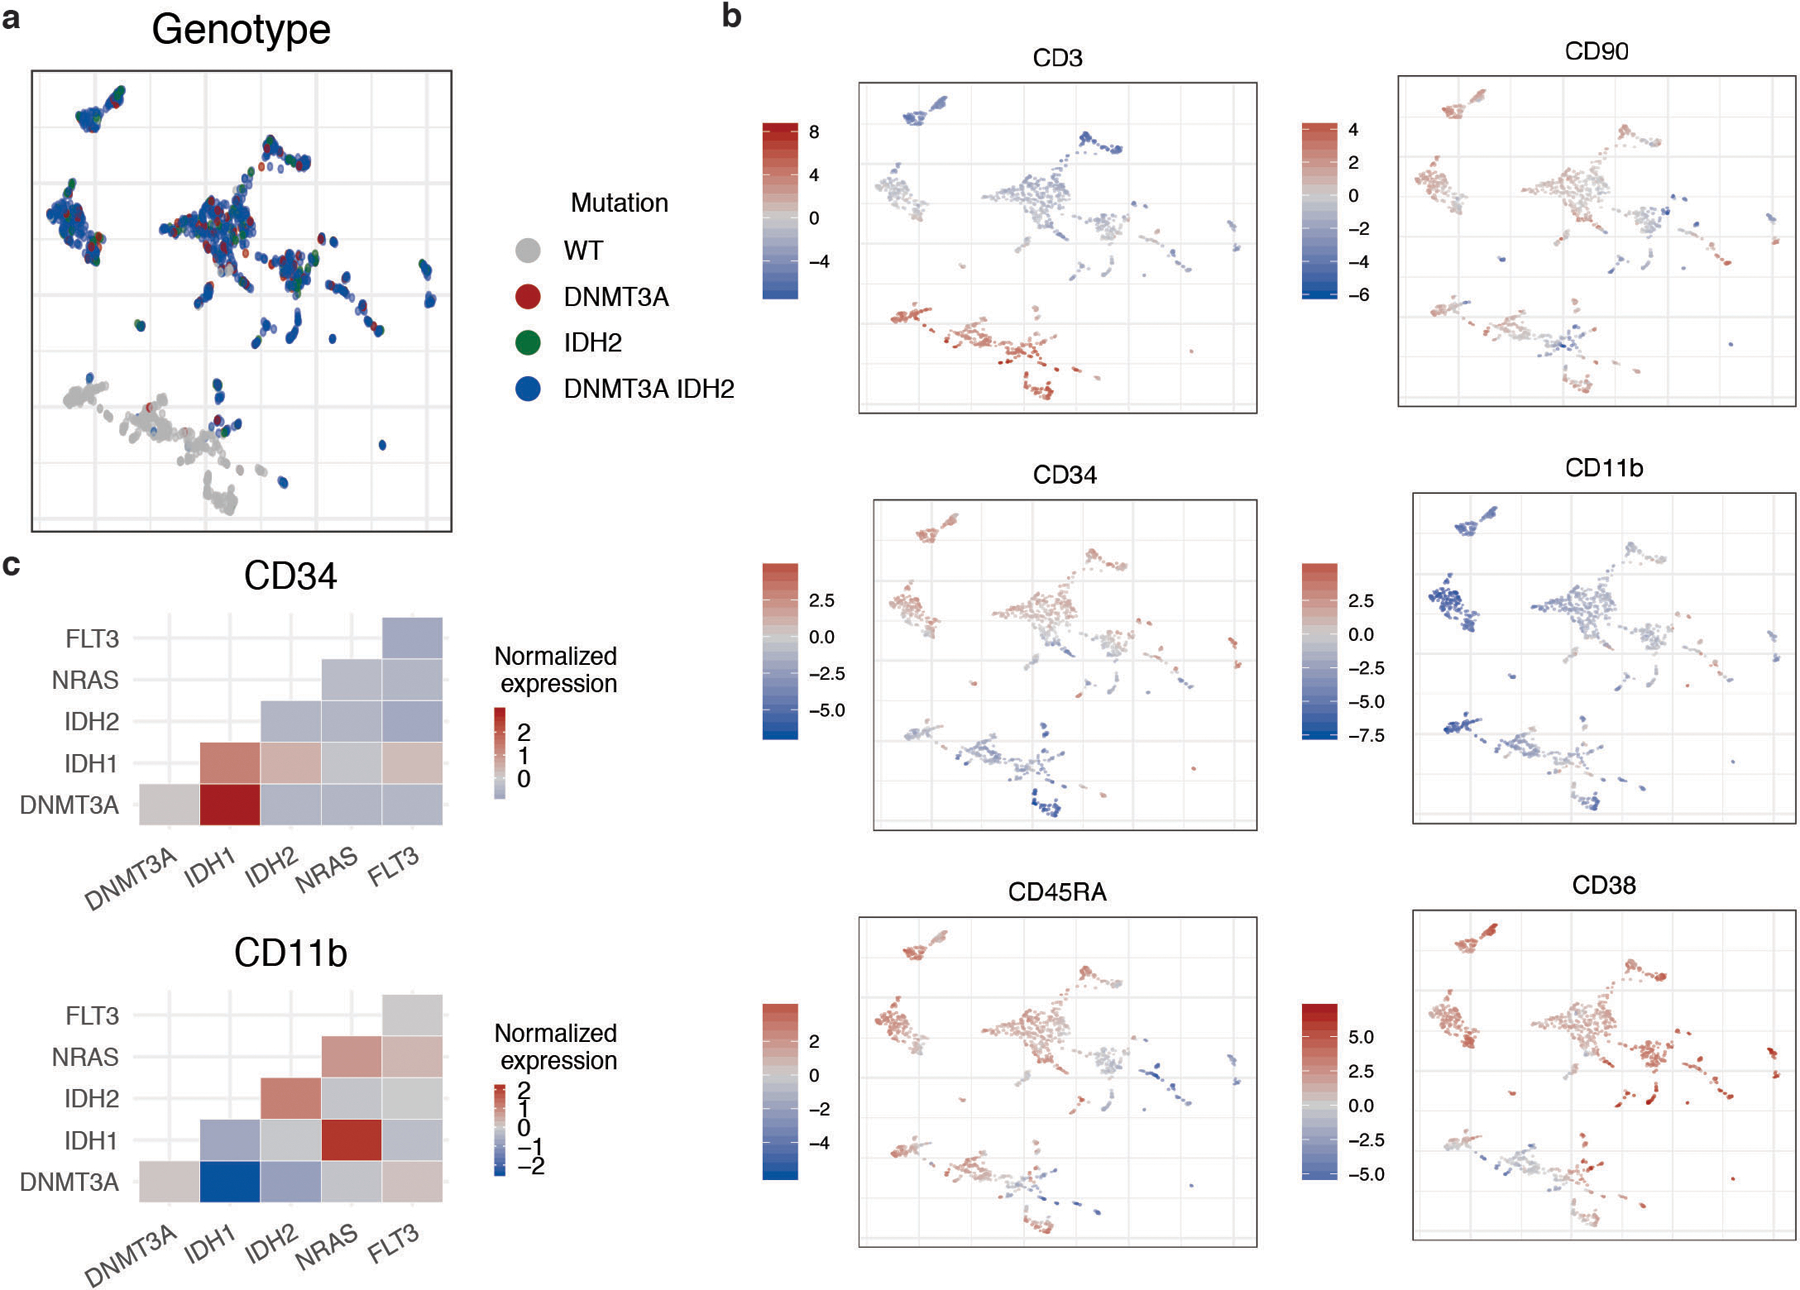
A) UMAP plot of MSK54 with cells clustered by immunophenotype. Genotype (WT= grey; DNMT3A = red; IDH2 = green; DNMT3A/IDH2 double mutant = blue) overlaid onto each cell. B) UMAP from A with protein expression (high expression = red; low expression = blue) for each of the 6 antibody targets (CD3, CD11b, CD34, CD38, CD45RA, CD90) overlaid onto each cell. Relative protein expression is normalized across individual sample by centered log transformation (CLR). C) Immunophenotype changes based on co-occurring mutations in clones. Heatmap of normalized protein expression of CD34 (top panel) and CD11b (bottom panel) in DNMT3A and IDH1/2 single-mutant clones vs. DNMT3A and IDH1/2 mutant clones with co-occurring NRAS or FLT3 mutations. High protein expression depicted in red and low protein expression depicted in blue.
Extended Figure 7. Clonal architecture analysis using single cell DNA + Protein sequencing of select AML samples.
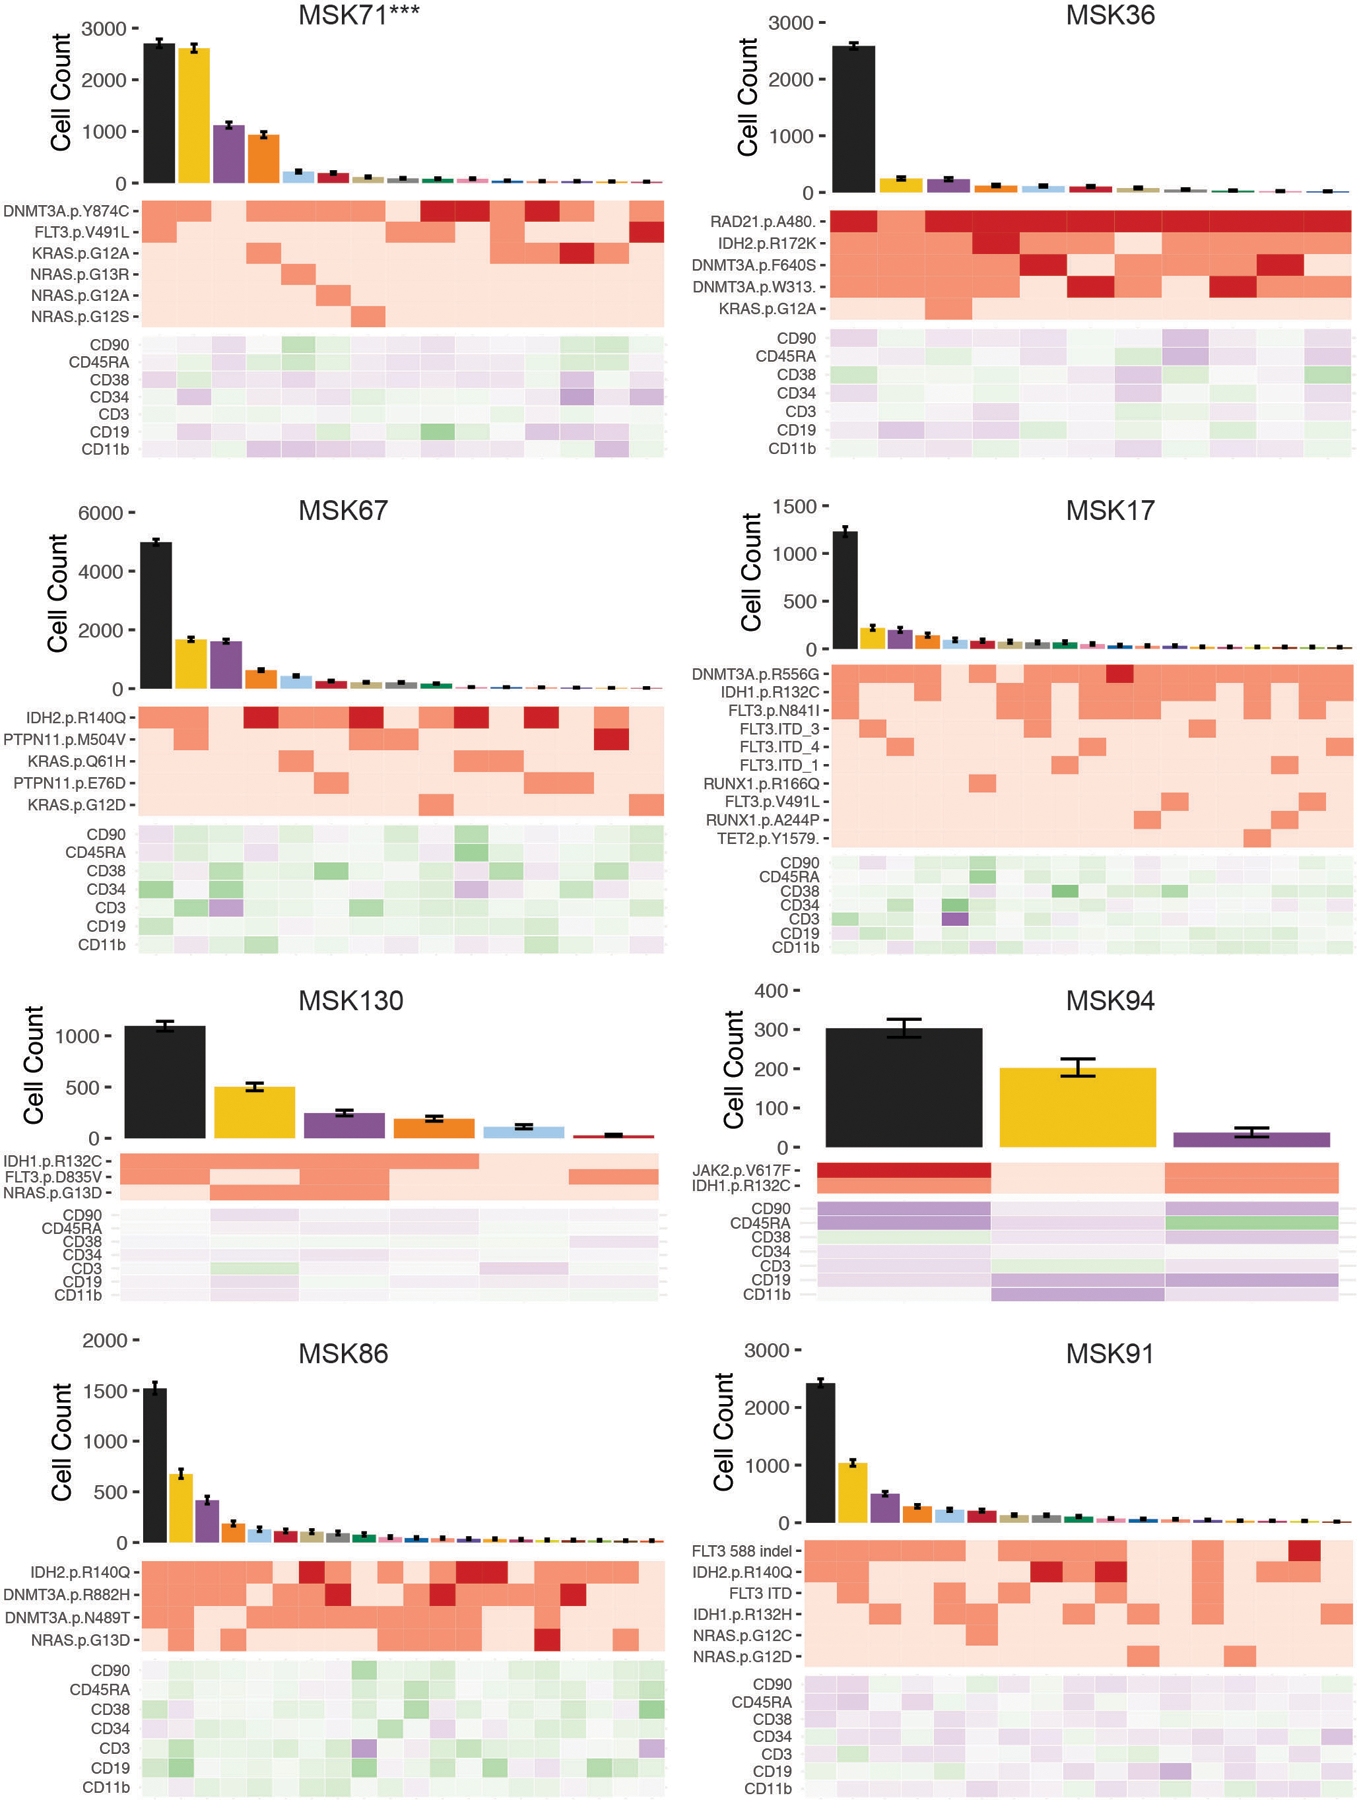
Samples shown have significant differences in community representation between the dominant clone and subclones further discussed in Extended Figure 8. MSK71 (depicted with ***) is highlighted in Main Figure 4C–F. Clonotype plot depicts the number of cells identified with a given genotype and ranked by decreasing frequency (top panel). Mean cell counts for each clone is depicted with 95% confidence intervals derived from random resampling analysis. Heatmap (middle panel) shows the genotype of each identified protein coding mutation in the given clone with zygosity (wildtype = light pink, heterozygous = orange, homozygous = red). Heatmap of the relative protein expression for each cell surface protein (n=7) in each identified clone (purple = high expression; green = low expression).
Extended Figure 8. Neighborhood analysis of all single cell DNA+Protein AML samples.
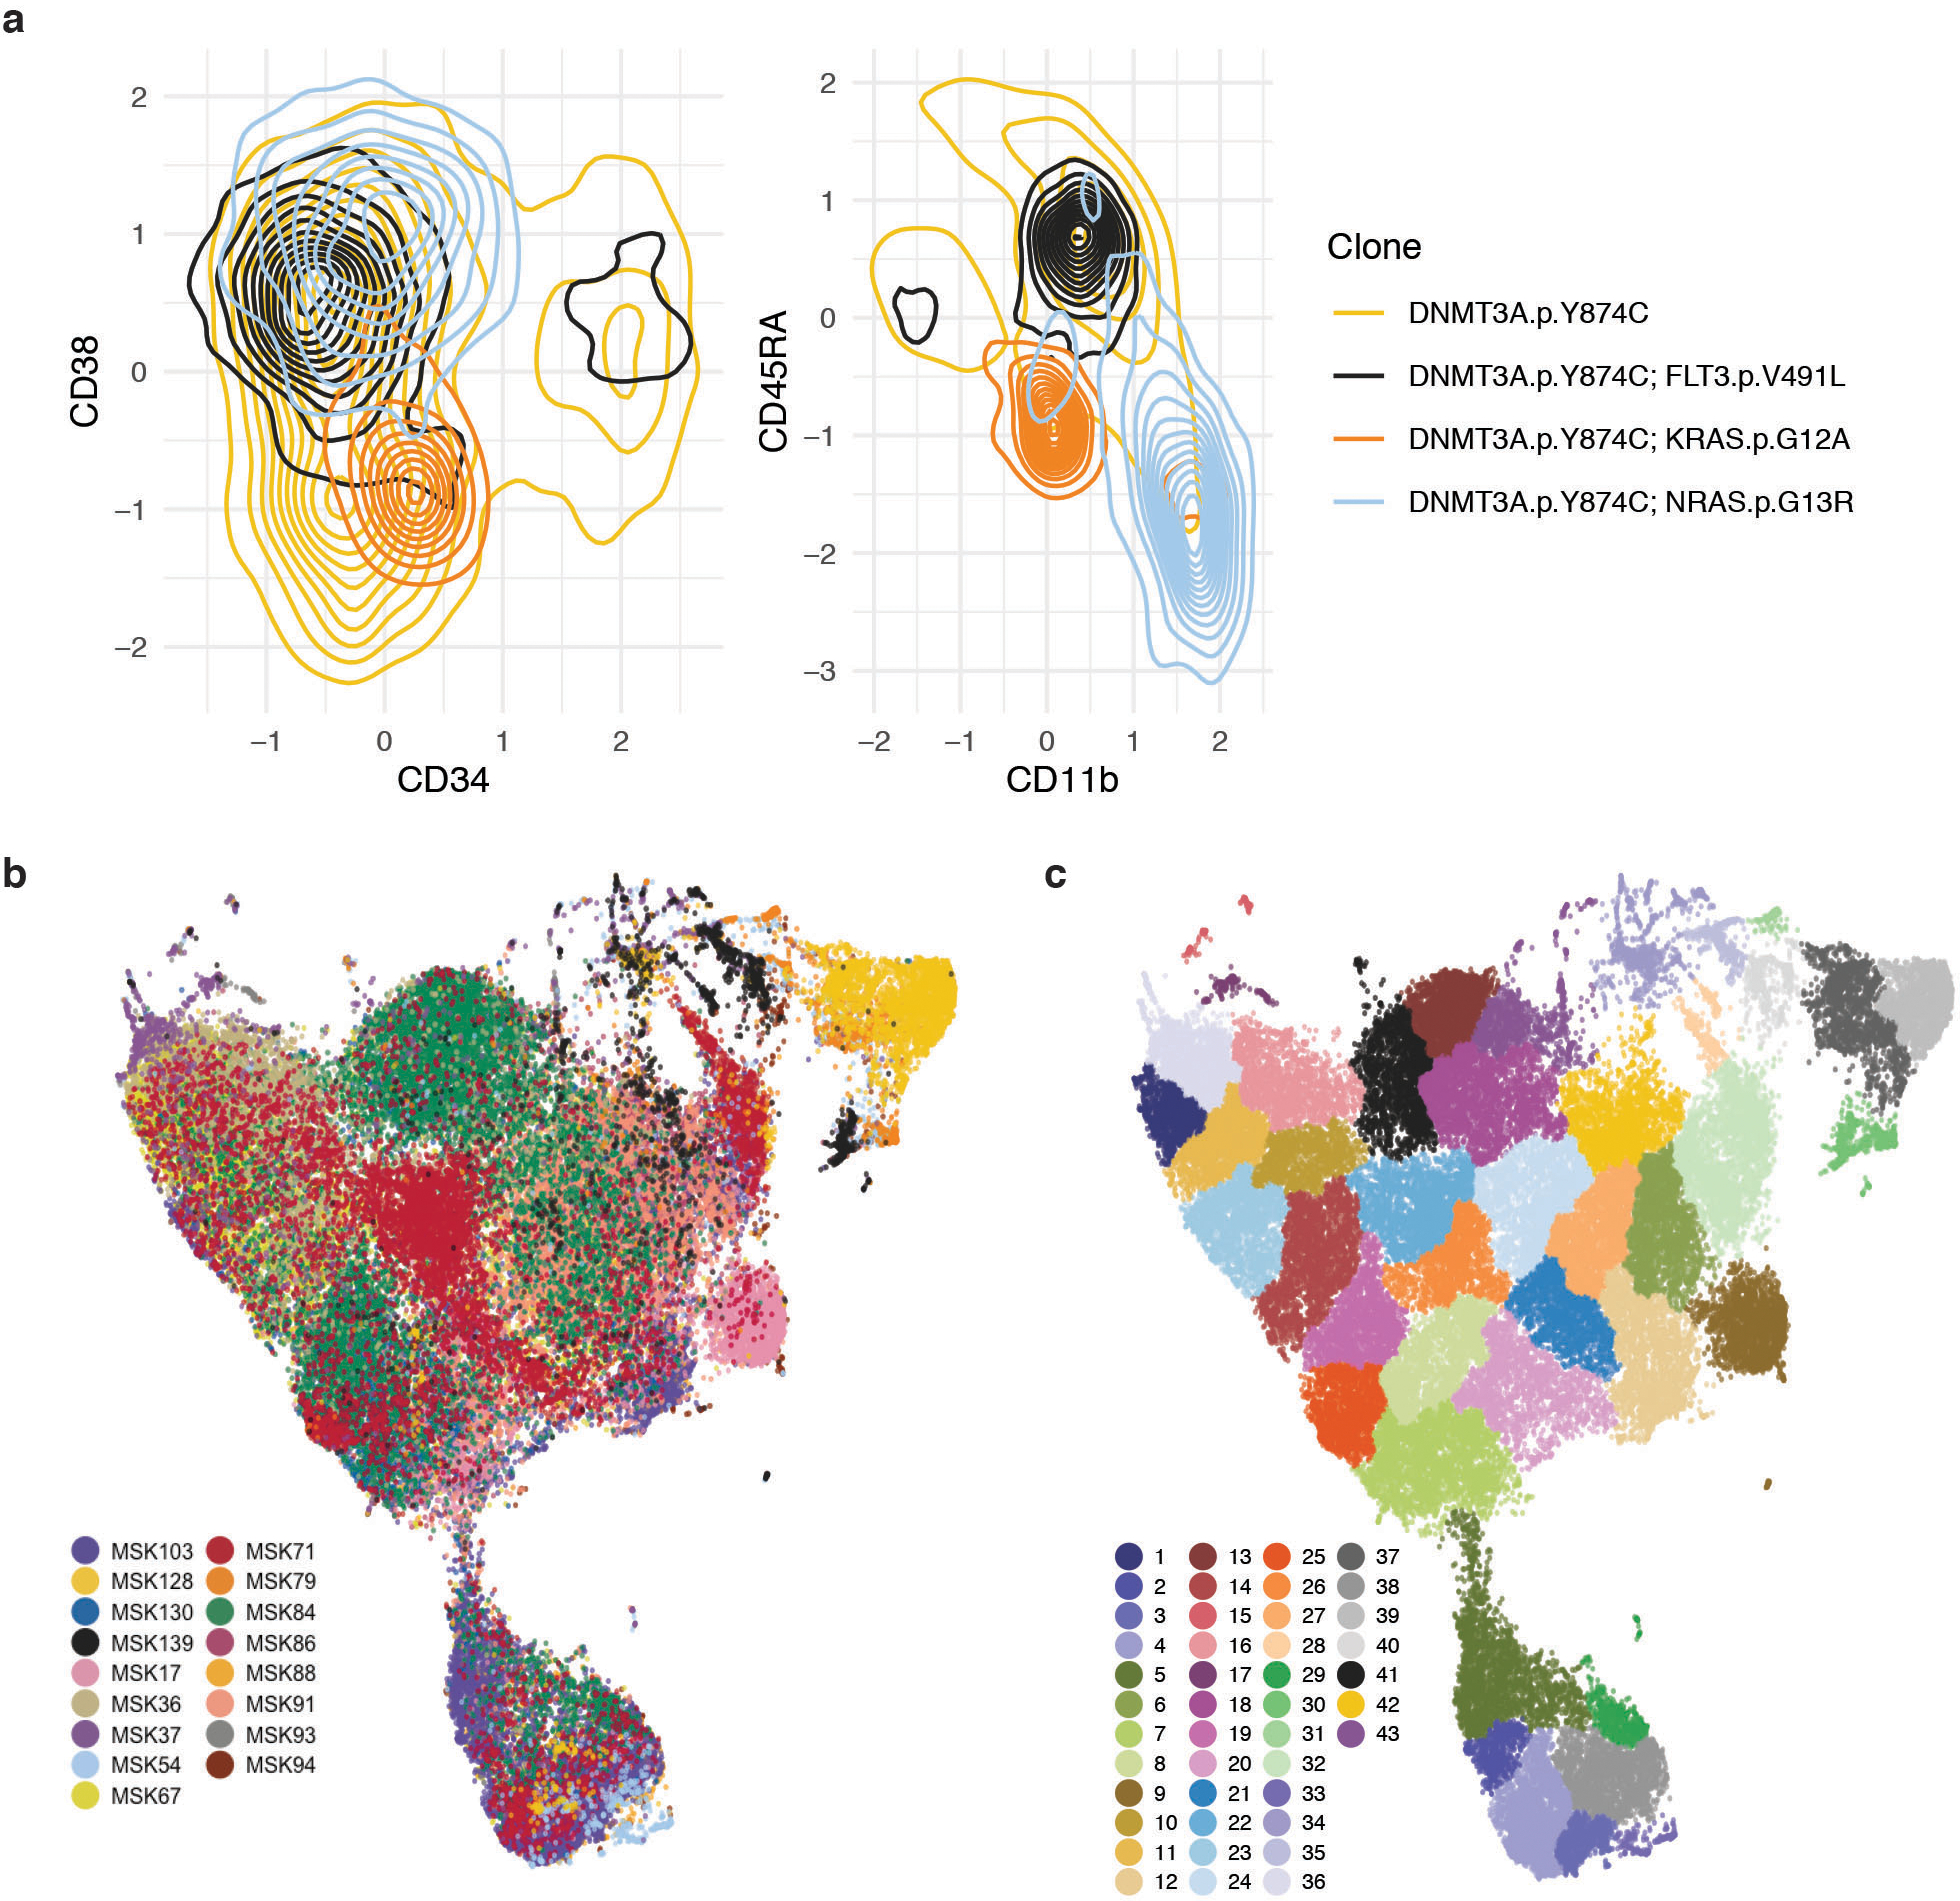
A) Divergences in cell surface protein expression of CD34, CD38, CD11b, and CD45RA determined by presence of signaling effector mutation. Density plots of cells from MSK71 (further detailed in Figure 4C–F and Extended Figure 7) of DNMT3A mutant cells (yellow = single-mutant) with co-occurring FLT3 (black), KRAS (orange), or NRAS (light blue) mutations. Concentration of cells with a given immunophenotype depicted by the density of lines. B) UMAP plot of samples (n=17) analyzed by DNA+Protein single cell sequencing with cells clustered by cell surface protein expression of 6 antibody targets (CD3, CD11b, CD34, CD38, CD45RA, CD90). Cells from the same sample are denoted with same color. C) Neighborhood analysis of all samples from UMAP from (B) with communities of cells identified by neighborhood analysis in overlaid colors.
Extended Figure 9. Clone- and gene- specific alterations to cell surface protein expression and community representation in AML samples.
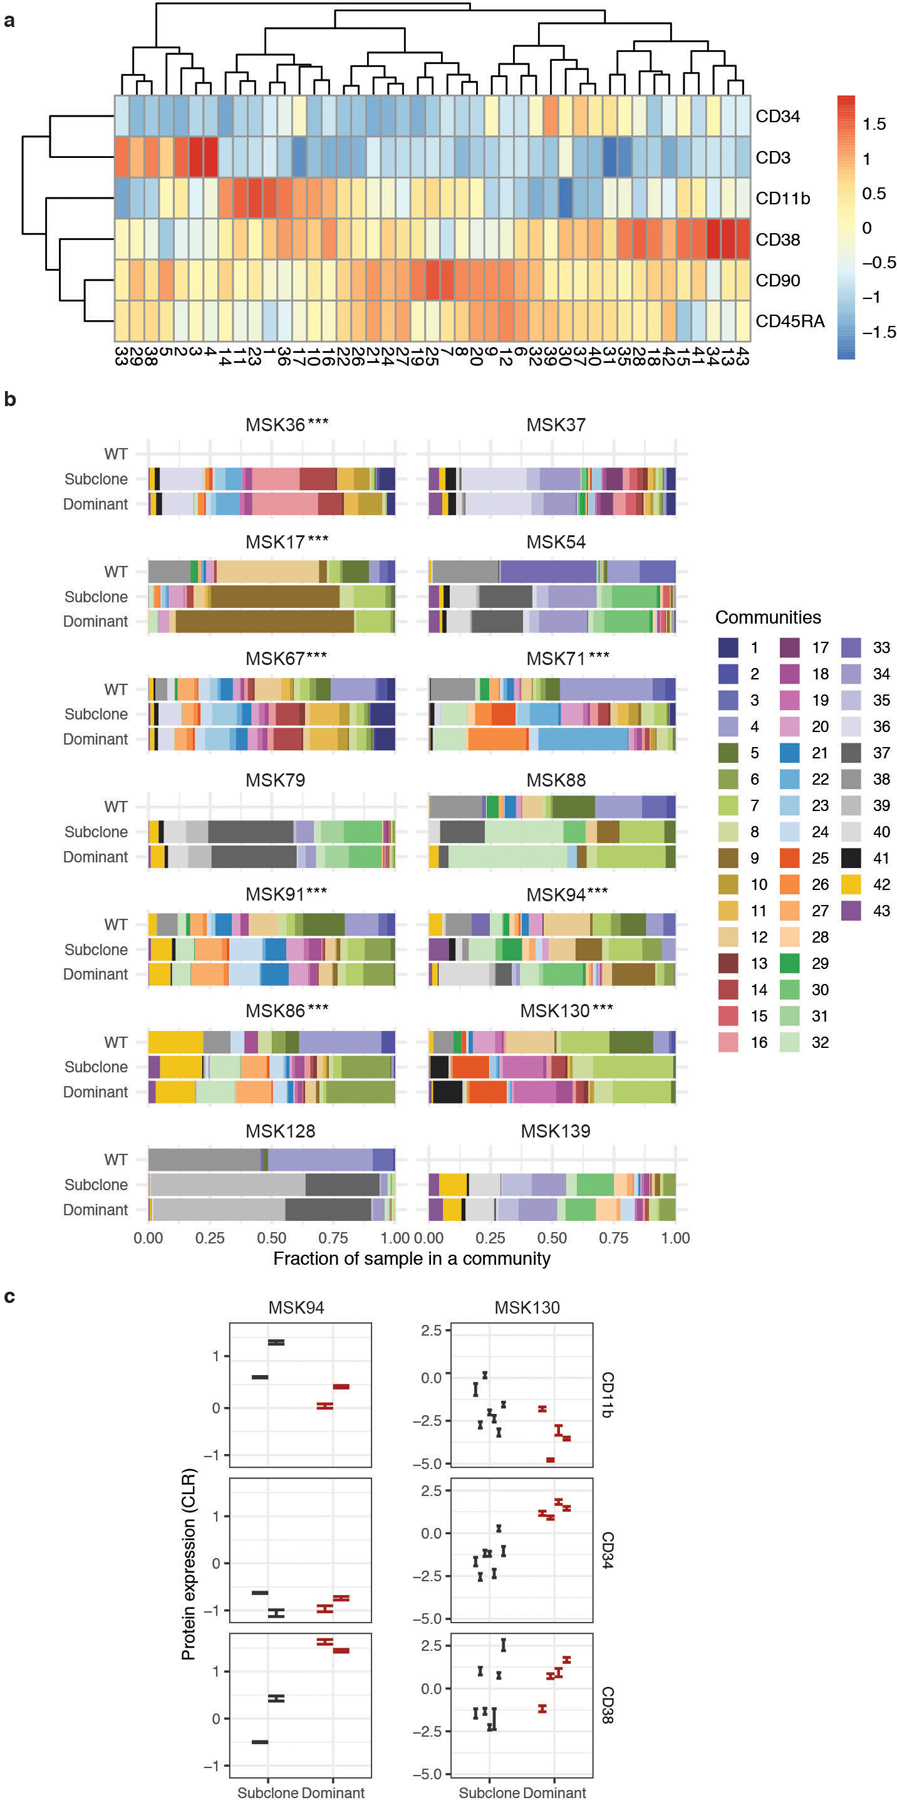
A) Column normalized heatmap of cell surface protein expression for each community identified in phenoGraph analysis on UMAP from Extended Figure 8B–C. Expression is depicted by color with blue being low expression and red annotating high expression. B) Community representation changes across all samples (n=14) in WT, the dominant clone, and all subclones. The fraction of each sample within each community is shown with communities depicted by corresponding color. Samples without communities shown for WT cells were found to not have any WT cells present in analysis. Changes in immunophenotype due to community representation changes for samples MSK94 (p ≤ 9.95 × 10⁻³) and MSK130 (p ≤ 2.45 × 10⁻⁸) are highlighted in C. A two proportions z-test for each sample was used to determine statistical significance between dominant clone communities and communities present in subclone ***P < 0.001. C) Cell surface protein expression of CD11b, CD34, and CD38 between dominant clone (red) and subclones (black) in a FLT3-ITD mutant sample (MSK130; right panel; n=2274 total cells) and JAK2 mutant sample (MSK94; left panel; n=6012 total cells). Each error bar represents a distinct community that is significantly expanded or contracted, (error bar indicates ± standard error of measure, from the mean expression of indicated protein in a given community). A Student’s t-test was used to determine statistical significance * P < 0.1; ** P < 0.01; ***P < 0.001.
Supplementary Material
Acknowledgements
We acknowledge the use of the MSKCC Integrated Genomics Core for all library sequencing which is funded by the MSKCC Support Grant NIH P30 CA008748. We thank the members of the Levine Lab for their critique of our work and assistance with revisions. Additionally, we would like to thank MSKCC Hematopathology Service Cell Marker Lab Director, Dr. Mikhail Roshal, and Dr. Wenbin Xiao, for their essential input regarding AML stem/progenitor protein expression. L.A.M is supported by a Career Development Program Fellowship of the Leukemia and Lymphoma Society (5479-19) and a Postdoctoral Fellowship from the MSKCC Marie-Josée Kravis Women in Science Endeavor (WiSE). R.L.B. is supported by the Sohn Foundation Fellowship of the Damon Runyon Cancer Research Foundation (DRG 22-17) and a National Cancer Institute K99 CA248460 grant. C.L.D. is supported by Swiss National Science Foundation fellowship (Grant No. 183853). K.L.B. is supported by grants including a National Institute of Health K08 CA241318, an American Society of Hematology (ASH) grant, and an EvansMDS grant. A.D.V. is supported by the William Raveis Charitable Fund Fellowship of the Damon Runyon Cancer Research Foundation (DRG 117-15), an EvansMDS Young Investigator grant from the Edward P. Evans Foundation, and a National Cancer Institute career development grant K08 CA215317. This work is supported by grants to S.E.M including National Cancer Institute R37 CA226433, Conquer Cancer Now Award from the Concern Foundation, and Sidney Kimmel Cancer Center (SKCC) Support Grant NIH P30 CA056036. This work was supported by grants to R.L.L. including a Cycle For Survival Innovation Grant, National Cancer Institute R35 CA197594, National Cancer Institute R01 CA173636, a grant from the Samuel Waxman Cancer Research Foundation, and SCOR grants from the Leukemia and Lymphoma Society.
Footnotes
Declaration of Interests
L.A.M. and A.D.V. received travel support and honoraria from Mission Bio. A.T.O., R.D.D., P.M., C.A., M.M., and S.S. are employed by Mission Bio and own equity in Mission Bio. A.R.A. is a cofounder and shareholder of Mission Bio. A.Z. has received honoraria from Illumina. M.P.C. has consulted for Janssen Pharmaceuticals. A.D.G. has served on advisory boards or as a consultant for AbbVie, Aptose, Celgene, Daiichi Sankyo, and Genentech, received research funding from AbbVie, ADC Therapeutics, Aprea, Aptose, AROG, Celularity, Daiichi Sankyo, and Pfizer, and received honoraria from Dava Oncology. R.R. has consulted for Constellation, Incyte, Celgene, Promedior, CTI, Jazz Pharmaceuticals, Blueprint, Stemline, Galecto, Pharmessentia, and Abbvie, and received research support from Incyte, Stemline, and Constellation. A.D.V. is on the Editorial Advisory Board of Hematology News. R.L.L. is on the supervisory board of QIAGEN and Mission Bio and is a scientific advisor to Loxo (until Feb 2019), Imago, C4 Therapeutics, and Isoplexis. He receives research support from and consulted for Celgene and Roche and has consulted for Lilly, Jubilant, Janssen, Astellas, Morphosys, and Novartis. He has received honoraria from Roche, Lilly, and Amgen for invited lectures and from Celgene and Gilead for grant reviews. R.L.B., T.R.M., I.S.C., C.F., M.A.P., M.B., B.D., C.L.D., K.B., and S.E.M. disclose no competing interests.
Supplementary Information
Supplementary Material is available for this paper.
References
- 1.Genovese G et al. Clonal hematopoiesis and blood-cancer risk inferred from blood DNA sequence. N Engl J Med 371, 2477–2487, doi: 10.1056/NEJMoa1409405 (2014). [DOI] [PMC free article] [PubMed] [Google Scholar]
- 2.Jan M et al. Clonal evolution of preleukemic hematopoietic stem cells precedes human acute myeloid leukemia. Sci Transl Med 4, 149ra118, doi: 10.1126/scitranslmed.3004315 (2012). [DOI] [PMC free article] [PubMed] [Google Scholar]
- 3.Papaemmanuil E et al. Genomic Classification and Prognosis in Acute Myeloid Leukemia. N Engl J Med 374, 2209–2221, doi: 10.1056/NEJMoa1516192 (2016). [DOI] [PMC free article] [PubMed] [Google Scholar]
- 4.Patel JP et al. Prognostic relevance of integrated genetic profiling in acute myeloid leukemia. N Engl J Med 366, 1079–1089, doi: 10.1056/NEJMoa1112304 (2012). [DOI] [PMC free article] [PubMed] [Google Scholar]
- 5.Cancer Genome Atlas Research, N. et al. Genomic and epigenomic landscapes of adult de novo acute myeloid leukemia. N Engl J Med 368, 2059–2074, doi: 10.1056/NEJMoa1301689 (2013). [DOI] [PMC free article] [PubMed] [Google Scholar]
- 6.Rampal R et al. Genomic and functional analysis of leukemic transformation of myeloproliferative neoplasms. Proc Natl Acad Sci U S A 111, E5401–5410, doi: 10.1073/pnas.1407792111 (2014). [DOI] [PMC free article] [PubMed] [Google Scholar]
- 7.Jaiswal S et al. Age-related clonal hematopoiesis associated with adverse outcomes. N Engl J Med 371, 2488–2498, doi: 10.1056/NEJMoa1408617 (2014). [DOI] [PMC free article] [PubMed] [Google Scholar]
- 8.Pellegrino M et al. High-throughput single-cell DNA sequencing of acute myeloid leukemia tumors with droplet microfluidics. Genome Res 28, 1345–1352, doi: 10.1101/gr.232272.117 (2018). [DOI] [PMC free article] [PubMed] [Google Scholar]
- 9.Levine RL et al. X-inactivation-based clonality analysis and quantitative JAK2V617F assessment reveal a strong association between clonality and JAK2V617F in PV but not ET/MMM, and identifies a subset of JAK2V617F-negative ET and MMM patients with clonal hematopoiesis. Blood 107, 4139–4141, doi: 10.1182/blood-2005-09-3900 (2006). [DOI] [PMC free article] [PubMed] [Google Scholar]
- 10.Kralovics R et al. A gain-of-function mutation of JAK2 in myeloproliferative disorders. N Engl J Med 352, 1779–1790, doi: 10.1056/NEJMoa051113 (2005). [DOI] [PubMed] [Google Scholar]
- 11.Xie M et al. Age-related mutations associated with clonal hematopoietic expansion and malignancies. Nat Med 20, 1472–1478, doi: 10.1038/nm.3733 (2014). [DOI] [PMC free article] [PubMed] [Google Scholar]
- 12.Abdel-Wahab O et al. Genetic analysis of transforming events that convert chronic myeloproliferative neoplasms to leukemias. Cancer Res 70, 447–452, doi: 10.1158/0008-5472.CAN-09-3783 (2010). [DOI] [PMC free article] [PubMed] [Google Scholar]
- 13.Ortmann CA et al. Effect of mutation order on myeloproliferative neoplasms. N Engl J Med 372, 601–612, doi: 10.1056/NEJMoa1412098 (2015). [DOI] [PMC free article] [PubMed] [Google Scholar]
- 14.Buscarlet M et al. DNMT3A and TET2 dominate clonal hematopoiesis and demonstrate benign phenotypes and different genetic predispositions. Blood 130, 753–762, doi: 10.1182/blood-2017-04-777029 (2017). [DOI] [PubMed] [Google Scholar]
- 15.Coombs CC et al. Therapy-Related Clonal Hematopoiesis in Patients with Non-hematologic Cancers Is Common and Associated with Adverse Clinical Outcomes. Cell Stem Cell 21, 374–382 e374, doi: 10.1016/j.stem.2017.07.010 (2017). [DOI] [PMC free article] [PubMed] [Google Scholar]
- 16.McMahon CM et al. Clonal Selection with RAS Pathway Activation Mediates Secondary Clinical Resistance to Selective FLT3 Inhibition in Acute Myeloid Leukemia. Cancer Discov 9, 1050–1063, doi: 10.1158/2159-8290.CD-18-1453 (2019). [DOI] [PMC free article] [PubMed] [Google Scholar]
- 17.Demaree B et al. Joint profiling of proteins and DNA in single cells reveals extensive proteogenomic decoupling in leukemia. bioRxiv (2020). [Google Scholar]
- 18.van Galen P et al. Single-Cell RNA-Seq Reveals AML Hierarchies Relevant to Disease Progression and Immunity. Cell 176, 1265–1281 e1224, doi: 10.1016/j.cell.2019.01.031 (2019). [DOI] [PMC free article] [PubMed] [Google Scholar]
- 19.Petti AA et al. A general approach for detecting expressed mutations in AML cells using single cell RNA-sequencing. Nat Commun 10, 3660, doi: 10.1038/s41467-019-11591-1 (2019). [DOI] [PMC free article] [PubMed] [Google Scholar]
- 20.Falini B, Nicoletti I, Martelli MF & Mecucci C Acute myeloid leukemia carrying cytoplasmic/mutated nucleophosmin (NPMc+ AML): biologic and clinical features. Blood 109, 874–885, doi: 10.1182/blood-2006-07-012252 (2007). [DOI] [PubMed] [Google Scholar]
- 21.Majeti R, Park CY & Weissman IL Identification of a hierarchy of multipotent hematopoietic progenitors in human cord blood. Cell Stem Cell 1, 635–645, doi: 10.1016/j.stem.2007.10.001 (2007). [DOI] [PMC free article] [PubMed] [Google Scholar]
- 22.Goardon N et al. Coexistence of LMPP-like and GMP-like leukemia stem cells in acute myeloid leukemia. Cancer Cell 19, 138–152, doi: 10.1016/j.ccr.2010.12.012 (2011). [DOI] [PubMed] [Google Scholar]
- 23.Levine JH et al. Data-Driven Phenotypic Dissection of AML Reveals Progenitor-like Cells that Correlate with Prognosis. Cell 162, 184–197, doi: 10.1016/j.cell.2015.05.047 (2015). [DOI] [PMC free article] [PubMed] [Google Scholar]
- 24.Shlush LI et al. Identification of pre-leukaemic haematopoietic stem cells in acute leukaemia. Nature 506, 328–333, doi: 10.1038/nature13038 (2014). [DOI] [PMC free article] [PubMed] [Google Scholar]
- 25.Klco JM et al. Functional heterogeneity of genetically defined subclones in acute myeloid leukemia. Cancer Cell 25, 379–392, doi: 10.1016/j.ccr.2014.01.031 (2014). [DOI] [PMC free article] [PubMed] [Google Scholar]
- 26.Paguirigan AL et al. Single-cell genotyping demonstrates complex clonal diversity in acute myeloid leukemia. Sci Transl Med 7, 281re282, doi: 10.1126/scitranslmed.aaa0763 (2015). [DOI] [PMC free article] [PubMed] [Google Scholar]
Methods References
- 27.Patel JP et al. Prognostic relevance of integrated genetic profiling in acute myeloid leukemia. N Engl J Med 366, 1079–1089, doi: 10.1056/NEJMoa1112304 (2012). [DOI] [PMC free article] [PubMed] [Google Scholar]
- 28.Papaemmanuil E et al. Genomic Classification and Prognosis in Acute Myeloid Leukemia. N Engl J Med 374, 2209–2221, doi: 10.1056/NEJMoa1516192 (2016). [DOI] [PMC free article] [PubMed] [Google Scholar]
- 29.Rampal R et al. Genomic and functional analysis of leukemic transformation of myeloproliferative neoplasms. Proc Natl Acad Sci U S A 111, E5401–5410, doi: 10.1073/pnas.1407792111 (2014). [DOI] [PMC free article] [PubMed] [Google Scholar]
- 30.Tefferi A & Vardiman JW Classification and diagnosis of myeloproliferative neoplasms: the 2008 World Health Organization criteria and point-of-care diagnostic algorithms. Leukemia 22, 14–22, doi: 10.1038/sj.leu.2404955 (2008). [DOI] [PubMed] [Google Scholar]
- 31.Cheng DT et al. Memorial Sloan Kettering-Integrated Mutation Profiling of Actionable Cancer Targets (MSK-IMPACT): A Hybridization Capture-Based Next-Generation Sequencing Clinical Assay for Solid Tumor Molecular Oncology. J Mol Diagn 17, 251–264, doi: 10.1016/j.jmoldx.2014.12.006 (2015). [DOI] [PMC free article] [PubMed] [Google Scholar]
- 32.Pellegrino M et al. High-throughput single-cell DNA sequencing of acute myeloid leukemia tumors with droplet microfluidics. Genome Res 28, 1345–1352, doi: 10.1101/gr.232272.117 (2018). [DOI] [PMC free article] [PubMed] [Google Scholar]
- 33.Proellochs N & Feuerriegel S (R package version 1.0.4, 2019). [Google Scholar]
- 34.Oksanen J et al. (R package version 2.5–6, 2019). [Google Scholar]
- 35.Griffith DM, Veech JA & Marsh CJ cooccur: Probabilistic Species Co-Occurrence Analysis in R. Journal of Statistical Software 69, 1–17, doi: 10.18637/jss.v069.c02 (2016). [DOI] [Google Scholar]
- 36.Konopka T (R package version 0.2.4.1, 2020). [Google Scholar]
- 37.Levine JH et al. Data-Driven Phenotypic Dissection of AML Reveals Progenitor-like Cells that Correlate with Prognosis. Cell 162, 184–197, doi: 10.1016/j.cell.2015.05.047 (2015). [DOI] [PMC free article] [PubMed] [Google Scholar]
- 38.Chen H (R package version 0.99.1, 2015). [Google Scholar]
- 39.Wickham H ggplot2: Elegant Graphics for Data Analysis. (Springer-Verlag, 2016). [Google Scholar]
- 40.Gu Z, Eils R & Schlesner M Complex heatmaps reveal patterns and correlations in multidimensional genomic data. Bioinformatics 32, 2847–2849, doi: 10.1093/bioinformatics/btw313 (2016). [DOI] [PubMed] [Google Scholar]
- 41.Conway JR, Lex A & Gehlenborg N UpSetR: an R package for the visualization of intersecting sets and their properties. Bioinformatics 33, 2938–2940, doi: 10.1093/bioinformatics/btx364 (2017). [DOI] [PMC free article] [PubMed] [Google Scholar]
- 42.Csardi G & Nepusz T The igraph software package for complex network research. InterJournal, Complex Systems 1695 (2006). [Google Scholar]
Associated Data
This section collects any data citations, data availability statements, or supplementary materials included in this article.
Supplementary Materials
Data Availability Statement
Raw data is available on dbGAP (accession number phs002049.v1.p1) in form of loom files and FASTQ files for each sample.


