

Abstract
Ligands for cereblon, a component of a functional E3 ligase complex that targets proteins for proteolysis, are critical for developing molecular glues and proteolysis-targeting chimeras (PROTACs), which have therapeutic implications for various diseases. However, the lack of sensitivity of previously reported assays limits characterization of cereblon ligands. To address this shortcoming, we developed BODIPY FL Thalidomide (10) as a high-affinity fluorescent probe for the human cereblon protein, with a Kd value of 3.6 nM. We then used BODIPY FL Thalidomide (10) to develop a cereblon time-resolved fluorescence resonance energy transfer (TR-FRET) binding assay. The IC50 values of the cereblon ligand pomalidomide (8) were 6.4 nM in our cereblon TR-FRET binding assay, 264.8 nM in a previously reported Cy5-conjugated thalidomide (7)-mediated fluorescence polarization (FP) assay, and 1.2 μM in a previously reported Cy5-conjugated cereblon modulator (compound 7) (9)-mediated TR-FRET assay, indicating that our cereblon TR-FRET binding assay is 41- and 187-fold more sensitive than these two previously published assays. With our cereblon TR-FRET binding assay, we detected binding of cereblon ligands but not binding of bromodomain-containing protein 4 or von Hippel–Lindau ligands, thereby demonstrating its selectivity. Our cereblon TR-FRET binding assay was very stable and detected changes in phthalimide activity due to thalidomide isomerization. Therefore, the BODIPY FL Thalidomide (10)-mediated cereblon TR-FRET binding assay we designed is highly sensitive, selective, and stable and will aid the development and characterization of novel cereblon ligands.
Keywords: Cereblon, E3 ligase, Thalidomide, BODIPY FL Thalidomide, TR-FRET, PROTAC, Molecular glue
Graphical Abstract

INTRODUCTION
E3 ubiquitin ligases target proteins for proteasomal degradation. E3 ligases, or components of the ligase complexes, that have known small-molecule ligands, such as cereblon (CRBN) and von Hippel–Lindau (VHL), have garnered recent attention because of their importance for developing protein degraders. Such protein degraders include molecular glues and proteolysis-targeting chimeras (PROTACs), which may be exploited as novel therapies for various diseases, including cancers and metabolic disorders.1–3 Typically, the low molecular weight ligands of cereblon (< 500 Da) function as molecular glues, such as lenalidomide (1, 259 Da) in degrading the target proteins IKAROS (IKZF1) and AIOLOS (IKZF3)4–6 or CC-885 (2, 440 Da) in degrading GSPT1.7
These cereblon ligands have generally high binding affinities to cereblon, but with no or very low binding affinity to the target proteins they degrade. Ligand-free cereblon does not bind its target proteins, but upon ligand binding, cereblon is induced to bind its target proteins. Therefore, these small molecule cereblon ligands function as molecular glues to couple cereblon and its target proteins. In contrast, PROTACs are bivalent ligands joined together by a linker: one ligand for the E3 ligase and another ligand for the target protein.8 For example, the dBET1 PROTAC (3, 785 Da) uses thalidomide (4) as the high-affinity ligand for cereblon and (+)-JQ1 (5) as the high-affinity ligand for bromodomain-containing protein 4 (BRD4), which are joined by an oxyacetamidealkyl linker. The molecular weights of PROTACs are relatively high (> 500 Da) due to their bivalent nature. For both cereblon-associated molecular glues and PROTACs, high-affinity ligands are essential for their activities, and highly sensitive assays for characterizing such ligands are critical.
Several high-throughput binding assays characterizing the binding affinities of cereblon ligands are reported. By taking advantage of three invariant tryptophan residues in the thalidomide (4)-binding pocket in cereblon,9 Boichenko et al. developed a fluorescence resonance energy transfer (FRET) assay with MANT-uracil (6) as a fluorescent probe to identify and characterize cereblon ligands, such as thalidomide (4). In another study, Cy5-conjugated thalidomide (7) was employed in a fluorescence polarization (FP) assay to characterize thalidomide (4), lenalidomide (1), and pomalidomide (8) for their binding affinities to human cereblon.10 A time-resolved (TR)-FRET binding assay was also developed to characterize a panel of cereblon ligands, including lenalidomide (1) and pomalidomide (8), with a Cy5-conjugated cereblon modulator (compound 7) (9) as a fluorescent probe.11 In addition, a thermal shift assay that does not require a target protein–specific probe was developed to characterize ligands, such as lenalidomide (1), thalidomide (4), and pomalidomide (8), for their cereblon binding affinities.12 However, these reported assays have low assay sensitivities. These reported fluorescence-based assays (i.e., tryptophan-based FRET, FP, and TR-FRET) used relatively high cereblon protein and probe concentrations, rendering their sensitivities low. Among them, the most sensitive assay was the FP assay, which employed 20 nM of Cy5-conjugated thalidomide (7) and 100 nM of human damage-specific DNA-binding protein 1 (DDB1)–CRBN protein and generated half maximal inhibitory concentration (IC50) values of 404.6 nM, 296.9 nM, and 264.8 nM for thalidomide (4), lenalidomide (1), and pomalidomide (8), respectively.10 The thermal shift assay used 2 μg/reaction of cereblon protein, and the respective IC50 values for thalidomide (4), lenalidomide (1), and pomalidomide (8) were 30 μM, 3 μM, and 3 μM.
Here we report the development of BODIPY FL Thalidomide (10) as a high-affinity (Kd of 3.6 nM) fluorescent probe for the human cereblon protein. High-affinity probe-based assays enable the characterization of ligands with a wide range of binding activities.13 We then developed a cereblon TR-FRET binding assay with very low concentrations of probe (4 nM BODIPY FL Thalidomide), 6×polyhistidine-tagged human cereblon protein (His-cereblon, 2 nM), and terbium-labelled anti-His tag (Tb-anti-His, 2 nM). Therefore, the assay is highly sensitive for detecting cereblon ligands and more sensitive than the previously reported cereblon binding assays. This new cereblon TR-FRET binding assay is also highly selective and only detects binding of cereblon ligands such as lenalidomide (1), CC-885 (2), thalidomide (4), pomalidomide (8), and not of ligands of other proteins such as the potent BRD ligand (+)-JQ1 (5), potent VHL ligand VH-208 (11), or dual potent BRD and VHL ligand MZ1 (12) (Figure 1). The assay is suitable for high throughput screening of large compound libraries.
Figure 1.

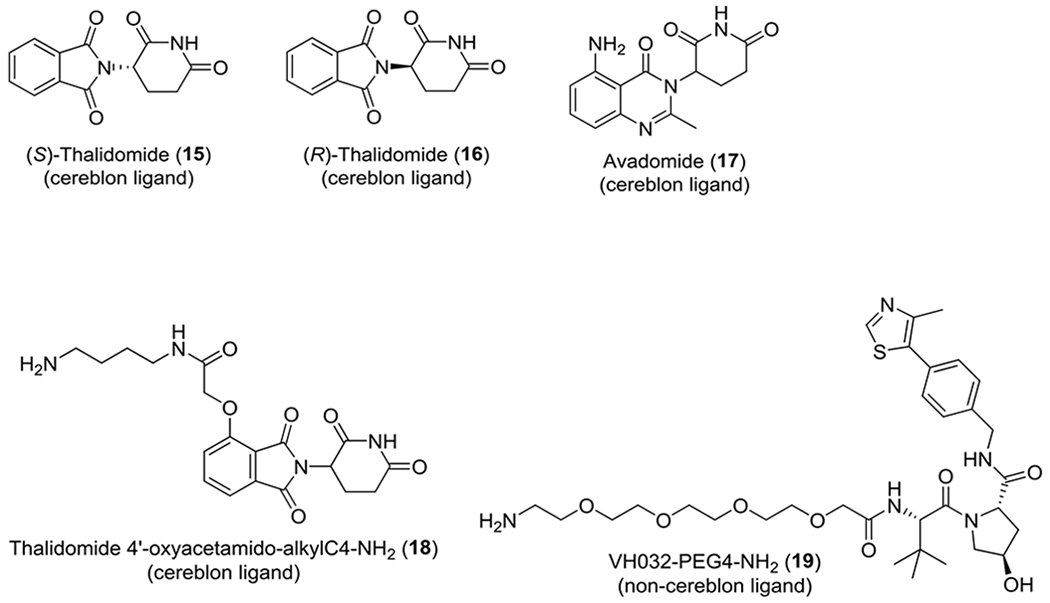
Structures of a panel of human cereblon ligands and non-cereblon ligands.
RESULTS AND DISCUSSION
Design of BODIPY FL Thalidomide (10).
The dBET1 PROTAC (3) is a bivalent BRD–CRBN PROTAC that effectively brings the BRD and cereblon proteins together.8 Cy5-conjugated thalidomide (7) is a cereblon fluorescent probe with a dissociation constant (Kd) value of 121.6 nM.10 Both dBET1 (3) and Cy5-conjugated thalidomide (7) use the same linker, oxyacetamide-alkylC4 (Scheme 1, highlighted in red), to join the thalidomide moiety with (+)-JQ1 in dBET1 (3) or Cy5 in Cy5-conjugated thalidomide (7). In dBET1, the oxyacetamide-alkylC4 linker is optimal because shorter or longer linkers may not exhibit similar efficacy for cooperative binding between BRD and cereblon. Cy5-conjugated thalidomide (7) has a Kd value of 121.6 nM for the cereblon protein,10 which may be improved by increasing the linker length, although the Cy5 side chain may serve as a part of the linker. A shorter linker is not desirable because it may cause the fluorescent moiety to interfere with the cereblon protein and decrease probe efficiency. We therefore increased the linker length by using oxyacetamide-alkylC8 to design BODIPY FL Thalidomide (10) because oxyacetamide-alkylC8 has four more methylene group than does oxyacetamide-alkylC4 (Scheme 1, highlighted in red). We selected BODIPY FL because of its extraordinary brightness, stability, and light and pH insensitivity.14 We found that BODIPY FL Thalidomide (10) had a Kd value of 3.6 nM for binding the human cereblon protein in a TR-FRET binding assay, confirming the effectiveness of our strategy of increasing the linker length to improve the binding affinity of the probe to the cereblon protein.
Scheme 1.
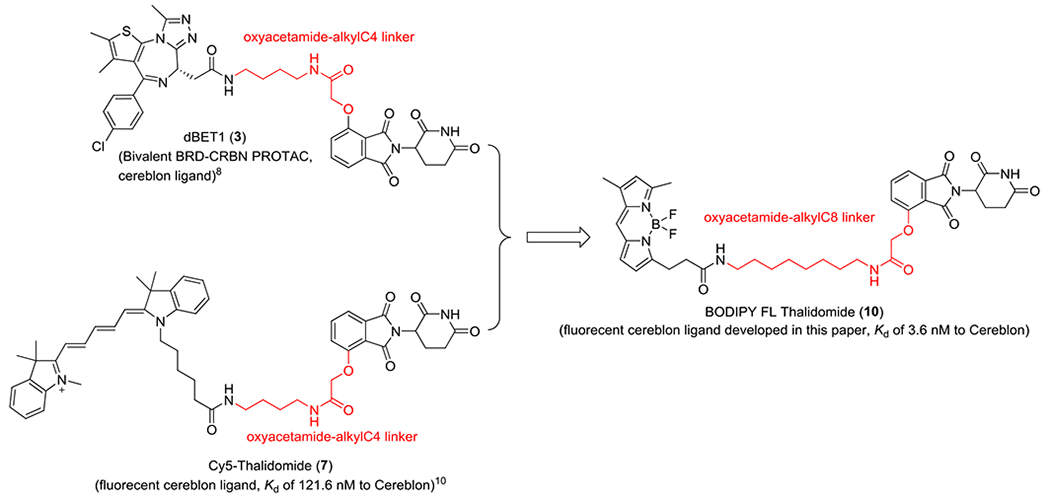
Design strategy of BODIPY FL Thalidomide (10)
Synthesis of BODIPY FL Thalidomide (10).
To prepare BODIPY FL Thalidomide (10) (Scheme 2), thalidomide-O-amido-C8-NH2 trifluoroacetic acid salt (13) was reacted with BODIPY FL propionic acid (14) under room temperature for 30 min in the presence of hexafluorophosphate benzotriazole tetramethyl uronium, N,N-diisopropyl ethylamine, and N,N-dimethylformamide (as a solvent),15, 16 and the product was formed with a yield of 57.8% after purification using a preparative HPLC system.
Scheme 2.

Synthesis of BODIPY FL Thalidomide (10)
BODIPY FL Thalidomide (10) Binds to Human Cereblon with High Affinity.
We evaluated the binding affinity of BODIPY FL Thalidomide (10) to the human cereblon protein in a TR-FRET assay. Dilutions of BODIPY FL Thalidomide (10) (1-to-2 serial dilutions, with an optimized concentration range of 0.122–500 nM) in the presence of 2 nM Tb-anti-His, along with the following reagent groups: (1) 2 nM His-cereblon (i.e., no competitive test compound), (2) without His-cereblon (i.e., no protein), (3) 2 nM His-cereblon and lenalidomide (1, 20 μM), or (4) 2 nM His-cereblon and thalidomide (4, 20 μM).
We first monitored the TR-FRET signals for reagent groups (1) and (2) at the incubation time points of 30, 60, 90, 120, 180, 240, and 300 min and fit them into a one-site total binding equation with GraphPad PRISM software (Figure 2A). The binding disassociation constant (Kd) values were derived from group (1) (Figure 2A, top curves). Group (2) revealed the background assay signals from BODIPY FL Thalidomide (10) at various concentrations and 2 nM Tb-anti-His (Figure 2A, bottom curves), which increased when the BODIPY FL Thalidomide (10) concentration increased in a linear manner. In contrast, group (1) exhibited additional and His-cereblon–mediated specific interactions with BODIPY FL Thalidomide (10). This interaction increased exponentially at lower BODIPY FL Thalidomide (10) concentrations, in which the specific interaction was the major overall signal contributor, and then primarily increased in a linear manner at higher concentrations, in which both cereblon-mediated (specific) and background (non-specific) interactions contributed to the overall signal. In the TR-FRET assay, BODIPY FL Thalidomide (10) showed very consistent high affinity to His-cereblon, with corresponding Kd values of 3.0, 3.4, 3.6, 3.6, 3.7, 3.7, and 4.2 nM at incubation time points of 30, 60, 90, 120, 180, 240, and 300 min, respectively. The affinity signals were very stable from incubation times of 90 to 240 min.
Figure 2.


Binding interaction of BODIPY FL Thalidomide (10) with His-cereblon. (A) Binding interaction of the indicated concentrations of BODIPY FL Thalidomide (10) to 2 nM Tb-anti-His with 2 nM His-cereblon or with 2 nM Tb-anti-His without 2 nM His-cereblon at the indicated incubation times. The TR-FRET signals were expressed as relative TR-FRET units, calculated with the formula 10,000 × 520nm/490nm. (B) Binding interactions of the indicated concentrations of BODIPY FL Thalidomide (10) to 2 nM Tb-anti-His with 2 nM His-cereblon, 2 nM His-cereblon + lenalidomide (1, 20 μM), 2 nM His-cereblon + thalidomide (4, 20 μM), or without His-cereblon after a 90-min incubation time. (C) Signal fold changes of 2 nM His-cereblon to 2 nM His-cereblon + lenalidomide (1, 20 μM), 2 nM His-cereblon + thalidomide (4, 20 μM), or without His-cereblon after a 90-min incubation time.
We then focused on the 90-min incubation time and included reagent groups (3) and (4). We plotted these data with GraphPad PRISM software by using the one-site total binding equation (Figure 2B). Lenalidomide (1) and thalidomide (4) are two known high-affinity cereblon ligands,10 and they completely inhibited the binding of BODIPY FL Thalidomide (10) to cereblon at 20 μM, which overlapped with the background curve from group (2) (i.e., absence of His-cereblon). The differences between the total interaction curve from group (1) (Figure 2B, top blue curve) and the background curve from group (2) (Figure 2B, bottom red curve), the maximally inhibited curve 1 from group (3) (Figure 2B, bottom green curve), or the maximally inhibited curve 2 from group (4) (Figure 2B, bottom purple curve) represent the His-cereblon–mediated specific interaction with BODIPY FL Thalidomide (10).
To determine the competitive binding activity of putative cereblon ligands in the TR-FRET assay, achieving an optimal concentration of the BODIPY FL Thalidomide (10) probe is critical. The probe concentration should approximate its Kd concentration to reliably determine the inhibition constant (Ki) values of the putative cereblon ligands with the Cheng–Prusoff equation.17 To ensure the highest possible assay sensitivity, we did not use the probe’s Kd concentration in the assay. Instead, we experimentally determined the optimal BODIPY FL Thalidomide (10) concentration by calculating the signal fold change (i.e., total signal/background signal) at all BODIPY FL Thalidomide (10) concentrations tested. We divided the total interaction signal for each concentration tested (Figure 2B, blue curve) by either the compound-inhibited signal (Figure 2B, green and purple curves) or the background signal (Figure 2B, red curve) and plotted the resultant ratios (Figure 2C). These calculations demonstrated that 3.9 nM BODIPY FL Thalidomide (10) generated the highest signal fold changes: 9.0-, 9.2-, and 9.2-fold for His-cereblon/His-cereblon + lenalidomide (1, 20 μM), His-cereblon/His-cereblon + thalidomide (4, 20 μM), and His-cereblon/without His-cereblon, respectively (Figure 2C). Therefore, the experimentally determined BODIPY FL Thalidomide (10) concentration (3.9 nM) that generated the highest signal fold change was very similar to its Kd concentration (3.6 nM).
The Signal from BODIPY FL Thalidomide (10)-Mediated Cereblon TR-FRET Binding Assay Is Stable.
Signal stability throughout the assay incubation time is a very important assay parameter. In the binding affinity test, we found that the interaction between BODIPY FL Thalidomide (10) and His-cereblon are very stable from 90 to 240 min (Figure 2A). We further evaluated the signal stability of the assay (with 4 nM BODIPY FL Thalidomide (10), 2 nM His-cereblon, and 2 nM Tb-anti-His in the presence of either dimethyl sulfoxide (DMSO), thalidomide (4, 3 μM or 10 μM), or serial dilutions of thalidomide (4) (1-to-3 dilutions, with an optimized concentration range of 0.0169 nM to 3 μM). The DMSO group served as the negative control. We used the thalidomide (4) groups (3 μM, 10 μM, or dilutions) to determine the thalidomide concentration that completely inhibited the assay signal, which we then used as a positive control for future experiments, and to evaluate the signal stability when the assay signal was partially inhibited. As shown in Figure 2B, 20 μM of thalidomide (4) completely inhibited the specific interaction between BODIPY FL Thalidomide (10) and His-cereblon. In addition, a group of samples with DMSO, 4 nM BODIPY FL Thalidomide (10), 2 nM Tb-anti-His but without His-cereblon protein was included to determine the achievable lowest signal (i.e., background signal). The TR-FRET signals were collected after incubation time points of 30, 60, 90, 120, 180, 240, and 300 min.
Figure 3A summarizes the TR-FRET signals from the test groups of DMSO and thalidomide (4, 3 μM or 10 μM), as well as the background group (i.e., with DMSO but without His-cereblon). The relative assay signals, expressed as relative TR-FRET units (RTUs), from the DMSO negative control group were 1373, 1497, 1574, 1551, 1523, 1510, and 1476 for the 30-, 60-, 90-, 120-, 180-, 240-, and 300-min incubation times, respectively. The signals were very stable from 90 to 240 min, with little fluctuation. The signals from the thalidomide (4, 3 μM and 10 μM) groups and the background group (DMSO without His-cereblon) remained very low and stable (all were approximately 190 RTU) from 30 to 300 min. The thalidomide (4, 3 μM and 10 μM) signals were similar to those of the background group (DMSO without His-cereblon) during the entire tested time period and those of the thalidomide (4, 20 μM) group (Figure 2A), clearly indicating that 3 μM thalidomide (4) is sufficient to completely inhibit the assay signal and achieve the lowest possible background signal. We then used 3 μM thalidomide (4) as a positive control (100% inhibition) for the assay.
Figure 3.

Signal stability test of BODIPY FL Thalidomide (10)-mediated cereblon TR-FRET binding assay. (A) Complete TR-FRET assay: 4 nM BODIPY FL Thalidomide (10) with 2 nM His-cereblon and 2 nM Tb-anti-His in the presence of DMSO or thalidomide (4, 3 μM or 10 μM) or 4 nM BODIPY FL Thalidomide (10) with 2 nM Tb-anti-His in the presence of DMSO but without His-cereblon (as background control) at the indicated incubation times. (B) Dose-response curves of thalidomide (4, 1-to-3 dilutions, with an optimized concentration range of 0.0169 nM to 3 μM) at the indicated incubation times.
In a dose-response test of thalidomide (4, 1-to-3 dilutions, with an optimized concentration range of 0.0169 nM to 3 μM) (Figure 3B), the IC50 values of thalidomide (4) were 17.4, 22.1, 22.3, 22.4, 22.9, 24.2, and 27.2 nM for the corresponding 30-, 60-, 90-, 120-, 180-, 240-, and 300-min incubation times, respectively. The TR-FRET signals at various concentrations and the derived IC50 values were very stable from 60 to 300 min. These additional data confirmed that the 90-min incubation time is appropriate for the assay, which yields a stable signal within a relatively short incubation time. Therefore, we used the following assay conditions in our ongoing experiments: 4 nM BODIPY FL Thalidomide (10), 2 nM Tb-anti-His, 2 nM His-cereblon, and a 90-min incubation time.
The BODIPY FL Thalidomide (10)-Mediated Cereblon TR-FRET Binding Assay Selectively Detects the Inhibitory Activities of Cereblon Ligands.
By using the assay condition we established for the cereblon TR-FRET binding assay, we tested a panel of compounds that included both cereblon ligands and non-ligands to evaluate the specificity of the assay. Lenalidomide (1), CC-885 (2), thalidomide (4), pomalidomide (8), (S)-thalidomide (15), (R)-thalidomide (16), and avadomide (17) are reported cereblon ligands,7, 10, 11, 18, 19 and their respective cereblon binding inhibitory IC50 values were 8.9, 0.43, 22.4, 6.4, 11.0, 200.4, and 44.4 nM (Figure 4A). CC-885 (2) exhibited the highest cereblon binding affinity, with an IC50 value of 0.43 nM and a Ki value of 0.20 nM. However, no comparable cereblon-binding IC50 values for CC-885 are reported.
Figure 4.

Dose-response curves of a panel of cereblon ligands and non-ligands (1-to-3 dilutions, with an optimized concentration range of 0.0169 nM to 3 μM) in the BODIPY FL Thalidomide (10)-mediated cereblon TR-FRET binding assay. (A) Dose-response curves of the cereblon ligands lenalidomide (1), CC-885 (2), thalidomide (4), pomalidomide (8), (S)-thalidomide (15), (R)-thalidomide (16), and avadomide (17) in the cereblon TR-FRET binding assay. (B) Dose-response curves of dBET1 (3), thalidomide (4), (+)-JQ1 (5), VH298 (11), MZ1 (12), thalidomide 4’-oxyacetamido-alkylC4-NH2 (18), and VH032-PEG4-NH2 (19) in the cereblon TR-FRET binding assay.
Comparable binding activities for lenalidomide (1), thalidomide (4), and pomalidomide (8) are available from previously reported studies.10, 11 The binding activities of lenalidomide (1), thalidomide (4), and pomalidomide (8) in the BODIPY FL Thalidomide (10)-mediated cereblon TR-FRET binding assay and those previously reported are listed in Table 1. In the cereblon TR-FRET binding assay, lenalidomide (1), thalidomide (4), and pomalidomide (8) exhibited IC50 values of 8.9, 22.4, and 6.4 nM, respectively, and Ki values of 4.2, 10.6, and 3.0 nM, respectively. In a previously reported FP assay with Cy5-conjugated thalidomide (7) as the fluorescent probe, lenalidomide (1), thalidomide (4), and pomalidomide (8) exhibited IC50 values of 296.9, 404.6, and 264.8 nM, respectively, and Ki values of 177.8, 249.2, and 156.6 nM, respectively.10 In a reported Cy5-conjugated cereblon modulator (compound 7) (9)-mediated TR-FRET assay, the respective IC50 values for lenalidomide (1) and pomalidomide (8) were 1.5 and 1.2 μM.11 Thalidomide (4) was not tested in this study, and no Ki values were reported. Although the binding activities varied among the three relevant assays, the compound activities followed the same rank order: pomalidomide (8) had the highest affinity for cereblon, followed by lenalidomide (1) and thalidomide (4). Our cereblon TR-FRET binding assay was the most sensitive assay among the three, and was over 41- and 187-fold more sensitive than the Cy5-conjugated thalidomide (7)-mediated FP assay and the Cy5-conjugated cereblon modulator (compound 7) (9)-mediated TR-FRET assay, respectively. This increased sensitivity was based on the IC50 value fold differences of pomalidomide (8). The higher assay sensitivity most likely resulted from the high probe affinity to the cereblon protein, which allowed the assay to be formulated with lower concentrations of reagents. We optimized our assay with 4 nM BODIPY FL Thalidomide (10), 2 nM Tb-anti-His, and 2 nM His-cereblon. In contrast, 20 nM Cy5-conjugated thalidomide (7) and 100 nM human DDB1-hsCRBN were used in the Cy5-conjugated thalidomide (7)-mediated FP assay.10 Moreover, 30 nM Cy5-conjugated cereblon modulator (compound 7) (9), 60 nM 6×His-tagged CRBN-DDB1, and 3 nM Europium-labelled anti-His were used in the Cy5-conjugated cereblon modulator (compound 7) (9)-mediated TR-FRET assay.11
Table 1.
Comparison of the binding affinities of the cereblon ligands lenalidomide (1), thalidomide (4), and pomalidomide (8)
| Assay condition | Lenalidomide (1) |
Thalidomide (4) |
Pomalidomide (8) |
|||
|---|---|---|---|---|---|---|
| IC50 | Ki | IC50 | Ki | IC50 | Ki | |
| TR-FRET assay with BODIPY FL Thalidomide (10) | 8.9 nM | 4.2 nM | 22.4 nM | 10.6 nM | 6.4 nM | 3.0 nM |
| FP assay with Cy5-conjugated thalidomide (7)10 | 296.9 nM | 177.8 nM | 404.6 nM | 249.2 nM | 264.8 nM > 41- foldb |
156.6 nM |
| TR-FRET assay with Cy5-conjugated cereblon modulator (compound 7) (9)11 | 1.5 μM | NAa | NA | NA | 1.2 μM >187-foldb |
NA |
NA: not available.
Fold change sensitivity was calculated by dividing the IC50 value from the previously reported assay by the IC50 value of 6.4 nM obtained from the BODIPY FL Thalidomide (10)-mediated TR-FRET binding assay.
Cereblon reportedly binds the (S)-enantiomers of the phthalimide class of molecules, including thalidomide (4), more strongly than their corresponding (R)-enantiomers.10 The (S)-enantiomers also reportedly bind to cereblon 10-fold tighter than do their corresponding (R)-enantiomers.18 In our cereblon TR-FRET binding assay, (S)-thalidomide (15) exhibited an IC50 value of 11.0 nM, whereas (R)-thalidomide (16) exhibited an IC50 value of 200.4 nM, indicating that (S)-thalidomide (15) binds to cereblon approximately 18-fold tighter than does (R)-thalidomide (16). In addition, (S)-thalidomide (15) or (R)-thalidomide (16) can enantiomerize in solution.20 Avadomide is another reported cereblon ligand19 that exhibited an IC50 value of 44.4 nM in our cereblon TR-FRET binding assay, although comparable IC50 values are not reported.
To evaluate the specificity of the assay, we tested two PROTAC molecules, along with their components in our cereblon TR-FRET binding assay. We first tested the BRD–CRBN PROTAC molecule dBET1 (3) and its components (+)-JQ1 (5, a BRD ligand) and thalidomide 4’-oxyacetamido-alkylC4-NH2 (18, a cereblon ligand).8 The second PROTAC molecule and its components included the BRD–VHL PROTAC molecule MZ1 (12) and its components (+)-JQ1 (5, a BRD ligand) and VH032-PEG4-NH2 (19, a VHL ligand).21 The (+)-JQ1 (5) moiety is common in dBET1 (3) and MZ1 (12). In addition, we also included the VHL ligand VH298 (11), which as the highest reported affinity, for comparison.22 The results of these compounds, together with thalidomide, are shown in Figure 4B. As expected, MZ1 (12), which has no binding moiety for cereblon; (+)-JQ1 (5); VH298 (11); and VH032-PEG4-NH2 (19) were all inactive at all concentrations tested, clearly illustrating the specificity of the BODIPY FL Thalidomide (10)-mediated cereblon TR-FRET binding assay. In contrast, thalidomide (4), which served as a positive control, had a cereblon-binding IC50 value of 22.4 nM. Thalidomide 4’-oxyacetamido-alkylC4-NH2 (18) is the cereblon ligand moiety located within dBET1 (3), with a cereblon-binding IC50 value of 12.6 nM. The BRD–CRBN PROTAC dBET1 (3) had a cereblon-binding IC50 value of 2.0 nM. Thalidomide 4’-oxyacetamido-alkylC4-NH2 (18, IC50: 12.6 nM) has an oxyacetamido-alkylC4-amine side chain at the 4′-position of thalidomide (4, IC50: 22.4 nM). Moreover, dBET1 (3, IC50: 2.0 nM) has a (+)-JQ1 moiety attached to the terminal amine group in thalidomide 4’-oxyacetamido-alkylC4-NH2 (18), further improving its binding affinity to cereblon. Therefore, incorporating an appropriate side chain at the 4′-position of thalidomide (4) apparently increases the cereblon binding affinity of the compound.
We used a racemic mixture of thalidomide (4) in our studies, including for preparation of BODIPY FL Thalidomide (10), which contained an approximately equal amount of (S)-thalidomide (15) and (R)-thalidomide (16). Cereblon preferentially binds (S)-thalidomide, and we found that thalidomide (4), (S)-thalidomide (15), and (R)-thalidomide (16) exhibited IC50 values of 22.4, 11.0, and 200.4 nM, respectively (Figure 4A). Indeed, (S)-thalidomide (15) bound to the cereblon protein approximately 18-fold tighter than did (R)-thalidomide (16), according to their IC50 values. The racemic mixture of thalidomide (4) had an IC50 value approximately 2-fold of that of (S)-thalidomide (15), reflecting the different binding affinities of (S)-thalidomide (15) and (R)-thalidomide (16) within the racemic thalidomide (4) mixture.
Both (S)-thalidomide (15) and (R)-thalidomide (16) can spontaneously isomerize or racemize in solution in a time-dependent manner.20, 23 Upon equilibrium, a racemic mixture of thalidomide (4) will contain an equal amount of (S)-thalidomide (15) and (R)-thalidomide (16) (Figure 5A). To investigate whether the cereblon TR-FRET binding assay can detect the conversion between (S)-thalidomide (15) and (R)-thalidomide (16), we tested the binding activities of thalidomide (4) (Figure 5B), (S)-thalidomide (15) (Figure 5C), and (R)-thalidomide (16) (Figure 5D) with serial dilutions (1-to-3 dilutions, with an optimized concentration range of 0.0169 nM to 3 μM) after incubation times of 30, 60, 90, 120, 180, 240, and 300 min. Thalidomide (4) exhibited IC50 values of 17.4, 22.1, 22.3, 22.4, 22.9, 26.2, and 27.2 nM after incubation times of 30, 60, 90, 120, 180, 240, and 300 min, respectively. In contrast, (S)-thalidomide (15) exhibited IC50 values of 9.6, 9.8, 11.1, 13.1, 14.4, 14.5, and 16.9 nM after incubation times of 30, 60, 90, 120, 180, 240, and 300 min, respectively; and (R)-thalidomide (16) exhibited IC50 values of 394.0, 282.2, 200.3, 187.8, 152.8, 126.3, and 124.5 nM after incubation times of 30, 60, 90, 120, 180, 240, and 300 min, respectively (Table 2). The IC50 values of thalidomide (4) were stable between 22 and 23 nM during incubation times of 60 to 180 min, indicating that the assay was very stable. The IC50 values of the more active (S)-thalidomide (15) increased from 9.8 to 14.4 nM during the same incubation times of 60 to 180 min, suggesting that a small fraction of (S)-thalidomide (15) spontaneously converted into the less active (R)-thalidomide (16). In contrast, the IC50 values of (R)-thalidomide (16) decreased from 282.2 to 152.8 nM during the incubation times of 60 to 180 min, indicating that a small fraction of the (R)-thalidomide (16) was converted to (S)-thalidomide (15). The time-dependent activity patterns of thalidomide (4, remained unchanged over time), (S)-thalidomide (15, increased IC50 values over time), and (R)-thalidomide (16, decreased IC50 values over time) illustrated that the BODIPY FL Thalidomide (10)-mediated cereblon TR-FRET binding assay can detect the in-solution conversion between (S)-thalidomide (15) and (R)-thalidomide (16).
Figure 5.

Time-dependent dose-response curve comparison of thalidomide (4), (S)-thalidomide (15), and (R)-thalidomide (16) (all 1-to-3 dilutions, with an optimized concentration range of 0.0169 nM to 3 μM) in the BODIPY FL Thalidomide (10)-mediated cereblon TR-FRET binding assay. (A) Time-dependent dose-response curves of thalidomide (4). (A) Proposed isomerization of (S)-thalidomide (15) to (R,S)-thalidomide (4) and (R)-thalidomide (16) to (R, S)-thalidomide (4). (B) Time-dependent dose-response curves of (S)-thalidomide (15). (C) Time-dependent dose-response curves of (R)-thalidomide (16).
Table 2.
Time-dependent binding activity of thalidomide (4), (S)-thalidomide (15), and (R)-thalidomide (16)
| Incubation time (min) | Thalidomide (4) IC50 (nM) | (S)-thalidomide (15) IC50 (nM) | (R)-thalidomide (16) IC50 (nM) |
|---|---|---|---|
| 30 | 17.4 | 9.6 | 394.0 |
| 60 | 22.1 | 9.8 | 282.2 |
| 90 | 22.3 | 11.1 | 200.3 |
| 120 | 22.4 | 13.1 | 187.8 |
| 180 | 22.9 | 14.4 | 152.8 |
| 240 | 26.2 | 14.5 | 126.3 |
| 300 | 27.2 | 16.9 | 124.5 |
Evaluation of DMSO Tolerance in the BODIPY FL Thalidomide (10)-Mediated Cereblon TR-FRET Binding Assay.
DMSO is a solvent commonly used to prepare stock solutions of compounds, including all of the compounds used in this study. However, DMSO concentrations greater than 5% can negatively affect the performance of TR-FRET assays, although minimal effects occur when DMSO concentrations are low.24–26 We evaluated the effect of DMSO on the cereblon TR-FRET binding assay by testing different concentrations of DMSO, thalidomide (4, 3 μM), or serial dilutions of thalidomide (4, 1-to-3 dilutions, with an optimized concentration range of 0.0169 nM to 3 μM) in the presence of 0.2%, 0.5%, 1%, 2%, 5%, or 10% DMSO. We recorded the TR-FRET signals after a 90-min incubation time, and the TR-FRET signals were 1575, 1465, 1343, 1065, 608, and 299 RTU at corresponding DMSO concentrations of 0.2%, 0.5%, 1%, 2%, 5% and 10% (Figure 6A), clearly indicating that increasing DMSO concentrations negatively affected the TR-FRET signals. The signal reduction was less substantial (14.7% signal reduction) when the DMSO concentration increased from 0.2% to 1%, more substantial when the DMSO concentration further increased to 2% (32.4% signal reduction), 5% (61.4% signal reduction), or 10% (81.0% signal reduction). As expected, minimal signal change or reduction of the positive control group [i.e., the thalidomide (4, 3 μM) group] occurred because the signals reflected the background of the assay (i.e., remained stable at 190 RTU, although the DMSO concentrations increased from 0.2% to 10%). For the dose-response performance of thalidomide (4) (Figure 6B), the TR-FRET signal was similarly reduced for all thalidomide (4) concentrations tested when the DMSO concentration increased from 0.2% to 10%. The corresponding observed IC50 values of thalidomide (4) were 22.1, 25.6, 26.6, 32.7, 56.4, and 118.0 nM when the DMSO concentrations were 0.2%, 0.5%, 1%, 2%, 5%, and 10%, respectively. Although higher DMSO concentrations, such as 2%, 5%, or 10%, substantially increased the IC50 values, the IC50 value change (i.e., 22.1 nM to 26.6 nM) was less substantial when the DMSO concentration was changed from 0.2% to 1%. These results indicate that DMSO negatively affects the performance of the cereblon TR-FRET binding assay, particularly when the DMSO concentrations were equal or higher than 2%. Therefore, minimizing the DMSO concentration in the assay and maintaining the same DMSO concentration in all of the relevant test samples is important. To this end, we used a final DMSO concentration of 0.2% for all experiments in this study, with 0.1% DMSO contributed from BODIPY FL Thalidomide (10) and 0.1% DMSO contributed from the test reagents to achieve the highest signal-to-noise window.
Figure 6.

Effect of DMSO concentrations on the BODIPY FL Thalidomide (10)-mediated cereblon TR-FRET binding assay. (A) Performance of the negative control (DMSO group) and positive control (thalidomide 4, 3 μM) in the cereblon TR-FRET binding assay in the presence of the indicated DMSO concentrations. (B) Dose-response curves of thalidomide (4, 1-to-3 dilutions, with an optimized concentration range of 0.0169 nM to 3 μM) in the presence of the indicated concentrations of DMSO.
In conclusion, we developed BODIPY FL Thalidomide (10) as a high-affinity cereblon fluorescent probe for the human cereblon protein with a Kd value of 3.6 nM. With this newly developed high-affinity probe, we further developed a sensitive cereblon TR-FRET binding assay that is 41- to 187-fold more sensitive than previously reported assays.10, 11 This increased assay sensitivity was most likely due to the high-affinity binding property of the probe to the cereblon protein, which allowed lower concentrations of reagents to be used in the assay. The assay is selective and specific because it detects only the binding of cereblon ligands. Our cereblon TR-FRET binding assay is also very stable and can detect activity changes of thalidomide (4) because of its spontaneous isomerization or racemization property. Similar to the effects of DMSO in other assays, DMSO negatively affected the cereblon TR-FRET binding assay, especially when DMSO concentrations were higher than 2%. Therefore, maintaining the same DMSO concentrations in all related test samples and minimizing DMSO concentrations whenever possible is important to improve assay sensitivity and the signal window.
While finalizing this manuscript, we noticed that an article describing the use of another cereblon TR-FRET binding assay (lenalidomide-BODYPY FL as the fluorescent probe, coupled with biotinylated DDB1ΔBCRBN and Terbium-Streptavidin) in identifying cereblon modulators was “just accepted”.27 However, detailed assay information, such as the probe’s binding affinity and ligands’ binding activities was not yet available.
EXPERIMENTAL PROCEDURES
Chemistry.
Thalidomide-O-amido-C8-NH2 trifluoroacetic acid salt was purchased from MedChemExpress LLC (Monmouth Junction, NJ). BODIPY FL propionic acid was purchased from BroadPharm (San Diego, CA). Hexafluorophosphate benzotriazole tetramethyl uronium; N,N-diisopropyl ethylamine; N,N-dimethylformamide; ethyl acetate (EtOAc); anhydrous sodium sulfate; and all other chemicals or solvents were purchased from Sigma-Aldrich (St. Louis, MO). Dimethyl sulfoxide-d6 (DMSO-d6) was purchased from Cambridge Isotope Laboratories, Inc. (Tewksbury, MA). Reported protocols25 were followed to monitor or determine reaction progress, product purity, and product identity; to record 1H and 13C NMR spectra; and to determine high-resolution mass spectra.
3-(5,5-difluoro-7,9-dimethyl-5H-5λ4,6λ4-dipyrrolo[1,2-c:2’,1’-f][1,3,2]diazaborinin-3-yl)-N-(8-(2-((2-(2,6-dioxopiperidin-3-yl)-1,3-dioxoisoindolin-4-yl)oxy)acetamido)octyl)propenamide (10, BODIPY FL Thalidomide).
At room temperature, BODIPY FL propionic acid (14, 29.3 mg, 100 μmol), hexafluorophosphate benzotriazole tetramethyl uranium (41.8 mg, 110 μmol), N,N-diisopropyl ethylamine (44 μL, 250 μmol), and thalidomide-O-amido-C8-NH2 trifluoroacetic acid salt (13, 70.1 mg, 100 μmol) were solubilized in 3 mL N,N-dimethylformamide. The reaction mixture was stirred for 30 min. UPLC-MS monitoring demonstrated that the BODIPY FL propionic acid (14) and thalidomide-O-amido-C8-NH2 (13) starting materials were depleted and that BODIPY FL Thalidomide (10) was formed. The reaction was quenched with the addition of H2O (10 mL) and stirred for an additional 10 min. The solvent in the reaction mixture was then removed under reduced pressure with an IKA RV 10 digital rotavapor (IKA Works, Inc., Wilmington, NC). The residue was partitioned between brine (50 mL) and EtOAc (30 mL). The EtOAc layer was separated, and the remaining brine solution was extracted with EtOAc (30 mL × 2). All EtOAc solutions were combined and dried with anhydrous sodium sulfate. The EtOAc was then removed with a rotavapor. The residue was solubilized in DMSO to 50 mg/mL and purified with an Acquity UPLC system (Waters Corporation, Milford, MA) equipped with an Acquity UPLC BEH C18 1.7 μm, 2.1 x 50 mm column to yield the BODIPY FL Thalidomide product (10, 42.4 mg, 57.8% yield and 99.0% purity). 1H NMR (500 MHz, DMSO-d6) δ 11.12 (s, 1H), 7.93 (t, J = 5.7 Hz, 1H), 7.87 (t, J = 5.6 Hz, 1H), 7.81 (t, J = 7.9 Hz, 1H), 7.68 (s, 1H), 7.49 (d, J = 7.2 Hz, 1H), 7.39 (d, J = 8.5 Hz, 1H), 7.08 (d, J = 4.0 Hz, 1H), 6.34 (d, J = 4.0 Hz, 1H), 6.29 (s, 1H), 5.12 (dd, J = 12.8, 5.5 Hz, 1H), 4.77 (s, 2H), 3.14 (q, J = 6.7 Hz, 2H), 3.10 – 3.01 (m, 4H), 2.96 – 2.85 (m, 1H), 2.63 – 2.51 (m, 2H), 2.49 – 2.43 (m, 5H), 2.25 (s, 3H), 2.06 – 2.00 (m, 1H), 1.47 – 1.33 (m, 4H), 1.29 – 1.18 (m, 8H). 13C NMR (126 MHz, DMSO-d6) δ 173.24, 171.02, 170.35, 167.21, 167.08, 165.98, 159.56, 158.39, 155.52, 144.52, 137.38, 134.89, 133.50, 133.43, 129.35, 125.80, 120.84, 120.71, 117.28, 117.04, 116.51, 68.10, 49.27, 38.97, 38.79, 34.22, 31.41, 29.56, 29.45, 29.18, 29.15, 26.84, 26.74, 24.52, 22.46, 14.97, 11.46. ESI-TOF HRMS m/z: [M + H]+ Calcd for C37H44BF2N6O7+ 733.3327; Found 733.3351.
Biology.
The 6×His-hCRBN–DDB1 plasmid and protein were custom prepared by GenScript USA, Inc. (Piscataway, NJ). Briefly, the 6×His-hCRBN-DDB1 plasmid encodes both the full-length human cereblon protein (NCBI accession number: NP_057386) and the full-length human DDB1 protein (NCBI accession number: NP_001914). The CRBN gene sequence encoding the full-length human cereblon protein was cloned into the pFastBac DUAL vector between the BamHI and PstI restriction sites with a 6×His tag at its N-terminal. The DNA sequence encoding the human DDB1 protein was cloned into the vector between Xhol and KpnI restriction sites. The DH10Bac strain was used for the recombinant bacmid generation. The positive recombinant bacmid containing the 6×His-hCRBN–DDB1 coding sequence was confirmed by PCR. The positive recombinant bacmid was then transfected into Sf9 cells to produce viral particles, which were used to transduce Sf9 cells to produce the 6×His-hCRBN–DDB1 protein complex (i.e., His-cereblon).
We purchased 1 M Tris (pH 7.5), 1 M 1,4-dithiothreitol, and Tb-anti-His antibody from Fisher Scientific (Pittsburgh, PA) and Triton X-100 and bovine serum albumin from Sigma-Aldrich (St. Louis, MO). Thalidomide, lenalidomide, dBET1, (+)-JQ1, and MZ1 were purchased from Cayman Chemical (Ann Arbor, Michigan). We purchased (S)-thalidomide and (R)-thalidomide rom Toronto Research Chemicals (North York, ON, Canada). Pomalidomide and avadomide were purchased from MedKoo Biosciences, Inc. (Morrisville, NC). CC-885 was purchased from Axon Medchem LLC (Reston, VA). VH032-PEG4-NH2 and VH-298 were purchased from MedChemExpress LLC (Monmouth Junction, NJ). Echo 384-well low dead volume plates were purchased from Labcyte Inc. (San Jose, CA). We purchased 384-well black, low-volume assay plates from Corning Incorporated Life Sciences (Tewksbury, MA).
The human cereblon TR-FRET binding assay buffer was freshly prepared each time before an experiment with stock solutions or components to achieve the following working concentration: 50 mM Tris pH 7.5, 0.1% Triton X-100, 0.01% bovine serum albumin, and 1 mM 1,4-dithiothreitol. We performed the cereblon TR-FRET binding assay as previously described,25 except that we used His-cereblon, Tb-anti-His antibody, and BODIPY FL Thalidomide (10) as the fluorescent probe. All assays were performed at room temperature (~ 25°C). The final assay volume was 20 μL/well, and the final DMSO concentration was 0.2%, except for the concentrations defined in the DMSO tolerance test. Generally, 0.1% DMSO was contributed by the BODIPY FL Thalidomide (10) stock, and 0.1% DMSO was contributed by the test reagents. If no reagents were tested in a given experiment, 0.1% DMSO was included as a vehicle control. All assays were independently performed three times, with quadruplicate sample replicates.
All reagents, including BODIPY FL Thalidomide (10) were solubilized in DMSO as 1,000× stock solutions, and the stock solutions or 0.1% DMSO vehicle controls were added to Echo 384-well low dead volume plates. For the serial dilution experiments, dilutions were prepared in the plates, with DMSO as the solvent for 1,000× stock solutions. An Echo 555 Acoustic Liquid Handler (Labcyte Inc., San Jose, CA) was then used28 to dispense 20 nL/well of DMSO or stock solutions to achieve a final volume of 20 μL/well.
Determination of BODIPY FL Thalidomide (10) Binding Kd to Human Cereblon Protein in a TR-FRET Assay.
In 384-well black assay plates, dilutions of BODIPY FL Thalidomide (10, 1-to-2 serial dilutions, with a concentrations range of 0.122 nM to 500 nM) was incubated with 2 nM Tb-anti-His and 2 nM His-cereblon, with or without 20 μM lenalidomide (1) or 20 μM thalidomide (4). In addition, a group of wells with dilutions of BODIPY FL Thalidomide (10, 1-to-2 serial dilutions, with a concentration range of 0.122 nM to 500 nM) and 2 nM Tb-anti-His only (i.e., without His-cereblon) were included as a background control group. The plates were incubated in the dark, and the TR-FRET signals (10,000 × 520 nm/490 nm) in RTUs were recorded for each well at 30-, 60-, 90-, 120-, 180-, 240-, and 300-min incubation times with a PHERAstar FS plate reader (BMG Labtech; Durham, NC). The TR-FRET signals were fit into a one-site total binding equation with GraphPad Prism 8.4.3 software (GraphPad Software; San Diego, CA) to generate curves for each group. The respective Kd values were derived from the His-cereblon group.
Signal Stability Test.
Dilutions of thalidomide (4, 1-to-3 serial dilutions, with a concentration range of 0.0169 nM to 3 μM), DMSO, or thalidomide (4, 3 μM, or 10 μM) were incubated with 4 nM BODIPY FL Thalidomide (10), 2 nM Tb-anti-His, and 2 nM His-cereblon. In addition, a group of wells with DMSO, 4 nM BODIPY FL Thalidomide (10), and 2 nM Tb-anti-His (without His-cereblon) was included as a background signal control. The TR-FRET signal (10,000 × 520 nm/490 nm) for each well was recorded at 30-, 60-, 90-, 120-, 180-, 240-, and 300-min incubation times with a PHERAstar FS plate reader. The TR-FRET signals of the dilutions of thalidomide (4) were fit into a sigmoidal dose-response equation with GraphPad Prism 8.4.3 software, and the IC50 values for the corresponding dose-response curves were derived. The TR-FRET signals of the DMSO, thalidomide (4, 3 μM or 10 μM), and without His-cereblon groups or respective signal fold change to the thalidomide (4, 3 μM) group at various times were plotted with GraphPad Prism 8.4.3 software.
Binding/Inhibitory Activity Test of Selected Human Cereblon Ligands or Non-ligands.
Dilutions (1-to-3 serial dilutions, with a concentration range of 0.0169 nM to 3 μM) of lenalidomide (1), CC-885 (2), dBET1 (3), thalidomide (4), (+)-JQ1 (5), pomalidomide (8), VH-298 (11), MZ1 (12), (S)-thalidomide (15), (R)-thalidomide (16), avadomide (17), thalidomide-4′-oxyacetamide-alkylC4-NH2 (18), or VH032-PEG4-NH2 (19) were incubated with 4 nM BODIPY FL Thalidomide (10), 2 nM Tb-anti-His, and 2 nM His-cereblon. In addition, a group of wells with DMSO or thalidomide (4, 3 μM) in each assay plate was incubated with 4 nM BODIPY FL Thalidomide (10), 2 nM Tb-anti-His, and 2 nM His-cereblon to serve as a negative control (i.e., DMSO group) or positive control (i.e., 3 μM thalidomide group). The TR-FRET signals (10,000 × 520 nm/490 nm) produced by dilutions of lenalidomide (1), CC-885 (2), dBET1 (3), thalidomide (4), (+)-JQ1 (5), pomalidomide (8), VH-298 (11), MZ1 (12), avadomide (17), thalidomide-4′-oxyacetamide-alkylC4-NH2 (18), and VH032-PEG4-NH2 (19) were measured and calculated at a 90-min incubation time point. The TR-FRET signals of the dilutions of thalidomide (4) , (S)-thalidomide (15), (R)-thalidomide (16), and DMSO and thalidomide (4, 3 μM) were measured at after 30-, 60-, 90-, 120-, 180-, 240-, and 300-min incubation times. The TR-FRET signals for each well were normalized to that of the negative control (DMSO) and positive control (3 μM thalidomide) wells with Equation 1 to derive the percent inhibition (shown as %inhibition) of the corresponding test reagents at their respective concentrations.
| Equation 1 |
When applicable, the normalized percent inhibition values for each ligand at various concentrations were fit into a sigmoidal dose-response equation with GraphPad Prism 8.4.3 software to derive the IC50 values. The Ki values were then calculated with Equation 2 (i.e., Cheng–Prusoff equation).17
| Equation 2 |
In this equation, IC50 is the concentration of tested compound that inhibits 50% of BODIPY FL Thalidomide binding to His-cereblon, [L] is the BODIPY FL Thalidomide (10) concentration in the assay mixture (i.e., 4 nM), and KL is the Kd value of BODIPY FL Thalidomide (10) in the assay (i.e., 3.6 nM). The Ki values were used to compare the relative binding affinities of the test reagents to His-cereblon.
DMSO Tolerance Test.
Dilutions of thalidomide (4, 1-to-3 serial dilutions, with a concentration range of 0.0169 nM to 3 μM) and DMSO or 3 μM thalidomide (4, 3 μM), with or without additional DMSO were incubated with 4 nM BODIPY FL Thalidomide (10), 2 nM Tb-anti-His, and 2 nM His-cereblon. The final DMSO concentrations for all assay conditions were 0.2%, 0.5%, 1%, 2%, 5%, and 10%. The TR-FRET signals (10,000 × 520 nm/490 nm) for each well were determined at a 90-min incubation time with a PHERAstar FS plate reader. The TR-FRET signals of the DMSO and thalidomide (4, 3 μM) groups were plotted as bar graphs. The TR-FRET signals of the dilutions of thalidomide were fit into a sigmoidal dose-response equation with GraphPad Prism 8.4.3 software, and the IC50 values for the corresponding dose-response curves were derived.
Supplementary Material
ACKNOWLEDGEMENTS
Research reported in this publication was supported by the National Institute of General Medical Sciences of the National Institutes of Health under award number R35GM118041. The content is solely the responsibility of the authors and does not necessarily represent the official views of the National Institutes of Health. The authors thank ALSAC for support, Nisha Badders, PhD, ELS (St. Jude Department of Scientific Editing) for editing the manuscript, and other members of the Chen research laboratory for valuable discussions of the paper.
ABBREVIATIONS
- PROTACs
proteolysis-targeting chimeras
- IC50
half maximal inhibitory concentration
- TR-FRET
time-resolved fluorescence resonance energy transfer
- FP
fluorescence polarization
- BRD
bromodomain
- VHL
von Hippel–Lindau
- DDB1
damage-specific DNA binding protein 1
- CRBN
cereblon
- Kd
dissociation constant
- EtOAc
ethyl acetate
- Tb-anti-His
Terbium-labeled anti-His tag antibody
- His
6×polyhistidine tag
- DMSO
dimethyl sulfoxide
- Ki
inhibition constant
- RTU
relative TR-FRET units
Footnotes
CONFLICT OF INTEREST
The authors declare no competing interests.
SUPPORTING INFORMATION
The characterization of the BODIPY FL Thalidomide (10), including 1H NMR, 13C NMR, high-resolution mass spectra, sequences of the 6×His-hCRBN (6×His + linker + hCRBN, 455aa; hCRBN, NCBI accession number: NP_057386; 442aa), and DDB1 (NCBI accession number: NP_001914; 1140aa) are described in the supporting information.
REFERENCES
- (1).Liu J, Ma J, Liu Y, Xia J, Li Y, Wang ZP, and Wei W (2020) PROTACs: A novel strategy for cancer therapy. Semin Cancer Biol. S1044-579X(20)30039-0. doi: 10.1016/j.semcancer.2020.02.006. [DOI] [PubMed] [Google Scholar]
- (2).Silva MC, Ferguson FM, Cai Q, Donovan KA, Nandi G, Patnaik D, Zhang T, Huang HT, Lucente DE, Dickerson BC, et al. (2019) Targeted degradation of aberrant tau in frontotemporal dementia patient-derived neuronal cell models. Elife 8, e45457. [DOI] [PMC free article] [PubMed] [Google Scholar]
- (3).He Y, Zhang X, Chang J, Kim HN, Zhang P, Wang Y, Khan S, Liu X, Zhang X, Lv D, et al. (2020) Using proteolysis-targeting chimera technology to reduce navitoclax platelet toxicity and improve its senolytic activity. Nat Commun 11, 1996. [DOI] [PMC free article] [PubMed] [Google Scholar]
- (4).Gandhi AK, Kang J, Havens CG, Conklin T, Ning Y, Wu L, Ito T, Ando H, Waldman MF, Thakurta A, et al. (2014) Immunomodulatory agents lenalidomide and pomalidomide co-stimulate T cells by inducing degradation of T cell repressors Ikaros and Aiolos via modulation of the E3 ubiquitin ligase complex CRL4(CRBN.). Br J Haematol 164, 811–821. [DOI] [PMC free article] [PubMed] [Google Scholar]
- (5).Lu G, Middleton RE, Sun H, Naniong M, Ott CJ, Mitsiades CS, Wong KK, Bradner JE, and Kaelin WG Jr. (2014) The myeloma drug lenalidomide promotes the cereblon-dependent destruction of Ikaros proteins. Science 343, 305–309. [DOI] [PMC free article] [PubMed] [Google Scholar]
- (6).Krönke J, Udeshi ND, Narla A, Grauman P, Hurst SN, McConkey M, Svinkina T, Heckl D, Comer E, Li X, et al. (2014) Lenalidomide causes selective degradation of IKZF1 and IKZF3 in multiple myeloma cells. Science 343, 301–305. [DOI] [PMC free article] [PubMed] [Google Scholar]
- (7).Matyskiela ME, Lu G, Ito T, Pagarigan B, Lu CC, Miller K, Fang W, Wang NY, Nguyen D, Houston J, et al. (2016) A novel cereblon modulator recruits GSPT1 to the CRL4(CRBN) ubiquitin ligase. Nature 535, 252–257. [DOI] [PubMed] [Google Scholar]
- (8).Winter GE, Buckley DL, Paulk J, Roberts JM, Souza A, Dhe-Paganon S, and Bradner JE (2015) DRUG DEVELOPMENT. Phthalimide conjugation as a strategy for in vivo target protein degradation. Science 348, 1376–1381. [DOI] [PMC free article] [PubMed] [Google Scholar]
- (9).Boichenko I, Deiss S, Bär K, Hartmann MD, and Hernandez Alvarez B (2016) A FRET-Based Assay for the Identification and Characterization of Cereblon Ligands. J Med Chem 59, 770–774. [DOI] [PubMed] [Google Scholar]
- (10).Fischer ES, Böhm K, Lydeard JR, Yang H, Stadler MB, Cavadini S, Nagel J, Serluca F, Acker V, Lingaraju GM, et al. (2014) Structure of the DDB1-CRBN E3 ubiquitin ligase in complex with thalidomide. Nature 512, 49–53. [DOI] [PMC free article] [PubMed] [Google Scholar]
- (11).Matyskiela ME, Zhang W, Man HW, Muller G, Khambatta G, Baculi F, Hickman M, LeBrun L, Pagarigan B, Carmel G, et al. (2018) A Cereblon Modulator (CC-220) with Improved Degradation of Ikaros and Aiolos. J Med Chem 61, 535–542. [DOI] [PubMed] [Google Scholar]
- (12).Lopez-Girona A, Mendy D, Ito T, Miller K, Gandhi AK, Kang J, Karasawa S, Carmel G, Jackson P, Abbasian M, et al. (2012) Cereblon is a direct protein target for immunomodulatory and antiproliferative activities of lenalidomide and pomalidomide. Leukemia 26, 2326–2335. [DOI] [PMC free article] [PubMed] [Google Scholar]
- (13).Huang X (2003) Fluorescence polarization competition assay: the range of resolvable inhibitor potency is limited by the affinity of the fluorescent ligand. J Biomol Screen 8, 34–38. [DOI] [PubMed] [Google Scholar]
- (14).Karolin J, Johansson LBA, Strandberg L, and Ny T (1994) Fluorescence and Absorption Spectroscopic Properties of Dipyrrometheneboron Difluoride (BODIPY) Derivatives in Liquids, Lipid Membranes, and Proteins. Journal of the American Chemical Society 116, 7801–7806. [Google Scholar]
- (15).Dourtoglou V, Ziegler J-C, and Gross B (1978) L’hexafluorophosphate de O-benzotriazolyl-N,N-tetramethyluronium: Un reactif de couplage peptidique nouveau et efficace. Tetrahedron Letters 19, 1269–1272. [Google Scholar]
- (16).Liu J, Bruhn DF, Lee RB, Zheng Z, Janusic T, Scherbakov D, Scherman MS, Boshoff HI, Das S, Rakesh, et al. (2017) Structure-Activity Relationships of Spectinamide Antituberculosis Agents: A Dissection of Ribosomal Inhibition and Native Efflux Avoidance Contributions. ACS Infect Dis 3, 72–88. [DOI] [PMC free article] [PubMed] [Google Scholar]
- (17).Cheng Y, and Prusoff WH (1973) Relationship between the inhibition constant (K1) and the concentration of inhibitor which causes 50 per cent inhibition (I50) of an enzymatic reaction. Biochem Pharmacol 22, 3099–3108. [DOI] [PubMed] [Google Scholar]
- (18).Mori T, Ito T, Liu S, Ando H, Sakamoto S, Yamaguchi Y, Tokunaga E, Shibata N, Handa H, and Hakoshima T (2018) Structural basis of thalidomide enantiomer binding to cereblon. Sci Rep 8, 1294. [DOI] [PMC free article] [PubMed] [Google Scholar]
- (19).Hagner PR, Man HW, Fontanillo C, Wang M, Couto S, Breider M, Bjorklund C, Havens CG, Lu G, Rychak E, et al. (2015) CC-122, a pleiotropic pathway modifier, mimics an interferon response and has antitumor activity in DLBCL. Blood 126, 779–789. [DOI] [PMC free article] [PubMed] [Google Scholar]
- (20).Tian C, Xiu P, Meng Y, Zhao W, Wang Z, and Zhou R (2012) Enantiomerization mechanism of thalidomide and the role of water and hydroxide ions. Chemistry 18, 14305–14313. [DOI] [PubMed] [Google Scholar]
- (21).Zengerle M, Chan KH, and Ciulli A (2015) Selective Small Molecule Induced Degradation of the BET Bromodomain Protein BRD4. ACS Chem Biol 10, 1770–1777. [DOI] [PMC free article] [PubMed] [Google Scholar]
- (22).Frost J, Galdeano C, Soares P, Gadd MS, Grzes KM, Ellis L, Epemolu O, Shimamura S, Bantscheff M, Grandi P, et al. (2016) Potent and selective chemical probe of hypoxic signalling downstream of HIF-α hydroxylation via VHL inhibition. Nat Commun 7, 13312. [DOI] [PMC free article] [PubMed] [Google Scholar]
- (23).Wnendt S, Finkam M, Winter W, Ossig J, Raabe G, and Zwingenberger K (1996) Enantioselective inhibition of TNF-alpha release by thalidomide and thalidomide-analogues. Chirality 8, 390–396. [DOI] [PubMed] [Google Scholar]
- (24).Lin W, and Chen T (2018) Using TR-FRET to Investigate Protein-Protein Interactions: A Case Study of PXR-Coregulator Interaction. Adv Protein Chem Struct Biol 110, 31–63. [DOI] [PMC free article] [PubMed] [Google Scholar]
- (25).Lin W, Liu J, Jeffries C, Yang L, Lu Y, Lee RE, and Chen T (2014) Development of BODIPY FL vindoline as a novel and high-affinity pregnane X receptor fluorescent probe. Bioconjug Chem 25, 1664–1677. [DOI] [PMC free article] [PubMed] [Google Scholar]
- (26).Lin W, and Chen T (2013) A vinblastine fluorescent probe for pregnane X receptor in a time-resolved fluorescence resonance energy transfer assay. Anal Biochem 443, 252–260. [DOI] [PMC free article] [PubMed] [Google Scholar]
- (27).Powell CE, Du G, Che J, He Z, Donovan KA, Yue H, Wang ES, Nowak RP, Zhang T, Fischer ES, et al. (2020) Selective Degradation of GSPT1 by Cereblon Modulators Identified via a Focused Combinatorial Library. ACS Chem Biol. doi: 10.1021/acschembio.0c00520. [DOI] [PMC free article] [PubMed] [Google Scholar]
- (28).Lin W, Bwayi M, Wu J, Li Y, Chai SC, Huber AD, and Chen T (2020) CITCO Directly Binds to and Activates Human Pregnane X Receptor. Mol Pharmacol 97, 180–190. [DOI] [PMC free article] [PubMed] [Google Scholar]
Associated Data
This section collects any data citations, data availability statements, or supplementary materials included in this article.