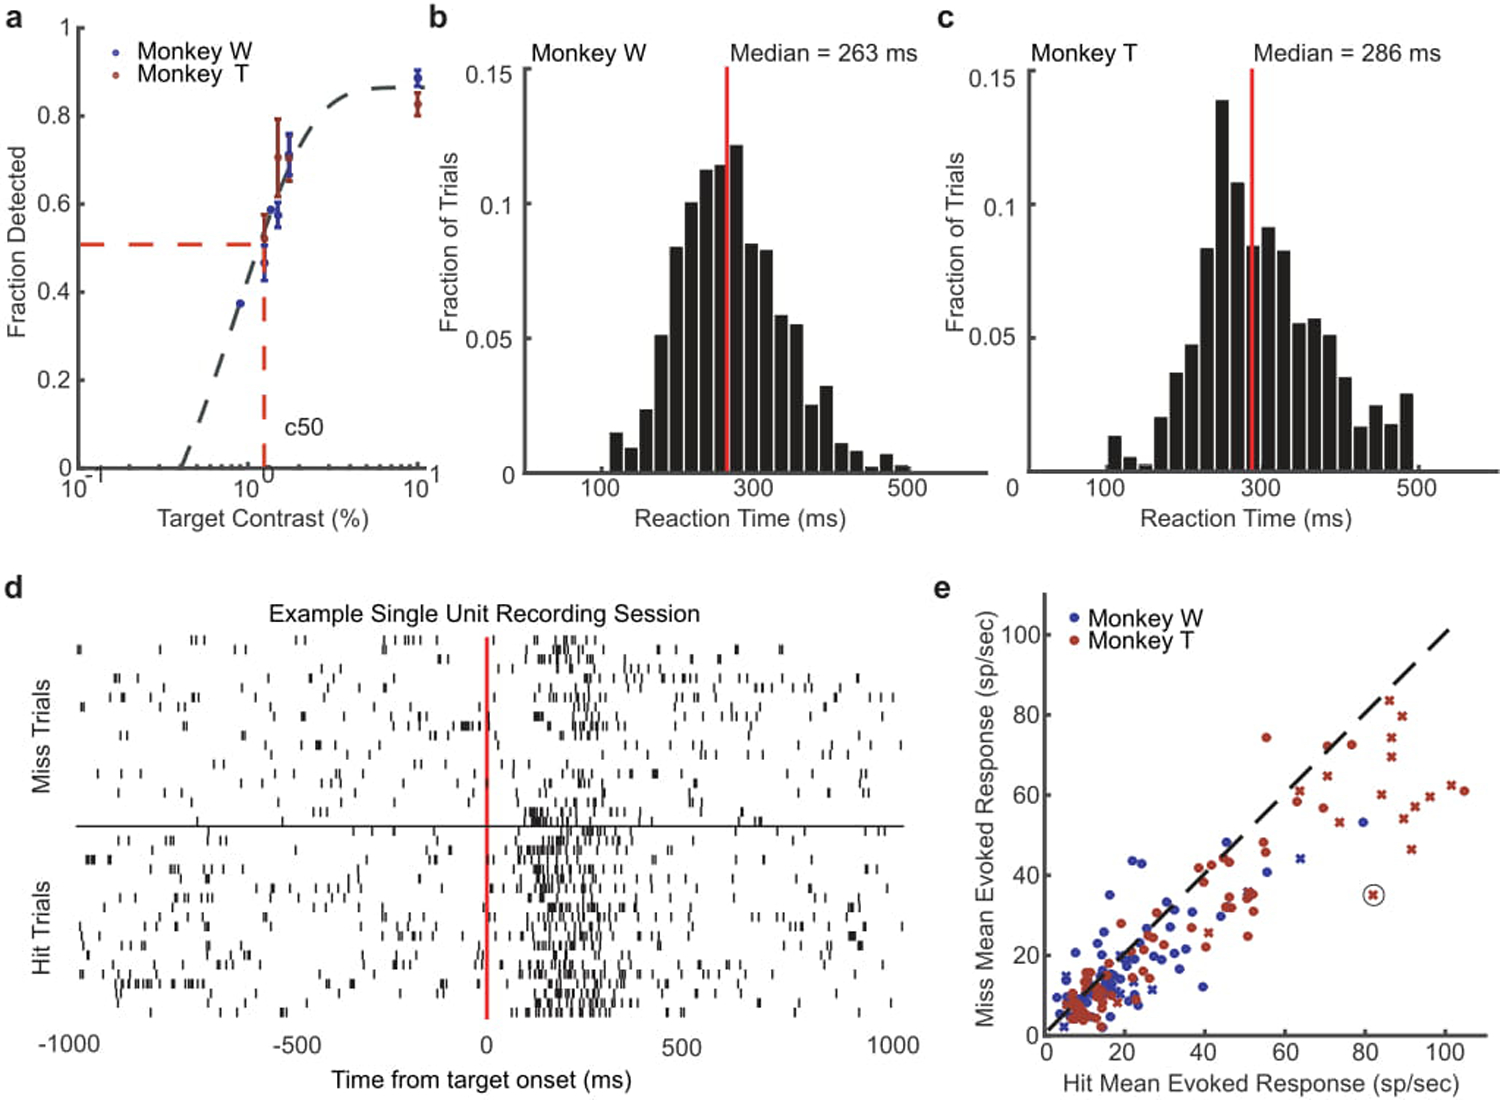
Extended Data 7. Target-evoked response magnitude is correlated with detection performance.

(a) Detection performance of different target contrasts for monkey W (blue) and monkey T (red) across training days where those contrasts were presented. Both monkeys had similar psychophysical thresholds, defined as the contrast where the monkey detected the target 50 percent of the time on average (c50) as estimated from a sigmoid fit (gray dashed line). (b, c) Distributions of reaction times for monkey W (b) and monkey T (c) during the detection task at their c50 value. The median reaction time for each monkey is shown by a red line. (d) Spike rasters for an example neuron with trials sorted into hits (bottom rasters) and misses (top rasters). (e) Scatter plot showing the distribution of mean hit (x-axis) and miss (y-axis) evoked responses (80–200 ms) for all single- (x) and multi-units (dot) recorded across all sessions for monkey W (blue) and monkey T (red). The circled x is the example neuron from panel d. Target-evoked responses were significantly stronger for detected targets in both monkeys. (monkey W, N = 25 single- and 83 multi-units, p < 0.01; monkey T, N = 27 single and 110 multi-units, p < 1 × 10⁻⁵; two-sided Wilcoxon signed-rank test).
