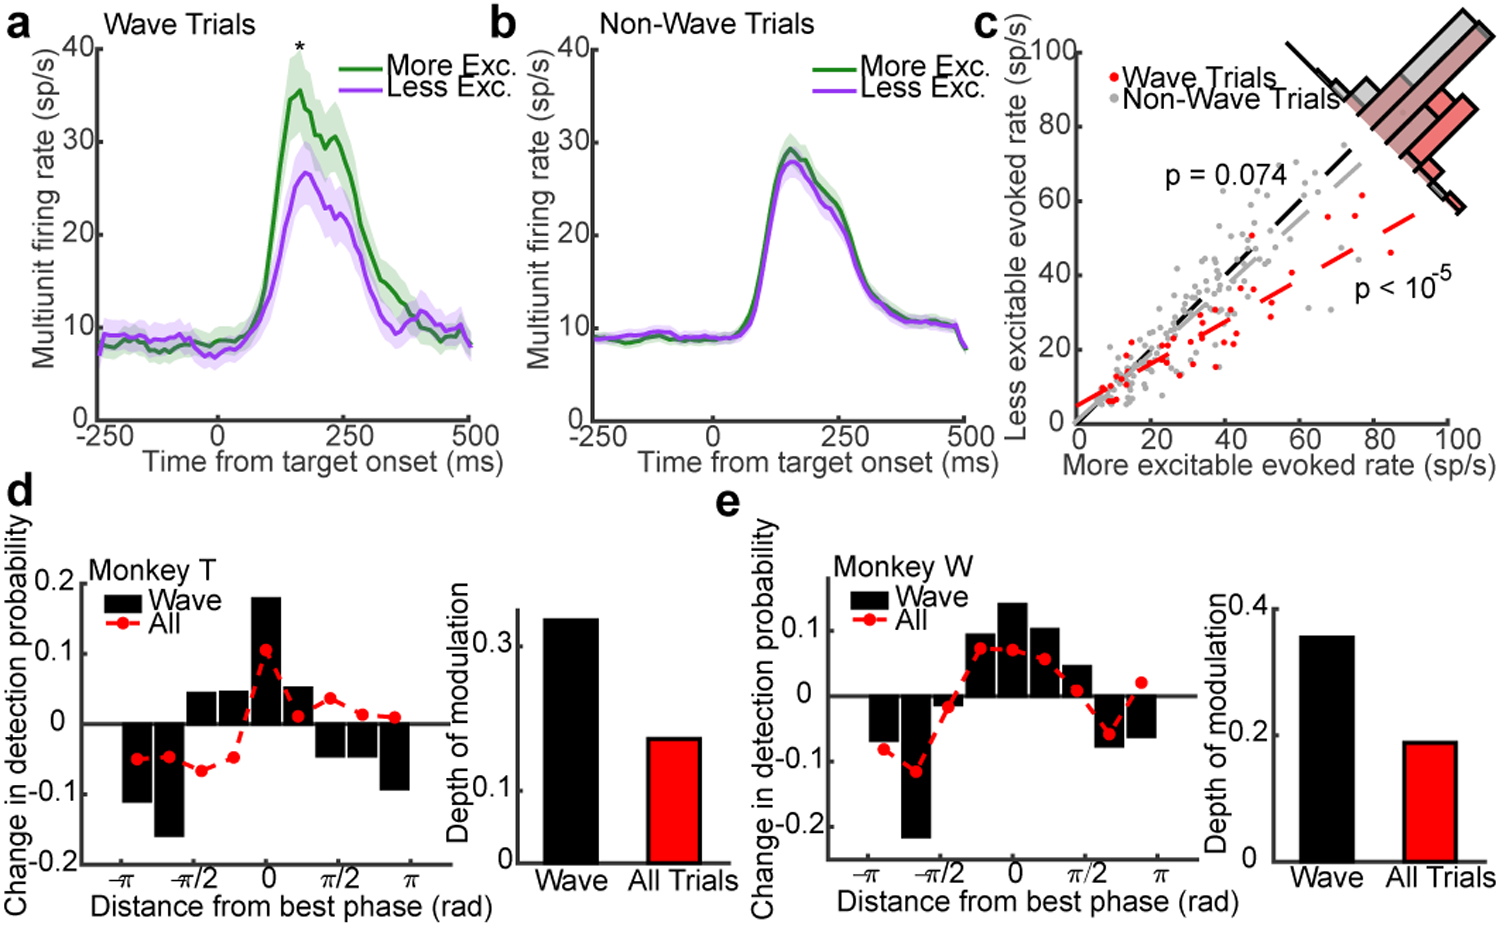
Fig. 4. Wave state predicts target-evoked response magnitude and perceptual sensitivity.

(a) Average target-evoked responses following wave alignment to the more excitable state (green line; N = 43 multi-units across both monkeys) are significantly greater than less excitable wave states (purple line; p < 10−5, two-sided Wilcoxon rank-sum test; shaded regions ± SEM). (b) The same analysis for non-wave fluctuations showed no difference. (N = 147 multi-units; p = 0.074). (c) Scatter plot of target-evoked responses across multi-units for trials in the more excitable (x-axis) or less excitable state (y-axis) at the time of PPA for wave (red dots; linear fit, red dashed line) or non-wave trials (gray dots; linear fit, gray dashed line). (d, e) Bar plots show the change in detection probability centered on the aligned phase at peak PPA in each monkey (rotated to 0 radians) for detected waves. Red dots show weaker phase-dependent changes in detection probability when all trials (wave, non-wave) are combined. The depth of modulation in detection probability given wave state is roughly double the depth for all trials (insets; monkey T, 33% to 17%, N = 464 wave and 494 non-wave trials; monkey W, 35% to 19%, N = 479 wave and 485 non-wave trials).
